
 Isabelle Turcotte1,2
- 1 École de Psychologie, Université Laval, Québec, QC, Canada
- 2 Laboratoire de Neurosciences Comportementales Humaines, Centre de Recherche Université Laval Robert-Giffard, Québec, QC, Canada
Cerebral asymmetry is used to describe the differences in electroencephalographic activity between regions of the brain. The objective of this study was to document frontal, central, and parietal asymmetry in psychophysiological (Psy-I) and paradoxical (Para-I) insomnia sufferers as well as good sleeper (GS) controls, and to compare their patterns of asymmetry to others already found in anxiety and depression. Additionally, asymmetry variations between nights were assessed. Participants were 17 Psy-I, 14 Para-I, and 19 GS (mean age = 40 years, SD = 9.4). They completed three nights of polysomnography (PSG) recordings following a clinical evaluation in a sleep laboratory. All sleep cycles of Nights 2 and 3 were retained for power spectral analysis. The absolute activity in frequency bands (0.00–125.00 Hz) was computed at multiple frontal, central, and parietal sites in rapid eye movement and non-rapid eye movement sleep to provide cerebral asymmetry measures. Mixed model ANOVAs were computed to assess differences between groups and nights. Correlations were performed with asymmetry and symptoms of depression and anxiety from self-reported questionnaires. Over the course of the two nights, Para-I tended to present hypoactivation of their left frontal region but hyperactivation of their right one compared with GS. As for Psy-I, they presented increased activation of their right parietal region compared with Para-I. Asymmetry at frontal, central, and parietal region differed between nights. On a more disrupted night of sleep, Psy-I had increased activity in their right parietal region while Para-I presented a decrease in cerebral activity in the right central region on their less disrupted night of sleep. Anxious and depressive symptoms did not correlate with asymmetry at any region. Therefore, Psy-I and Para-I present unique patterns of cerebral asymmetry that do not relate to depression or anxiety, and asymmetry varies between nights, maybe as a consequence of variability in objective sleep quality from night to night.
Introduction
Cerebral asymmetry is used as a means of describing distribution of electroencephalographic (EEG) activity measured on the scalp. It is defined as the difference in activation in specified frequency bands between two regions of the brain located usually in different hemispheres. This measure is based on the power spectral analysis (PSA), which establishes the frequency and proportion of the different rhythms of the EEG, as a way to compare cerebral activity between two recording sites. As sleep deepens, activation, neuronal activity, information processing, decrease, and higher proportion of the slower frequency bands is found. Hence, increase in fast frequency bands suggests more information processing and arousal. Increased activation in a region is the result of increased high frequency activity and/or decreased lower frequency activity. Homogeneous distribution of the proportion of the specific frequency band (symmetry) is reflected through low asymmetry scores whereas higher scores represent a greater discrepancy between the two hemispheres (asymmetry). While the first studies were aimed at identifying brain regions related to certain emotions or personality traits (Silberman and Weingartner, 1986; Harmon-Jones and Allen, 1998), more recently, clinical populations became the main interest in asymmetry studies. The stability over time of the cerebral asymmetry, its rapidity of measurement (usually 1 min of EEG recording), and the unique patterns of asymmetry found in clinical population accounted for the attention it received.
Mood and anxiety disorders are among pathologies investigated the most by way of cerebral asymmetry. In patients suffering from depression, remitted from depression, or presenting depressive symptoms, more alpha power was found in the right than left mid-frontal region, therefore a decreased left frontal activation was associated to the disorder (Henriques and Davidson, 1990, 1991; Gotlib et al., 1998). This unique pattern of activation is considered by many as the marker of a vulnerability to depression. Indeed, the left frontal deactivation has been found to correlate with Beck Depression Inventory scores (Beck et al., 1988b; Jacobs and Snyder, 1996). At posterior sites, higher activation was measured in the left parietal region compared with the right one (more alpha power) in depression sufferers (Henriques and Davidson, 1990). However, when depression and anxiety disorders coexist, higher activation is found in the right posterior region (Bruder et al., 1997; Metzger et al., 2004). These conclusions were all based on EEG recordings during wake. In sleep, asymmetry in depression is increased in rapid eye movement (REM) sleep compared with non-rapid eye movement (NREM) sleep and shows more beta, theta, and delta percentages in the right central region than the left one, again implying a deactivation of the left side (Armitage et al., 1993).
As psychopathologies are usually diagnosed by the report of symptoms by the patient, it is sometimes difficult for physicians and psychologists to define the problem. The use of techniques such as asymmetry could provide support for diagnosis purposes and the choice of appropriate treatment. However, many diagnoses have not yet been investigated by means of cerebral asymmetry. It appears important to examine other psychopathologies in order to confirm the uniqueness of asymmetry patterns already associated with some disorders or to relate them to other psychopathologies. Sleep disorders and, in particular, chronic primary insomnia, are amongst pathologies for which asymmetry has not yet been described. As a symptom, insomnia is a diagnosis criterion of depression, dysthymia, generalized anxiety, post-traumatic stress disorders, and other disorders [American Psychiatric Association (APA), 2000]. As a syndrome, insomnia can also coexist with depressive or anxious symptoms and other psychopathologies (Specchio et al., 2004). Considering the high comorbidity rates between insomnia and other disorders (prevalence rates ranging from 40 to 88% according to different studies) and that depressive and anxious symptoms are more often found in insomnia sufferers than controls (Bonnet and Arand, 1997; Weissman et al., 1997; Vgontzas and Kales, 1999; Hall et al., 2000; Perlis et al., 2001a), it is very plausible that insomnia sufferers would present similarities with depression and anxiety disorders on cerebral asymmetry measures. Since the cerebral asymmetry pattern associated with insomnia is still unknown, and previous studies assessing asymmetry in different psychopathologies have not controlled for insomnia, it remains unclear if it might contribute or relate to cerebral asymmetry found in other pathologies.
Primary insomnia is a mental disorder consisting of a complaint of difficulty falling asleep, maintaining sleep, or non-refreshing sleep causing distress or altering one’s functioning [Diagnosis of Statistical and Mental Health Disorders-IV-TR (DSM-IV-TR); APA, 2000] that is not attributable to another medical or mental disorder nor to substance use, and lasts at least a month. According to The International Classification of Diseases (ICD-10, World Health Organization, 1992) and the International Classification of Sleep Diseases (ICSD) (American Sleep Disorders Association, 1990), primary insomnia should last at least 6 months in order to be qualified as chronic. The ICD-10 (WHO, 1992) adds that sleep difficulties must be presented at least three times per week. ICSD sub-classifies the insomnia diagnosis according to the origin or presentation of sleep problems such as psychophysiological and paradoxical subtypes. Patients suffering from psychophysiological insomnia are assumed to be conditioned by sleep related stimuli of the environment (e.g., bedroom) or bedtime routine, which are then associated in the patient’s mind with the anxiety, fear, or frustration of having difficulties sleeping (Hauri and Fisher, 1986; Espie, 2002; Harvey, 2002). Consequently, their level of arousal is increased, preventing them from a good night sleep. As for paradoxical insomnia, it may be that a complaint of insomnia is formulated when polysomnography (PSG) recordings correspond to the normative data for the age group, or else, that a significant difference exists between PSG data and their subjective estimations [e.g., sleep length, sleep-onset latency (SOL), sleep efficiency (SE); Edinger et al., 2004].
Insomnia has been explained and described by several models positing either cognitive arousal (Harvey, 2002), inhibition of deactivation processes (Espie, 2002), or cortical arousal (Perlis et al., 1997). Indeed, physiological, cognitive, and emotional measures have supported the hyperarousal models during wake and sleep (Monroe, 1967; Freedman and Slattler, 1982; Freedman, 1986; Morin et al., 1993; Bonnet and Arand, 1995; Mitchell, 1997; Harvey, 2000; Wicklow and Espie, 2000). Some authors have also reported that hyperarousal is reflected in the macrostructure of sleep (Frankel et al., 1976; Gaillard, 1976; Merica et al., 1998). As for the microstructure of sleep of insomnia sufferers, a higher proportion of faster frequency waves (usually beta) in the EEG spectrum is observed (Perlis et al., 1997). In addition, some reports suggest that psychophysiological and paradoxical insomnia subtypes present differences in cortical activation. For example, in NREM sleep, Para-I present higher absolute spectral amplitude of the 12.5- to 30-Hz waves compared with Psy-I and good sleeper (GS) controls (Krystal et al., 2002).
Since previous PSA studies most often documented cortical activity only at the C3 site, the repartition of higher activation in insomnia is poorly documented. In that regards, we have shown that differences between GS and insomnia subtypes do not reside only at central sites (St-Jean and Bastien, 2007; St-Jean et al., in preparation). Mostly in NREM, more absolute delta activity at F3, C3, and P3 was observed in Para-I compared with Psy-I suggesting a deactivation of the left hemisphere in Para-I and/or hyperactivation in Psy-I. At P3 especially, Para-I had a peculiar pattern of activation: in addition to higher activity in the delta band, they also presented more gamma activity than GS and Psy-I, therefore combining higher activity in slower and faster frequency bands. Moreover, our group found between nights variability in absolute powers in faster frequency bands (beta to omega): the high frequency activity at F3, F4, and C4 specifically revealed to be less stable over the two nights of recording (St-Jean and Bastien, 2007). Observing differences between groups and nights at precise electrode sites suggests an uneven distribution of EEG activity in many frequency bands across hemispheres and regions. By targeting regions where cortical arousal associated with insomnia is usually present, and by using cerebral asymmetry (thus measuring differential cortical activity between sites), we should be able to improve our understanding of hyperarousal in insomnia. In addition, documenting asymmetry in insomnia might shed some light on the relative contribution of this disorder to other pathologies for which insomnia is a symptom (such as anxiety and depression). Moreover, considering that sleep difficulties in insomnia may vary from night to night (Vallières et al., 2005, 2011) and that our group found fluctuations in PSA across nights as well, it appears important to assess the variability of cerebral asymmetry in insomnia over nights.
The aim of this study is to evaluate cerebral asymmetry in order to describe the relative regional cerebral activation and locate activation specificities in psychophysiological and paradoxical subtypes of chronic insomnia compared with a sample of GS controls. It is hypothesized that (a) both groups of insomnia sufferers will present greater asymmetry in frontal and parietal sites compared with GS and that Para-I will present greater asymmetry than Psy-I as predicted by the level of depressive and anxious symptoms usually found in those population; (b) the measured asymmetry will correlate with the level of depressive and anxious symptoms determined by BDI and Beck Anxiety Inventory (BAI) scores; (c) and that asymmetry scores will be stable from night to night as they relate to a condition (diagnosis and frequently associated symptoms).
Materials and Methods
Participants
Volunteers from 25 to 55 years of age were recruited through local newspaper advertisements. On the basis of the three group criteria, 26 Psy-I (14 females, 12 males), 20 Para-I (14 females, 6 males), and 21 GS (12 females, 9 males) participated in this study. Participants had a mean age of 40.21 (9.38) years.
Control group
Good sleeper must have shown, on the 2-week sleep diary (SD) completed before laboratory nights, less than three nights with sleep difficulties (i.e., SOL or awakenings of more than 30 min or a total sleep time “TST” of less than 6.5 h) per week, as well as a SE of 85% or more, and a mean TST between 6.5 and 8.5 h per night. On the Index of Severity of Insomnia (ISI; Morin, 1993), GS had to report no sleep difficulty and no complaint of daytime difficulty related to sleep and a score less than 8. During laboratory nights, participants who obtained an objective SE of less than 85% on Nights 2 and 3 were discarded from the study.
Insomnia group
Insomnia participants had to report at least three nights per week of sleep difficulty (i.e., SOL or awakenings of more than 30 min or a TST of less than 6.5 h) as well as SE of less than 85% in 2 weeks of completed sleep diaries. Moreover, they had to report at least one moderate negative daytime consequence attributed to the loss of sleep and a score higher than 15 on the ISI. The difficulties lasted more than 6 months and were not secondary to another medical, psychological, or sleep disorder or to medication.
Sub-classification of insomnia: psychophysiological or paradoxical
After comparing Para-I classifications in recent studies, criteria suggested by (Edinger et al., 2004) were operationalized. In order to be classified as a Para-I participant, insomnia sufferers had to show on two consecutive PSG recording nights: (a) a TST of more than 380 min or a SE of at least 80%, as well as (b) an overestimation ≥60 min of their SOL, an underestimation ≥60 min of their TST or ≥15% difference in their SE on the basis of PSG recordings and laboratory sleep diaries. The above criteria were preferred over published minimal 390 min TST and 85% SE (Edinger et al., 2004) since several participants presented a TST between 380 and 390 min and SE between 80 and 85%, i.e., near the thresholds. The Psy-I group included participants with (a) a TST under 380 min or a SE lower than 80%, as well as (b) an overestimation ≤60 min of their SOL, an underestimation ≤60 min of their TST or ≤15% difference in their SE on the basis of PSG recordings and laboratory sleep diaries. Fourteen PI participants were excluded because of the presentation of important discrepancies between objective and subjective sleep estimation (meeting criteria b) while objective sleep difficulties were also observed (not reaching criteria a). Therefore they corresponded to neither insomnia sub-group.
Exclusion criteria
Participants were excluded if they suffered from another: (a) Axis I disorder (e.g., depression, anxiety disorder); (b) insomnia subtype (e.g., idiopathic insomnia); (c) sleep disorder such as sleep apnea (apnea–hypopnea index >15) or restless leg syndrome (myoclonic index with arousal >15); or (d) a medical disorder affecting sleep or causing pain (such as diabetes, arthritis, restless leg syndrome). In addition, the use of: (a) prescribed or over the counter sleep aids (in the insomnia group, a 2-week withdrawal was necessary before completing any questionnaire); (b) medication affecting sleep (e.g., beta-bloquant, anxiolytics); or (c) alcohol to promote sleep excluded the participant. Individuals undergoing psychological treatment as well as those who usually went to sleep later than midnight or awoke before 5:00 am were also excluded since the laboratory schedule could not accommodate these latter ones. Furthermore, only right handed participants were selected in this study in order to provide homogeneous profiles of cerebral activity within groups.
Research Protocol
All participants were recruited through newspaper advertisements. Following a telephone interview, eligible participants were mailed questionnaires aimed at evaluating the presence of psychological symptoms (BDI, Beck et al., 1988b; BAI, Beck et al., 1988a), sleep (2-week of daily sleep diaries) as well as severity of sleep disturbances (ISI). Upon receipt of questionnaires, prospective participants were invited for a clinical interview at the research center. Upon arrival, informed consent was obtained. The Structured Clinical Interview for DSM-IV (SCID-I; Williams et al., 1992) and the insomnia diagnostic interview (IDI; Morin, 1993) were then administered. These evaluations were conducted respectively by a clinical psychologist and a sleep specialist. After the clinical evaluation, included participants were further invited to undergo four consecutive nights of PSG recordings at the sleep laboratory. Each participant received an honorarium for his or her participation in the study. Participants were instructed to arrive at the sleep laboratory at around 8:00 pm each night for electrode montage and preparation. Participants were asked to refrain from alcohol, drugs, excessive caffeine, and nicotine before coming to the laboratory. Participants were asked to stay in bed between 7 and 9 h during PSG recordings for all nights. Bedtime was fixed between 21:00 and 00:00, and wake time was fixed between 05:00 and 08:00. Their usual sleeping schedule was accommodated as best as possible (±30 min). For all participants, lights-out was initiated after a bio-calibration. The complete protocol was approved by the Comité d’éthique de la recherche du Centre de recherche Université Laval Robert-Giffard.
A standard PSG montage was used, including EEG (including F3, F4, Fz, C3, C4, Cz, P3, P4, Pz, O1, and O2), electromyographic (EMG; chin), and electro-oculographic (EOG; left and right: supra-orbital ridge of one eye and the infra-orbital ridge of the other) recordings. Electrodes were referred to linked mastoids with a forehead ground and interelectrode impedance was maintained below 5 kΩ. In addition, respiration and tibialis EMG were monitored during the first night of PSG recording in order to rule out sleep apnea and periodic limb movements. Participants diagnosed with another sleep disorder were excluded and referred to an appropriate sleep specialist. A Grass Model 15A54 amplifier system (Astro-Med Inc., West Warwick, USA; gain 10000; bandpass 0.3–100 Hz) was used. While PSG signals were digitized at a sampling rate of 512 Hz using commercial software product (Harmonie, Stellate System, Montreal, Canada). Sleep recordings were scored visually (Luna, Stellate System, Montreal, Canada) by qualified technicians according to standard criteria (Rechtschaffen and Kales, 1968) using 20-s epochs and reliability checks were conducted by an independent scorer to insure a minimum of 85% inter-scorer agreement. Even if sleep scoring was done before the publication of the most recent guidelines (Iber et al., 2007), we chose to keep the original scoring since this one is more appropriate when research uses quantitative analyses of the EEG or finer techniques of EEG analyses (e.g., event-related potentials; ERPs). In addition of being the screening night for sleep disorders other than insomnia, Night 1 constituted an adaptation night. ERPs protocols (presentation of auditory sounds, tone-pips) were introduced before sleep and after the last awakening (end of the night) of Night 3, repeated on Night 4 as well as being presented at sleep-onset and all night on Night 4. Consequently, clinical sleep data reported here were derived from Nights 2 and 3 only.
Power spectral analysis
Power spectral analysis was conducted at multiple EEG sites (F3, F4, Fz, C3, C4, Cz, P3, P4, Pz) by computing fast Fourier transforms (FFT). EMG artifacts were detected automatically and rejected from the spectral analyses (Brunner et al., 1996). Further artifacts were eliminated by visual detection. Manual selection of portions of the nights for PSA included parts of each sleep stage (1–4 and REM) of each sleep cycle, excluding mini-arousals (0.1–7 s), micro-arousals (7.1–14.9 s), and arousals (15 s and longer), movement time, movements, or artifacts, as well as the 5-min before and after a stage shift. However, in a cycle, if no uninterrupted period of a specific sleep stage longer than 10 min was available for selection in a cycle, a portion of this sleep stage was still selected although excluding the first and last 40 s.
Power spectral analysis was computed on consecutive 4 s epoch, with a resolution of 0.25 Hz, and EEG segment length of 20 s. Frequencies were defined as follows: slow waves (0–1 Hz), delta (1–4 Hz), theta (4–7 Hz), alpha (7–11 Hz), sigma (11–14 Hz), beta1 (14–20 Hz), beta2 (20–35 Hz), gamma (35–60 Hz), and omega (60–125 Hz). Absolute power spectral values of REM and NREM sleep were log transformed to normalize the distributions. Asymmetry measures were computed at frontal, central, and parietal sites of these cerebral lobes by subtracting powers in the left hemisphere from powers in the right one for each frequency band and pairs of electrodes (Central: C3–C4; Frontal: F3–F4; and Parietal: P3–P4).
Questionnaires and Interviews
Sleep diary
The SD (Morin, 1993) is a daily journal used to assess subjective sleep quality. The various sleep–wake parameters derived for this study were sleep-onset latency (SOL), referred to as the amount of time from initial lights-out to sleep-onset (defined as the first minute of consolidated stage 2 sleep); wake after sleep-onset (WASO), defined as the amount of time awake from sleep-onset until the last awakening; early morning awakening (EMA), referred to as the amount of time awake from the last awakening to arising time; frequency of awakenings (FNA), defined as total number of awakenings during the night; total wake time (TWT), obtained by summing SOL, WASO, and EMA; TST, referred to as the subtraction of TWT from the amount of time in bed (TIB); and finally, SE, defined as the ratio of TST divided by TIB, expressed as a percentage. The SD is usually completed upon arising each morning for a 2-week baseline period in order to provide a stable index of sleep complaints (Lacks and Morin, 1992). In addition, our participants completed the SD each morning upon awakening in the sleep laboratory. A mean was calculated for each of the derived variables.
Insomnia severity index
The ISI (Morin, 1993) is a reliable and valid brief self-report instrument that yields a quantitative index of perceived insomnia severity (Bastien et al., 2001). The ISI comprises seven items targeting the severity of sleep disturbances, the satisfaction relative to sleep, the degree of impairment of daytime functioning caused by the sleep disturbances, the noticeability of impairment attributed to the sleep problem as well as the degree of distress and concern related to the sleep problem. Each item is rated on a five-point Likert scale and the total score ranges from 0 to 28. A higher score reveals more severe insomnia. The ISI partly reflects the diagnostic criteria outlined in the DSM-IV (APA, 2000).
Insomnia diagnosis interview (Morin, 1993)
The IDI is conducted in a semi-structured format and assesses the presence of insomnia and potential contributing factors. It is designed to identify (a) the nature of the complaint, (b) the sleep–wake schedule, (c) insomnia severity, (d) daytime consequences, (e) the natural history of insomnia, (f) environmental factors, (g) medication use, (h) sleep hygiene factors, (i) the presence of other sleep disorders, (j) the patient’s medical history and general health status, and (k) a functional analysis for antecedents, consequences, precipitating, and perpetuating factors.
Structured clinical interview for DSM-IV (Williams et al., 1992)
This structured interview is constructed to identify Axis 1 disorders according to DSM-IV criteria. It consists in five modules: mood episodes, psychotic and associated symptoms, psychotic disorders, mood disorders, substance use disorders, anxiety disorders, somatoform disorders, eating disorders, and adjustment disorders.
Statistical Analyses
One-way ANOVAs and chi-square were computed to compare groups on socio-demographic, psychological, and sleep characteristics. Then, mixed model ANOVAs, including four fixed factors [group, three levels (GS, Psy-I, and Para-I); night, two levels; sleep cycle, six levels; and sleep stage, two levels (REM and NREM)] and one dependant variable (asymmetry) were performed for each cerebral region (frontal, central, and parietal) and frequency band individually. Significance levels were set at 0.05. Because of the exploratory nature of the study, the considerably large number of analyses, and consequently lower statistical power, applying a conservative correction for type 1 error was not possible. However, interpretation of the results were limited to the hypotheses, i.e., groups and nights effects and their interactions. As the main hypotheses refer to differences between groups, Tukey post hoc tests were performed only on significant main effects of group and first order interactions including this factor. A Bonferroni correction was applied when needed.
Results
Statistical analyses showed that GS, Psy-I, and Para-I were similar according to gender, χ2(2, n = 67) = 1.31, p = 0.52, and age, F(2, 64) = 0.48, p = 0.62. As expected, Psy-I and Para-I, compared to GS, had higher scores on the severity index of the ISI, F(2, 61) = 65.14, p < 0.001, this higher score being indicative of greater severity of insomnia symptoms. Also, both groups of insomnia sufferers expressed more depressive and anxious symptoms than GS as reported on the BDI, F(2, 62) = 8.40, p < 0.01, and BAI, F(2, 59) = 8.69, p < 0.001. Nonetheless, all participants remained under the clinical threshold for psychiatric syndrome. Table 1 presents means and SDs for each of the above variables.
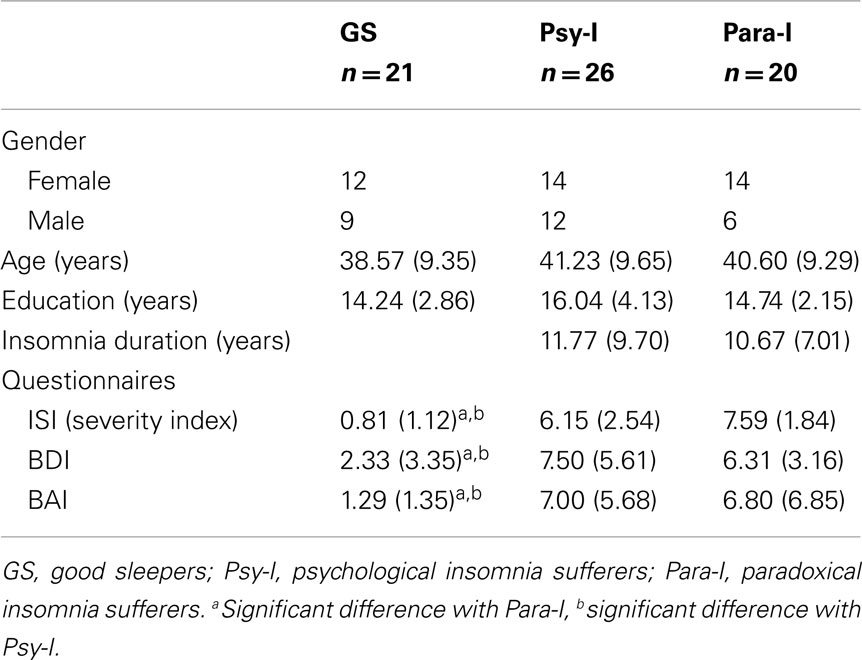
Table 1. Means (SD) of socio-demographic data of good sleepers, psychophysiological insomnia sufferers, and paradoxical insomnia sufferers.
Subjective Sleep Measures
Table 2 shows mean objective and subjective sleep measures for laboratory Nights 2 and 3. By a significant group effect, F(2, 62) = 15.45, p < 0.001, and Tukey post hoc tests, analyses revealed that GS, Psy-I, and Para-I reported different subjective SOL (all ps ≤ 0.05), with GS reporting the shortest and Para-I the longest. GS reported shorter WASO, F(2, 61) = 23.70, p < 0.001, compared with both groups of insomnia and Para-I reported longer WASO than Psy-I (all ps ≤ 0.01). Subjective TST was different between all three groups, F(2, 62) = 31.46, p < 0.001, with GS presenting the longest and Para-I the shortest (all ps ≤ 0.03). Again, all three groups were different as for the SE computed with subjective measures of sleep, F(2, 62) = 42.36, p < 0.001: Para-I had the lowest and GS the highest percentage of SE (all ps ≤ 0.01). No significant night effects or Group × Night interaction were found suggesting similar subjective estimates of sleep on Night 2 compared with Nigh 3 within groups.
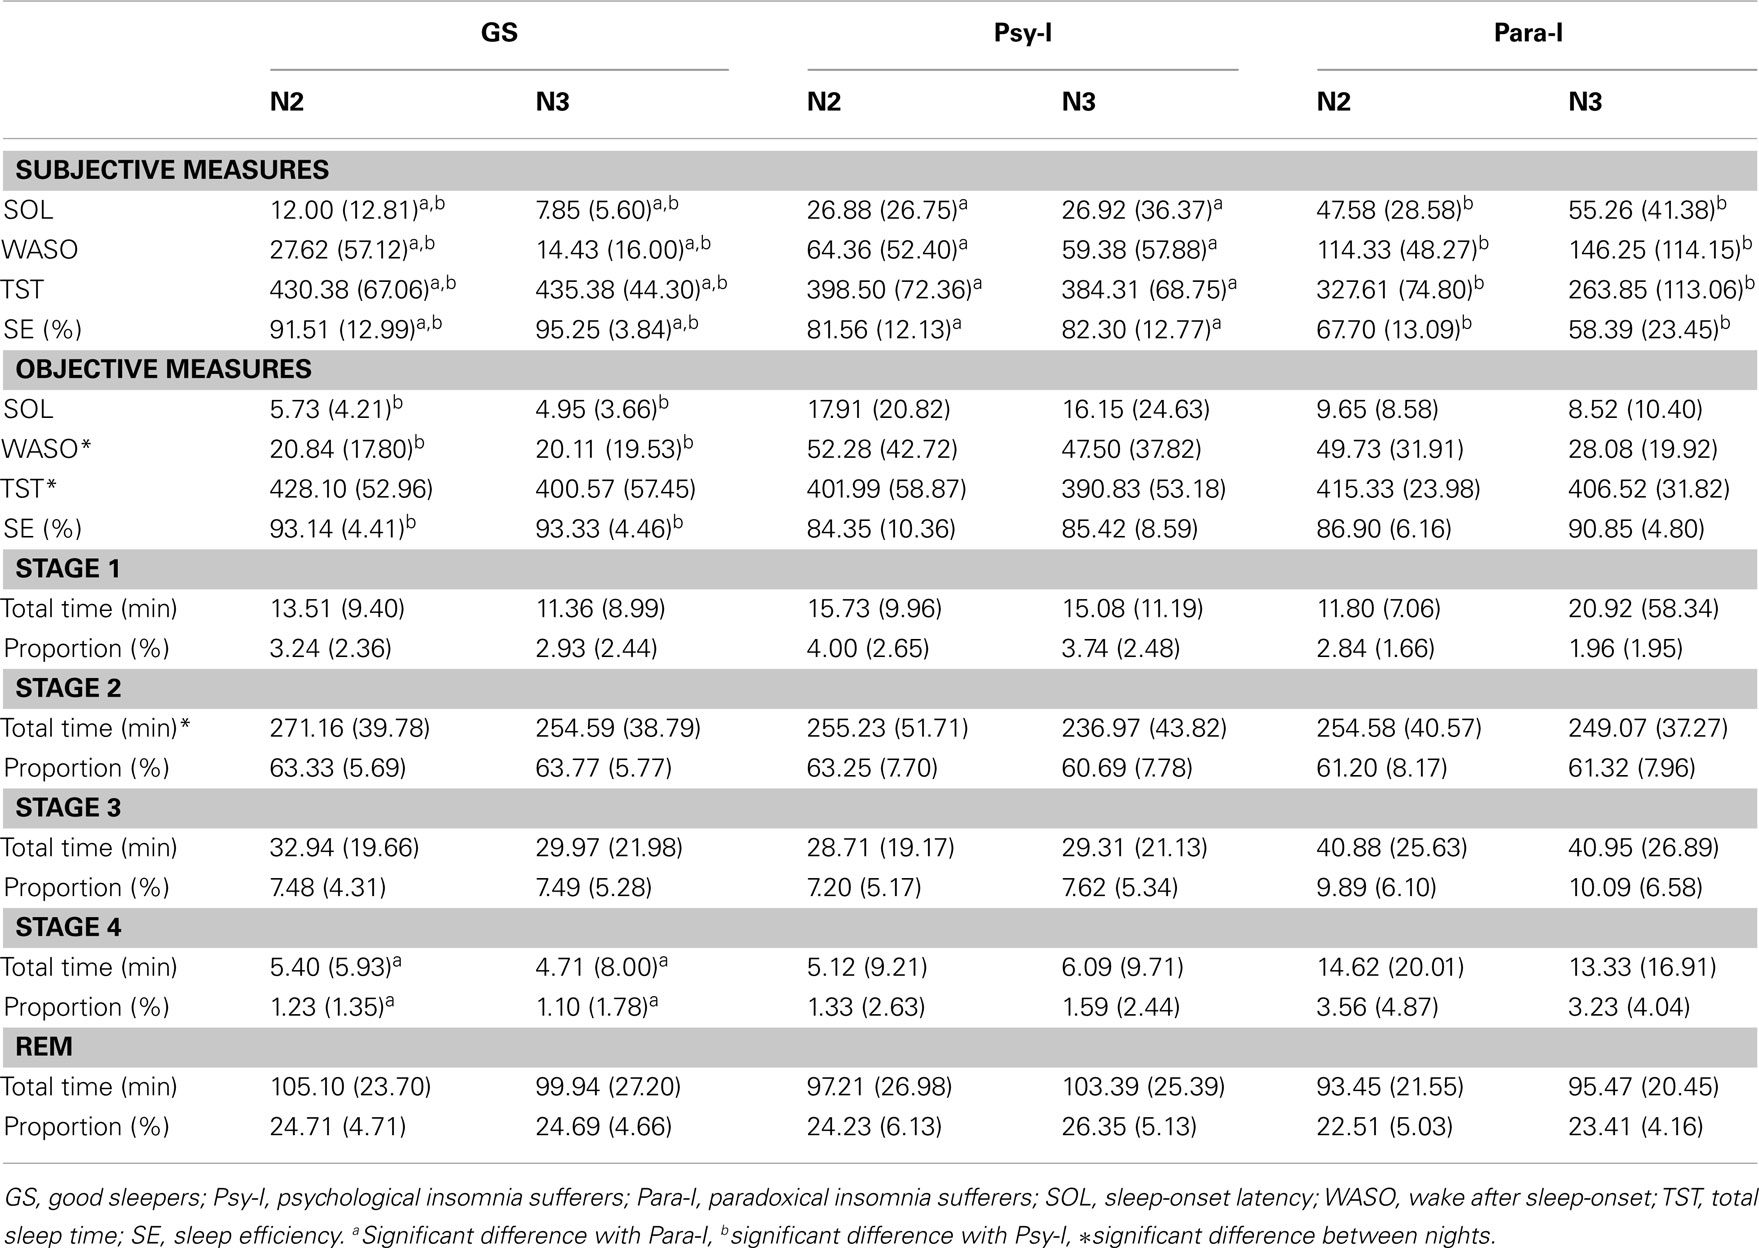
Table 2. Means (SD) of laboratory objective and subjective sleep parameters of good sleepers, psychophysiological insomnia sufferers, and paradoxical insomnia sufferers.
Objective Sleep Measures
On objective measures (PSG), a significant group effect, F(2, 64) = 4.54, p = 0.01, and post hoc indicated that Psy-I presented significantly longer SOL than GS (p = 0.01). A significant night effect revealed that WASO was longer on Night 2 than Night 3, F(1, 64) = 4.74, p = 0.03, and a significant group effect, F(2, 64) = 131.12, p = 0.001, showed that GS had shorter WASO than Psy-I (p = 0.01). TST was longer on Night 2 than Night 3 according to the significant Night effect, F(1, 64) = 4.99, p = 0.03. However, all three groups were similar according to TST. As for SE measures, only a significant group effect was found, F(2, 64) = 11.82, p < 0.01, suggesting that Psy-I had lower SE compared with GS (p ≤ 0.001). Differences in SE between GS and Para-I and between Psy-I and Para-I did not reach significance (p = 0.05 and p = 0.06, respectively). As for the time spent in each sleep stage (minutes) and its proportion (%), there were no differences between nights or group as for stage 1, stage 3, and REM sleep. The time spent in stage 2 was longer on Night 2 than Night 3, as revealed by a significant night effect, F(1, 64) = 6.45, p = 0.01. Significant group effects indicated that the time, F(2, 64) = 3.79, p = 0.03, and proportion of stage 4, F(2, 64) = 3.66, p = 0.03, differed between groups: GS had less time and proportion of their nights spent in stage 4 compared to Para-I (p < 0.05). However, Psy-I also tended to present less time and proportion of stage 4 compared to Para-I although these results did not reach significance (p = 0.05 and p = 0.07, respectively).
Asymmetry Measures
The mean cerebral asymmetry of each group of participants for each cerebral region and frequency band can be found in Table 3. Table 4 provides asymmetry scores for Night 2 and 3 independently. Positive asymmetry measures indicate higher activity (power) in the right hemisphere than in the left one for the specified frequency band; negative measures suggest higher activity in the left one. A score of zero suggest perfect symmetry. Lower asymmetry scores reflect a more even distribution of the proportion of the specific frequency band whereas higher asymmetry scores represent a greater discrepancy between the two hemispheres. Therefore, asymmetry scores reflect the degree of asymmetry, regardless of the hemisphere of origin (i.e., a decrease of power in one hemisphere or an increase in the other). Results from mixed model ANOVAs performed on asymmetry measures are presented in Table 5. As the hypotheses referred to differences between groups and nights, only main effects of group and night as well as significant interaction including these factors are presented. Significant differences between groups or nights in asymmetry must be interpreted with caution. As such, a descriptive explanation follows each significant result.
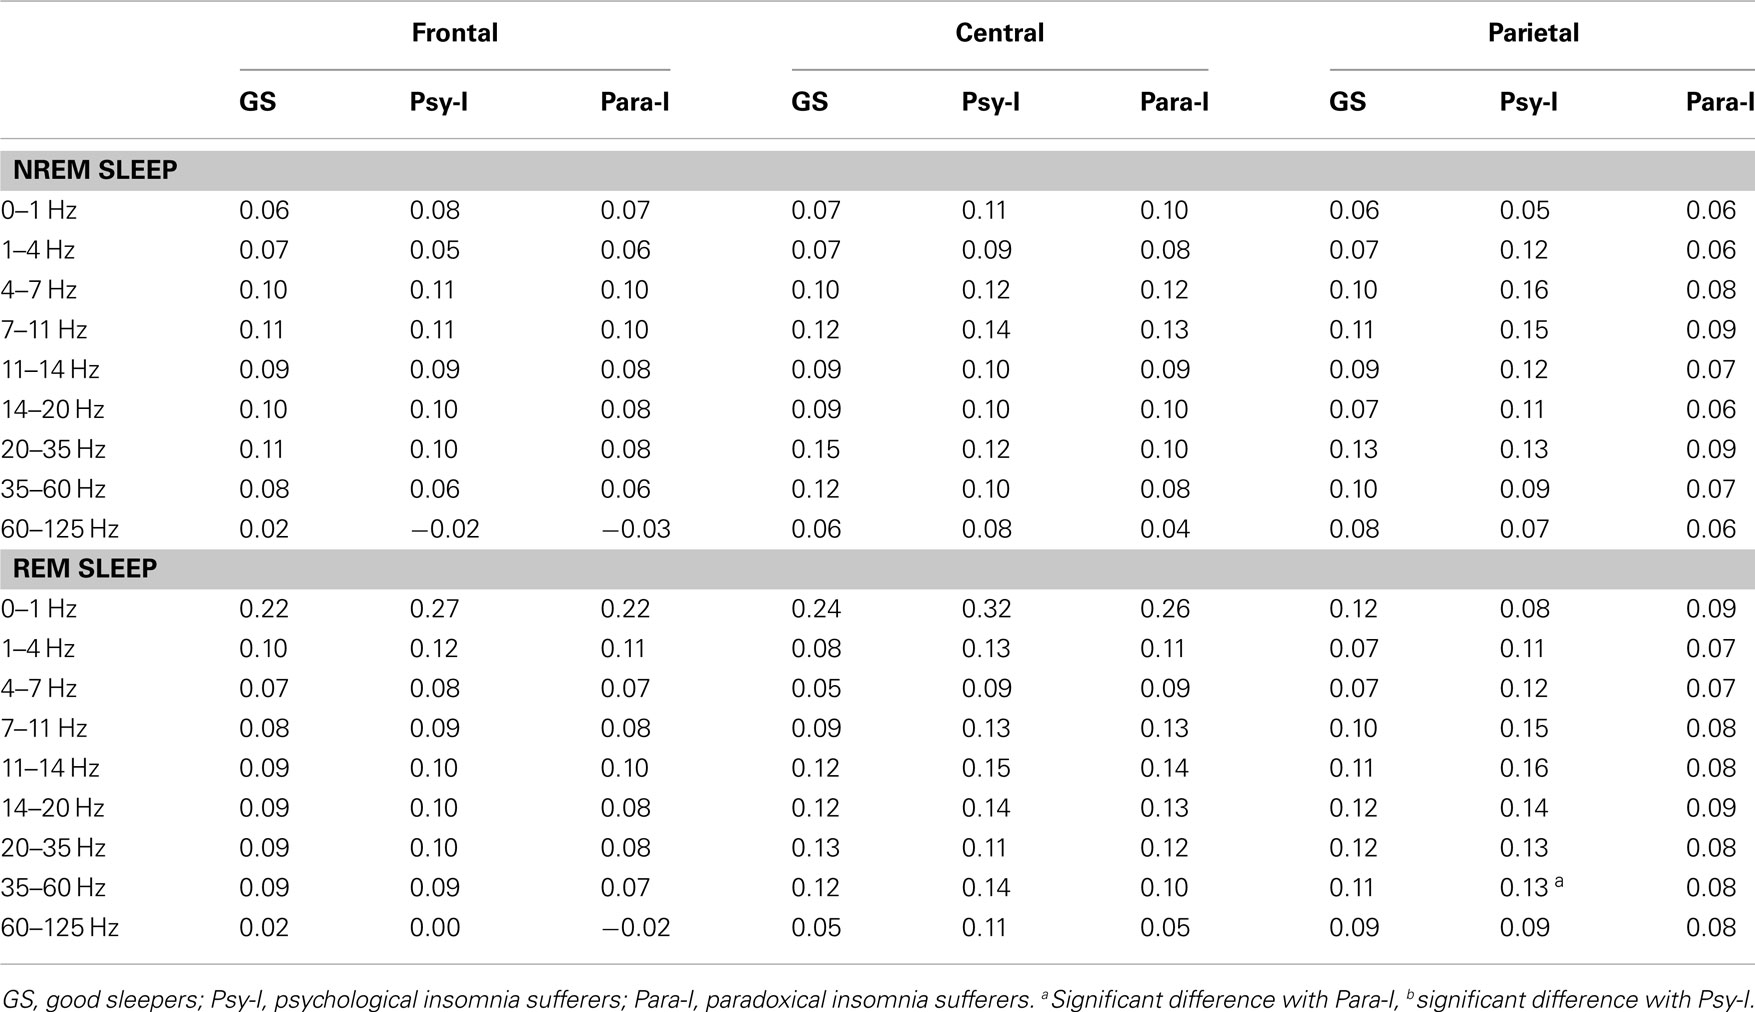
Table 3. Mean frontal, central, and parietal asymmetry of good sleepers, psychophysiological, and paradoxical insomnia sufferers in NREM and REM for each frequency band.
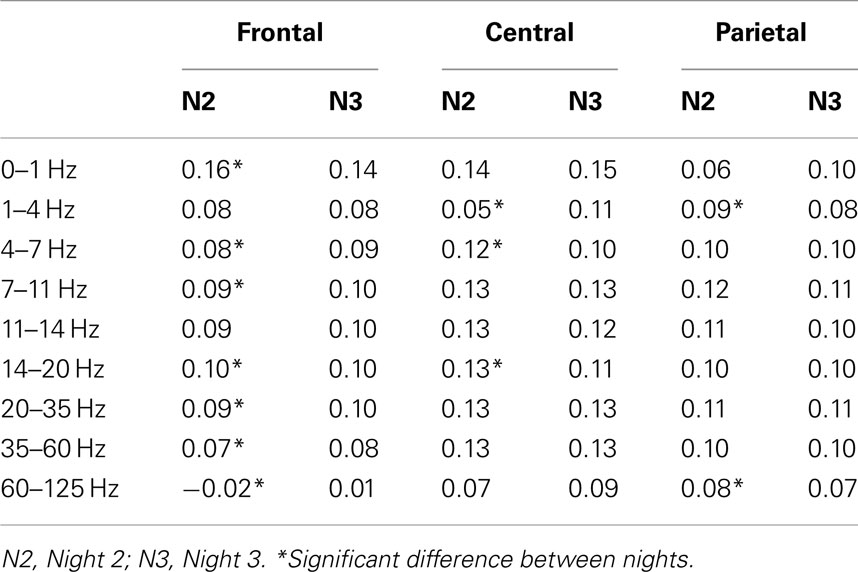
Table 4. Asymmetry scores of Nights 2 and 3 in frontal, central, and parietal regions.
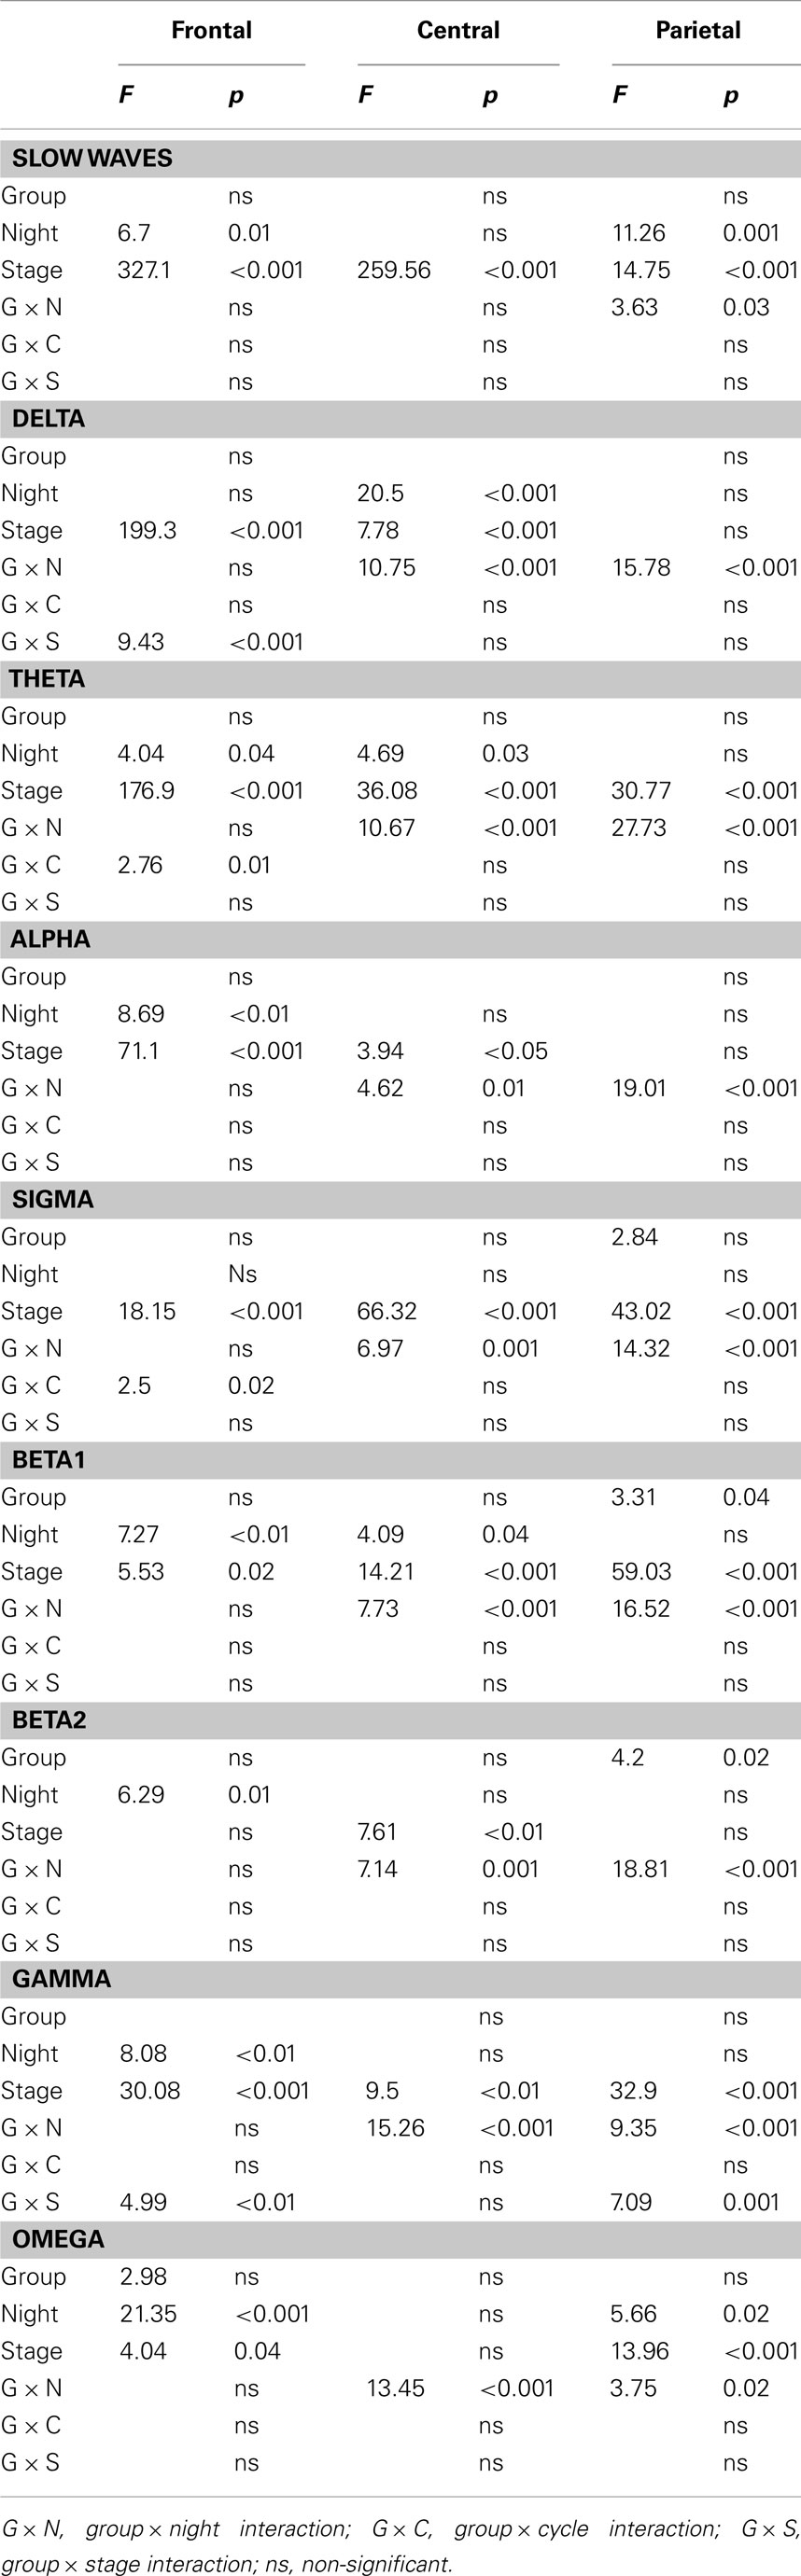
Table 5. Results of the mixed model ANOVAs performed on frontal, central, and parietal asymmetry measures.
Frontal region
One group effect was marginally significant (p = 0.058) suggesting that higher frontal asymmetry in the omega band is found in GS compared with Para-I, omega activity being predominant in the right hemisphere of GS and left hemisphere of Para-I. At all other frequency bands, the three groups had similar frontal asymmetry over the course of the two nights, as can be depicted in Figure 1. Significant night effects were found in slow waves (0–1 Hz): higher asymmetry was measured on Night 2 than on Night 3 in all groups. On the other hand, higher asymmetry was found on Night 3 than Night 2 for theta, alpha, beta1, beta2, omega, and gamma activity. However, activity in frequency bands from slow waves to gamma of both nights was higher in the right hemisphere. Only gamma activity preponderance changed from left to right regions from Night 2 to Night 3. No significant interaction including the Group factor could uncover differences between GS, Psy-I, and Para-I.
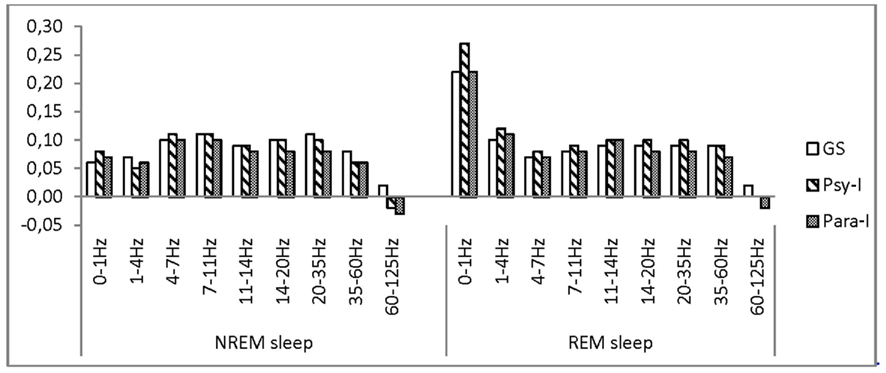
Figure 1. Asymmetry scores of good sleepers, psychophysiological, and paradoxical insomnia sufferers at the frontal region in various frequency bands.
Central region
No significant group effect was found for any of the frequency bands (see Figure 2). Significant night effects in the delta band showed higher asymmetry on Night 3 than Night 2 whereas the opposite result was found in the theta and beta1 frequency bands. Still, in all frequency bands, powers were higher in the right hemisphere. In the delta band, a Group × Night significant interaction was observed: higher asymmetry was found on Night 2 in Psy-I than Para-I (p = 0.04). Psy-I presented more delta activity in their right hemisphere whereas Para-I presented more in their left hemisphere. In the beta2 band, higher asymmetry was found in GS than Para-I (p = 0.04) on Night 3 even if both groups presented more beta2 activity in their right hemisphere.
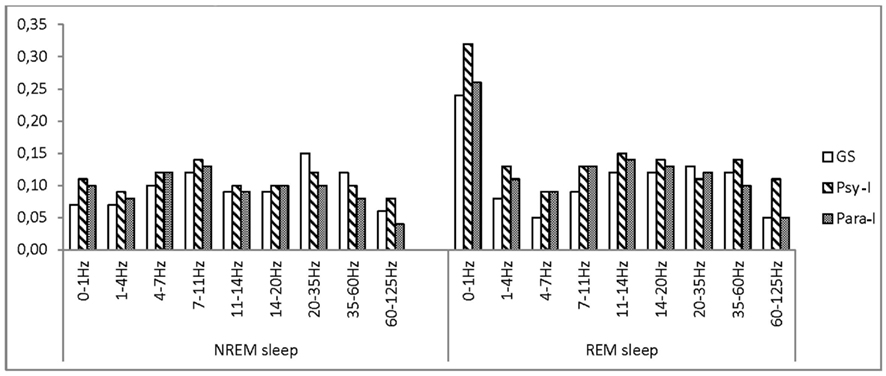
Figure 2. Asymmetry scores of good sleepers, psychophysiological, and paradoxical insomnia sufferers at the central region in various frequency bands.
Parietal region
Figure 3 presents asymmetry scores of GS, Psy-I, and Para-I as measured in the parietal region and in various frequency bands. Significant group effects in the beta1 and beta2 bands showed that Psy-I had higher asymmetry than Para-I (p = 0.04 and p = 0.02, respectively), still both groups presented higher beta activity in the right hemisphere. In the slow wave band, higher asymmetry was found on Night 3 than on Night 2, and conversely, higher asymmetry on Night 2 than on Night 3 was found in the omega band as indicated by significant effects of night. Significant Group × Night interactions in frequency bands from delta to beta1 indicated that, on Night 2, higher asymmetry was found in Psy-I than GS (all ps ≤ 0.03), both groups presenting higher right sided activity. Moreover, on Night 2, from delta to beta2 bands, higher asymmetry was found in Psy-I than Para-I (all ps ≤ 0.04), both groups of insomnia individuals showing increased activity in the right hemisphere compared with the left one. In the gamma band only, higher asymmetry was found on Night 3 in GS compared with Para-I (p = 0.03) suggesting higher gamma activity in GS’s right hemisphere than Para-I. Finally, a Group × Stage interaction reached significance in the gamma band revealing higher asymmetry in Psy-I than Para-I in REM (p = 0.01), again the right hemisphere presented higher gamma activity than the left one in both groups of insomnia individuals (0.13 and 0.08, respectively).
Figure 3. Asymmetry scores of good sleepers, psychophysiological, and paradoxical insomnia sufferers at the parietal region in various frequency bands.
Association of Asymmetry and Depressive and Anxious Symptoms
Pearson’s correlations were performed on asymmetry measures that differed between groups and showed stability over the course of the two nights, and scores on the BDI and BAI. In the frontal region, the asymmetry of the gamma activity differed between GS and Para-I. With all participants pooled together, correlations with gamma asymmetry, and BDI scores were non-significant (r = −0.06, p = 0.63) suggesting no relation between those two variables. Results for GS alone were similar (r = 0.29, p = 0.20), as were those of Psy-I (r = −0.12, p = 0.58), and Para-I (r = 0.01, p = 0.96). Correlation of frontal gamma asymmetry and BAI scores were also non-significant considering the entire sample (r = −0.21, p = 0.10), GS alone (r = 0.05, p = 0.83), Psy-I (r = −0.34, p = 0.10), or Para-I (r = 0.29, p = 0.31). As for beta1 parietal asymmetry, its relation with BDI scores was marginally significant (r = 0.23, p = 0.07) when all participants were pooled together. Analyses performed on groups separately did not reach significance (GS, r = 0.31, p = 0.17; Psy-I, r = 0.28, p = 0.19, and Para-I, r = 0.40, p = 0.12). Beta2 and BDI scores did not relate neither; all results were non-significant. Neither beta1 nor beta2 parietal asymmetry correlated significantly with BAI scores.
Discussion
In this study, GSs and insomnia sufferers, categorized in psychophysiological or paradoxical subtypes, were compared on measures of cerebral asymmetry to specify the regional relative activity in insomnia at frontal, central, and parietal sites. This approach was chosen to locate possible activation abnormalities in insomnia subtypes and relate them to other psychopathologies documented in the literature. In addition, the assessment of asymmetry on two nights was performed to document its night to night stability.
As for the differences between groups, asymmetry measured at the frontal region suggested a trend, over the course of the two nights, for Para-I to present higher gamma activity in their left hemisphere whereas GS would present more gamma activity in their right hemisphere. Therefore, Para-I showed signs of increased activity in their left frontal region compared with GS. Gamma activity has been linked to attention (Fries et al., 2001) and memory (encoding and retrieving; Montgomery and Buzsáki, 2007), which are waking functions. In ERP studies, an early gamma response to stimuli is generated in REM and NREM sleep and is thought to be sensory/perceptual processing (Karakaş et al., 2006). Gamma activity in Para-I is then localized in the opposite hemisphere compared with GS. It is possible that gamma activity, as observed in the present study, does reflect activation linked to the misperception of sleep as Para-I, by definition, do show important discrepancies between subjective estimates and objective sleep data. Other reports of frontal cerebral asymmetry have linked higher activity of the right hemisphere compared with the left to depressive symptoms and/or depression (Henriques and Davidson, 1990, 1991; Gotlib et al., 1998). Therefore, our Para-I group did not present the frontal cerebral activation pattern of depression or depressive symptoms reported in the literature, even if their score was higher than GS’s on the BDI.
On parietal sites, Psy-I presented more beta1 and beta2 activity in their right hemisphere than Para-I over the course of the two nights. Beta activity is also representative of sensory and information processing, attention, and memory (Perlis et al., 2001b). Consequently, Psy-I showed increased activity in their right parietal region compared with Para-I. Again, parietal asymmetries have been linked to the presence of depressive as well as anxious symptoms. While some authors have demonstrated an increased activation in the left parietal region in a sample of depressed individuals (Henriques and Davidson, 1990), others have observed an increase in the activation of the right hemisphere when depressive and anxious disorders coexist (Bruder et al., 1997; Metzger et al., 2004). None of our insomnia groups differed from GS on parietal asymmetry over the course of the whole two nights of recording. We may then suppose that their asymmetry measures are within what is expected in a normative sample. The higher activation of the right parietal region in Psy-I might be a characteristic of that specific insomnia subtype more than a sign of depressive combined with anxious symptoms since Psy-I and Para-I were equivalent on BDI and BAI scores.
In fact, one of the most surprising result of the present study resides in the fact that asymmetry found in insomnia is independent of depressive or anxious symptoms. As such, no correlation was found between BDI or BAI scores and asymmetry measures. Jacobs and Snyder’s (1996) reported a negative correlation between frontal asymmetry and BDI scores during wake and Armitage et al.’s (1993) work demonstrated that asymmetry during wake persisted during sleep. Considering these previous studies, it was expected to find relations between depressive symptoms and asymmetry in sleep. It might then be that this association is not perceptible in sleep or else, maybe the range of scores on depression and anxiety inventories was too narrow to observe significant correlations.
In addition, this study, by considering two nights of recordings, was able to show a variation in cerebral activity between nights in all groups. Asymmetry scores have been considered as stable during wake; asymmetry in sleep might not be. As mentioned earlier, our group (St-Jean et al., in preparation) has observed that all subjective measures of sleep (SOL, WASO, TST, and SE) did not differ from Night 2 to Night 3 in GS, Psy-I, and Para-I. However, by its longer objective WASO and total time of stage 2 sleep, Night 2 sleep appeared less consolidated in all three groups. Consequently, Night 3 was considered a better night of sleep than the second one. Therefore, it is possible that a more disrupted night of sleep is characterized by increased slow wave frontal asymmetry, increased asymmetry in the theta to the beta1 bands in the central region, and increased omega asymmetry in the parietal sites, as was observed on Night 2 compared with Night 3. This would translate in lower right frontal activation as well as higher right central and parietal activation on a poorer night of sleep. On the opposite, an objectively better night of sleep such as Night 3 would increase asymmetry in the theta to the omega bands at frontal sites, in the delta band at central sites, and slow wave activity in the parietal region. Therefore, a better night of sleep would be characterized by increased activation in the right frontal region as well as left central and parietal region. Thus quality of sleep does have an impact on cerebral activation, and as such, on cerebral asymmetry.
Following the same line of argument, differences between groups specific to Night 2 or 3 could be interpreted in light of the objective sleep quality. Night 2, being more disrupted, would affect insomnia subtypes differently. Central delta activity was predominant in the right hemisphere of Psy-I and left hemisphere of Para-I. In the parietal region, on Night 2, activity in the frequency bands from delta to beta1 were increased in Psy-I compared with GS and activity from the delta to the beta2 band were increased in Psy-I compared with Para-I. Consequently, on a disrupted night of sleep, Psy-I showed some hypoactivation in their right central region and increased activation in their right parietal region whereas Para-I and GS were similar in terms of asymmetry. On Night 3, considered a better night of sleep, GS presented more beta2 activity in the central region of their right hemisphere and more gamma activity in their right parietal region than Para-I. Therefore, on a better night of sleep, the right central region of Para-I is relatively hypoactivated compared with the one of GS. Since objective sleep quality appears to affect differently GS and both groups of insomnia individuals in their cerebral activity during sleep, it now suggests that sleep quality must be assessed in EEG-based studies in order to interpret adequately differences between groups.
Since signs of sleep deprivation during wake in insomnia sufferers have been observed by means fluorodeoxyglucose positron emission tomography (Nofzinger et al., 2004), we might ask if the observed asymmetry in insomnia is a consequence of sleep deprivation. Ferrara et al. (2002) have reported that deprivation of slow wave sleep increased activity in the left central region of GSs. Our results are difficult to reconcile with these observations. First, none of our groups has shown a significant difference in slow wave sleep between nights and, second, a more disrupted night, which was following an adaptation night, was associated with a higher activation in the right central region in Psy-I, the opposite of what was found in Ferrara and colleagues deprivation’s study. However, it suggests that slow wave sleep deprivation and poor nights of sleep do not produce similar repercussions on cerebral asymmetry during sleep, in particular, in the central region.
Limitations of this study firstly concern cerebral asymmetry: it is a measure obtained by computing differences between powers observed at two sites and therefore represents a relative increase in power on one side compared to the other. As such, comparing these differences between groups or nights has limited interpretation. The choice of using EEG as the measure of cortical activity has a superior temporal resolution although a less accurate spatial resolution compared with other measures in neuroimaging. At the statistical level, successive analyses were necessary to tests our hypotheses leading to higher risks of reporting significant results when they are not. As well, the high number of factors included in the analyses made the interpretation of second order interactions difficult. Moreover, differences between groups attributable to sleep quality variation are descriptive, not statistical, since sleep quality could not be entered in the statistical model as it would have considerably made more complex the interpretation of the results. In addition, the analyses performed could not assess the impact of the sleep quality of one night on the following one, such as the effect of the adaptation night on Night 2. Also, due to the number of participants, correlational analyses should be considered with caution. Finally, only epochs of consolidated sleep stages were selected for the computation of PSA. Consequently, we cannot pretend that the results also extend to stages transitions which might present different activation patterns which were not investigated.
Conclusion
Two novel findings emerged from this study. It was shown that psychophysiological and paradoxical subtypes of insomnia present different and unique patterns of cortical activation. Para-I tend to present hypoactivation of their left frontal region but hyperactivation of their right one. As for Psy-I, they present increased activation of their right parietal region compared with Para-I. Those particular patterns of cortical activation did not relate to patterns of asymmetry found in depression and anxiety and did not correlate with scores at the BDI and BAI. As such, psychophysiological and paradoxical insomnia disorders do not share similarities with depression and anxiety’s cortical activity topography and, thus, are less likely to contribute to each other’s pattern. However, these results are important for the choice of recording sites in future research on cortical activation may they apply PSA, cerebral asymmetry, fractal domain, ERPs, or another EEG recording method. In addition, it was observed that asymmetry fluctuates between nights, which is thought to be related to objective sleep quality. On a more disrupted night of sleep, Psy-I have increased activity in their right parietal region and, on a less disrupted one, Para-I present a decrease of activity in the right central region. Additional research is needed to confirm the association of sleep quality and cerebral asymmetry. The classification of recording nights as good or bad ones independently of their order in time, such as Devoto et al. (2005) have applied in an ERPs study in insomnia, could also be useful to ascertain the relation between sleep quality and activation at precise cortical sites. Besides, in the sub-classification of insomnia participants, a considerable number of individuals, 23% of the sample, were excluded from this study as they presented characteristics of both Psy-I and Para-I: they showed objective sleep difficulties as well as an overestimation of those. Therefore, information on this unexpected profile of insomnia has not been analyzed and needs additional attention as to whether they are an extent of one of the other insomnia sub-groups or an independent one. Furthermore, the degree of asymmetry could be studied in relation to the degree of the sleep misperception found in a chronic insomnia group. Future research could also evaluate asymmetry in insomnia considering age and gender since PSA measures are affected by those factors (Buysse et al., 2008). Additionally, evaluating asymmetry in individuals with multiple risk factors for insomnia and remitted patients could specify if asymmetry is a marker of the diagnosis or a predictor of vulnerability to insomnia. Also, since some studies on the effects of non-pharmacological treatment for insomnia have shown either reduction of hyperactivation during sleep (Cervena et al., 2004) or normalization of the hypoactivation during fluency tasks (Altena et al., 2008), we might ask if cognitive behavior therapy for insomnia would also normalize cerebral asymmetry particularities observed in insomnia sufferers.
Conflict of Interest Statement
The authors declare that the research was conducted in the absence of any commercial or financial relationships that could be construed as a potential conflict of interest.
Acknowledgments
Research supported by the Canadian Institutes of Health Research to C. H. Bastien (#49500, #86571).
References
Altena, E., Van Der Werf, Y. D., Strijers, R. L. M., and Van Someren, E. J. W. (2008). Sleep loss affects vigilance: effects of chronic insomnia and sleep therapy. J. Sleep Res. 17, 335–343.
American Psychiatric Association. (2000). Diagnostic and Statistical Manual of Mental Disorders – IV-TR. Washington, DC: American Psychiatric Association.
American Sleep Disorders Association. (1990). International Classification of Sleep Disorders: Diagnostic and Coding Manual. Rochester, MN: American Sleep Disorders Association.
Armitage, R., Roffwarg, H. P., and Rush, A. J. (1993). Digital period analysis of EEG in depression: periodicity, coherence, and interhemispheric relationships during sleep. Prog. Neuropsychopharmacol. Biol. Psychiatry 17, 363–372.
Bastien, C. H., Vallières, A., and Morin, C. M. (2001). Validation of the insomnia severity index as an outcome measure for insomnia research. Sleep Med. 2, 297–307.
Beck, A. T., Epstein, N., Brown, G., and Steer, R. A. (1988a). An inventory for measuring clinical anxiety: psychometric properties. J. Consult. Clin. Psychol. 56, 893–897.
Beck, A. T., Steer, R. A., and Garbin, M. G. (1988b). Psychometric properties of the Beck Depression Inventory: twenty-five years of evaluation. Clin. Psychol. Rev. 8, 77–100.
Bonnet, M. H., and Arand, D. L. (1995). 24-Hour metabolic rate in insomniacs and matched normal sleepers. Sleep 19, 453–456.
Bruder, G. E., Fong, R., Tenke, C. E., Leite, P., Tower, J. P., Stewart, J. E., McGrath, P. J., and Quitkin, F. M. (1997). Regional brain asymmetries in major depression with or without an anxiety disorder: a quantitative electroencephalographic study. Biol. Psychiatry 41, 939–948.
Brunner, D. P., Vasko, R. C., Detka, C. S., Monahan, J. P., Reynolds, C. F. I., and Kupfer, D. J. (1996). Muscle artefacts in the sleep EEG: automated detection and effect on all-night EEG power spectra. J. Sleep Res. 5, 155–164.
Buysse, D. J., Germain, A., Hall, M. L., Moul, D. E., Nofzinger, E. A., Begley, A., Ehlers, C. L., Thompson, W., and Kupfer, D. J. (2008). EEG spectral analysis in primary insomnia: NREM period effects and sex differences. Sleep 31, 1673–1682.
Cervena, K., Dauvilliers, Y., Espa, F., Touchon, J., Matousek, M., Billiard, M., and Besset, A. (2004). Effect of cognitive behavioural therapy for insomnia on sleep architecture and sleep EEG power spectra in psychophysiological insomnia. J. Sleep Res. 13, 385–393.
Devoto, A., Manganelli, S., Lucidi, F., Lombardo, C., Russo, P. M., and Violani, C. (2005). Quality of sleep and P300 amplitude in primary insomnia: a preliminary study. Sleep 28, 859–863.
Edinger, J. D., Bonnet, M. H., Bootzin, R. R., Doghramji, K., Dorsey, C. M., Espie, C. A., Jamieson, A. O., McCall, W. V., Morin, C. M., and Stepanski, E. J. (2004). Derivation of research diagnostic criteria for insomnia: report of an American Academy of Sleep Medicine Work Group. Sleep 27, 1567–1596.
Espie, C. A. (2002). Insomnia: conceptual issues in the development, persistence, and treatment of sleep disorders in adults. Annu. Rev. Psychol. 53, 215–243.
Ferrara, M., De Gennaro, L., Cursio, G., Cristiani, R., and Bertini, M. (2002). Interhemispheric asymmetry of human sleep EEG in response to selective slow-wave sleep deprivation. Behav. Neurosci. 116, 976–981.
Frankel, B. L., Coursey, R. D., Buchbinder, R., and Snyder, F. (1976). Recorded and reported sleep in chronic primary insomnia. Arch. Gen. Psychiatry 33, 615–623.
Freedman, R. R. (1986). EEG power spectra in sleep-onset insomnia. Electroencephalogr. Clin. Neurophysiol. 63, 408–413.
Freedman, R. R., and Slattler, H. L. (1982). Physiological and psychological factors in sleep-onset insomnia. J. Abnorm. Psychol. 91, 380–389.
Fries, P., Reynolds, J. H., Rorie, A. E., and Desimone, R. (2001). Modulation of oscillatory neuronal synchronization by selective visual attention. Science 291, 1560–1563.
Gotlib, I. H., Ranganath, C., and Rosenfeld, P. (1998). Frontal EEG alpha asymmetry, depression, and cognitive functioning. Cogn. Emot. 12, 449–478.
Hall, M., Buysse, D. J., Nowell, P. D., Nofzinger, E. A., Houck, P., Reynolds, C. F., and Kupper, D. J. (2000). Symptoms of stress and depression as correlates of sleep in primary insomnia. Psychosom. Med. 62, 227–230.
Harmon-Jones, E., and Allen, J. J. B. (1998). Anger and frontal brain activity: EEG asymmetry consistent with approach motivation despite negative affective valence. J. Pers. Soc. Psychol. 74, 1310–1316.
Harvey, A. G. (2000). Pre-sleep cognitive activity: a comparison of sleep-onset insomniacs and good sleepers. Br. J. Clin. Psychol. 39, 275–286.
Hauri, P., and Fisher, J. (1986). Persistent psychophysiological (learned) insomnia. Sleep 9, 38–53.
Henriques, J. B., and Davidson, R. J. (1990). Regional brain electrical asymmetries discriminate between previously depressed subjects and healthy controls. J. Abnorm. Psychol. 99, 22–31.
Henriques, J. B., and Davidson, R. J. (1991). Left frontal hypoactivation in depression. J. Abnorm. Psychol. 100, 535–545.
Iber, C., Ancoli-Israel, S., Chesson, A., Quan, S. F., and for the American Academy of Sleep Medicine. (2007). The AASM Manual for the Scoring of Sleep and Associated Events: Rules, Terminology and Technical Specifications. Westchester, IL: American Academy of Sleep Medicine.
Jacobs, G. D., and Snyder, D. (1996). Frontal brain asymmetry predicts affective style in men. Behav. Neurosci. 110, 3–6.
Karakaş, S., Arikan, O., Cakmak, E. D., Bekçi, B., Doğutepe, E., and Tüfekçi, I. (2006). Early gamma response of sleep is sensory/perceptual in origin. Int. J. Psychophysiol. 62, 152–167.
Krystal, A. D., Edinger, J. D., Wohlgemuth, W. K., and Marsh, G. R. (2002). Non-REM sleep EEG frequency spectral correlates of sleep complaints in primary insomnia subtypes. Sleep 25, 630–640.
Lacks, P., and Morin, C. M. (1992). Recent advances in the assessment and treatment of insomnia. J. Consult. Clin. Psychol. 60, 586–594.
Merica, H., Blois, R., and Gaillard, J.-M. (1998). Spectral characteristics of sleep EEG in chronic insomnia. Eur. J. Neurosci. 10, 1826–1834.
Metzger, L. J., Carson, M. A., Paulus, L. A., Paige, S. R., Lasko, N. B., and Pitman, R. K. (2004). PTSD arousal and depression symptoms associated with increased right-sided parietal EEG asymmetry. J. Abnorm. Psychol. 113, 324–329.
Mitchell, K. R. (1997). Behavioral treatment of presleep tension and intrusive cognitions in patients with severe predormital insomnia. J. Behav. Med. 2, 57–69.
Monroe, L. (1967). Psychological and physiological differences between good and poor sleepers. J. Abnorm. Psychol. 72, 255–264.
Montgomery, S. M., and Buzsáki, G. (2007). Gamma oscillations dynamically couple hippocampal CA3 and CA1 regions during memory task performance. Proc. Natl. Acad. Sci. U.S.A. 104, 14495–14500.
Morin, C. M., Stone, J., Trinkle, D., Mercer, J., and Remsberg, S. (1993). Dysfunctional beliefs and attitudes about sleep among older adults with and without insomnia complaints. Psychol. Aging 8, 463–467.
Nofzinger, E. A., Buysse, D. J., Germain, A., Price, J. C., Miewald, J. M., and Kupfer, D. J. (2004). Functional neuroimaging evidence for hyperarousal in insomnia. Am. J. Psychiatry 161, 2126–2129.
Perlis, M. J., Kehr, E. L., Smith, M. T., Andrews, P. J., Orff, H., and Giles, D. E. (2001a). Temporal and stagewise distribution of high frequency EEG activity in patients with primary and secondary insomnia and good sleeper controls. J. Sleep Res. 10, 93–104.
Perlis, M. L., Merica, H., Smith, M. T., and Giles, D. E. (2001b). Beta EEG activity and insomnia. Sleep Med. Rev. 5, 365–376.
Perlis, M. L., Giles, D. E., Mendelson, W. B., Bootzin, R. R., and Wyatt, J. K. (1997). Psychophysiological insomnia: the behavioural model and a neurocognitive perspective. J. Sleep Res. 6, 179–188.
Rechtschaffen, A., and Kales, A. (1968). A Manual of Standardized Terminology, Techniques, and Scoring System for Sleep Stages of Human Subjects. Los Angeles: Brain Information Service/Brain Research Institute, University of California.
Silberman, E. K., and Weingartner, H. (1986). Hemispheric lateralization of functions related to emotion. Brain Cogn. 5, 322–353.
Specchio, L. M., Prudenzano, M. P., De Tommaso, M., Cuonzo, F., Ambrosio, R., and Puca, F. (2004). Insomnia, quality of life and psychopathological features. Brain Res. Bull. 63, 385–391.
St-Jean, G., and Bastien, C. H. (2007). Cerebral asymmetry in sleep: relation with BDI and BAI scores in chronic primary insomnia. Sleep 30, A268.
Vallières, A., Ivers, H., Bastien, C. H., Beaulieu-Bonneau, S., and Morin, C. M. (2005). Variability and predictability in sleep patterns of chronic insomniacs. J. Sleep Res. 14, 447–453.
Vallières, A., Ivers, H., Beaulieu-Bonneau, S., and Morin, C. (2011). Predictability of sleep in patients with insomnia. Sleep 34, 609–617.
Weissman, M. M., Greenwald, S., Nino-Murcia, G., and Dement, W. C. (1997). The morbidity of insomnia uncomplicated by psychiatric disorders. Gen. Hosp. Psychiatry 19, 245–250.
Wicklow, A., and Espie, C. A. (2000). Intrusive thoughts and their relationship to actigraphic measurement of sleep: toward a cognitive model of insomnia. Behav. Res. Ther. 38, 679–693.
Keywords: cerebral asymmetry, psychophysiological insomnia, paradoxical insomnia, power spectral analysis, cortical activation, sleep
Citation: St-Jean G, Turcotte I and Bastien CH (2012) Cerebral asymmetry in insomnia sufferers. Front. Neur. 3:47. doi: 10.3389/fneur.2012.00047
Received: 01 November 2011; Paper pending published: 10 January 2012;
Accepted: 12 March 2012; Published online: 30 March 2012.
Edited by:
Sean P. Drummond, University of California San Diego, USAReviewed by:
Axel Steiger, Max Planck Institute of Psychiatry, GermanyErin J. Wamsley, Harvard Medical School, USA
Copyright: © 2012 St-Jean, Turcotte and Bastien. This is an open-access article distributed under the terms of the Creative Commons Attribution Non Commercial License, which permits non-commercial use, distribution, and reproduction in other forums, provided the original authors and source are credited.
*Correspondence: Célyne H. Bastien, École de Psychologie, Université Laval, FAS-Local 1012, 2325, rue des Bibliothèques, Québec, QC, Canada G1V 0A6. e-mail:Y2VseW5lLmJhc3RpZW5AcHN5LnVsYXZhbC5jYQ==