 Michael Czisch1*
 Renate Wehrle1
 Helga A. Harsay1†
 Thomas C. Wetter1†
 Florian Holsboer1
 Philipp G. Sämann1
 Sean P. A. Drummond2,3
- 1 Neuroimaging Research Group, Max Planck Institute of Psychiatry, Munich, Germany
- 2 Psychology Service, VA San Diego Healthcare System, San Diego, CA, USA
- 3 Department of Psychiatry, University of California, San Diego, CA, USA
Sleep loss affects attention by reducing levels of arousal and alertness. The neural mechanisms underlying the compensatory efforts of the brain to maintain attention and performance after sleep deprivation (SD) are not fully understood. Previous neuroimaging studies of SD have not been able to separate the effects of reduced arousal from the effects of SD on cerebral responses to cognitive challenges. Here, we used a simultaneous electroencephalography (EEG) and functional magnetic resonance imaging (fMRI) approach to study the effects of 36 h of total sleep deprivation (TSD). Specifically, we focused on changes in selective attention processes as induced by an active acoustic oddball task, with the ability to isolate runs with objective EEG signs of high (SDalert) or reduced (SDsleepy) vigilance. In the SDalert condition, oddball task-related activity appears to be sustained by compensatory co-activation of insular regions, but task-negative activity in the right posterior node of the default mode network is altered following TSD. In the SDsleepy condition, oddball task-positive activity was massively impaired, but task-negative activation was showing levels comparable with the control condition after a well-rested night. Our results suggest that loss of strict negative correlation between oddball task-positive and task-negative activation reflects the effects of TSD, while the actual state of vigilance during task performance can affects either task-related or task-negative activity, depending on the exact vigilance level.
Introduction
Selective attention is a basic process required to maintain goal-directed behavior (Lavie, 2005). It facilitates appropriate responding to target stimuli and suppression of reactions to non-target stimuli when interacting with the environment. Attention is among the cognitive domains most consistently affected by total sleep deprivation (TSD; Drummond and Brown, 2001; Boonstra et al., 2007). Dinges and colleagues have long argued sleep-initiating mechanisms repeatedly interfere with wakefulness during SD to impair sustained attention (Doran et al., 2001; Durmer and Dinges, 2005). However the impact of fluctuating arousal levels and microsleeps associated with increased sleepiness on other cognitive tasks is not as clear and has rarely been considered in functional neuroimaging studies, with the exception of Chee et al.’s (2008) selective attention task.
Using functional magnetic resonance imaging (fMRI), a short-term visual attention task was investigated by Portas et al. (1998) who found increased thalamic activation after TSD, along with intact behavioral performance. Drummond et al. (2005b) reported that sustained attention – maintaining attention for an extended period of time – during TSD is characterized by brain activation patterns alternating between (a) task disengagement with decreased deactivation in frontal-midline structures, associated with long reaction times (RTs), and (b) relatively undisturbed attention with normal levels of activation in task-related regions, associated with short RTs. Impaired performance was interpreted to be correlated with disinhibition of default mode (DMN) brain areas (Raichle et al., 2001). The latter findings provide a brain basis for the behavioral findings that continuous attention tasks are particularly vulnerable to attentional lapses. Interestingly, under task-free resting-state conditions the DMN has also been shown to increase its activity during transition to sleep (early sleep stage 1) as compared with wakefulness or late stage 1 sleep (Picchioni et al., 2008). This suggests normal sleep onset shares a common neural mechanism with performance lapses, which is consistent with the widely held notion lapses are often associated with microsleeps (Doran et al., 2001). Activity within the DMN nodes has also been shown to modulate RTs and performance during non-sleep deprived wakefulness.
We have previously shown that during the resting-state, integrity of the DMN and of its anticorrelated network (ACN; which includes brain regions required for attention) is altered after one night of partial SD, with reduced intra-network coupling after SD as compared with the well-rested condition (Sämann et al., 2010), and reduced functional coupling between the two dichotomous networks. DMN/ACN uncoupling continues and grows during light and deep non-REM sleep (Horovitz et al., 2009; Sämann et al., 2011). These findings on the effect of SD have recently been confirmed by De Havas et al. (2012) during the resting-state as well as during a visual attention task. However, the attention task showed impaired performance during SD, confounding the interpretation (i.e., were brain changes related to vigilance changes or to performance changes?). In summary, these data suggest that the “dynamic range” between the two negatively correlated networks (DMN and ACN), likely required for optimal redistribution of neural resources between externally and internally oriented goals, is impaired during states of altered vigilance.
In addition to resting-state activity, during wakefulness, the DMN can also be observed as a task-negative network, i.e., showing highest activity when the subject is not engaged in the current externally oriented task (Gusnard et al., 2001; Raichle et al., 2001; Esposito et al., 2006; Fransson, 2006). It was shown that with increased task load, DMN activity is more suppressed, reflected by decreased BOLD signal amplitudes in the task-negative network (Esposito et al., 2006; Fransson, 2006). Furthermore, task-induced deactivation in DMN regions are affected by age (Lustig et al., 2003; Persson et al., 2007): upon increased cognitive demand, older adults show reduced deactivation of the DMN as compared with young subjects (Persson et al., 2007). Different nodes of the DMN appear to be differently affected by age (or dementia of the Alzheimer type): the lateral posterior nodes appear rather unaffected by the specific condition, while medial anterior and posterior DMN nodes show less task-induced deactivation for older subjects and patients (Lustig et al., 2003). Consistent with those findings, recent data show the DMN is actually composed of two distinct subsystems, an anterior and a posterior DMN, both of which have unique negative correlations to ACN subsystems (Uddin et al., 2009; Sämann et al., 2010). The posterior DMN is negatively correlated with the bilateral insula and right inferior frontal gyrus and right inferior parietal lobe (IPL), while the anterior DMN is negatively correlated to the bilateral IPL, postcentral, and superior temporal gyrus (Uddin et al., 2009; Sämann et al., 2010).
It has been hypothesized that for optimal functioning, a stable negative correlation between the task-positive network and the DMN is required, a balance which may be affected by SD. This hypothesis was first formulated by Drummond et al. (2005a) who observed increased activation of DMN areas during a psychomotor vigilance task when analysis was focused on slow reaction times after SD. Similar, Chee and Chuah (2007) reported preserved deactivation in the precuneus with increased memory load in a visual short-term memory task when subjects showed less performance decline after SD. As mentioned above, De Havas et al. (2012) reported uncoupling of the DMN nodes after SD during a visual attention task with impaired task performance. Interestingly, Gujar et al. (2010) showed dissociated activity within the DMN after SD: the dorsal anterior cingulate cortex and the medial superior frontal cortex showed reduced task-induced deactivation after SD, while the precuneus showed more pronounced deactivation after SD. These finding indicate that our understanding of the interplay between task-positive and DMN activation remains incomplete.
However, a complex methodological confound in sleep deprivation studies is the instability of vigilance that can distort behavioral and physiological measurements. Decreased or fluctuating alertness reduces the capacity for handling additional cognitive demands. Homeostatic processes during TSD increase sleep pressure, resulting in waxing and waning of physiological arousal levels with embedded short “microsleep” episodes, thereby adding to increased instability of performance (Doran et al., 2001). Thus, altered cerebral activation patterns after TSD may partially reflect decreased arousal, or even sleep, during task performance. Until now, such arousal-related confounds have rarely been controlled in fMRI experiments studying SD. Currently, analysis of EEG recordings is the state-of-the-art instrument to monitor and account for temporary fluctuations in physiological arousal (Valley and Broughton, 1983; Oken et al., 2006). To identify neural substrates of maintaining successful task performance under the demands of SD, SD effects, and effects of impaired arousal or sleep need to be disentangled.
Here, we report effects of 36 h TSD on cerebral activity during a basic selective attention task. Selective attention can be probed using the acoustic oddball paradigm where the subject responds to rare acoustic stimuli (odd tones) against the background of common non-target stimuli of a different frequency (Herrmann and Knight, 2001). Several groups have examined brain regions critical for identifying and responding to odd tones (Linden et al., 1999; Stevens et al., 2000; Kiehl et al., 2001; Horovitz et al., 2002; Liebenthal et al., 2003). Multimodal imaging with simultaneous EEG and fMRI recordings allow for improved detection of TSD effects by characterizing objective sleepiness. Our aim was to identify how target-related and task-negative brain activity adapts following TSD, both with and without interfering decrements in physiological arousal levels. Based on our previous work, we hypothesized increased oddball task-related activity (oddball task-positive network: OTPN) signifying compensatory recruitment to maintain performance under increased sleep pressure. When subjects became increasingly sleepy, a breakdown of task-positive activity was expected without obvious compensatory increases. Furthermore, we proposed that the strict negative correlation of DMN and OTPN activity would be reduced after SD, and this would be reflected largely as decreased deactivation of DMN regions.
Materials and Methods
Subjects
Young healthy participants were recruited by public advertising. Written informed consent was obtained prior to the study. The study was approved by the ethical review board of Ludwig-Maximilians University, Munich, Germany, and followed the guidelines of the Declaration of Helsinki. All participants underwent a medical examination including blood tests and drug usage screening, a routine clinical MR protocol, routine EEG diagnostics, and a polysomnographic recording, and were assessed by a computer-assisted psychiatric structured clinical interview according to DSM-IV criteria (Wittchen and Pfister, 1997). Only healthy, right-handed non-smokers with an intermediate circadian rhythm (Horne and Ostberg, 1976; German Version by Griefahn et al., 2001) and without sleep-related disorders were included in the protocol. Subjects were excluded if they consumed more than two cups of coffee per day or more than five alcoholic drinks per week, had recently crossed time zones, had any lifetime Axis I psychiatric diagnosis, consumed medication or drugs, or had any medical condition which made either MRI or TSD unsafe (i.e., claustrophobia or epilepsy).
In total, simultaneous EEG/fMRI data were collected from 20 subjects (10 females, 10 males, age range: 20–30 years, mean age: 25.5 ± 2.5 years). Two of these were excluded based on excessive motion artifacts in the EEG and/or fMRI data, another four subjects because all of the TSD fMRI runs were contaminated with periods of reduced vigilance and/or microsleep as revealed by objective EEG criteria (see below), leaving 14 subjects for further analysis (six female/eight male; age range 21–30 years; mean age 25.0 ± 2.9 years).
Procedures
In this study, subjects performed an acoustic oddball task twice, once after a well-rested night and once after 36 h of TSD. The order of experiments was counter-balanced between subjects, with 7 days between the experiments. For 14 days prior to the start of the experiment, subjects were asked to maintain a regular sleep-wake cycle which was monitored using actigraphy. Subjects were instructed to refrain from consuming caffeine (e.g., coffee, tea, chocolate) for at least 24 h before the experiment. Participants spent the night before the experiment at the research site, with either a polysomnographically controlled night in the sleep laboratory (lights off 23:00, on 7:00), or a controlled TSD attended by a staff member.
Stimulation Paradigm
The subjects underwent four repetitions of an active acoustic oddball design (two-tone oddball), both outside (starting 15:00) and inside the MR scanner (starting 20:00). Stimuli were delivered via the program Presentation (Neurobehavioral Systems, Albany, USA). Acoustic stimuli were transmitted via MR-compatible electrostatic head phones (MR-Confon, Magdeburg, Germany). For ear protection during image acquisition, subjects also wore ear plugs. Loudness of tone presentation was individually adjusted to a comfortable level exceeding the background noise of the MR image acquisition. Subjects were asked to react as quickly and accurately as possible to the odd tone by pressing a button with the right index finger.
Subjective sleepiness scores according to the modified nine-point Karolinska Sleepiness Scale were collected before the start of the session and directly following the oddball task. For analysis, the mean of both values was calculated. In addition, subjective measures of task difficulty, effort required to do the task, effort put into task, motivation, and concentration were assessed on Likert scales (1-low to 10-high) after each administration of the task.
Stimuli
The acoustic stimulation and fMRI design was adapted from Liebenthal et al., 2003; Figure 1). We used an interleaved EEG/fMRI design where each block of stimulus presentation consisted of 16 binaurally presented tones (50 ms duration, ISI 500 ms, 1000 or 1500 Hz for frequent and odd tones, respectively, total time 8 s per presentation block), composed mainly of frequent tones (>75%). After each complete sequence, an fMRI volume was acquired for 2 s, followed by a delay of 500 ms before the next tone sequence started. Stimulus presentation was constantly synchronized with the fMRI acquisition protocol for each volume. This interleaved acquisition allowed us to obtain EEG measurements free of magnetic field gradient artifacts during tone presentation while simultaneously exploiting the characteristic delay in the BOLD signal response (Liebenthal et al., 2003; Logothetis, 2003). As stimuli were not presented during active MR image acquisition, BOLD responses to the oddball task were not affected by scanner noise. Due to the delayed hemodynamic response, odd tones positioned at the very beginning or the end of an 8 s presentation block contributed very little to the resulting fMRI response, whereas odd tones 3–6 s before fMRI acquisition contribute the most to the resultant signal. We took advantage of this fact to design three types of stimulation blocks (see also Figure 1): (i) five “frequent blocks” with an odd tone frequency of 6.25 or 13%. These odd tones were interspersed into frequent blocks to avoid predictability of a pure frequent block, and were positioned to result in minimal BOLD signal contribution. (ii) Twelve different “odd blocks” designed to maximize BOLD signal intensities during the 2 s data collection window while still keeping odd tones below 20% in each block. (iii) Six different “mixed blocks” designed to counteract the predictability of the timing of the odd tones in frequent vs. odd blocks (i.e., all odd tones were at the start or end of the block in frequent blocks, but in the middle of the odd blocks) with a maximum probability of odd tones of 25%. For each oddball task, 42 blocks were presented (18 frequent blocks, 18 odd blocks, 6 mixed blocks, overall 15.4% probability of odd tones) in a pseudo-random order (i.e., no more than three “mixed” and/or “odd” blocks were presented in a row).
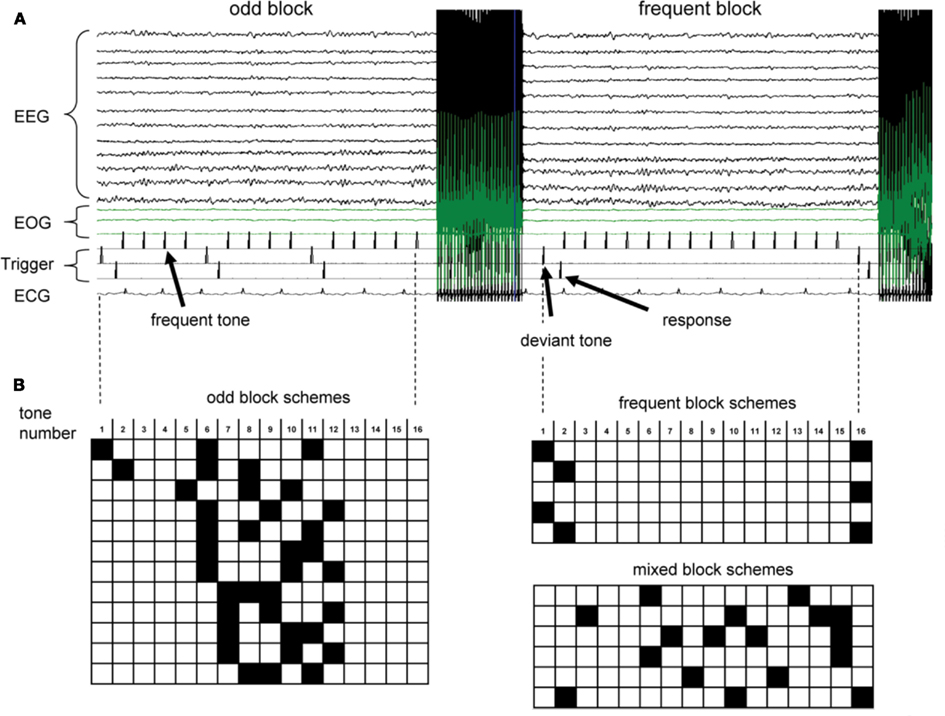
Figure 1. (A) Raw EEG recordings and trigger pulses during an fMRI run. fMRI data acquisition leads to strong gradient induced artifacts in the EEG. Cardioballistic artifacts in temporal correlation with the QRS complex in the ECG are visible on some EEG traces. Trigger pulses for frequent tones (top row), deviant odd tones (middle row), and subject’s response (bottom row) are indicated. (B) Order of tones for odd blocks, frequent blocks and mixed blocks. Each row corresponds to 8 s tone presentation before fMRI volume acquisition. Black squares indicated odd tones (1.5 kHz), while open squares represent frequent 1 kHz tones.
Subjects were instructed to respond as fast as possible to every appearance of an odd tone by pressing a button with their right index finger. During the task, subjects were asked to fixate on a white cross projected on a video screen at the magnet’s bore. Each of these experimental runs took 7′42′′ including two dummy blocks at the beginning of the fMRI acquisition ([8 s (tone presentation) + 2 s (fMRI acquisition) + 0.5 s gap] × 42 + 2 × 10.5 s dummy scans). For each subject and condition (after a well-rested night or after TSD), the oddball task was administered in four separate runs, each using a different order of tone presentation blocks. Subjects were allowed to rest for at least 2 min in between successive runs.
Reaction times were evaluated if the subject responded correctly to odd tones within 1500 ms. Errors of omission (delayed >1500 ms, or no response) and errors of commission (wrong hit within 1500 ms of a frequent tones) were also recorded. Mean RTs were calculated per stimulation block of 16 tones, as well as for the whole experiment.
EEG Recording and Analysis
Electrophysiological monitoring included 11 EEG channels (F3, F4, Fz, C3, C4, Cz, P3, P4, Pz, O1, O2 according to the international 10/20-system), electrooculogram (EOG) of the left and the right eye, a three-lead ECG, as well as trigger signals from the presentation software (with sub-millisecond accuracy) using an MR-compatible EEG system (Schwarzer, Munich, Germany). Data were sampled at 500 Hz. Electrode impedance was below 5 kΩ, and raw data were recorded without any filtering (BrainLab Software, Schwarzer, Munich, Germany). Cardioballistic artifacts were prevented in most recording channels by careful electrode placement.
Data were analyzed with Brain Vision Analyzer (Brain Products, Gilching, Germany). For postprocessing, the EEG was filtered digitally at 0.5–70 Hz. EEG data of all runs were subjected to traditional visual scoring (Rechtschaffen and Kales, 1968), following the sub-classification by Valley and Broughton (1983) that provides additional specification of drowsiness: transition from wakefulness to sleep is subdivided into two stages: stage 1A, characterized by slowed (at least 1 Hz slower than during wakefulness) or fragmented alpha rhythm intermixed with medium voltage mixed frequency pattern, and partial or definite slow rolling eye movements; stage 1B, showing less than 20% alpha rhythm and 4–7 Hz theta activity or other medium voltage mixed frequencies including vertex sharp waves. According to the classical sleep scoring criteria (Rechtschaffen and Kales, 1968), wakefulness and stage 1A would both be considered “awake,” while stage 1B would be classified as sleep stage 1 (dominated by microsleep or continuous sleep).
Statistics
Electroencephalography scoring, as well as subjective and objective performance measures before and after TSD were compared using repeated measurements MANOVAs. For significant MANOVA results and KSS scores, univariate analyses were performed (Table 1). Spearman correlation coefficients were used to compare the alterations in these measures to the BOLD signal changes in the areas highlighted after TSD, using Bonferroni corrected significance thresholds to adjust for multiple comparisons per group.
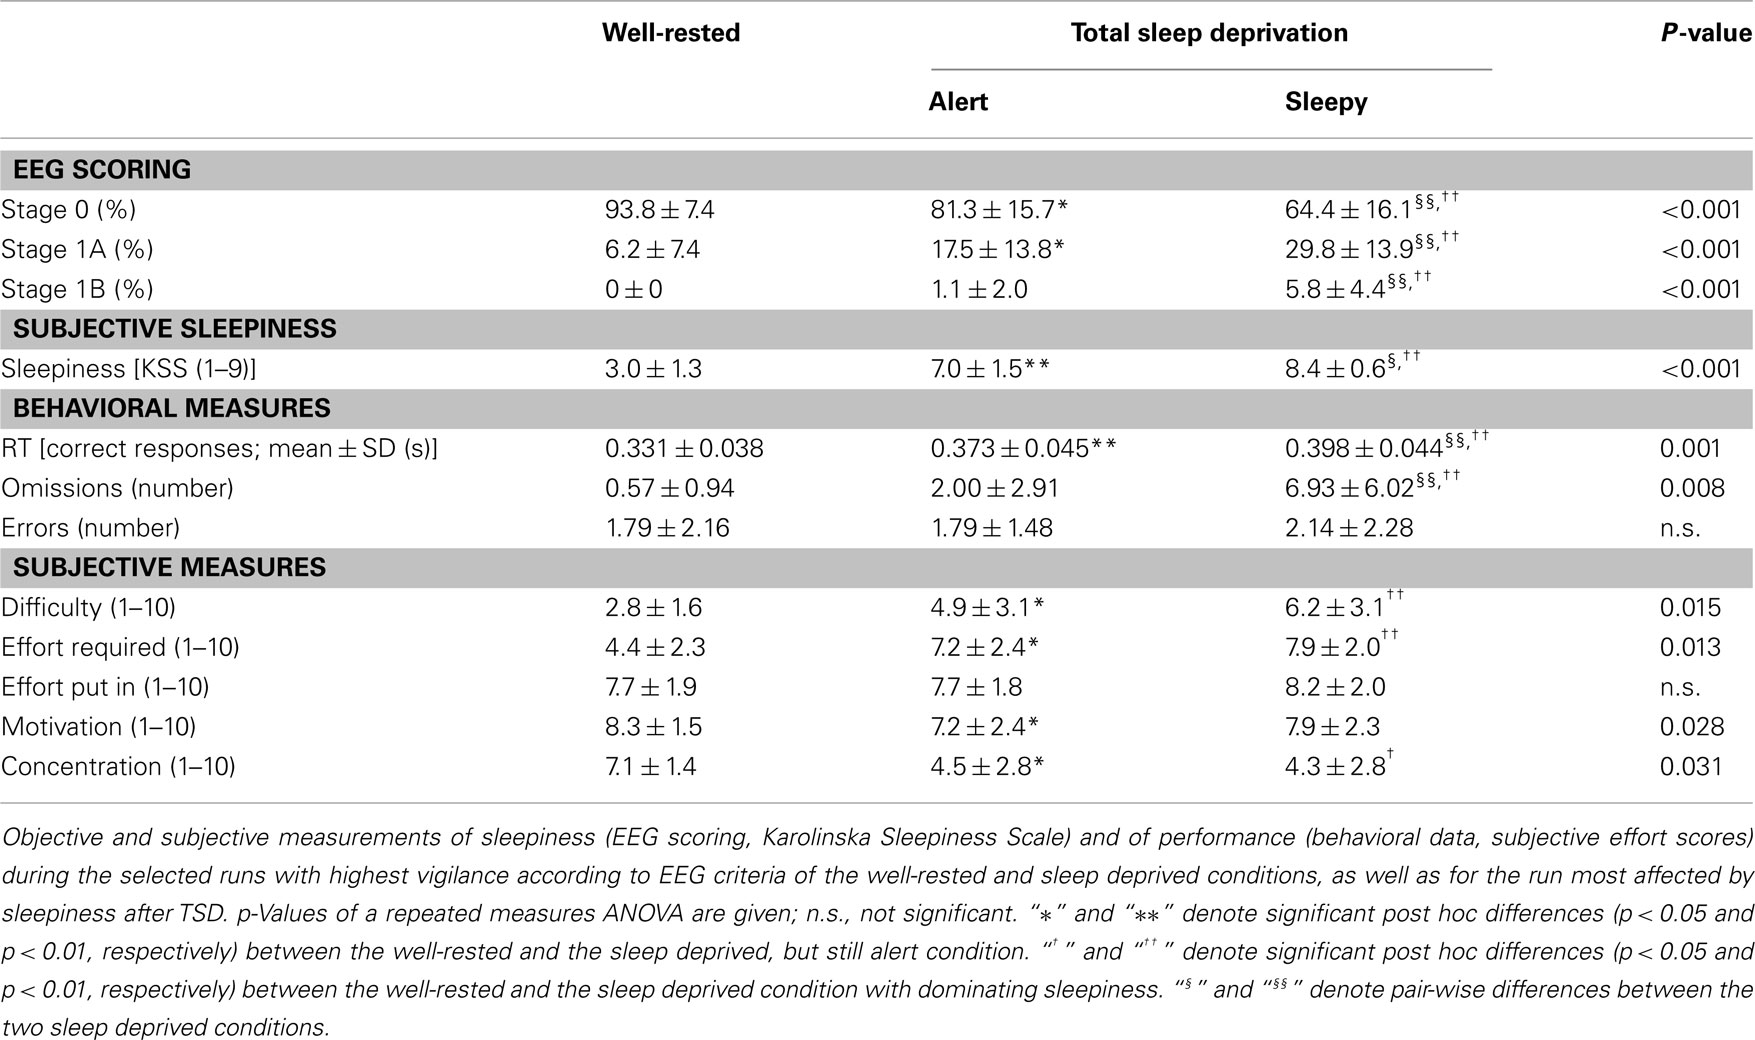
Table 1. Behavioral and Performance measurements.
MR Image Acquisition and Analysis
Imaging was performed on a 1.5-T scanner (Signa LX, General Electric, Milwaukee, USA) using an eight channel angiography head coil. Functional T2*-weighted images with a matrix size of 64 × 64, nominal voxel dimensions 3.4 mm × 3.4 mm × 4 mm, including 1 mm interslice gap (25 slices, whole brain coverage), were obtained with an echoplanar single shot pulse sequence using an AC–PC slice orientation. Volume acquisition time (TA) was 2000 ms, flip angle = 90°, and echo time (TE) 40 ms. Due to the interleaved data acquisition pattern, the effective TR was 10500 ms. Functional data were obtained by applying the acoustic oddball design as described.
Images were processed on a Linux workstation using MATLAB 2008b (MathWorks) within the general linear model framework of the SPM software package, version SPM8 (http://www.fil.ion.ucl.ac.uk/spm). Functional time series were corrected for differences in slice timing and realigned with respect to the first volume. Runs with motion exceeding 2 mm were excluded from further analysis. EPI images were normalized with respect to the EPI template image in SPM8. Reslicing (fifth degree spline interpolation, resulting in 3 mm × 3 mm × 3 mm resolution) and spatial smoothing (Gaussian, 8 mm × 8 mm × 8 mm) was performed before statistical analysis.
Functional magnetic resonance imaging
Statistical parametric maps were generated using the general linear model approach (Friston et al., 1995). We restricted the analysis to three runs per subject: the run with the highest levels of EEG-validated alertness after the well-rested night (“well-rested”), the run with the highest levels of alertness after TSD (SDalert), and the run after TSD showing the strongest shifts in EEG-based vigilance toward sleepiness (SDsleepy), defined as the run with the greatest amount of stages 1A and 1B (Valley and Broughton, 1983). When a subject had multiple runs in a given condition showing similar alertness levels, the run with better performance (fewer omissions or errors) was chosen. Using the active oddball task as described above, we studied both task-related activation as well as deactivation. For analysis, regressors for the first level analyses within subjects were: (a) the timing of all odd tones convolved with the HRF and calculated for the middle time point of each MR volume (i.e., 1 s after start of volume acquisition), (b) timing of odd tones convolved with the HRF for which a omitted response was detected, (c) timing of frequent tones convolved with the HRF with wrong hits (frequent tones without response are modeled as the intrinsic baseline), (d,e) two nuisance regressors containing the signal fluctuation of a deep white matter ROI (MNI coordinates x = 26, y = −16, z = 36 sphere of 6 mm radius) and of a deep CSF ROI (MNI coordinates x = 0, y = −40, z = −5, sphere of 6 mm radius), and (f–k) six affine realignment parameters to account for subject’s motion. During fixed effects analysis, high pass filtering (128 s, corresponding to a lower frequency cut-off of 0.008 Hz) was applied.
For each individual, brain regions showing a positive correlation with the odd tone regressor [regressor (a)] were identified, representing the oddball task-positive network (OTPN). Negative correlations with regressor (a) define the task-negative network, representing the core nodes of the DMN. Note that in the context of the present manuscript, OTPN always refers to task-positive activation observed in the oddball paradigm, and not to brain areas showing a consistent pattern of activation during several different tasks (Fox et al., 2005). Resulting individual contrast maps were forwarded to a random effects second level analysis, calculating group-level effects for the well-rested and both TSD conditions combined. First, we conducted a one sample t-test including all analyzed runs (i.e., well-rested, SDalert, and SDsleepy), which resulted in a normative activation map serving for ROI extraction. We then directly compared contrasts between the three conditions in paired t-tests. For group-level effects, normative maps were calculated using a lenient threshold of pFDR < 0.01 and <0.05 for OTPN and DMN, respectively, to depict the overall extent of the task-related activity (Figure 2). Clusters of the normative maps are detailed in Table 2 (with a more conservative threshold pFDR < 0.0001 used for the oddball task-positive contrast to allow for better differentiation of individual cluster centers). For pair-wise comparisons, a cluster based pFWE,cluster < 0.05 was used (under consideration of non-stationary smoothness (Hayasaka et al., 2004), with a collection threshold of p < 0.005).
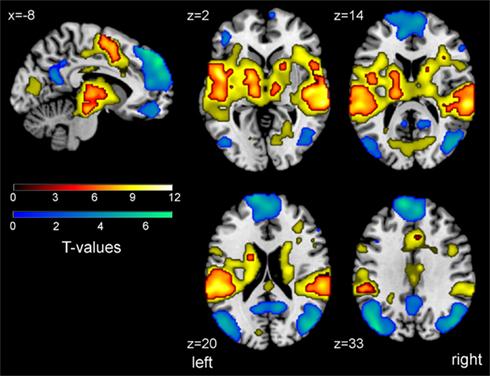
Figure 2. Overlay of task-positive activation (oddball task-positive network, OTPN, hot colors) and task-negative activation (task-negative network, representing the DMN, cool colors) in an active oddball task derived from combined analysis of all three conditions (NN, SDalert, SDsleepy). Maps are thresholded at pFDR < 0.01 (plain yellow outline to show maximal cluster extent) and pFDR < 0.0001 (hot colors to better illustrate cluster centers, see Table 2) for the OTPN, and pFDR < 0.05 for the DMN (cluster extent >30 voxel). Color bars show T-values. MNI coordinates of each slice are indicated. Images are shown in neurological orientation (left hemisphere is shown left).
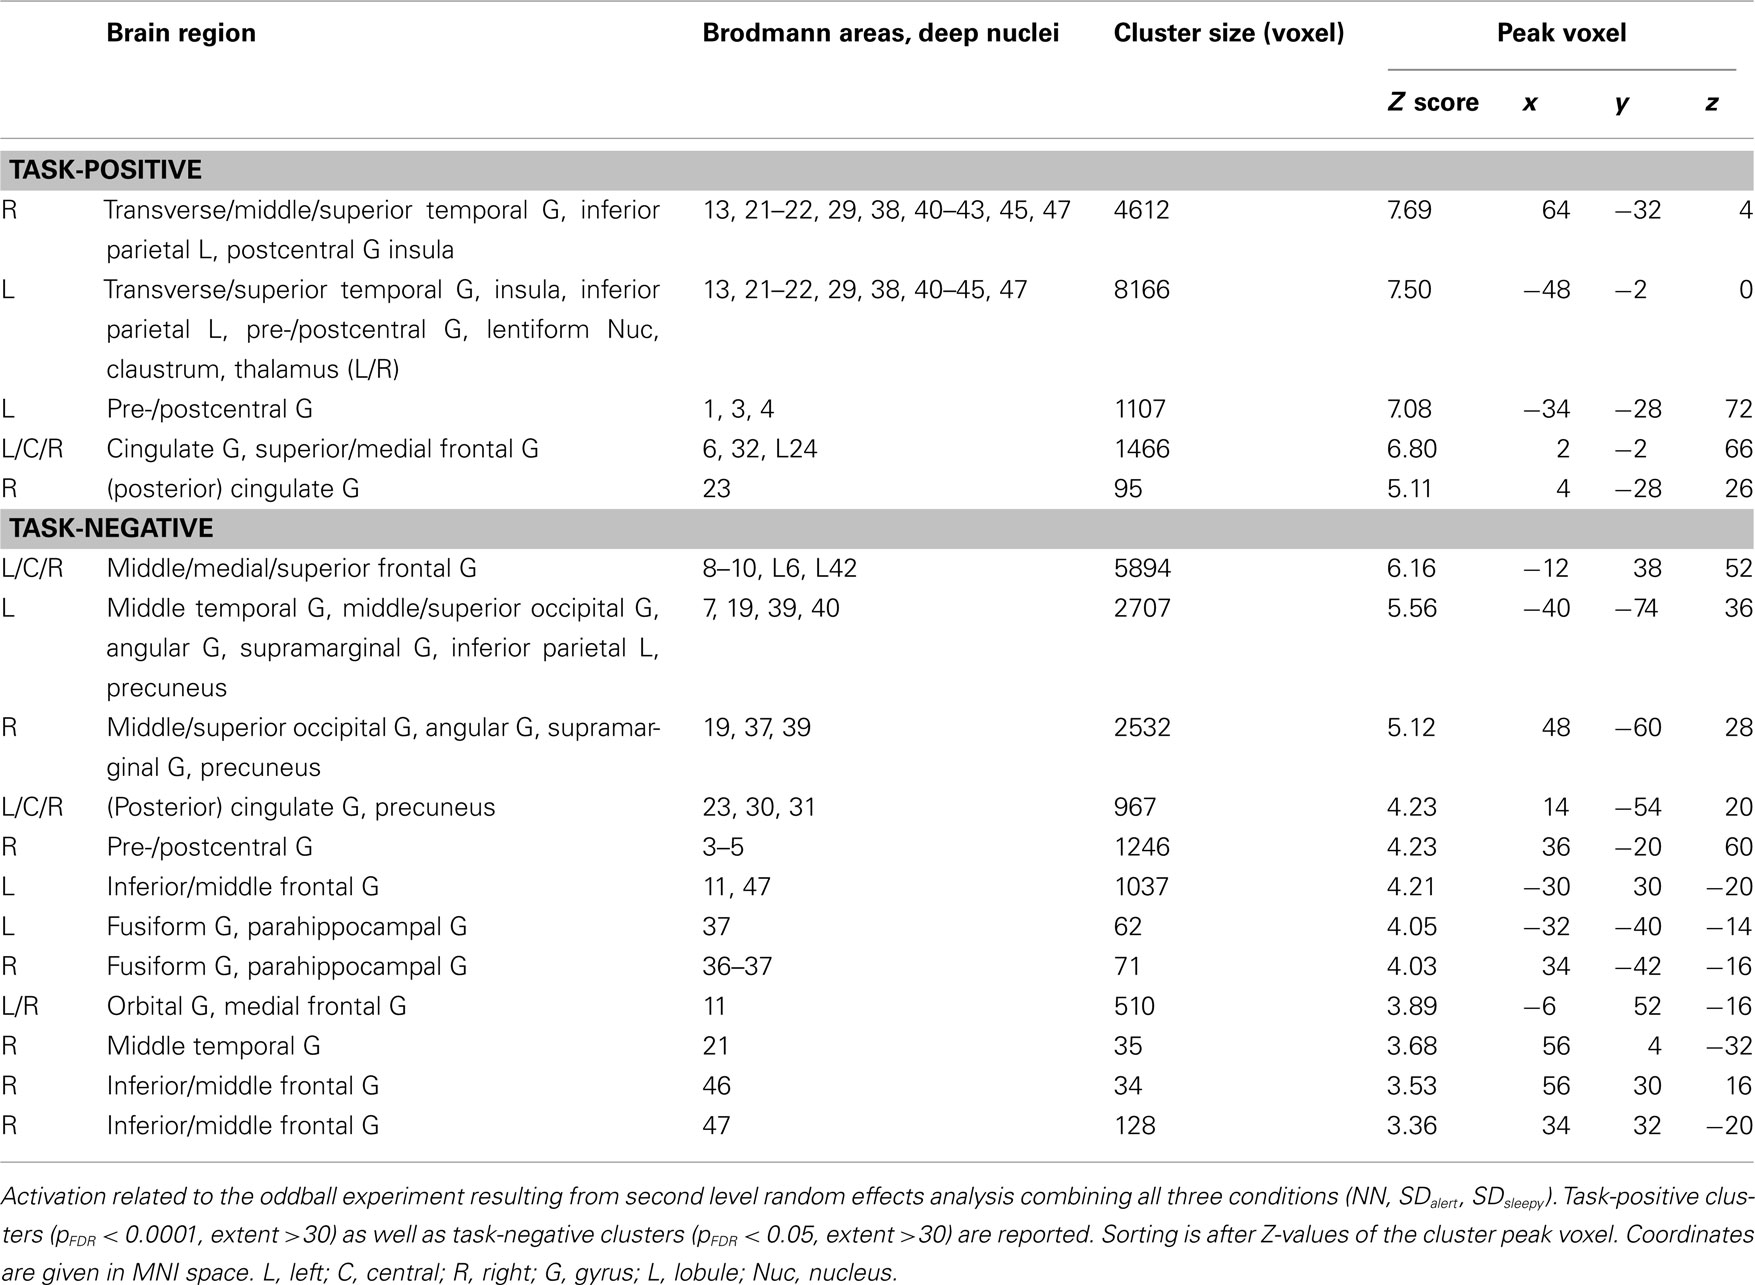
Table 2. Task-positive and task-negative activity in the oddball experiment.
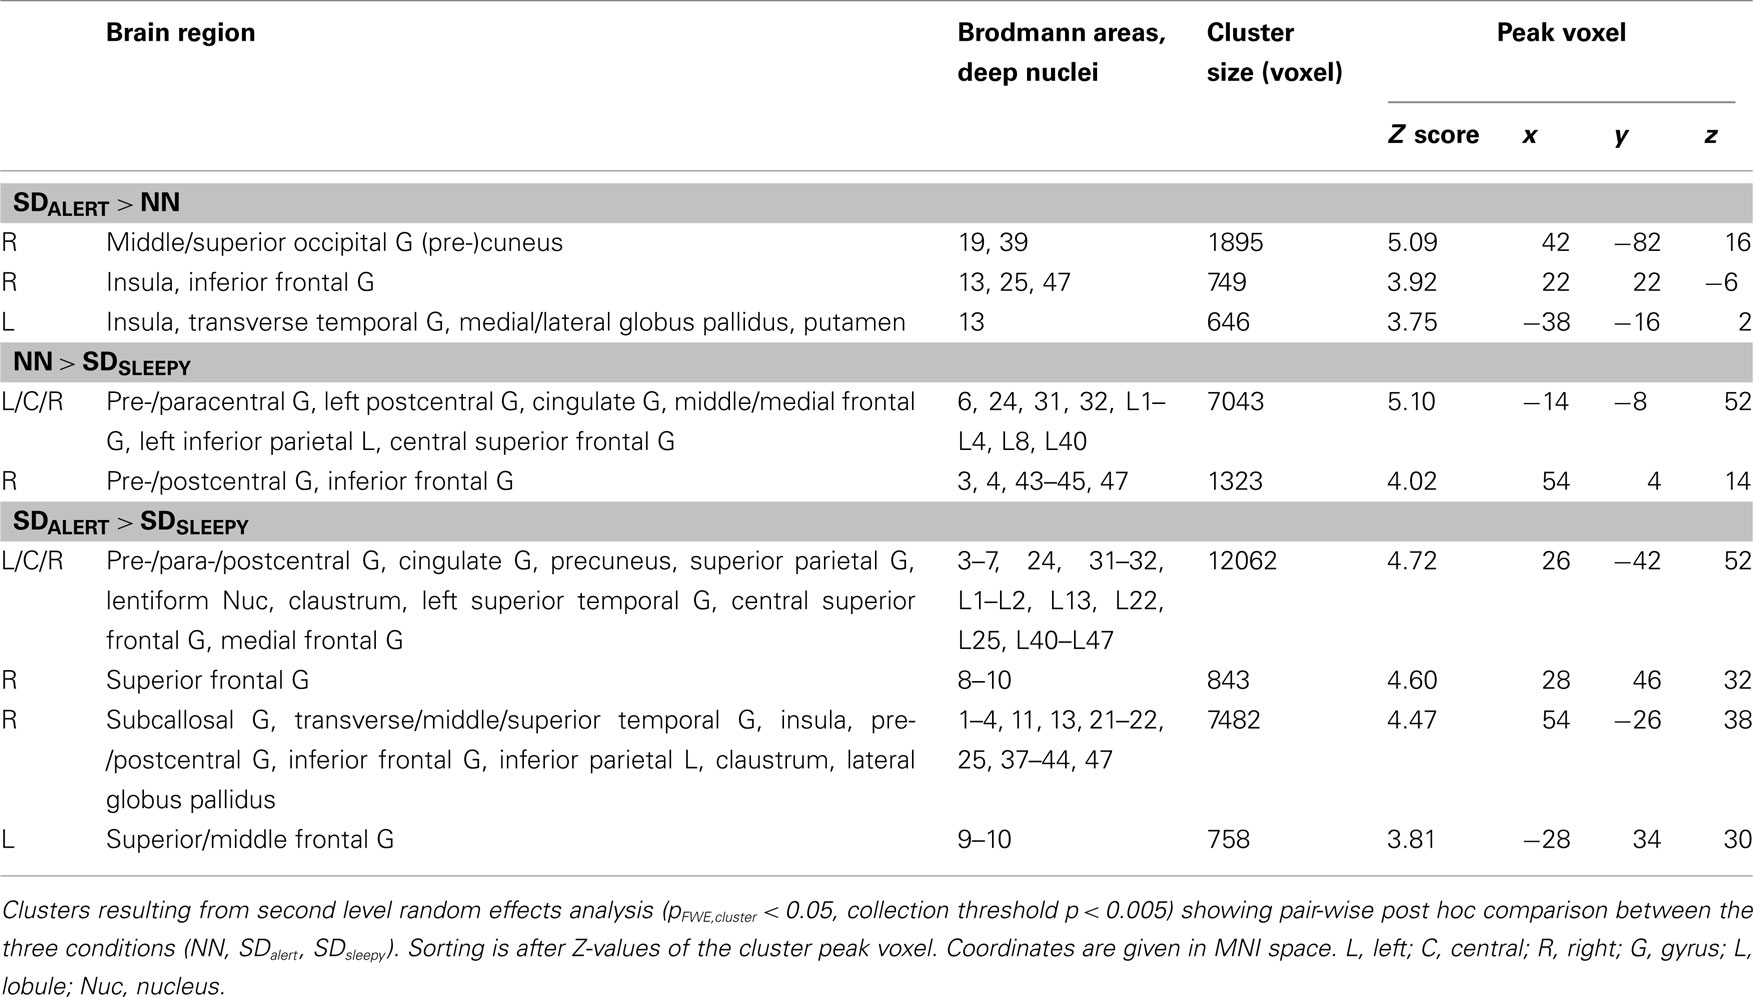
Table 3. Effects of sleep deprivation on brain areas related to oddball detection.
Results
The results of the EEG classification and behavioral data for the selected runs are summarized in Table 1, along with subjective ratings of sleepiness and task effort. With respect to objective arousal levels, subjects generally showed significantly more fragmented EEG rhythms (stage 1A and 1B) following TSD as compared to well-rested after the normal night of sleep (NN), even when only selecting SDalert, the run with the highest levels of alertness.
However, in the SDalert condition there was neither a significant increase of predominantly slower EEG background (stage 1B, corresponding to sleep stage 1 according to Rechtschaffen and Kales, 1968) nor any occurrence of sleep stage 2. Thus, no sleep according to the classical sleep scoring guidelines occurred during the selected SDalert runs. Also, when combining wakefulness and stage 1A in our data, which together correspond to the classical definition of wakefulness, there was no significant difference in the SDalert condition compared to the NN. In both the SDalert and SDsleepy conditions, subjects reported feeling sleepier and less able to concentrate following TSD. In addition, subjects evaluated the task as more difficult and requiring more effort following TSD, compared with NN. However, subjects did not put more effort in the task after TSD, presumably since these values were already relatively high in all conditions. Subjects’ motivation did not differ between conditions. Behaviorally, reaction times were found to become increasingly slower from NN to SDalert to SDsleepy, and omissions increased following TSD. In all but three subjects, SDalert runs occurred before SDsleepy runs, suggesting a time-on-trial effect that may reflect effects of increased sleep pressure after sleep deprivation.
Oddball task-related activation and deactivation was identified using the three conditions in a combined random effects group analysis (Figure 2). It should be noted that in our analysis, only correct responses to deviant tones have been contrasted, and false responses, omissions as well as vigilance fluctuations as objectified by EEG have been compensated for by adding respective nuisance regressors (see Materials and Methods). Thus, the activation maps presented here reflect successful task performance only, unaffected by lapses or omissions. In general, odd blocks relative to frequent blocks led to activation in widespread bilateral temporal regions, cortical and subcortical motor areas, and the cingulate cortex (Figure 2). Furthermore, oddball task-related activity became evident in brain stem regions and the thalamus, which may indicate arousal reactions and orienting responses, as previously suggested. All areas revealed for the OTPN have been previously reported from a large representative cohort (Kiehl et al., 2005). Furthermore, oddball task-negative activation was revealed and overlapped with core nodes of the DMN, namely the bilateral inferior parietal lobule, the anterior medial prefrontal cortex (mPFC) and the (pre-)cuneus/PCC region (Figure 2).
Figure 3A depicts brain regions showing significantly increased activation after TSD in the SDalert group compared to the NN group (pFWE,cluster < 0.05): The right middle and superior occipital gyrus extending to the (pre-)cuneus, as well as bilateral insular regions. Closer inspection of the contrast values of each condition (Figure 3D) revealed two distinct underlying patterns: first, increased activation in the SDalert condition in the insular areas that are part of the OTPN (clusters 1–2); second, diminished deactivation in the (parieto-)occipital cluster that overlapped with the DMN (cluster 3). To assess the influence of TSD on DMN activity more closely, we analyzed the peak voxel’s contrast estimate for the oddball DMN core nodes as shown in Figure 4, finding reduced deactivation in the SDalert condition was a characteristic detectable for all DMN clusters, though the effect reached significance in a whole brain corrected differential contrast only the aforementioned cluster 3. No differences in OTPN or DMN activation were observed in the contrast NN > SDalert.
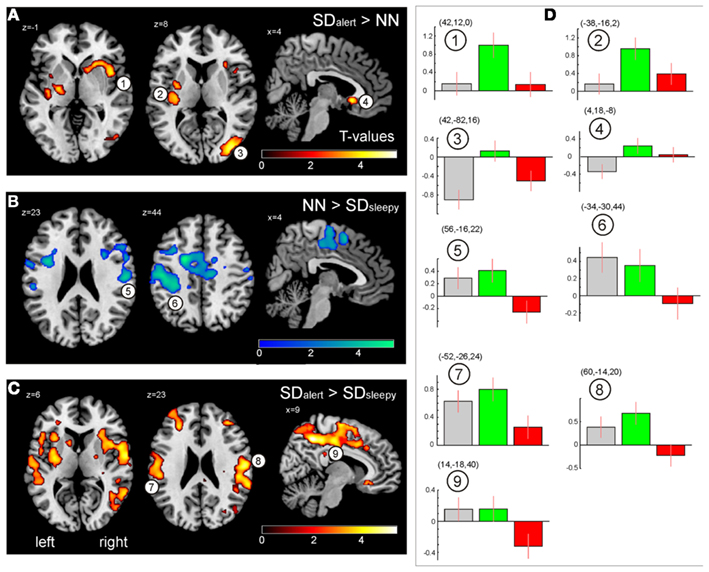
Figure 3. (A) Brain regions showing greater responses when responding to odd tones after total sleep deprivation as compared to the well-rested state after a normal night of sleep (SDalert > NN). (B) Contrast SDsleepy < NN. (C) Contrast SDalert > SDsleepy. All maps result from second level t-tests, pFWE,cluster < 0.05 (see Table 3). (D) Contrast estimates for the three experimental conditions extracted from the peak cluster voxel (MNI coordinates indicated) as indicated in (A–C) (gray: NN, green: SDalert, red: SDsleepy). Images are shown in neurological orientation.
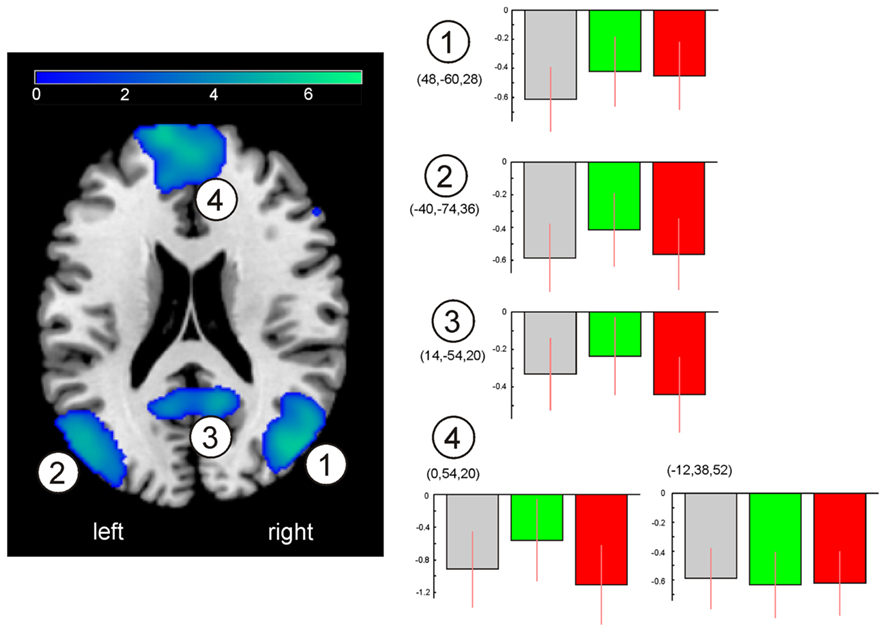
Figure 4. Qualitative assessment of DMN activity changes upon sleep deprivation. Clusters of the oddball task-negative network as in Figure 2, along with peak voxel’s contrast estimates (MNI coordinates indicated) as indicated by cluster numbering for the three conditions. Gray: NN, green: SDalert, red: SDsleepy. Images are shown in neurological orientation.
In contrast, comparing the NN and SDsleepy conditions, no significant differences in DMN activity were found, but a breakdown of OTPN activity was found in the sleepy group, even when responses to the deviant tone were correct but just slowed (Figure 3B). A similar reduction in OTPN activity becomes evident in the comparison between SDalert and SDsleepy (Figure 3C). Activation in the bilateral insular and fronto-temporal areas, in particular, was reduced in the more sleepy subjects. Again, Figure 3D shows contrast estimates for each condition for the clusters indicated. No significant differences in activation were found for the contrasts NN < SDsleepy and SDalert < SDsleepy.
Discussion
In this study, we utilized a multimodal approach with simultaneous fMRI and EEG to elucidate brain areas recruited to maintain selective attention after 36 h of TSD. Unlike previous studies, we isolated those effects of TSD that occur in the presence of objective, EEG-based high vigilance, and intact performance from those effects which may be more strongly influenced by reduced physiological arousal levels. In addition, only correct responses to the oddball task were considered while false hits and omissions were modeled independently. This allowed us to focus the present analysis on differences in behavioral and neuronal activation patterns of intact performance following TSD, while separating additional potential confounds associated with reduced vigilance typically seen during performance following TSD.
Despite substantial changes in subjective measures such as sleepiness or effort needed following TSD, the selected runs in the SDalert condition revealed only small differences in either EEG-defined arousal levels or in performance. When considering wakefulness as defined by classical scoring (Rechtschaffen and Kales, 1968), no differences were noted between rested wakefulness and SDalert. Under SDalert conditions, our data revealed increased activation of task-positive areas in the bilateral insular cortex after TSD, likely to counteract increased sleep pressure and maintain performance levels. Consistent with earlier studies (Drummond et al., 2000; Drummond and Brown, 2001) this suggests that in the alert condition after TSD, preserved task performance requires additional compensatory resources. Using resting-state functional connectivity analysis, Dosenbach et al. (2007) described a cingulo-opercular network, including bilateral anterior insula and dorsal anterior cingulate cortex, that purportedly contributes to flexible control of goal-directed behavior and supports an externally directed task mode in opposition to the DMN. Seeley et al. (2007) noted that a salience network (comprising the paralimbic anterior cingulate and frontoinsular cortices) that shows extensive connectivity with subcortical and limbic structures. Similarly, Eckert et al. (2009) suggested that the right anterior insula engages cognitive control systems, especially during challenging task conditions (which, in our study, is represented by TSD), by communicating the salience of a stimulus and altering behavioral strategies when facing declining performance. In line with this interpretation, Sridharan et al. (2008) reported that the right anterior insular cortex plays an essential and causal role in switching between central-executive and DMN networks. The authors suggested a mediating role of this brain region in general network functioning, supporting our interpretation of compensatory recruitment in the SDalert condition, when subjects successfully fought increased sleep pressure after SD. Importantly, the insular cortex also holds a role in the right lateralized ventral attention network that is intrinsically negatively correlated with the DMN and that is considered part of the general task-positive network (Fox et al., 2005, 2006). Therefore, it may be speculated that over-recruitment of the insular or frontal opercular areas is not specific to the exact task.
In addition, one cluster, partially overlapping with the IPL of the DMN, showed decreased task-induced deactivation in SDalert as compared with NN. Along with increased OTPN recruitment, this finding points out alterations of the interplay between TPNs and DMN after SD. Using a working memory task, Chee and Choo (2004) also reported compensatory recruitment within regions of the task-positive network and decreased deactivation of DMN regions during TSD. Similar to the current study, these changes were associated with slower, but equally accurate performance. Reduced inter-network functional coupling after SD has further been reported in resting-state fMRI experiments for the DMN and its negatively correlated network (Sämann et al., 2010), as well as for the DMN in task-related fMRI studies (Gujar et al., 2010; De Havas et al., 2012).
While our findings are consistent with these previous studies on the interplay of TPNs and DMN during SD, they are not fully consistent with the work of Drummond et al. (2005a) that focused on DMN during sustained attention after SD. Unfortunately, some of Drummond et al.’s discussion did not use the term “decreased deactivation” but rather “increased” or “greater” activation which may lead to some confusion. In fact, though, they reported decreased deactivation (i.e., increased disinhibition) of DMN regions associated with slower performance, relative to baseline activation during responses showing normal RTs, following SD. The hypothesis was put forward that increased disinhibition of the DMN, in its extreme case, will lead to lapses. However, RTs alone do not seem to predict DMN behavior in our data: in the SDsleepy condition, RTs were found to be slowest, but DMN activity was similar to the NN condition. Therefore, the slowest RTs in our study are not associated with the highest DMN activity, which actually appeared in the SDalert condition. On the other hand, OTPN activity was widely impaired in the SDsleepy condition, reflecting a lack of increased compensatory activity. What, then, may account for the discrepancy between our data and Drummond et al.? More importantly, what might explain both the SDalert and SDsleepy findings reported here?
With respect Drummond et al., their design and findings seem most comparable our SDalert data. That study administered a single 10 min PVT. Since our task duration (8 min, repeated runs) is close to the classic PVT duration of 10 min, and most of our SDalert runs occurred prior to our SDsleepy runs, we would hypothesize the Drummond et al. PVT runs were likely similar to our SDalert runs. Supporting that notion, the influence of TSD on objective performance and subjective measures of sleepiness in Drummond et al. are well comparable to the SDalert condition in the present analysis, as are the imaging results: changes in median/mean RTs between NN and SD conditions are about 10% in both studies, omissions (lapses in Drummond et al., 2005a) are still rather rare, and subjective measures like sleepiness, effort put in, motivation and concentration are nearly identical in Drummond et al. and our data, for both NN and TSD/SDalert. Thus, our data may not be as discrepant with Drummond et al. as would appear at first glance, since they may not have collected data during what we identified as the SDsleepy condition (although that is impossible to know with certainty given the lack of EEG data in Drummond). If true, though, the different activation patterns seen here during the SDsleepy condition may represent a different brain state. Such a brain state may, in turn, help partially explain the time-on-task alterations between task-related and DMN activity reported in long fMRI experiments, even when subjects are supposedly well-rested.
To explain both the SDalert and SDsleepy findings reported here, we hypothesize a differential reactivity of the OTPN and DMN in response to the task, depending on the vigilance level of the individual. The OTPN involves a set of brain regions, including the intraparietal sulcus, the frontal eye fields and the SMA, that are activated during a variety of tasks directed to an external goal (and therefore termed general task-positive network, TPN; Fox et al., 2005). When the term TPN is used in a more task-specific manner, as in this work, it also includes additional areas that are specific to the task, such as the secondary auditory cortices here used in the acoustic discrimination task. The DMN, on the other hand, represents brain regions in which reduced activity is found during such externally directed tasks and in which activity is higher in the resting-state (“default mode”; Raichle et al., 2001). Notably, the counter-balanced reactions of these two networks to (externally) goal-directed tasks is also imprinted into the brain’s activity during rest (Fox et al., 2005; Uddin et al., 2009). While previous work mostly focused on the effects of SD on the spontaneous interplay between these two networks during rest (Sämann et al., 2010; De Havas et al., 2012) or on the effects of SD on task-specific activations, less attention has been given to the general effects of SD on the properties of these two networks. Our NN/SDalert comparison showing reduced deactivation of the DMN after SD suggests that the baseline of the DMN has shifted. We propose that in the SDalert state, the DMN is tonically (continuously) suppressed, even during the task’s baseline state (when it would normally be disinhibited), allowing the brain to focus resources on the OTPN, which is needed to guide attention to the task stimuli. Given a certain defined dynamic range of a network, such altered baseline state would explain why less deactivation of the DMN was observed during the task (Figure 4). Interestingly, the OTPN showed exaggerated response to the task in the SDalert condition, possibly arguing for a heightened anticipatory “readiness” of this network toward stimuli (Figure 3A, cluster #1–2).
Both networks were also affected during the SDsleepy state, though in ways significantly different from the SDalert state. During SDsleepy, less activation of the OTPN was observed, whereas deactivation of the DMN was normal in terms of its relative amplitude. This may be interpreted as diminished dynamic range of the OTPN in the SDsleepy state in contrast to reduced dynamic range of the DMN during the SDalert state. It remains unclear why during SDalert condition the DMN dynamic range is impaired but the OTPN range is preserved: it may be speculated that this pattern allows the individual to maintain performance of a specific task by suppressing the “distraction” of the internal state. It may further be speculated that (a) in the sleepy condition, the individual cannot continue this altered DMN/OTPN balance, resulting in devastating consequences for task performance, and (b) that holding up this shift in balance itself is “tiring” and leads to increased sleepiness.
Previous work has demonstrated that not only DMN intra-network coherence, but particularly the pronounced negative correlation of the DMN and its ACN is markedly reduced after SD (Sämann et al., 2010). The results presented here extend those findings by suggesting that depending on the vigilance level, the dynamic range of networks during a task might be affected differentially. Previously reported impairments of the communication between the networks might come into play in both situations. Under this notion, the most flexible state can be found in the well-rested condition: herein, the brain may be in a state with optimal dynamic range of both networks, allowing for rapid and efficient switching between these two dichotomous networks. As a limitation we should add that no explicit statement can be made on the changes of intrinsic fluctuations, including negative correlation of OTPN/DMN between the SDalert and SDsleepy state. Thus an important open question is to what degree intra-network and inter-network coherence (e.g., as reported for the DMN during wakefulness; Esposito et al., 2009) is affected in the different sleep deprived states.
Such alterations of recruitment and redistribution of cerebral network resources, caused by rather small shifts in vigilance levels, have strong implications for the interpretation of data from fMRI experiments targeting intrinsic brain networks. Our data show that RTs alone cannot serve as a reliable marker of task-related neural activity, especially when looking at negatively correlated activity. Rather, task-related fMRI experiments seeking to evaluate functional connectivity between intrinsic cerebral networks are sensitive to effects of increased sleep pressure that are not measured with task performance alone. The same holds true for resting-state experiments or experiments with long time-on-tasks, where resultant data can be heavily influenced by shifts in vigilance, which usually are not monitored by either objective EEG measures, as reported here, or by subjective assessment. Unstable vigilance, drowsiness, and even light sleep can frequently be observed in resting-state experiments, despite the instruction to stay awake (unpublished fMRI/EEG data during resting-state experiments). The situation may become even worse when studying patient populations with co-morbid sleep difficulties or sleep disorders. At present, simultaneous EEG/fMRI acquisition seems to be necessary to validate stable vigilance in experiments targeting cerebral (resting-state) networks. Unfortunately, such combined EEG/fMRI measurements annihilate the appealing methodological simplicity of resting-state experiments. Future research may identify brain regions or networks which reliably reflect vigilance fluctuations in fMRI data alone. After proper validation, such information could be exploited to objectify and to correct for effects of sleepiness or drowsiness in fMRI data. Given the higher spatial resolution of fMRI as compared to EEG, such research may also forward our understanding of the neural consequences of fluctuating arousal levels.
Future studies might consider single-trial EEG information derived from simultaneous sampling of fMRI and EEG data to further disentangle the interplay of arousal level and attentional/cognitive performance. Also, the effects of chronic or partial sleep restriction, sleep stage specific deprivation, or of the circadian rhythm on the integrity of resting-state network activity need to be elucidated. Given the pervasive nature of sleep restriction in modern society, the high percentages of sleep disturbances or sleepiness as comorbidity in many clinical disorders, our data suggest that vigilance states are a subtle but likely frequent confounds in man fMRI studies, especially the longer one. Therefore, obtaining information on arousal levels during acquisition of functional data, especially resting-state data where there is no other way to infer arousal levels, should be considered in future studies. Alternatively, as mentioned above, if future worked focused on validating an fMRI signature of EEG fluctuations, then we may be able to use a single stream of data to both assess brain function and control the effects of vigilance levels. For example, work by Huang et al. (2008) on tonic and phasic dynamics in EEG recordings during a continuous compensatory visual tracing task provide an EEG model that may be useful when attempting to find an fMRI signature of fluctuating arousal levels.
In conclusion, this is the first fMRI study to systematically examine cerebral activation following TSD without confounds of decreased performance or reduced physiological arousal levels. In particular, we were able to provide evidence for a preserved oddball task-positive activation pattern with compensatory recruitment of insular regions when the subject is sleep deprived but still alert, in accordance with behavioral measures. However, the task-negative network appears affected under such conditions, presumably due to the subject’s strong focus on the external task. When the subjects became objectively more drowsy as determined from the EEG, oddball task-positive activity was drastically reduced, but no differences in task-related negative responses were found. In line with our previous observation (Sämann et al., 2010) of reduced inter-network coupling between the DMN and its negatively correlated network during resting-state fMRI after SD (which is even further pronounced when sleep manifests itself; Sämann et al., 2011), our present data suggest the OTPN and DMN in an oddball task generally reduced their negative correlation after TSD. Sleep deprivation may thus reduce the brain’s capacity to flexibly switch between internally and externally directed attention, as mirrored by the distinct negative correlation of the OTPN and DMN, even without impaired accuracy.
Conflict of Interest Statement
The authors declare that the research was conducted in the absence of any commercial or financial relationships that could be construed as a potential conflict of interest.
Acknowledgments
We would like to thank R. Schirmer and A. Mann for excellent technical assistance. Funding: Max Planck Institute of Psychiatry and VA San Diego Healthcare System’s Center for Excellence in Stress and Mental Health.
References
Boonstra, T. W., Stins, J. F., Daffertshofer, A., and Beek, P. J. (2007). Effects of sleep deprivation on neural functioning: an integrative review. Cell. Mol. Life Sci. 64, 934–946.
Chee, M. W., and Choo, W. C. (2004). Functional imaging of working memory after 24 hr of total sleep deprivation. J. Neurosci. 24, 4560–4567.
Chee, M. W., and Chuah, Y. M. (2007). Functional neuroimaging and behavioral correlates of capacity decline in visual short-term memory after sleep deprivation. Proc. Natl. Acad. Sci. U.S.A. 104, 9487–9492.
Chee, M. W., Tan, J. C., Zheng, H., Parimal, S., Weissman, D. H., Zagorodnov, V., and Dinges, D. F. (2008). Lapsing during sleep deprivation is associated with distributed changes in brain activation. J. Neurosci. 28, 5519–5528.
De Havas, J. A., Parimal, S., Soon, C. S., and Chee, M. W. (2012). Sleep deprivation reduces default mode network connectivity and anti-correlation during rest and task performance. Neuroimage 59, 1745–1751.
Doran, S. M., Van Dongen, H. P., and Dinges, D. F. (2001). Sustained attention performance during sleep deprivation: evidence of state instability. Arch. Ital. Biol. 139, 253–267.
Dosenbach, N. U., Fair, D. A., Miezin, F. M., Cohen, A. L., Wenger, K. K., Dosenbach, R. A., Fox, M. D., Snyder, A. Z., Vincent, J. L., Raichle, M. E., Schlaggar, B. L., and Petersen, S. E. (2007). Distinct brain networks for adaptive and stable task control in humans. Proc. Natl. Acad. Sci. U.S.A. 104, 11073–11078.
Drummond, S. P., Bischoff-Grethe, A., Dinges, D. F., Ayalon, L., Mednick, S. C., and Meloy, M. J. (2005a). The neural basis of the psychomotor vigilance task. Sleep 28, 1059–1068.
Drummond, S. P., Meloy, M. J., Yanagi, M. A., Orff, H. J., and Brown, G. G. (2005b). Compensatory recruitment after sleep deprivation and the relationship with performance. Psychiatry Res. 140, 211–223.
Drummond, S. P., and Brown, G. G. (2001). The effects of total sleep deprivation on cerebral responses to cognitive performance. Neuropsychopharmacology 25, S68–S73.
Drummond, S. P., Brown, G. G., Gillin, J. C., Stricker, J. L., Wong, E. C., and Buxton, R. B. (2000). Altered brain response to verbal learning following sleep deprivation. Nature 403, 655–657.
Durmer, J. S., and Dinges, D. F. (2005). Neurocognitive consequences of sleep deprivation. Semin. Neurol. 25, 117–129.
Eckert, M. A., Menon, V., Walczak, A., Ahlstrom, J., Denslow, S., Horwitz, A., and Dubno, J. R. (2009). At the heart of the ventral attention system: the right anterior insula. Hum. Brain Mapp. 30, 2530–2541.
Esposito, F., Aragri, A., Latorre, V., Popolizio, T., Scarabino, T., Cirillo, S., Marciano, E., Tedeschi, G., and Di Salle, F. (2009). Does the default-mode functional connectivity of the brain correlate with working-memory performances? Arch. Ital. Biol. 147, 11–20.
Esposito, F., Bertolino, A., Scarabino, T., Latorre, V., Blasi, G., Popolizio, T., Tedeschi, G., Cirillo, S., Goebel, R., and Di, S. F. (2006). Independent component model of the default-mode brain function: assessing the impact of active thinking. Brain Res. Bull. 70, 263–269.
Fox, M. D., Corbetta, M., Snyder, A. Z., Vincent, J. L., and Raichle, M. E. (2006). Spontaneous neuronal activity distinguishes human dorsal and ventral attention systems. Proc. Natl. Acad. Sci. U.S.A. 103, 10046–10051.
Fox, M. D., Snyder, A. Z., Vincent, J. L., Corbetta, M., Van Essen, D. C., and Raichle, M. E. (2005). The human brain is intrinsically organized into dynamic, anticorrelated functional networks. Proc. Natl. Acad. Sci. U.S.A. 102, 9673–9678.
Fransson, P. (2006). How default is the default mode of brain function? Further evidence from intrinsic BOLD signal fluctuations. Neuropsychologia 44, 2836–2845.
Friston, K. J., Holmes, A. P., Poline, J. B., Grasby, P. J., Williams, S. C., Frackowiak, R. S., and Turner, R. (1995). Analysis of fMRI time-series revisited. Neuroimage 2, 45–53.
Griefahn, B., Künemund, C., Bröde, P., and Mehnert, P. (2001). Zur Validität der deutschen Übersetzung des Morningness-Eveningness-Questionnaires von Horne und Östberg. Somnologie 5, 71–80.
Gujar, N., Yoo, S. S., Hu, P., and Walker, M. P. (2010). The unrested resting brain: sleep deprivation alters activity within the default-mode network. J. Cogn. Neurosci. 22, 1637–1648.
Gusnard, D. A., Raichle, M. E., and Raichle, M. E. (2001). Searching for a baseline: functional imaging and the resting human brain. Nat. Rev. Neurosci. 2, 685–694.
Hayasaka, S., Phan, K. L., Liberzon, I., Worsley, K. J., and Nichols, T. E. (2004). Nonstationary cluster-size inference with random field and permutation methods. Neuroimage 22, 676–687.
Herrmann, C. S., and Knight, R. T. (2001). Mechanisms of human attention: event-related potentials and oscillations. Neurosci. Biobehav. Rev. 25, 465–476.
Horne, J. A., and Ostberg, O. (1976). A self-assessment questionnaire to determine morningness-eveningness in human circadian rhythms. Int. J. Chronobiol. 4, 97–110.
Horovitz, S. G., Braun, A. R., Carr, W. S., Picchioni, D., Balkin, T. J., Fukunaga, M., and Duyn, J. H. (2009). Decoupling of the brain’s default mode network during deep sleep. Proc. Natl. Acad. Sci. U.S.A. 106, 11376–11381.
Horovitz, S. G., Skudlarski, P., and Gore, J. C. (2002). Correlations and dissociations between BOLD signal and P300 amplitude in an auditory oddball task: a parametric approach to combining fMRI and ERP. Magn. Reson. Imaging 20, 319–325.
Huang, R. S., Jung, T. P., Delorme, A., and Makeig, S. (2008). Tonic and phasic electroencephalographic dynamics during continuous compensatory tracking. Neuroimage 39, 1896–1909.
Kiehl, K. A., Laurens, K. R., Duty, T. L., Forster, B. B., and Liddle, P. F. (2001). Neural sources involved in auditory target detection and novelty processing: an event-related fMRI study. Psychophysiology 38, 133–142.
Kiehl, K. A., Stevens, M. C., Laurens, K. R., Pearlson, G., Calhoun, V. D., and Liddle, P. F. (2005). An adaptive reflexive processing model of neurocognitive function: supporting evidence from a large scale (n = 100) fMRI study of an auditory oddball task. Neuroimage 25, 899–915.
Lavie, N. (2005). Distracted and confused?: selective attention under load. Trends Cogn. Sci. (Regul. Ed.) 9, 75–82.
Liebenthal, E., Ellingson, M. L., Spanaki, M. V., Prieto, T. E., Ropella, K. M., and Binder, J. R. (2003). Simultaneous ERP and fMRI of the auditory cortex in a passive oddball paradigm. Neuroimage 19, 1395–1404.
Linden, D. E., Prvulovic, D., Formisano, E., Vollinger, M., Zanella, F. E., Goebel, R., and Dierks, T. (1999). The functional neuroanatomy of target detection: an fMRI study of visual and auditory oddball tasks. Cereb. Cortex 9, 815–823.
Logothetis, N. K. (2003). The underpinnings of the BOLD functional magnetic resonance imaging signal. J. Neurosci. 23, 3963–3971.
Lustig, C., Snyder, A. Z., Bhakta, M., O’Brien, K. C., McAvoy, M., Raichle, M. E., Morris, J. C., and Buckner, R. L. (2003). Functional deactivations: change with age and dementia of the Alzheimer type. Proc. Natl. Acad. Sci. U.S.A. 100, 14504–14509.
Oken, B. S., Salinsky, M. C., and Elsas, S. M. (2006). Vigilance, alertness, or sustained attention: physiological basis and measurement. Clin. Neurophysiol. 117, 1885–1901.
Persson, J., Lustig, C., Nelson, J. K., and Reuter-Lorenz, P. A. (2007). Age differences in deactivation: a link to cognitive control? J. Cogn. Neurosci. 19, 1021–1032.
Picchioni, D., Fukunaga, M., Carr, W. S., Braun, A. R., Balkin, T. J., Duyn, J. H., and Horovitz, S. G. (2008). fMRI differences between early and late stage-1 sleep. Neurosci. Lett. 441, 81–85.
Portas, C. M., Rees, G., Howseman, A. M., Josephs, O., Turner, R., and Frith, C. D. (1998). A specific role for the thalamus in mediating the interaction of attention and arousal in humans. J. Neurosci. 18, 8979–8989.
Raichle, M. E., MacLeod, A. M., Snyder, A. Z., Powers, W. J., Gusnard, D. A., and Shulman, G. L. (2001). A default mode of brain function. Proc. Natl. Acad. Sci. U.S.A. 98, 676–682.
Rechtschaffen, A., and Kales, A. (1968). A Manual of Standardized Terminology, Techniques and Scoring System of Sleep Stages in Human Subjects. Los Angeles: University of California.
Sämann, P. G., Tully, C., Spoormaker, V. I., Wetter, T. C., Holsboer, F., Wehrle, R., and Czisch, M. (2010). Increased sleep pressure reduces resting state functional connectivity. MAGMA 23, 375–389.
Sämann, P. G., Wehrle, R., Hoehn, D., Spoormaker, V. I., Peters, H., Tully, C., Holsboer, F., and Czisch, M. (2011). Development of the brain’s default mode network from wakefulness to slow wave sleep. Cereb. Cortex 21, 2082–2093.
Seeley, W. W., Menon, V., Schatzberg, A. F., Keller, J., Glover, G. H., Kenna, H., Reiss, A. L., and Greicius, M. D. (2007). Dissociable intrinsic connectivity networks for salience processing and executive control. J. Neurosci. 27, 2349–2356.
Sridharan, D., Levitin, D. J., and Menon, V. (2008). A critical role for the right fronto-insular cortex in switching between central-executive and default-mode networks. Proc. Natl. Acad. Sci. U.S.A. 105, 12569–12574.
Stevens, A. A., Skudlarski, P., Gatenby, J. C., and Gore, J. C. (2000). Event-related fMRI of auditory and visual oddball tasks. Magn. Reson. Imaging 18, 495–502.
Uddin, L. Q., Kelly, A. M., Biswal, B. B., Xavier, C. F., and Milham, M. P. (2009). Functional connectivity of default mode network components: correlation, anticorrelation, and causality. Hum. Brain Mapp. 30, 625–637.
Keywords: arousal, multimodal imaging, sleep deprivation, vigilance, default mode, DMN, fMRI, EEG
Citation: Czisch M, Wehrle R, Harsay HA, Wetter TC, Holsboer F, Sämann PG and Drummond SPA (2012) On the need of objective vigilance monitoring: effects of sleep loss on target detection and task-negative activity using combined EEG/fMRI. Front. Neur. 3:67. doi: 10.3389/fneur.2012.00067
Received: 09 January 2012; Paper pending published: 25 January 2012;
Accepted: 09 April 2012; Published online: 27 April 2012.
Edited by:
Linda J. Larson-Prior, Washington University School of Medicine in St. Louis, USAReviewed by:
Michael W. L. Chee, Duke NUS Graduate Medical School, SingaporeDante Picchioni, Walter Reed Army Institute of Research, USA
Copyright: © 2012 Czisch, Wehrle, Harsay, Wetter, Holsboer, Sämann and Drummond. This is an open-access article distributed under the terms of the Creative Commons Attribution Non Commercial License, which permits non-commercial use, distribution, and reproduction in other forums, provided the original authors and source are credited.
*Correspondence: Michael Czisch, Neuroimaging Research Group, Max Planck Institute of Psychiatry, Kraepelinstr. 2-10, 80804 Munich, Germany. e-mail:Y3ppc2NoQG1waXBzeWtsLm1wZy5kZQ==
†Present address: Helga A. Harsay, Department of Psychology, University of Amsterdam, Amsterdam, Netherlands; Thomas C. Wetter, University Hospital Regensburg, Regensburg, Germany