


- 1Neuroimaging of Epilepsy Laboratory, McConnell Brain Imaging Center, Montreal Neurological Institute and Hospital, McGill University, Montreal, QC, Canada
- 2Imaging and Computer Vision, Corporate Technology, Siemens Corporation, Princeton, NJ, USA
Drug-resistant temporal lobe epilepsy (TLE) and epileptic syndromes related to malformations of cortical development (MCD) are associated with complex hippocampal morphology. The contribution of volume and position to the overall hippocampal shape in these conditions has not been studied. We propose a surface-based framework to localize volume changes through measurement of Jacobian determinants, and quantify fine-scale position and curvature through a medial axis model. We applied our methodology to T1-weighted 3D volumetric MRI of 88 patients with TLE and 78 patients with MCD, including focal cortical dysplasia (FCD, n = 29), heterotopia (HET, n = 40), and polymicrogyria (PMG, n = 19). Patients were compared to 46 age- and sex-matched healthy controls. Surface-based analysis of volume in TLE revealed severe ipsilateral atrophy mainly along the rostro-caudal extent of the hippocampal CA1 subfield. In MCD, patterns of volume changes included bilateral CA1 atrophy in HET and FCD, and left dentate hypertrophy in all three groups. The analysis of curvature revealed medial bending of the posterior hippocampus in TLE, whereas in MCD there was a supero-medial shift of the hippocampal body. Albeit hippocampal shape anomalies in TLE and MCD result from a combination of volume and positional changes, their nature and distribution suggest different pathogenic mechanisms.
Introduction
Growing evidence suggests that abnormalities of brain development are etiological factors contributing to epilepsy. In particular, syndromes in which pathogenic mechanisms involve the temporal lobe may be associated with abnormal hippocampal morphology, identified as atypical shape and positioning. These macroscopic markers of brain maldevelopment, referred to as malrotation, have been reported in high proportions of patients with temporal lobe epilepsy (TLE) and those with malformation of cortical development (MCD) (1–7). Such anomalies may be found in about 10% of healthy controls, and are believed to represent the end of phenotypic spectrum of a normal hippocampal formation (3, 8). In our previous work, we created quantitative models of hippocampal malrotation based on their MRI characteristics (7, 8). These empirically defined models were designed to assess at a global scale hippocampal shifting and rotation with respect to its long axis, and thus only partially captured the complexity of hippocampal morphology.
In this work, we aimed at assessing independently the contribution of volume and position to the overall hippocampal shape in TLE and MCD. To this purpose, we applied our previously developed and validated methods (9, 10), based on spherical harmonic shape descriptors. Our data-driven approach localized variations of volume at a sub-millimetric level through the analysis of Jacobian determinants, and quantified fine-scale local position and curvature through a medial axis model.
Materials and Methods
Subjects
From our database of patients referred for the investigation of drug-resistant epilepsy, we selected patients with MCD (n = 88; 39 males; mean age: 31 ± 9, range: 18–58) and those with TLE (n = 78; 34 males; mean age: 36 ± 10, range: 17–57) who had been examined with the same MRI scanner and in whom hippocampal volumetry was performed. Patients in whom the cortical developmental malformation invaded the hippocampus were excluded. No TLE patient had a mass lesion (tumor, vascular malformation) or traumatic brain injury. The MCD population included patients with focal cortical dysplasia (n = 29; 11 males; mean age: 30 ± 9), heterotopia (n = 40; 19 males; mean age: 31 ± 10), and polymicrogyria (n = 19; 9 males; mean age: 32 ± 8). Focal cortical dysplasia was located outside the temporal lobe in all patients. The heterotopia group included patients with double cortex (n = 11), periventricular nodular heterotopia (n = 26; bilateral in 13, unilateral in 13), and unilateral subcortical heterotopia (n = 3). Lesions of polymicrogyria were bilateral in 16/19 patients (perisylvian in 12, other combinations in 4), and unilateral perisylvian in 3/19.
Demographic and clinical data were obtained through interviews with the patients and their relatives. The diagnosis and localization of the seizure focus was based on a standard clinical evaluation including detailed history, seizure semiology, neurological examination, video-EEG recordings, and MRI evaluation in all patients.
In TLE, the seizure focus was left-sided in 34 patients and right-sided in 44. Sixty-seven patients underwent surgery. Mean ± SD follow-up time was 3.6 ± 3.2 years. We determined post-surgical seizure outcome according to Engel’s modified classification (11) 51 (76%) patients had Class I outcome, 5 (8%) Class II, 7 (10%) Class III, and 4 (6%) Class IV. In MCD patients, the seizure focus was frontal in 15 patients, parietal in 7, temporal in 21, and multilobar or generalized in 37. Five patients presented only with interictal slow activity and three patients had a normal EEG.
The control group consisted of 46 age- and sex-matched (23 males; mean age: 32 ± 12 years, range: 20–56) healthy individuals. The Ethics Committee of the Montreal Neurological Institute and Hospital approved the study and written informed consent was obtained from all participants.
MRI Acquisition and Pre-Processing
Images were acquired on a 1.5T Gyroscan (Philips Medical Systems, Eindhoven, Netherlands) using a 3D T1-fast field echo sequence (TR = 18 ms; TE = 10 ms; NEX = 1; flip angle = 30°; matrix size = 256 × 256; FOV = 256 mm; slice thickness = 1 mm), providing an isotropic voxel volume of 1 mm3. Prior to processing, images underwent automated correction for intensity non-uniformity and intensity standardization (12).
The hippocampus was segmented manually according to our previously published protocol (13). Prior to segmentation, MR images were registered into the MNI ICBM-152 template (14) using nine parameter linear transformation (15). Hippocampal volumes were normalized through a z-transformation relative to the corresponding distribution of healthy controls.
Surface-Based Analysis of Volume
Hippocampal labels were converted to surface meshes and parameterized using spherical harmonics with point distribution model (SPHARM-PDM) (16). The SPHARM-PDM surfaces of each individual were rigidly aligned to a hippocampal template (constructed from the mean surface of controls and patients) using their centroid and the longitudinal axis of the first order ellipsoid (17). To correct for differences in overall head size, each surface was inversely scaled with respect to intra-cranial volume (16). We calculated displacement vectors between each subject’s SPHARM-PDM surface and the template across 1,002 vertices (16). The signed surface normal components of these vectors quantify inward/outward deformations. To compute vertex-wise volume changes, we applied the heat equation to interpolate the vertex-wise displacement vectors within the volume enclosed by the SPHARM-PDM surface (9). The Jacobian determinant J of the resulting dense vector field was projected back onto the surface to quantify growth (J−1 > 0) or shrinkage (J−1 < 0) along the surface normal direction.
Construction of the Medial Axis
According to the SPHARM parameterization (16), the coordinates of a given point on the surface is defined by parameters representing its latitude and longitude (Figure 1A). Varying the latitude from 0 to 180°at the location of the 0°longitude describes a set of points that constitute the prime meridian on a hemisphere. In the same manner, their counterpart points on the opposite hemisphere are obtained by varying the latitude at the 180°longitude. Averaging these two sets of points in a pair-wise fashion yields a mean meridian axis, henceforth called MEMAX, representing a “skeleton” that inherits the point correspondence of the SPHARM-PDM (Figure 1B) (10). For finer analyses, we further resampled points on the MEMAX (Figure 1C) using equiangular subdivisions of the latitude.
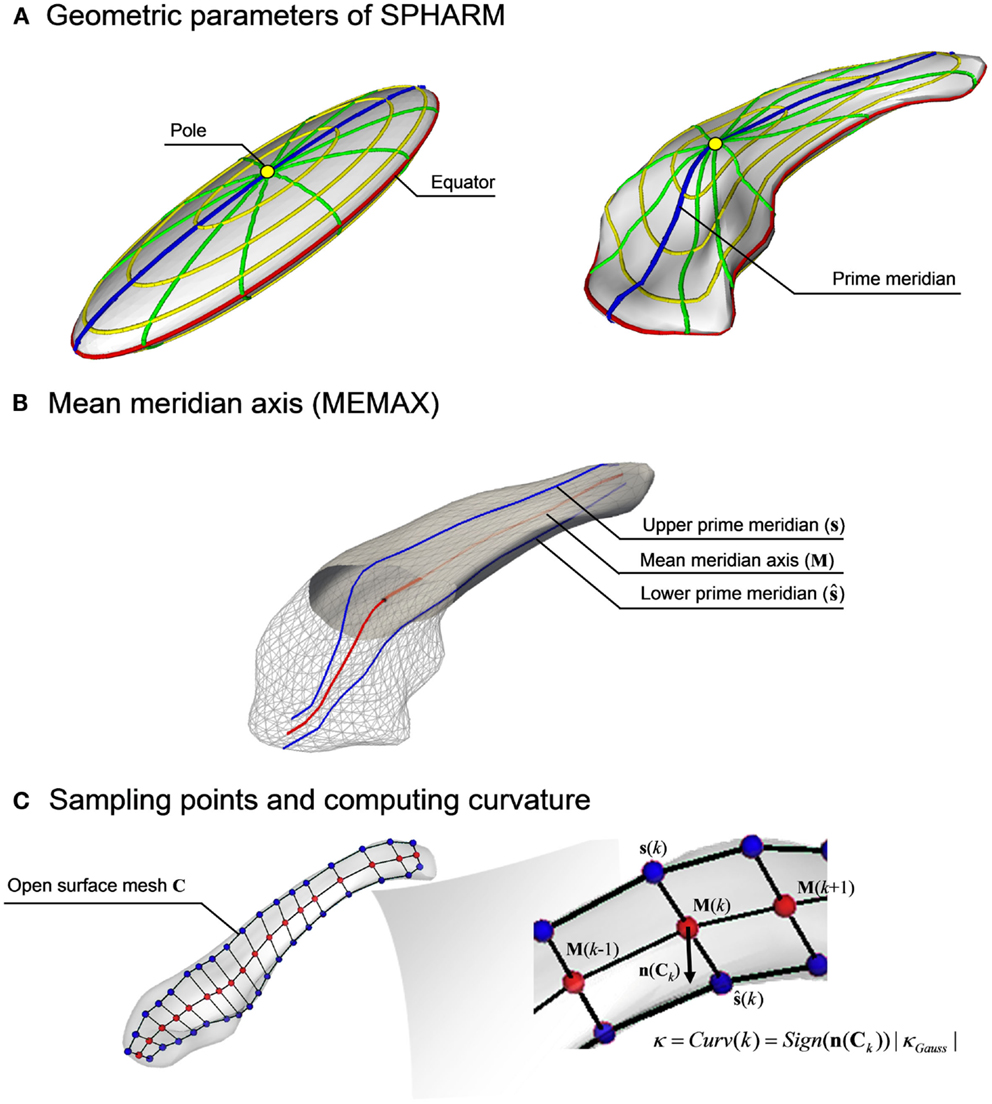
Figure 1. Computation of the mean meridian axis. (A) The SPHARM function defined by two spherical harmonic coefficients, the latitudes (yellow) and the longitudes (green), are mapped on the first degree ellipsoid surface. The prime meridian (blue) defines the longitude when ϕ = 0 or π. After computing spherical basis functions for the hippocampus, the coefficients are repositioned while preserving shape. (B) The geometric mean of the upper (s) and lower (ŝ) prime meridians generates the mean meridian axis (MEMAX, M). (C) Using an equidistant subdivision of the latitudes, K points are sampled on M. After creating an open surface mesh (C), whose boundaries are defined by the prime meridians s and ŝ, the signed Gaussian curvature (κGauss) is computed at each sample point M(k) through the surface normal vector n(Ck).
To measure shifting, we conducted a group-wise comparison for each sample point position in the 3D space. To measure bending, we computed a signed curvature to distinguish convexity from concavity. Specifically, we first created an open surface mesh whose boundaries were defined by the prime meridian and that passes through the MEMAX. We then calculated the signed Gaussian curvature on that surface (the sign is given by the orientation of the normal vectors), and used the values at the points on the MEMAX.
Statistical Analysis
We compared surface-based point-wise volume and Gaussian curvatures between patient groups and controls using vertex-wise Student’s t-tests, and position vectors using point-wise Hotelling T2-test. In TLE, patients were assessed relative to the epileptogenic hemisphere (i.e., ipsilateral and contralateral to the seizure focus) by normalizing vertex-wise volume, curvature, and position vector using a z-transformation with respect to the distribution of the corresponding hemisphere of controls. Analyses were corrected for multiple comparisons using the false discovery rate (FDR) correction at q < 0.05 (18).
To facilitate the anatomical localization of results, we outlined hippocampal subfields on the surface template according to a histological parcellation atlas (19).
Results
Global Volumetry
Based on 2 SD beyond mean absolute volume and inter-hemispheric asymmetry of healthy controls, all TLE patients showed hippocampal atrophy ipsilateral to the seizure focus.
In patients with MCD, volumetric anomalies were present in 51% (45/88) of patients and included both atrophy in 73% (33/45) and hypertrophy in 27% (12/45). Specifically, in focal cortical dysplasia, 34% (10/29) of patients had hippocampal atrophy (ipsilateral to the seizure focus in 80%) and 10% (3/29) had hippocampal hypertrophy (ipsilateral in 1, bilateral in 1, and contralateral in 1). In heterotopia, 43% (17/40) of patients had atrophy (unilateral in 11/17, bilateral in 6/17) and 10% (4/40) had hypertrophy (unilateral in 2, bilateral in 2). In polymicrogyria 32% (6/19) of patients had atrophy (unilateral in 4/6, bilateral in 2/6) and 26% (5/19) had hypertrophy (unilateral in 4, bilateral in 1).
Surface-Based Analysis
Compared to controls, surface-based analysis in TLE localized severe ipsilateral atrophy mainly along the rostro-caudal extent of hippocampal CA1 subfield, with similar effects in patients with left and right epileptic foci (Figure 2A, FDR < 0.0005). Contralateral atrophy was less severe and limited to small portions of CA1 (FDR < 0.05). We found a significant correlation between disease duration and areas of atrophy ipsilateral to the seizure focus (r = −0.4, FDR < 0.05).
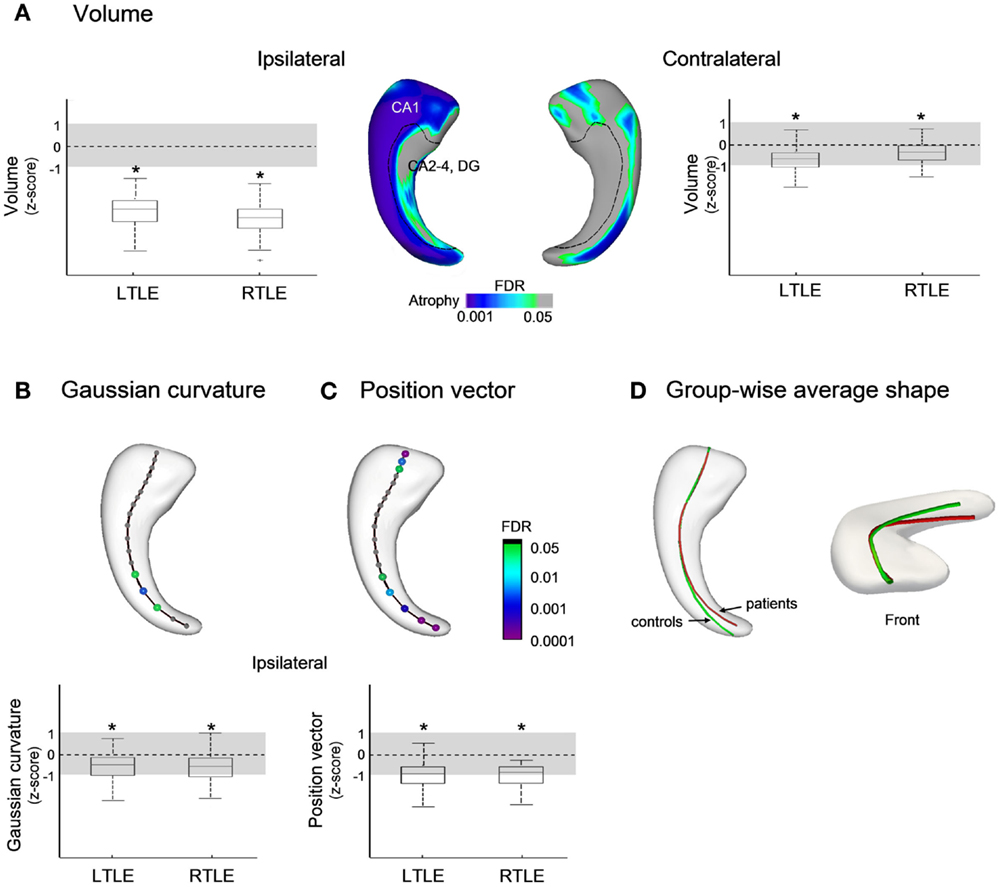
Figure 2. Group comparisons between patients with temporal lobe epilepsy (TLE) and healthy controls for: (A) Volume; (B) Gaussian curvature; and (C) position vectors; in (D), the group-wise mean meridian axis clearly shows the infero-medial shifting of the hippocampus due to increased curvature in its caudal segment. Box-and-whisker plots present group differences between each patient group standardized relative to healthy controls; the solid line indicates the mean and the dotted lines represent ±1 SD from the mean. Color-scales refer to FDR-corrected p-values, and L (left) and R (right) to seizure focus lateralization.
Analysis of the curvature revealed bending of the ipsilateral hippocampal tail toward the mid-sagittal plane (FDR < 0.05 Figure 2B), and the position vectors showed a shift from the supero-lateral to infero-medial direction with similar effects in both TLE groups (FDR < 0.05; Figures 2C,D). No position anomalies were found contralateral to the seizure focus.
In patients with MCD (Figure 3A), we found bilateral symmetric CA1 atrophy in FCD (FDR < 0.05) and HET (FDR < 0.005). Overall, effects of atrophy were smaller in MCD than in TLE (FDR < 0.005). In addition, we found bilateral increased volume corresponding to CA4-DG (FDR < 0.05) in all three MCD groups. There was no correlation between areas of atrophy and disease duration.
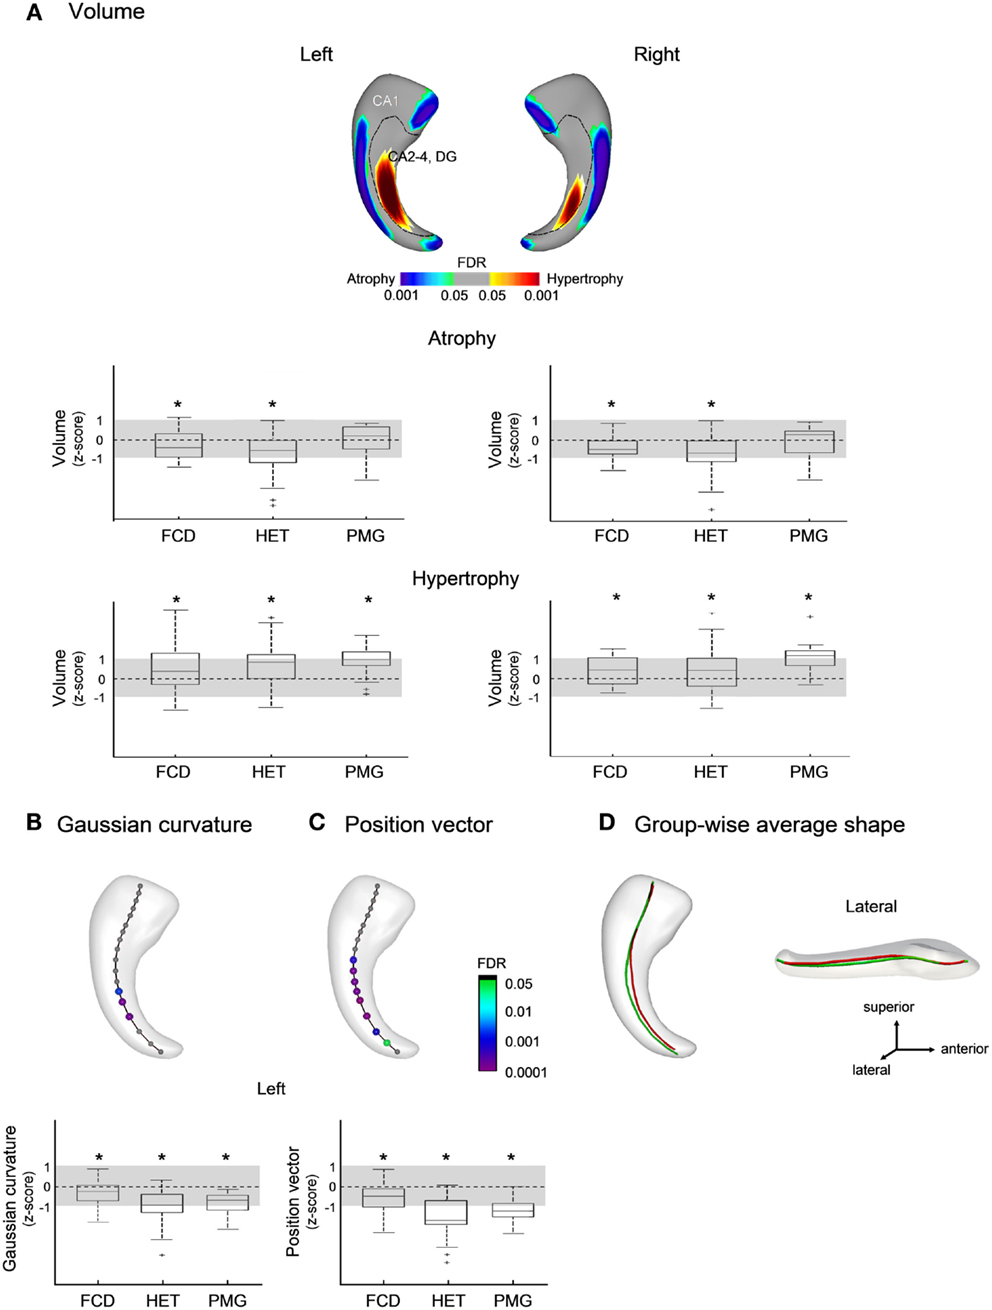
Figure 3. Group comparisons between patients with malformations of cortical development (MCD) and healthy controls for: (A) volume; (B) Gaussian curvature; and (C) position vectors; in (D), the group-wise mean meridian axis shows a flattening (i.e., decrease in curvature) of the body along with a shift from the lateral to medial direction with respect to controls. Box-and-whisker plots present group differences between each patient group standardized relative to healthy controls; the solid line indicates the mean and the dotted lines represent ± 1 SD from the mean. Color-scales refer to FDR-corrected p-values; FCD, focal cortical dysplasia; HET, heterotopia; PMG, polymicrogyria.
The analysis of the medial axis detected anomalies in the left hippocampus only, with flattening (i.e., decrease in curvature) of the body (FDR < 0.001; Figure 3B) along with a shift from the lateral to medial direction compared to controls (FDR < 0.05; Figures 3C,D); the magnitude of these changes were more marked in HET and PMG than in FCD (FDR < 0.05).
Discussion
Our study showed that morphological anomalies of the hippocampus in TLE and MCD result from a combination of volume and positional changes. Nevertheless, their nature and distribution differ between the two cohorts.
Methodological Considerations
Previous surface-based methods attempting to localize hippocampal structural changes have employed thickness-based measurements computed from medial surface or axis models (20–22). These approaches produce symmetrical measurements on facing surfaces and tend to mirror findings to the counterpart regions, challenging biologically plausible interpretations. Indeed, the subfields are not symmetrically distributed with respect to the geometric center of the hippocampus. Moreover, histopathological studies have shown that the magnitude and distribution of neuronal loss in TLE vary both within and across hippocampal subfields (23). Alternatively, by computing vertex-wise displacement vectors between a given object and a template, the SPHARM-PDM approach enables the localization of asymmetrical shape changes (22). The signed surface normal components of these vectors, signifying inward or outward deformation, can be interpreted as volume increase or decrease. A limitation, however, resides in the fact that this metric may also capture co-occurring positional differences, as we have previously shown (8). To obtain an actual metric of growth or shrinkage, we calculated the Jacobian determinants of the vector fields derived from SPHARM-PDM. We could thus detect asymmetrically distributed volume anomalies independent of positional variations, facilitating our interpretation of disease-related morphological anomalies.
A previous work has shown that registration procedure used in SPHARM-PDM may influence spatial metrics such as displacement and local positioning, particularly when dealing with shape variants (24). Notably, the shape descriptors we implemented, including Jacobian determinants to assess local volume and signed curvature to quantify bending, are intrinsically independent of the alignment process, as shown by our previous validation studies (8, 10).
Biological Consideration
In TLE, our analysis localized marked atrophy mainly in the ipsilateral CA1 together with a mild involvement of the other subfields, a finding in agreement with histopathological data (23). We also observed small areas of subtle contralateral atrophy confined to CA1. In MCD, volumetry of the hippocampus has been so far limited to a single study (25), in which proportions of patients displaying atrophy across various subgroups were similar to ours. Here, we refined the characterization of morphological changes by quantifying subregional anomalies and localized atrophy to the CA1 subfield, with a highly similar hemispheric distribution, although the overall extent and effects were smaller than in TLE. The co-existence of hippocampal atrophy and cortical developmental disorders, mainly heterotopias, has been defined as dual pathology (26, 27). The exact nature of this association is not clearly understood, particularly in patients without electroclinical features pointing to the involvement of the mesial temporal lobe. Nevertheless, electrophysiological studies targeting both the MCD lesion and the hippocampus suggest that the latter actively participates to the epileptogenic network and may not be an innocent bystander (28–31). Indeed, when the hippocampus is surgically resected, histopathology shows evidence for neuronal loss in CA1 (32). There is also indication for hippocampal hypoplasia as shown in postmortem analysis of human fetuses with doublecortin deficiency (33). In addition, in animal models of focal cortical malformations using freeze lesions acute changes in CA1 inhibitory network (34) have been followed by atrophy in the chronic phase (35). Nevertheless, the fact that the hippocampus is not the primary epileptogenic tissue in MCD may explain the lesser extent and degree of atrophy in these patients as compared to those with TLE. Further support comes from the lack of progression of atrophy in our MCD patients as opposed to TLE.
A striking difference between our two epilepsy cohorts consisted in the presence of bilateral hippocampal hypertrophy, which was present in about 30% of MCD cases, but absent in TLE. Group analysis localized this anomaly to the medial-most portion of the hippocampus corresponding to CA4-DG. Notably, in a detailed MRI single-case analysis, Montenegro et al. (25) also reported enlarged hippocampi in a few patients with lissencephaly and subcortical band heterotopia. A possible explanation may be that dentate hypertrophy reflects altered gyral morphology with increased number of folds (1, 36). Furthermore, there is evidence from animal models that hypertrophic dentate neurons lead to enlargement of the hippocampus visible to the naked eye (37). Indeed, in a mouse model of cortical dysplasia, mutants with a deletion of the PTEN gene, a tumor suppressor, overactivate the mTOR signaling cascade (37). Normal activity of this pathway is essential for control of cell growth, proliferation, and survival. Its overexpression would induce neuronal hypertrophy and dysmorphism in the hippocampus and the neocortex through various feedback loops. Noteworthy, enhanced mTOR signaling was also identified in hemimegalencephaly (38), and in enlarged dysmorphic neurons and balloon cells of Taylor-type FCD (39) and cortical tubers (40). These hypotheses remain speculative at this moment and future histopathological studies are needed to further clarify the pathophysiology of hippocampal hypertrophy in MCD.
The term malrotation has been coined to describe a set of positioning features characterized by an abnormal rotation of the hippocampus around its long axis (vertical orientation) and a displacement toward the mid-sagittal plane (medial positioning), which were originally evaluated on coronal MRI cuts (1, 3, 7, 41), and later quantified through 3D models (7, 8). Notably, however, a medial shift of the hippocampal centroid may also result from atrophy at the lateral border corresponding to the location of CA1, as shown by our current data. In our earlier analyses, we circumvented this confound by using volume as a nuisance factor (7). Here, position vectors and curvature derived from the mean meridian axis allowed quantifying intrinsic positioning without the need for extra-hippocampal references and revealed that in TLE medial positioning results from bending of the posterior hippocampus ipsilateral to the focus. In MCD, on the other hand, this anomaly was due to supero-medial shift of the left hippocampal body, regardless of the type of the malformation and the lesion side. These findings suggest that mechanisms underlying medial positioning diverge between the two epilepsy syndromes. It is temping to propose that in TLE abnormal positioning may be related to epileptogenic process, whereas in MCD hemisphere-specific vulnerability to injury may be linked to asymmetric brain development (42). In this scenario, abnormalities would occur during a time window of left hemisphere susceptibility when right hemisphere homologs, due to a more advanced stage of development, are relatively spared. Alternatively, the location of the MCD may influence hippocampal morphology through differential connectivity patterns.
Overall, our group-based results suggest that the differential patterns of morphological makeup between TLE and MCD may stem from a complex interplay between genetics, neurogenesis, and epileptogenesis. The methodological framework we propose provides the basis for future individual-based analysis and serial measurements, which may be used as potential clinical and therapeutic diagnostic biomarkers.
Conflict of Interest Statement
The authors declare that the research was conducted in the absence of any commercial or financial relationships that could be construed as a potential conflict of interest.
Acknowledgments
This work was supported by the Canadian Institutes of Health Research (MOP-57840 and MOP-93815).
References
1. Baulac M, De Grissac N, Hasboun D, Oppenheim C, Adam C, Arzimanoglou A, et al. Hippocampal developmental changes in patients with partial epilepsy: magnetic resonance imaging and clinical aspects. Ann Neurol (1998) 44:223–33. doi:10.1002/ana.410440213
2. Bernasconi A. Magnetic resonance imaging in intractable epilepsy: focus on structural image analysis. Adv Neurol (2006) 97:273–8.
3. Bernasconi N, Kinay D, Andermann F, Antel S, Bernasconi A. Analysis of shape and positioning of the hippocampal formation: an MRI study in patients with partial epilepsy and healthy controls. Brain (2005) 128:2442–52. doi:10.1093/brain/awh599
4. Jackson GD, Berkovic SF, Tress BM, Kalnins RM, Fabinyi GC, Bladin PF. Hippocampal sclerosis can be reliably detected by magnetic resonance imaging. Neurology (1990) 40:1869–75. doi:10.1212/WNL.40.12.1869
5. Kuchukhidze G, Koppelstaetter F, Unterberger I, Dobesberger J, Walser G, Zamarian L, et al. Hippocampal abnormalities in malformations of cortical development. Neurology (2010) 74:1575–82. doi:10.1212/WNL.0b013e3181df09b6
6. Raymond AA, Fish DR, Sisodiya SM, Alsanjari N, Stevens JM, Shorvon SD. Abnormalities of gyration, heterotopias, tuberous sclerosis, focal cortical dysplasia, microdysgenesis, dysembryoplastic neuroepithelial tumor and dysgenesis of archicortex in epilepsy. Clinical, EEG and neuroimaging features in 100 adult patients. Brain (1995) 118:629–60. doi:10.1093/brain/118.3.629
7. Voets NL, Bernhardt BC, Kim H, Yoon U, Bernasconi N. Increased temporolimbic cortical folding complexity in temporal lobe epilepsy. Neurology (2011) 76:138–44. doi:10.1212/WNL.0b013e318205d521
8. Kim H, Chupin M, Colliot O, Bernhardt BC, Bernasconi N, Bernasconi A. Automatic hippocampal segmentation in temporal lobe epilepsy: impact of developmental abnormalities. Neuroimage (2012) 59:3178–86. doi:10.1016/j.neuroimage.2011.11.040
9. Kim H, Besson P, Colliot O, Bernasconi A, Bernasconi N. Surface-based vector analysis using heat equation interpolation: a new approach to quantify local hippocampal volume changes. Med Image Comput Comput Assist Interv (2008) 5241:1008–15.
10. Kim H, Mansi T, Bernasconi A, Bernasconi N. Vertex-wise shape analysis of the hippocampus: disentangling positional differences from volume changes. Med Image Comput Comput Assist Interv (2011) 14:352–9.
11. Engel J Jr, Van Ness PC, Rasmussen T, Ojemann LM. Outcome with respect to epileptic seizures. In: Engel J Jr, editor. Surgical Treatment of the Epilepsies. New York: Raven (1993). p. 609–21.
12. Sled JG, Zijdenbos AP, Evans AC. A nonparametric method for automatic correction of intensity nonuniformity in MRI data. IEEE Trans Med Imaging (1998) 17:87–97. doi:10.1109/42.668698
13. Bernasconi N, Bernasconi A, Caramanos Z, Antel SB, Andermann F, Arnold DL. Mesial temporal damage in temporal lobe epilepsy: a volumetric MRI study of the hippocampus, amygdala and parahippocampal region. Brain (2003) 126:462–9. doi:10.1093/brain/awg034
14. Fonov V, Evans AC, Botteron K, Almli CR, McKinstry RC, Collins DL. Unbiased average age-appropriate atlases for pediatric studies. Neuroimage (2011) 54:313–27. doi:10.1016/j.neuroimage.2010.07.033
15. Collins DL, Neelin P, Peters TM, Evans AC. Automatic 3D intersubject registration of MR volumetric data in standardized Talairach space. J Comput Assist Tomogr (1994) 18:192–205. doi:10.1097/00004728-199403000-00005
16. Styner M, Oguz I, Xu S, Brechbühler C, Pantazis D, Gerig G. Statistical shape analysis of brain structures using SPHARM-PDM. In: MICCAI 2006 Opensource Workshop, Copenhagen (2006).
17. Gerig G, Styner M, Jones D, Weinberg DR, Lieberman J. Shape analysis of brain ventricles using SPHARM. In: Mathematical Methods in Biomedical Image Analysis, Kauai (2001). p. 171–8.
18. Benjamini Y, Hochberg Y. Controlling the false discovery rate: a practical and powerful approach to multiple testing. J R Stat Soc B (1995) 57:289–300.
19. Duvernoy HM. The Human Hippocampus: An Atlas of Applied Anatomy. 3rd ed. New York: Springer Verlag (2005).
20. Bouix S, Pruessner JC, Louis Collins D, Siddiqi K. Hippocampal shape analysis using medial surfaces. Neuroimage (2005) 25:1077–89. doi:10.1016/j.neuroimage.2004.12.051
21. Nicolson R, DeVito TJ, Vidal CN, Sui Y, Hayashi KM, Drost DJ, et al. Detection and mapping of hippocampal abnormalities in autism. Psychiatry Res (2006) 148:11–21. doi:10.1016/j.pscychresns.2006.02.005
22. Styner M, Lieberman JA, Pantazis D, Gerig G. Boundary and medial shape analysis of the hippocampus in schizophrenia. Med Image Anal (2004) 8:197–203. doi:10.1016/j.media.2004.06.004
23. Blumcke I, Thom M, Aronica E, Armstrong DD, Bartolomei F, Bernasconi A, et al. International consensus classification of hippocampal sclerosis in temporal lobe epilepsy: a Task Force report from the ILAE Commission on Diagnostic Methods. Epilepsia (2013) 54:1315–29. doi:10.1111/epi.12220
24. Esmaeil-Zadeh M, Soltanian-Zadeh H, Jafari-Khouzani K. SPHARM-based shape analysis of hippocampus for lateralization in mesial temporal lobe epilepsy. In: Electrical Engineering (ICEE), 2010 18th Iranian Conference, Isfahan (2010). p. 39–44.
25. Montenegro MA, Kinay D, Cendes F, Bernasconi A, Bernasconi N, Coan AC, et al. Patterns of hippocampal abnormalities in malformations of cortical development. J Neurol Neurosurg Psychiatry (2006) 77:367–71. doi:10.1136/jnnp.2005.070417
26. Cendes F, Li LM, Andermann F, Watson C, Fish DR, Shorvon SD, et al. Dual pathology and its clinical relevance. Adv Neurol (1999) 81:153–64.
27. Raymond AA, Fish DR, Stevens JM, Cook MJ, Sisodiya SM, Shorvon SD. Association of hippocampal sclerosis with cortical dysgenesis in patients with epilepsy. Neurology (1994) 44:1841. doi:10.1212/WNL.44.10.1841
28. Aghakhani Y, Kinay D, Gotman J, Soualmi L, Andermann F, Olivier A, et al. The role of periventricular nodular heterotopia in epileptogenesis. Brain (2005) 128:641–51. doi:10.1093/brain/awh388
29. Bernasconi A, Martinez V, Rosa-Neto P, D’Agostino D, Bernasconi N, Berkovic S, et al. Surgical resection for intractable epilepsy in “double cortex” syndrome yields inadequate results. Epilepsia (2001) 42:1124–9. doi:10.1046/j.1528-1157.2001.39900.x
30. Fauser S, Sisodiya SM, Martinian L, Thom M, Gumbinger C, Huppertz HJ, et al. Multi-focal occurrence of cortical dysplasia in epilepsy patients. Brain (2009) 132:2079–90. doi:10.1093/brain/awp145
31. Li LM, Cendes F, Watson C, Andermann F, Fish DR, Dubeau F, et al. Surgical treatment of patients with single and dual pathology: relevance of lesion and hippocampal atrophy to seizure outcome. Neurology (1997) 48:437–44. doi:10.1212/WNL.48.2.437
32. Acar G, Acar F, Oztura I, Baklan B. A case report of surgically treated drug resistant epilepsy associated with subependymal nodular heterotopia. Seizure (2012) 21:223–6. doi:10.1016/j.seizure.2011.11.002
33. Kappeler C, Dhenain M, Phan Dinh Tuy F, Saillour Y, Marty S, Fallet-Bianco C, et al. Magnetic resonance imaging and histological studies of corpus callosal and hippocampal abnormalities linked to doublecortin deficiency. J Comp Neurol (2007) 500:239–54. doi:10.1002/cne.21170
34. Ouardouz M, Carmant L. Changes in inhibitory CA1 network in dual pathology model of epilepsy. Channels (Austin) (2012) 6: doi:10.4161/chan.18615
35. Gibbs S, Chattopadhyaya B, Desgent S, Awad PN, Clerk-Lamalice O, Levesque M, et al. Long-term consequences of a prolonged febrile seizure in a dual pathology model. Neurobiol Dis (2011) 43:312–21. doi:10.1016/j.nbd.2011.02.013
36. Thom M, Sisodiya SM, Lin WR, Mitchell T, Free SL, Stevens J, et al. Bilateral isolated hippocampal malformation in temporal lobe epilepsy. Neurology (2002) 58:1683–6. doi:10.1212/WNL.58.11.1683
37. Ljungberg MC, Sunnen CN, Lugo JN, Anderson AE, D’Arcangelo G. Rapamycin suppresses seizures and neuronal hypertrophy in a mouse model of cortical dysplasia. Dis Model Mech (2009) 2:389–98. doi:10.1242/dmm.002386
38. Baybis M, Lynch D, Lee A, Patel A, McKhann G II, Chugani D, et al. Altered expression of neurotransmitter-receptor subunit and uptake site mRNAs in hemimegalencephaly. Epilepsia (2004) 45:1517–24. doi:10.1111/j.0013-9580.2004.16204.x
39. Ljungberg MC, Bhattacharjee MB, Lu Y, Armstrong DL, Yoshor D, Swann JW, et al. Activation of mammalian target of rapamycin in cytomegalic neurons of human cortical dysplasia. Ann Neurol (2006) 60:420–9. doi:10.1002/ana.20949
40. Baybis M, Yu J, Lee A, Golden JA, Weiner H, McKhann G II, et al. mTOR cascade activation distinguishes tubers from focal cortical dysplasia. Ann Neurol (2004) 56:478–87. doi:10.1002/ana.20211
41. Kim H, Bernasconi N, Bernhardt B, Colliot O, Bernasconi A. Basal temporal sulcal morphology in healthy controls and patients with temporal lobe epilepsy. Neurology (2008) 70:2159–65. doi:10.1212/01.wnl.0000313150.62832.79
Keywords: temporal lobe epilepsy, malformations of cortical development, hippocampus, image analysis, shape analysis
Citation: Kim H, Mansi T and Bernasconi N (2013) Disentangling hippocampal shape anomalies in epilepsy. Front. Neurol. 4:131. doi: 10.3389/fneur.2013.00131
Received: 17 June 2013; Accepted: 26 August 2013;
Published online: 11 September 2013.
Edited by:
Emanuela Formaggio, San Camillo Hospital, ItalyReviewed by:
Silvia Kochen, University of Buenos Aires, ArgentinaNigel C. K. Tan, National Neuroscience Institute, Singapore
Copyright: © 2013 Kim, Mansi and Bernasconi. This is an open-access article distributed under the terms of the Creative Commons Attribution License (CC BY). The use, distribution or reproduction in other forums is permitted, provided the original author(s) or licensor are credited and that the original publication in this journal is cited, in accordance with accepted academic practice. No use, distribution or reproduction is permitted which does not comply with these terms.
*Correspondence: Neda Bernasconi, Neuroimaging of Epilepsy Laboratory, McConnell Brain Imaging Center, Montreal Neurological Institute and Hospital, McGill University, 3801 University Street, Montreal, QC H3A 2B4, Canada e-mail:bmVkYUBiaWMubW5pLm1jZ2lsbC5jYQ==