 Elisabetta Soragni
 C. James Chou1†
 Joel M. Gottesfeld
- 1Department of Cell and Molecular Biology, The Scripps Research Institute, La Jolla, CA, USA
- 2Repligen Corporation, Waltham, MA, USA
The genetic defect in Friedreich’s ataxia (FRDA) is the hyperexpansion of a GAA•TTC triplet in the first intron of the FXN gene, encoding the essential mitochondrial protein frataxin. Histone post-translational modifications near the expanded repeats are consistent with heterochromatin formation and consequent FXN gene silencing. Using a newly developed human neuronal cell model, derived from patient-induced pluripotent stem cells, we find that 2-aminobenzamide histone deacetylase (HDAC) inhibitors increase FXN mRNA levels and frataxin protein in FRDA neuronal cells. However, only compounds targeting the class I HDACs 1 and 3 are active in increasing FXN mRNA in these cells. Structural analogs of the active HDAC inhibitors that selectively target either HDAC1 or HDAC3 do not show similar increases in FXN mRNA levels. To understand the mechanism of action of these compounds, we probed the kinetic properties of the active and inactive inhibitors, and found that only compounds that target HDACs 1 and 3 exhibited a slow-on/slow-off mechanism of action for the HDAC enzymes. HDAC1- and HDAC3-selective compounds did not show this activity. Using siRNA methods in the FRDA neuronal cells, we show increases in FXN mRNA upon silencing of either HDACs 1 or 3, suggesting the possibility that inhibition of each of these class I HDACs is necessary for activation of FXN mRNA synthesis, as there appears to be redundancy in the silencing mechanism caused by the GAA•TTC repeats. Moreover, inhibitors must have a long residence time on their target enzymes for this activity. By interrogating microarray data from neuronal cells treated with inhibitors of different specificity, we selected two genes encoding histone macroH2A (H2AFY2) and Polycomb group ring finger 2 (PCGF2) that were specifically down-regulated by the inhibitors targeting HDACs1 and 3 versus the more selective inhibitors for further investigation. Both genes are involved in transcriptional repression and we speculate their involvement in FXN gene silencing. Our results shed light on the mechanism whereby HDAC inhibitors increase FXN mRNA levels in FRDA neuronal cells.
Introduction
Friedreich’s ataxia (FRDA, OMIM 229300) is an autosomal recessive neurodegenerative disorder caused by a GAA•TTC triplet repeat expansion in an intron of the nuclear FXN gene, which encodes the essential mitochondrial protein frataxin (1). Frataxin is involved in the assembly of iron–sulfur clusters, and their transfer to mitochondrial enzymes and components of the electron transport chain [reviewed in Ref. (2)]. Unaffected individuals have between 6 and 30 GAA•TTC repeats, whereas affected individuals have from approximately 70 to more than 1,000 triplets. A small number of patients are compound heterozygous, with one expanded FXN allele and an inactivating point mutation on the second allele. The effect of the GAA•TTC expansion mutation is to reduce expression of frataxin at the level of transcription (3), through the formation of heterochromatin and subsequent gene silencing (4–8). Frataxin insufficiency leads to decreased activity of iron–sulfur cluster enzymes, mitochondrial iron accumulation, and resultant cell death, with the primary sites of pathology being the large sensory neurons of the dorsal root ganglia and the dentate nucleus of the cerebellum (9). Non-neuronal tissues are also involved in the disease. Cardiomyopathy is common among FRDA patients and diabetes is found in 10% of FRDA patients (10, 11). Approximately, 60% of patients succumb to the disease in early adulthood due to cardiomyopathy (12). Currently, there is no approved and effective therapy for this disorder.
The epigenetic basis for transcriptional silencing in FRDA is now well established (5–8, 13, 14). The GAA•TTC repeat expansion is correlated with both increased DNA methylation in the region of FXN intron 1 immediately upstream of the GAA•TTC repeats (6, 7, 15), as well as with reduced histone acetylation and increased histone trimethylation at the FXN promoter (6, 8), and in intron 1 adjacent to the repeats (5–7). A number of hypotheses have been put forward to explain how the GAA•TTC repeats induce heterochromatin formation, but this remains an open question. Attractive hypotheses for induction of silencing include RNA-mediated silencing, where either sense or antisense transcription of the repeats initiates an RNA-induced silencing complex (8). Alternatively, the repeats could form non-B DNA structures, which induce silencing. An extensive literature documents the formation of triplex or “sticky DNA” structures by GAA•TTC repeat DNA (16). Lastly, recent evidence suggests that R-loops can mediate heterochromatin formation and gene silencing (17).
Based on this large body of evidence for the mechanism of gene silencing in FRDA [reviewed in Ref. (13, 18, 19)], it was reasonable to propose epigenetic-modifying compounds as a potential therapeutic strategy for FRDA. In an early study, Sarsero and colleagues (20) tested sodium butyrate for its ability to increase FXN mRNA expression, but only a modest effect was observed. Our laboratory reported a screen of a panel of commercially available histone deacetylase (HDAC) inhibitors in FRDA lymphoblasts and we found that only the benzamide BML-210 [N1-(2-aminophenyl)-N8-phenyloctanediamide] produced a significant increase of FXN mRNA expression in FRDA lymphoblasts (5). Similarly, Festenstein and co-workers have reported that the sirtuin protein deacetylase inhibitor nicotinamide (vitamin B3) also increases FXN mRNA levels in FRDA lymphoblasts, in a FRDA mouse model (14), and recently in circulating lymphocytes from nicotinamide-treated patients (21).
Our laboratory identified a 2-aminobenzamide HDAC inhibitor, 4b [N1-(2-aminophenyl)-N7-phenylheptanediamide], which was shown to act on FRDA primary lymphocytes to significantly increase acetylation of H3K14, H4K5, and H4K12 in the FXN upstream GAA•TTC region and to significantly increase FXN mRNA levels (5). Further development of this family of 2-aminobenzamide HDAC inhibitors identified other compounds, which have shown efficacy in FRDA patient cells and in mouse models (22–27). These compounds produce significant short-term increases in histone acetylation and FXN mRNA and frataxin protein expression in FRDA primary lymphocytes and brain and heart tissues of FRDA KIKI mice (23, 26), and have also shown efficacy in a transgenic mouse model for FRDA (27). More recently, we showed efficacy of a 2-aminobenzamide HDAC inhibitor (HDACi 109) in neuronal cells derived from FRDA-induced pluripotent stem cells (iPSCs) (28). This compound was taken into a Phase Ib clinical trial in FRDA patients, where drug treatment lead to increases in FXN mRNA and histone acetylation at the FXN gene in peripheral blood mononuclear cells. Interestingly, the concentration of drug required to induce epigenetic changes in neuronal cells is comparable to the exposure in patients required to observe increases in histone acetylation and gene activation. While the 2-aminobenzamides are promising therapeutics for FRDA, further development of this compound class will be necessary to identify molecules for chronic use. Here, we explore the mechanism of action of this compound class and our efforts to identify improved molecules for future clinical study.
Materials and Methods
Materials
Recombinant human HDAC1 and HDAC3/NCoR2, expressed in baculovirus, were purchased from BPS Bioscience (San Diego, CA, USA). The HDAC inhibitors 109, 136, 3, 233, 966, and Click-1 were synthesized as previously described (25, 26, 29–31).
HDAC Activity Assays
The deacetylase activities of HDACs 1 and 3 were measured by assaying enzyme activity using Lys-C peptidase and the synthetic substrate acetyl-Lys(Ac)-AMC, as previously described (22). The HDAC enzymes produce deacetylated lysine-AMC, which can be cleaved by the peptidase to generate free fluorogenic 4-methylcoumarin-7-amide (MCA). MCA fluorescence is read with an excitation wavelength of 370 nm and emission wavelength of 460 nm, using a Tecan M200 96 well-plate reader (San Jose, CA, USA). All HDAC assays were performed in 96 well, non-binding plates (Greiner Bio-one, NC, USA) in 50 mM Tris–HCl buffer (pH 8.0), containing 137 mM NaCl, 1 mM MgCl2, 2.7 mM KCl, and 0.1 mg mL−1 bovine serum albumin at ambient temperature. To determine inhibition mechanisms and associated kinetic values, a series of enzyme progression curves for HDACs 1 and 3, at different concentrations of inhibitors, were generated by adding 100 ng of each enzyme into separate reaction mixtures containing 50 μM acetyl-Lys(Ac)-AMC substrate (five times the Km) and 2 mU of Lys-C peptidase developer for a period of 1 h. Data from each progression curve, at different inhibitor concentrations, were fit using the non-linear regression program KaleidaGraph to the integrated rate equation for slow-binding inhibitors:
where [F] is the amount of MCA fluorophore generated, represented in arbitrary fluorescence units (AFU, r), which is proportion to the deacetylated substrate at time t. v0 and vs are the initial and the final steady-state velocities, respectively. kobs is the apparent first-order rate constant obtained by the best fit to the data. The kobs values were then plotted against the inhibitor concentrations for which each kobs value was obtained. For mechanism 1 (see below), the relationship between kobs and the inhibitor concentration is linear:
and
For mechanism 2, the relationship between kobs and the inhibitor concentration is hyperbolic:
and
where is the stable complex forming constant and Ki is the overall final inhibitory constant for the entire process.
Derivation of FRDA Neuronal Cells, qRT-PCR, and Western Blotting
All methods for iPSC derivation (32) and neuronal differentiation (28, 33) have been presented. Two patient fibroblast lines (GM03816 and GM04878 from the Coriell repository) and one unaffected fibroblast line (GM08333 from the Coriell repository) were used to derive iPSCs and neurons (as approved by the University of California, San Diego, Human Research Protection Program, Embryonic Stem Cell Research Oversight Committee, project #110235ZO). Quantitative RT-PCR was performed as described (28), with the following primer pairs:
FXN: 5′-CAGAGGAAACGCTGGACTCT-3′ and 5′-AGCCAGATTTGCTTGTTTGG-3′
HDAC1: 5′-CCGCATGACTCATAATTTGC-3′ and 5′-GGTCATCTCCTCAGCATTGG-3′
HDAC2: 5′-CGCATGACCCATAACTTGC-3′ and 5′-TGTCATTTCTTCGGCAGTGG-3′
HDAC3: 5′-GTATGAAGTCGGGGCAGAGA-3′ and 5′-GGCTGGAAAAGGTGCTTGTA-3′
PCGF2: 5′-AGCATCAGGTCTGACAAAACAC-3′ and 5′-GCCGCCGTTTCATCTCATC-3′
H2AFY2: 5′-GCGGCAGTCATTGAGTACCTG-3′ and 5′-CAAGATGTGTCTCGGGGCTAT-3′
Data were normalized to RNA concentration and p values calculated using the t-test. Western blotting was performed as described (28), with antibodies to HDACs 1, 2, and 3 from Abcam (ab7028, ab7029, ab7030, respectively), used at a dilution of 1:5000. RNA polymerase II signal was used as a recovery standard and antibodies against RNA polymerase II were purchased from Millipore (05-952) and used at a dilution of 1:2000. Protein concentrations were determined with the BCA assay (Thermo Scientific).
siRNA-Mediated Down-Regulation of HDACs 1, 2, and 3
siRNAs were purchased from Life Technologies (HDAC1 siRNA ID # 120418, HDAC2 siRNA ID # 120208, HDAC3 siRNA ID #120349). Neuronal cells were allowed to differentiate for 10 days in Neurobasal A medium supplemented with N2 and B27 (all from Life Technologies) before addition of siRNAs to a final concentration of 12 nM and lipofectamine RNAiMAX transfection reagent (Life Technologies). The next day media was changed and cells were allowed to recover for another 24 h. At day 12 of differentiation, another round of siRNA transfection was performed as above. Cells were collected for qRT-PCR and western blotting analyses 96 h after the first siRNA treatment.
Chromatin Immunoprecipitation
Chromatin immunoprecipitation (ChIP) is described in detail in Soragni et al. (28). The antibodies used in this study are the same as the ones indicated in the western blotting section, each used at a concentration of 5 μg mL−1. Samples were quantified in triplicate by real-time PCR using the standard curve method. The DNA recovery for each region is expressed as the ratio to the DNA recovery of GAPDH coding region. The primers used were:
FXN promoter: 5′-CCCCACATACCCAACTGCTG-3′ and 5′-GCCCGCCGCTTCTAAAATTC-3′
UPGAA: 5′-GAAACCCAAAGAATGGCTGTG-3′ and 5′-TTCCCTCCTCGTGAAACACC-3′
DOWNGAA: 5′-CTGGAAAAATAGGCAAGTGTGG-3′ and 5′-CAGGGGTGGAAGCCCAATAC-3′
p21(CDKN1A): 5′-GCGTTCACAGGTGTTTCTGC-3′ and 5′-ACATCCCGACTCTCGTCACC-3′
MYC promoter: 5′-TGCGATGATTTATACTCACAGG-3′ and 5′-CTCCCTCTCAAACCCTCTCC-3′
GAPDH: 5′-CACCGTCAAGGCTGAGAACG-3′ and 5′-ATACCCAAGGGAGCCACACC-3′
Microarray Analysis
Eight-day-old neurons were treated with DMSO or 10 μM 109, 966, or 233 for 24 h. RNA purification, labeling, and hybridization to Illumina HT-12 v4 arrays (see: http://www.illumina.com/products/humanht_12_expression_beadchip_kits_v4.html) were performed as previously described (32). The HT-12 array targets more than 31,000 annotated genes and splice variants, with more than 47,000 probes [derived from the National Center for Biotechnology Information (NCBI) Reference Sequence (RefSeq) Release 38, November 7, 2009]. After normalization, genes differentially expressed between the DMSO groups (three replicates) and the 109-treated groups (three replicates) were identified with a Student’s t-test at a significance level of p < 0.01 (uncorrected p value). Genes with expression level changes greater than 2 in the 109 groups and smaller that 1.5 in the 233 or 966 groups (one replicate per compound) were then subjected to functional annotation analysis via the Database for Annotation, Visualization, and Integrated Discovery (DAVID). Illumina probes were converted to gene symbols using DAVID gene ID conversion tool. Microarray data are deposited in the Gene Expression Omnibus as accession number GSE65399.
Results
Isotype Selectivity for HDAC Inhibitors That Increase FXN Gene Expression in FRDA Cells
We previously described a series of 2-aminobenzamide HDAC inhibitors that have differential inhibitory activities against members of the class I HDAC enzymes (25, 26). We synthesized a series of focused chemical libraries to provide diversity in potency, selectivity, and pharmacologic properties with the aim of developing a pharmaceutical agent for the treatment of FRDA. The general structure exemplified by HDACi 106 (Figure 1) shows the salient features of the pimelic 2-aminobenzamide family: the solvent accessible or cap group (left ring), linker group (five methylenes), and zinc-binding group (2-aminophenyl). By analogy to the hydroxamate HDAC inhibitors for which co-crystal structural information has been obtained (34, 35), and the recent crystal structure of HDAC3 (36), the right side of the molecule interacts with the Zn-containing active site of HDAC enzymes while the left side is positioned to interact with protein surface residues distant from the active site. Substitution at the 4-position of the 2-aminobenzamide ring with fluorine increases selectivity for HDAC3 inhibition by decreasing potency to inhibit HDAC1/2 (26, 37). Large substitutions at the 5-position, such as a phenyl or thiophene increase selectivity for HDAC1/2 over HDAC3 (25, 29).
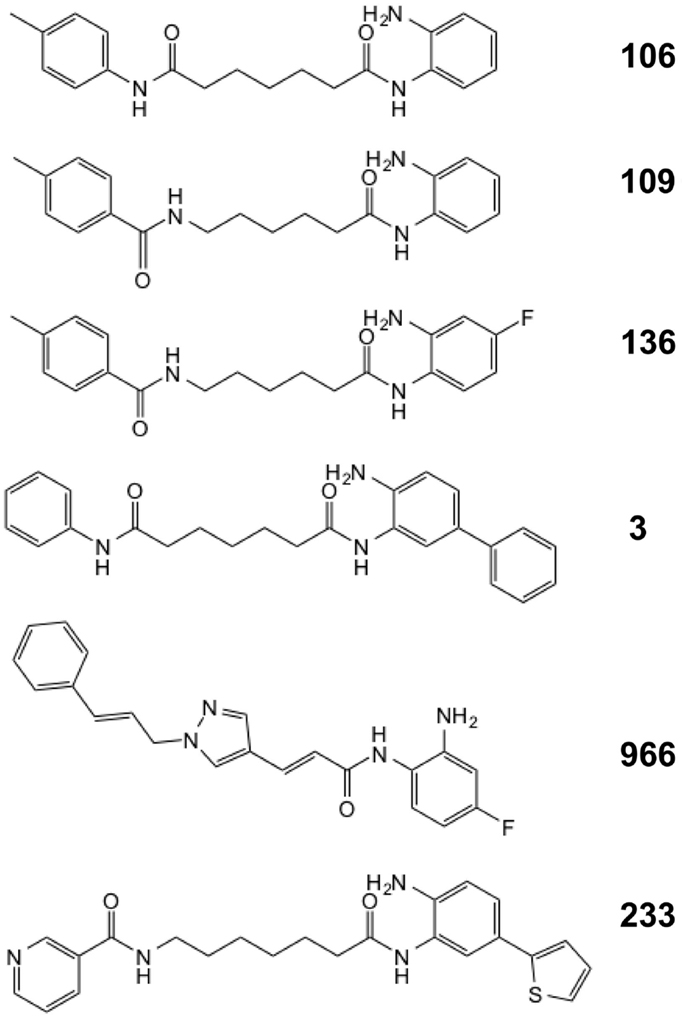
Figure 1. Structures of the HDAC inhibitors.
In recent studies, we found that only compounds that target each of the class I HDACs (HDACs 1, 2, and 3) are potent activators of FXN gene expression in iPSC-derived FRDA neuronal cells (28). To further explore the relationship between HDAC isotype selectivity and FXN gene expression, we focus on three compounds, 109 [N-(6-(2-aminophenylamino)-6-oxohexyl)-4-methylbenzamide; (26, 28)], 136 [N-(6-(2-amino-4-fluorophenylamino)-6-oxohexyl)-4-methylbenzamide; (26)], and 3 [N1-(4-aminobiphenyl-3-yl)-N7-phenylheptanediamide; (25)]. Compound structures are shown in Figure 1 and IC50 and Ki values for inhibition of HDACs 1 and 3 are shown in Table 1. While HDACi 109 is a potent inhibitor of both enzymes, compound 136 is much less potent than 109 with a slight selectivity for HDAC3 and 3 is a selective inhibitor for HDAC1 (25, 26).
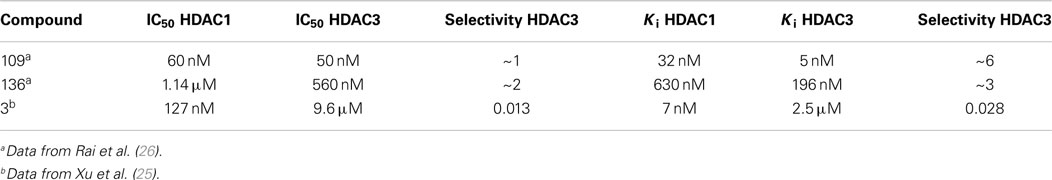
Table 1. Inhibition constants, IC50, and Ki values for HDAC inhibitors and HDACs 1 and 3.
Figure 2 presents the results of qRT-PCR analysis of FXN mRNA levels after incubation of FRDA iPSC-derived neurons with each of the three HDACi for 24 h. As expected from previous studies with other isotype selective compounds (28), only HDACi 109 is a potent inducer of FXN gene expression in these cells, while compounds 136 and 3 had either no effect (3) or only a modest effect (136) on FXN mRNA levels. None of these compounds have pronounced effects on FXN gene expression in cells from unaffected individuals (25, 26, 28). These findings are also similar to our results with HDACi 966 [(E)-N-(2-amino-4-fluorophenyl)-3-(1-cinnamyl-1H-pyrazol-4-yl)acrylamide; ~30-fold selectivity for HDAC3 over HDAC1/2) (37)] and 233 [N-(2-amino-5-(2-thienyl)phenyl)-7-nicotinoylamino-heptanamide; >200-fold selectivity for HDAC1 over HDAC3 (30)]. We conclude that simultaneous inhibition of HDACs 1 and 3 is necessary for reactivation of FXN gene expression in the neuronal cell model.
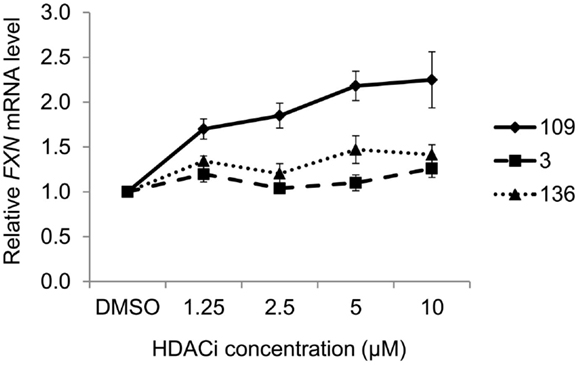
Figure 2. Effect of HDAC inhibitors on FXN mRNA levels in neuronal cells. Quantitative RT-PCR analysis of FXN expression in 16-day-old FRDA neurons after 24-h treatment with HDAC inhibitors 109, 136, and 3 at varying concentrations. FXN mRNA levels were normalized to total RNA concentration. Signals from DMSO-treated samples were arbitrarily set to 1. Error bars = SEM of triplicate measurements.
In a previous study (22), we analyzed the mechanism of enzyme inhibition for HDACi 106 for both HDAC1 and HDAC3-NCoR. Compounds 106 and 109 are constitutional isomers of each other, where the orientation of the “left” amide linkage is reversed in the two molecules (Figure 1). We previously reported that compound 106 is a slow-on/slow-off inhibitor (22). There are two common mechanisms for slow-on/tight-binding inhibitors, as shown below. Mechanism 2 differs from mechanism 1 in that a stable enzyme-inhibitor complex (EI*) is formed, whereas no such stable intermediate is formed in mechanism 1 (38). The equations describing these mechanisms, and the derivation of inhibition constants, on-rates, and off-rates from progression curve HDAC inhibition assays, are described above. Briefly, for mechanism 1, the relationship between kobs and the inhibitor concentration is linear, whereas for mechanism 2, the relationship between kobs and inhibitor concentration is hyperbolic. In contrast to these mechanisms, a fast-on/fast-off competitive inhibition mechanism is best described by a plot of vi/v0 against inhibitor concentration, where vi and v0 are the reaction velocities (deacetylation rates) in the presence or absence of the inhibitor, respectively.
Mechanism 1
Mechanism 2
IC50 determinations showed time-dependence for inhibition for HDAC1 109 with both HDAC1 and HDAC3-NCoR, indicating a slow-on mechanism (26). From kinetic measurements, we showed that 109 is a slow-on/slow-off inhibitor of both enzymes, but the on-rate of 109 is faster for HDAC1 than for HDAC3/NCoR. Compound 109 has a Ki of 32 nM for HDAC1 and a Ki of 5 nM for HDAC3/NCoR2, resulting in an approximately 6-fold selectivity for HDAC3 over HDAC1 (Table 1). Kinetic constants for 109 are provided in Table 2. Plots of kobs versus inhibitor concentration are provided in Figures S1–S3 in Supplementary Material for HDACi 109, 136, and 3, respectively. Plots of kobs versus inhibitor concentration for HDACi 109 with either HDAC1 or HDAC3-NCoR are best fit by the equation for mechanism 2, indicating a stable EI* complex is formed with both enzymes. In other words, 109 is a slow-on/tight-binding inhibitor of both enzymes.
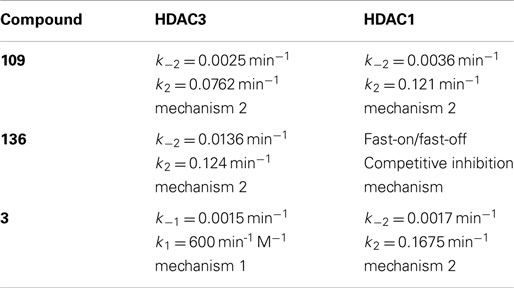
Table 2. Inhibition constants for benzamide HDAC inhibitors.
In IC50 determinations, compound 136 shows a time-dependent inhibition of HDAC3/NCoR, where the IC50 against HDAC3/NCoR decreases from ~17 μM to 560 nM over a period of 3 h; however, no time-dependent inhibition of HDAC1 was observed with compound 136 (26). Kinetic measurements (Table 2; Figure S2 in Supplementary Material) showed that compound 136 is a fast-on/fast-off, competitive inhibitor of HDAC1 with Ki of 630 nM, whereas 136 is a slow-on/slow-off, tight-binding inhibitor of HDAC3/NCoR with Ki of 196 nM, resulting in a ~3-fold selectivity for HDAC3 over HDAC1, following inhibition mechanism 2 only for HDAC3 (Figure S2 in Supplementary Material). The competitive inhibition mechanism for 136 with HDAC1 is similar to the inhibition mechanism for SAHA and other hydroxamate HDAC inhibitors that fail to activate FXN gene expression (5, 22). Appending a phenyl group at the 5-position of the benzamide ring of HDACi 106 (22) resulted in compound 3, with increased selectivity for HDAC1/2 over HDAC3 (25). HDACi 3 has a ~75-fold preference for HDAC1 over HDAC3 comparing IC50 values and a ~350-fold preference for HDAC1 over HDAC3 from Ki measurements (Table 1). Similar to 109 and 136, the kinetic data for 3 and HDAC1 (Table 2) are best fit to a slow-on/slow-off inhibition mechanism 2, whereas the kinetic data showed that HDACi 3 inhibits HDAC3 via mechanism 1, where no stable complex is formed (Figure S3 in Supplementary Material). We thus conclude that compounds that are potent activators of FXN gene expression in FRDA cell models share a common property of inhibition of class I HDACs through inhibition mechanism 2 and compounds that are inactive in FXN gene expression assays fail to inhibit either HDAC1 or HDAC3 by this mechanism. This suggests that stable target engagement is a requirement for activation of FXN gene expression and that inhibition of both HDAC1 and HDAC3 is required for FXN gene reactivation.
Effects of siRNA Gene Silencing on FXN mRNA
If this latter assertion is correct, then down-regulation of class I HDAC enzyme levels in neuronal cells by siRNA methods should yield a similar result as obtained with small-molecule inhibitors. Figure 3 shows the effect of siRNA targeting each of the class I HDACs with validated siRNAs, at both the mRNA level (Figure 3A) and protein levels (Figure 3B). While siHDAC2 and siHDAC3 reduce the mRNAs for their cognate enzymes by greater than 70% compared to a control, scrambled siRNA, siHDAC1 was less active, achieving only 30% knockdown. Curiously, siHDAC2 also caused a non-significant reduction in HDAC3 mRNA levels (also seen at the protein level, Figure 3B), but not to the extent of HDAC3 knockdown. We next monitored the effects of these siRNAs at the level of their cognate proteins by western blotting with well-established antibodies [see Materials and Methods and Ref. (28)]. Each siRNA had significant effects on enzyme levels, with clear specificity for the targeted enzyme. Only siHDAC2 appeared to also down-regulate HDAC3 as well as HDAC2, as found for mRNA levels. With these results in hand, we monitored the levels of FXN mRNA in knockdown neuronal cells. We find that siHDAC1 and siHDAC3 were potent inducers of FXN gene expression (Figure 3C), although FXN up-regulation with siHDAC3 treatment did not reach statistical significance (p value = 0.09). In contrast, siHDAC2 did not increase FXN mRNA to the extent observed with the other siRNAs. Previous studies in various systems have pointed to differences between small-molecule inhibition and protein ablation in terms of biological outcome (39). Removing a particular HDAC enzyme from the cell will naturally affect its interaction partners, many of which are other HDACs or components of shared co-repressor complexes (40). Thus, it is not surprising that down-regulation of either HDAC1 or HDAC3 can result in potent increases in FXN gene expression in FRDA cells, pointing again to the involvement of the class I HDACs in GAA•TTC repeat-mediated FXN gene repression.
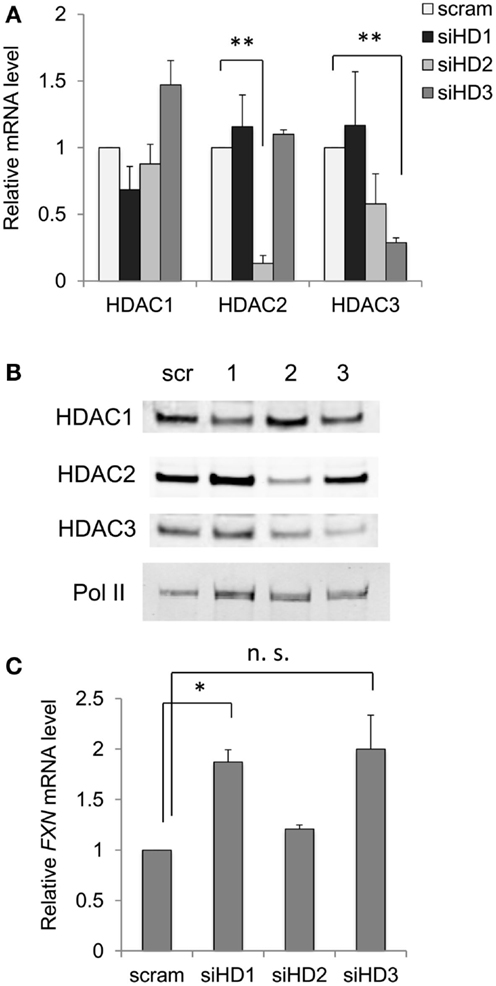
Figure 3. Effects of down-regulation of HDAC enzyme levels by siRNA on FXN mRNA. (A) Effects of siRNAs to HDACs 1–3 on the mRNA levels for each HDAC enzyme in FRDA neuronal cells. Quantitative RT-PCR was used to determine mRNA levels, with each mRNA arbitrarily set to 1 in the presence of a scrambled siRNA (scram). Error bars = SEM of duplicate biological experiments, quantified in triplicate. **p < 0.01. (B) Western blots for HDAC1, HDAC2, HDAC3, and RNA polymerase II (protein recovery standard), after treatment with a scrambled (Scr) siRNA, or siRNAs to HDACs 1–3 as indicated at the top of the figure. One example is shown, but the experiment was performed twice. (C) FXN mRNA levels were determined in FRDA neuronal cells by qRT-PCR after treatment with scrambled (scram) or siRNAs to HDAC 1–3, as indicated (siHD1-3). Error bars = SEM of duplicate biological experiments, quantified by qRT-PCR in triplicate. *p < 0.05. n.s., not significant, see text.
Localization of HDAC Enzymes on the FXN Gene
To ask whether the class I HDACs interact directly with the FXN gene in FRDA neuronal cells, we performed ChIP studies. Our previous ChIP studies clearly showed increases in histone acetylation along the FXN gene after incubation with HDAC inhibitors that increase FXN gene expression (5, 28). We also found that hydroxamates such as SAHA and TSA that are without effect on FXN gene expression also failed to increase acetylation of histones H3 and H4 at the FXN gene locus in lymphoid cells (5), and isotype-selective HDACi allowed us to identify lysines 9 and 27 of histone H3 as critical residues for FXN reactivation (28). In contrast to these clear results, ChIP studies consistently failed to provide evidence for localization of class I HDACs either upstream or downstream of the GAA•TTC repeats (Figure 4). Since these repeats are ubiquitous in the human genome, it is not possible to assess HDAC enzyme occupancy at the FXN repeats by ChIP, so it is conceivable that these enzymes do localize with the repeats. Nonetheless, in these experiments, we attempted to shear chromatin fragments to lengths that would include the repeats when probing with primer sets either upstream or downstream from the repeats (28, 32). These findings are consistent with a transitory interaction between class I HDACs and FXN gene chromatin or perhaps indicate an indirect mechanism of action. The increase in histone acetylation that we see upon HDACi treatment (5, 28) can be a direct effect of inhibition of HDAC complexes residing on the FXN gene, or a consequence of gene reactivation via a different mechanism.
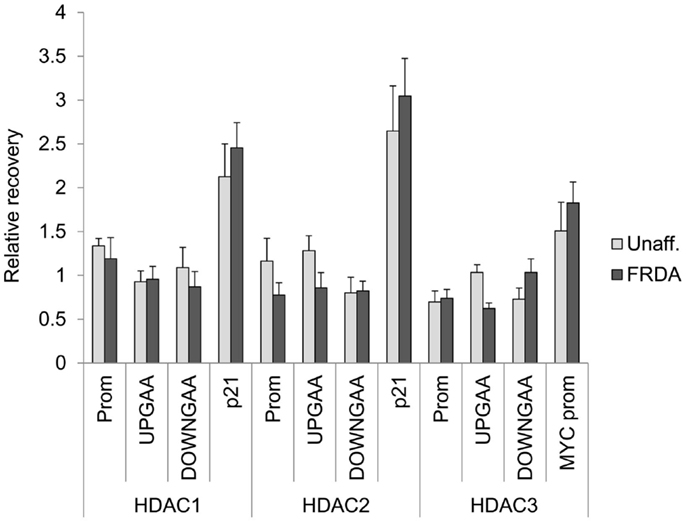
Figure 4. Class I HDACs are not detected on the FXN gene in neuronal cells. ChIP was performed on 16-day-old neurons with antibodies against HDAC1, HADC2, and HDAC3. The region of the promoter (Prom), upstream (UPGAA), and downstream (DOWNGAA) of the GAA•TCC repeats on the FXN gene were interrogated by qPCR. Data are plotted as enrichment over the DNA recovery of the GAPDH coding region. The recovery of CDKNA1 (p21) promoter and MYC promoter are shown as positive controls.
Do HDAC Inhibitors Act Directly on the FXN Gene or through Different Genes?
While increased histone acetylation of FXN chromatin on treatment with our HDAC inhibitors suggests that FXN gene chromatin is the direct target of these compounds, an alternative hypothesis for a mechanism of action of our HDAC inhibitors is that the active molecules cause a change in expression of a gene or set of genes that in turn regulate FXN gene expression. To assess this possibility, we treated FRDA neuronal cells with compounds 109, 233, and 966 (10 μM for 24 h) and then analyzed global gene expression with Illumina microarrays. We established by qRT-PCR that HDACi 109 did indeed up-regulate FXN mRNA while the other two compounds did not [data not shown, but see Figure 2 and Ref. (28)]. We interrogated the microarray data first for genes that are specifically up or down-regulated by HDACi 109, with a p value <0.01, and assembled a list of 1,216 such genes (661 genes are up-regulated and 555 genes are down-regulated; Table S1 in Supplementary Material). Functional annotation clustering of these genes using the DAVID, identified groups related to transcription and nuclear processes, apoptosis, and mitochondrial function (not shown). We then selected only genes that were up-regulated or down-regulated by at least 2-fold and subtracted from this list genes whose expression increased or decreased more than 1.5-fold, upon treatment with HDACi 233 or HDACi 966. This resulted in a final list of 88 genes of which 51 were uniquely up- and 37 uniquely down-regulated by 109 (Table S2 in Supplementary Material). We then interrogated this final list for genes that might be involved in chromatin structure or gene expression using DAVID as above. Table 3 provides a list of 12 such genes, identified by functional annotation clustering, although non-significantly enriched in the 88 gene list. Two of these genes appeared to be notable to us, namely histone H2A family member Y2 (H2AFY2) and Polycomb group ring finger 2 (PCGF2). Each of these genes is down-regulated selectively by HDACi 109 but not by the other HDACi that fail to up-regulate FXN mRNA. H2AFY2 encodes a macroH2A protein that has been implicated in X chromosome inactivation, gene repression, and genomic imprinting [reviewed in Ref. (41)]. PCGF2 is a negative regulator of developmentally important genes, and specifically involved in H3K27 methylation-mediated gene repression [reviewed in Ref. (42)]. To validate the microarray data, we performed qRT-PCR for H2AFY2 and PCGF2 mRNAs with RNA from neuronal cells that were treated with each of the three HDAC inhibitors used in the microarray study. Figure 5A shows that only compound 109 caused a significant decrease in expression of both H2AFY2 and PCGF2. We then asked if these results could be reproduced with a second series of 4- and 5-substituted 2-aminobenzamides, namely, HDACi 136 and 3. Indeed, only an active compound similar to 109 (Click-1, see below) was able to significantly down-regulate H2AFY2 and PCGF2 gene expression (Figure 5B), as predicted from the microarray data and results with HDACi 966 and 233. While HDACi 136 was moderately active at 10 μM concentration (not shown), it was inactive at lower concentrations and not as active as HDACi 109 and Click-1 in down-regulating expression of these two genes. Future studies will need to address whether these two proteins, macroH2A and Polycomb group ring finger 2 are indeed directly involved in FXN gene expression in FRDA neuronal cells. However, the present data provide a correlation between HDACi 109 treatment, up-regulation of FXN, and down-regulation of these two gene products.
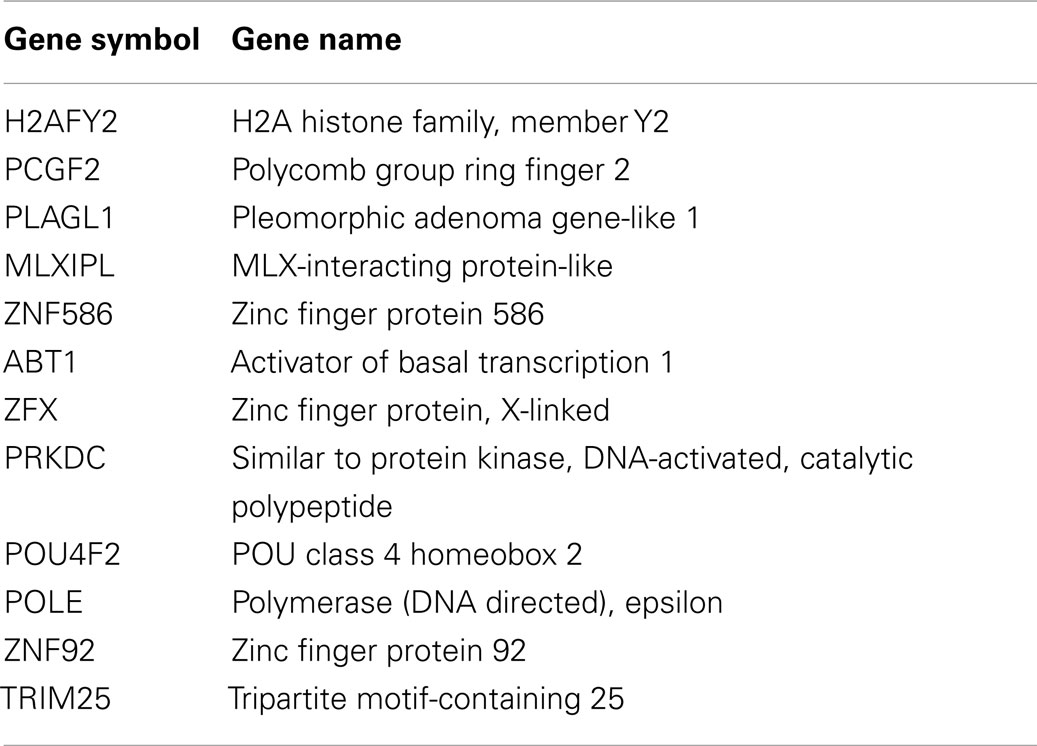
Table 3. List of genes uniquely regulated by 109 and involved in gene expression or chromatin structure.
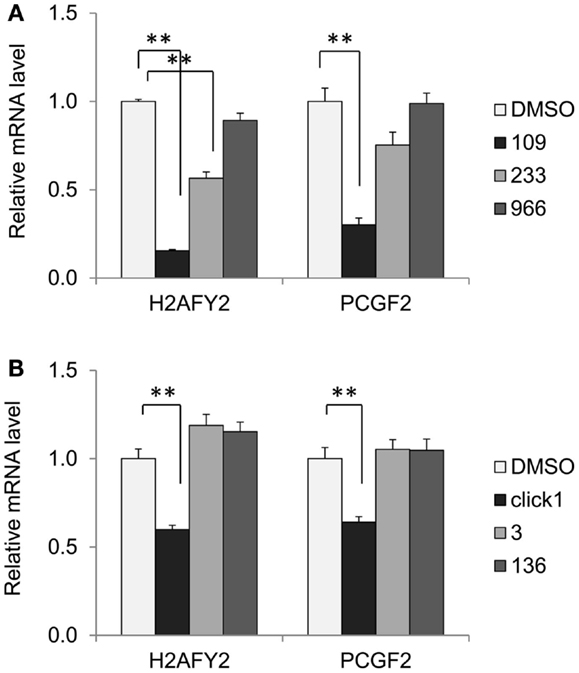
Figure 5. HDACi 109 down-regulates genes involved in chromatin structure. (A) Effect of HDAC inhibitors 109, 233, and 966 on mRNA levels for H2AFY2 (histone H2A family Y isotype 2, encoding macroH2A) and PCGF2 (Polycomb group ring finger 2) in FRDA neuronal cells. Cells were treated with the indicated compounds at 10 μM for 24 h; RNA levels were quantified by qRT-PCR and mRNA levels in the DMSO control was set to 1. Error bars = SEM of triplicate measurements. **p < 0.01. (B) Effect of HDAC inhibitors Click-1, 3, and 136 on mRNA levels for H2AFY2 and PCGF2 in FRDA neuronal cells, as in (A), except the HDACi concentration was 5 μM. **p < 0.01.
Development of Improved HDAC Inhibitors for Clinical Use
Our first generation of molecules, such as 106, 109, and derivatives, suffer from two liabilities; namely, less than optimal brain penetration (0.15 brain to blood ratio) and conversion of the active molecule into an inactive metabolic product in vivo (a benzimidazole). To circumvent these liabilities, we identified two structural features that individually improve brain distribution and metabolic stability of our HDAC inhibitors. Brain penetration is improved by replacement of the “left” amide in the standard pimelic 2-aminobenzamide scaffold (Figure 1) with an ether, olefin (alkene), or ketone and introduction of a non-saturated α/β linkage adjacent to the “right” amide prevents formation of the benzimidazole. Based on these results, we used Cu(I)-catalyzed click chemistry to derive a small library of derivatives that combine these properties (31) (Figure 6A). To determine whether such molecules retain their ability to increase FXN mRNA in FRDA neuronal cells, we compared the activity of one such molecule (Click-1) to that of HDACi 109 (Figure 6B). Click-1 contains two unsaturated linkages, one adjacent to the 2-aminobenzamide amide linkage and one replacing the “left” amide linkage in the original chemical scaffold. Notably, this molecule contains a triazole, which is the product of click chemistry. These changes to the HDACi scaffold were completely tolerated as evidenced by equivalent activities of HDACi 109 and Click-1 in the transcription assay (Figure 6B). Given the improved pharmacology and specifically brain penetration of this new class of compounds (31), these findings offer promise for the development of a new generation of compounds for human clinical studies in FRDA.
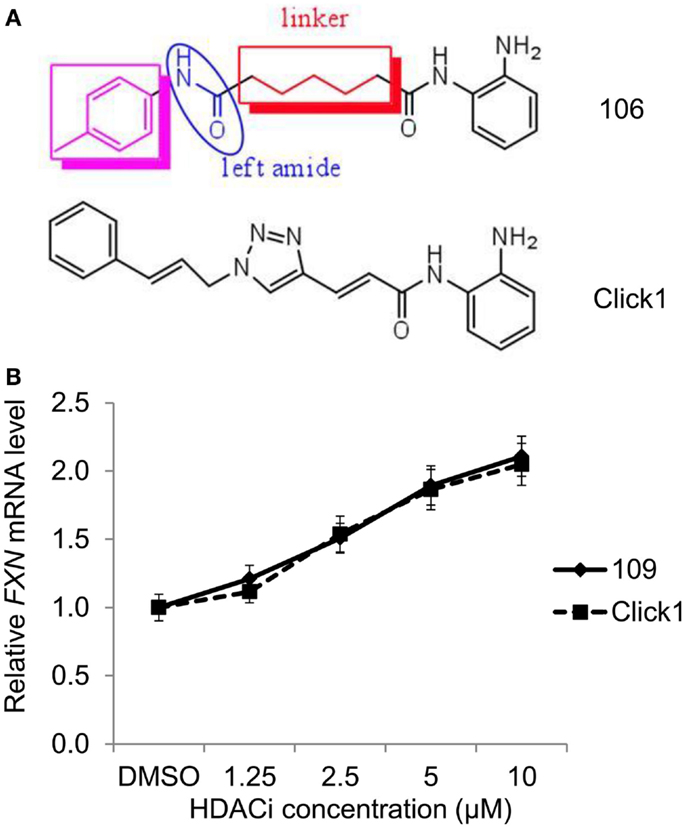
Figure 6. HDAC inhibitors with improved pharmacological properties yield comparable increases in FXN mRNA in FRDA neuronal cells as the first-generation inhibitors. (A) Structures of compound 106 and Click-1, showing replacement of the left amide in 106 with an unsaturated bond, and introduction of a triazole in the linker region in Click-1. An unsaturated bond was also introduced adjacent to benzamide to prevent benzimidazole formation, as observed for 106 and other pimelic 2-aminobenzamides. (B) Quantitative RT-PCR was used to compare the effects varying concentrations of HDACi 109 and Click-1 on FXN mRNA in FRDA neuronal cells. mRNA levels were arbitrarily set to 1.0 for the DMSO control. Error bars = SEM of triplicate measurements.
Discussion
We recently demonstrated (28) that HDACi 109 is able to reverse FXN gene silencing in FRDA neurons derived from patient iPSCs to a degree comparable to that found in earlier studies employing human PBMCs and mouse models (5, 23, 26, 27). Brain penetration and HDAC inhibition in the brain were established in vivo in two mouse models for FRDA (23, 27). Our recent study provided evidence for reversal of the heterochromatin state and up-regulation of FXN mRNA and frataxin protein in human neuronal cells. We also demonstrated HDAC inhibition and increased H3K9 acetylation in PBMCs and an increase in FXN mRNA in blood from patients treated with RG2833 (the drug formulation product of 109). We demonstrated that combined HDAC1, 2, and 3 inhibition is required to counteract the epigenetic changes induced by the GAA•TTC repeat expansion and that H3K9 is a key histone residue whose acetylation/methylation regulates FXN expression. Compounds that are selective for particular class I HDACs do not reactivate FXN gene expression to the extent found for HDACi 109 and also do not promote H3K9 acetylation to a similar degree.
In the current study, we extend our previous observation that 4- and 5-substituted 2-aminobenzamides that are selective for HDAC3 or HDAC1, respectively, are relatively inactive as inducers of FXN gene expression in FRDA neuronal cells (28). We find that both HDACi 3 (this study) and 233 (28), which both target HDAC1, are weakly active compared to HDACi 109 (28). Similarly, the HDAC3-selective compounds 136 (this study) and 966 (28) are also inactive. HDACi 109 inhibits both HDAC1 and HDAC3 through a slow-on/tight-binding mechanism (mechanism 2 above), whereas the inactive 4- or 5-substituted 2-aminobenzamides do not share this property. For example, HDACi 136 exhibits slow-on/tight-binding for HDAC3, but is a fast-on/fast-off competitive inhibitor of HDAC1. Similarly, HDACi 3 only shows slow-on/tight-binding for HDAC1. Highly potent hydroxamate HDAC inhibitors such as SAHA and TSA are rapid-on/rapid-off inhibitors and do not reactivate FXN expression in vitro (5, 22). Based on our results with small-molecule inhibitors, we postulate that multiple HDACs may be responsible for FXN gene repression in FRDA, and that prolonged target engagement may be required for reactivation. Interestingly, combinations of HDAC1/2- and HDAC3-selective inhibitors do not reactive FXN gene expression (28), suggesting that reversal of epigenetic silencing can only be achieved by inhibition of the particular HDAC complexes residing at the FXN locus in FRDA cells.
To corroborate our findings with small-molecule HDAC inhibitors, we turned to siRNA silencing of class I HDACs. Strikingly, we find that siRNAs to either HDAC1 or HDAC3 yield comparable levels of FXN gene expression in FRDA neurons as observed with HDACi 109 (Figure 3). This finding suggests to us that the GAA•TTC repeat expansion may recruit a repressor complex containing both enzymes. The interplay between HDACs 1 and 3 in neurodegenerative diseases is well established as well as the interaction between HDAC1 and HDAC3 in neuronal cells [see for example Ref. (43)]. This suggestion would be in line with the small-molecule inhibitor findings.
It is also possible that our HDAC inhibitors act indirectly on the FXN gene by either up-regulating or down-regulating genes encoding chromatin modifying enzymes or proteins involved in chromatin structure. To assess this possibility, we analyzed microarray data from FRDA neuronal cells treated with HDACi 109, 233, and 966. While approximately 1,200 genes are changed in expression by treatment of these cells with HDACi 109, only 88 genes are uniquely regulated by 109, and not by 233 and 966. Among these, 12 genes were found to be involved in DNA binding, chromatin structure, or gene expression. Inspection of this list of genes (Table 3) revealed that two genes might be candidates for regulators of FXN gene expression, namely H2AFY2 and PCGF2. Since the histone variant macroH2A, encoded by the H2AFY2 gene, is known to be involved in gene repression (41), down-regulation of this gene might well lead to increases in global gene expression, as well as increases in FXN gene activity. Interestingly, a recent study found that H2AY is specifically up-regulated in Huntington’s disease (HD) postmortem brain and lymphoid cells, and the levels of this mRNA are normalized by treatment of HD patients in human clinical studies with the HDAC inhibitors sodium butyrate and sodium phenylbutyrate (44). We find that our 2-aminobenzamide HDACi are also effective in reversing the global gene expression deficits in HD mouse models (29, 45). These findings may underpin a common mechanism of action of these compounds in FRDA and HD.
Similar to macroH2A, Polycomb group ring finger 2 is involved in transcriptional repression, being part of the Polycomb repressive complex 1 (PRC1). PRC1 and Polycomb repressive complex 2 (PRC2) are recruited sequentially to target genes to repress their expression (42). The components of PRC2, when recruited to target genes are responsible for the methylation of histone H3K27, providing a binding site for the chromobox domain of components of PRC1, which in turn catalyzes the monoubiquitination of H2AK119. H3K27 trimethylation is enriched at the FXN gene promoter and upstream and downstream of the GAA•TTC repeats in FRDA neuronal cells (28), suggesting that Polycomb-mediated repression may be involved in FXN gene silencing in FRDA. Hence, down-regulation of the Polycomb silencing complex could well lead to increases in FXN gene expression. Interestingly, a genome-wide association study of macroH2A in pluripotent cells revealed that its binding sites largely overlap with PRC2 binding sites (46). Additionally, previous studies have documented down-regulation of components of PRC2 with other HDAC inhibitors (47, 48). Future ChIP and siRNA experiments will be needed to assess occupancy of these gene products on FXN chromatin and the effects of the inhibitors on such occupancy.
While our present and recent findings (28) provide a proof of concept that patient-derived neuronal cells can be a quantitative screening tool for the development of an epigenetic therapy for FRDA, the compound used in our clinical study, 109/RG2833, suffers from liabilities for chronic use as FRDA therapeutics; namely, less than optimal brain penetration (0.15 brain to blood ratio), and conversion of the active molecule into inactive, potentially toxic metabolic products (benzimidazole and amidolysis) that are poorly eliminated in vivo (31, 49). Other preclinical studies placed RG2833 and the benzimidazole in the high-risk category for inducing QTc prolongation (28). Given the cardiac involvement in FRDA, molecules that produce this benzimidazole metabolite are unlikely to be useful for chronic treatment of FRDA. We therefore searched for chemical modifications to the pimelic 2-aminobenzamide scaffold that would circumvent these liabilities. As described earlier (31), replacement of the “left” amide in the original scaffold (Figure 6A) with an ether, olefin, or double bond was found to improve brain penetration. Similarly, introducing a double bond adjacent to the benzamide prevented cyclization to the benzimidazole. These chemical features were combined into a small collection of derivatives by click chemistry (31), and compound Click-1 was identified with improved brain penetration (>0.7 brain/plasma ratio) and stability to benzimidazole formation. We now provide evidence that Click-1 retains its ability to activate FXN gene expression in FRDA neuronal cells (Figure 6B), with no loss of activity compared to HDACi 109. Thus, new derivatives such as Click-1 and other variants are candidates for future clinical studies in FRDA.
Conflict of Interest Statement
James R. Rusche is an employee of Repligen Corporation. Joel M. Gottesfeld and C. James Chou are inventors on US patent applications 20070219244, 20110021562, 20130210918, and US patent 8,835,502 B2 (licensees, Repligen Corporation/BioMarin Pharmaceuticals). Joel M. Gottesfeld currently serves as a consultant to BioMarin Pharmaceuticals. The terms of this arrangement are managed by The Scripps Research Institute. Intellectual property has been licensed by The Scripps Research Institute to Repligen Corporation and BioMarin Pharmaceuticals, and The Scripps Research Institute, C. James Chou and Joel M. Gottesfeld have a financial interest in this technology.
Acknowledgments
Supported by grants from the California Institute for Regenerative Medicine, the National Institute for Neurological Disorders and Stroke (NINDS/NIH), the Muscular Dystrophy Association, GoFAR (Italy), and the Friedreich’s Ataxia Research Alliance. We thank Kit Nazor and Jeanne Loring (TSRI) for help with Illumina microarray analysis.
Supplementary Material
The Supplementary Material for this article can be found online at http://www.frontiersin.org/Journal/10.3389/fneur.2015.00044/abstract
References
1. Campuzano V, Montermini L, Molto MD, Pianese L, Cossee M, Cavalcanti F, et al. Friedreich’s ataxia: autosomal recessive disease caused by an intronic GAA triplet repeat expansion. Science (1996) 271:1423–7. doi: 10.1126/science.271.5254.1423
2. Pastore A, Puccio H. Frataxin: a protein in search for a function. J Neurochem (2013) 126(Suppl 1):43–52. doi:10.1111/jnc.12220
Pubmed Abstract | Pubmed Full Text | CrossRef Full Text | Google Scholar
3. Cossee M, Schmitt M, Campuzano V, Reutenauer L, Moutou C, Mandel J-L, et al. Evolution of the Friedreich’s ataxia trinucleotide repeat expansion: founder effect and premutations. Proc Natl Acad Sci U S A (1997) 94:7452–7. doi:10.1073/pnas.94.14.7452
Pubmed Abstract | Pubmed Full Text | CrossRef Full Text | Google Scholar
4. Saveliev A, Everett C, Sharpe T, Webster Z, Festenstein R. DNA triplet repeats mediate heterochromatin-protein-1-sensitive variegated gene silencing. Nature (2003) 422:909–13. doi:10.1038/nature01596
Pubmed Abstract | Pubmed Full Text | CrossRef Full Text | Google Scholar
5. Herman D, Jenssen K, Burnett R, Soragni E, Perlman SL, Gottesfeld JM. Histone deacetylase inhibitors reverse gene silencing in Friedreich’s ataxia. Nat Chem Biol (2006) 2:551–8. doi:10.1038/nchembio815
Pubmed Abstract | Pubmed Full Text | CrossRef Full Text | Google Scholar
6. Al-Mahdawi S, Pinto RM, Ismail O, Varshney D, Lymperi S, Sandi C, et al. The Friedreich ataxia GAA repeat expansion mutation induces comparable epigenetic changes in human and transgenic mouse brain and heart tissues. Hum Mol Genet (2008) 17:735–46. doi:10.1093/hmg/ddm346
Pubmed Abstract | Pubmed Full Text | CrossRef Full Text | Google Scholar
7. Greene E, Mahishi L, Entezam A, Kumari D, Usdin K. Repeat-induced epigenetic changes in intron 1 of the frataxin gene and its consequences in Friedreich ataxia. Nucl Acids Res (2007) 35:3383–90. doi:10.1093/nar/gkm271
Pubmed Abstract | Pubmed Full Text | CrossRef Full Text | Google Scholar
8. De Biase I, Chutake YK, Rindler PM, Bidichandani SI. Epigenetic silencing in Friedreich ataxia is associated with depletion of CTCF (CCCTC-binding factor) and antisense transcription. PLoS One (2009) 4:e7914. doi:10.1371/journal.pone.0007914
Pubmed Abstract | Pubmed Full Text | CrossRef Full Text | Google Scholar
9. Koeppen AH, Mazurkiewicz JE. Friedreich ataxia: neuropathology revised. J Neuropathol Exp Neurol (2013) 72:78–90. doi:10.1097/NEN.0b013e31827e5762
Pubmed Abstract | Pubmed Full Text | CrossRef Full Text | Google Scholar
10. Puccio H, Anheim M, Tranchant C. Pathophysiological and therapeutic progress in Friedreich ataxia. Rev Neurol (Paris) (2014) 170:355–65. doi:10.1016/j.neurol.2014.03.008
Pubmed Abstract | Pubmed Full Text | CrossRef Full Text | Google Scholar
11. Cnop M, Mulder H, Igoillo-Esteve M. Diabetes in Friedreich ataxia. J Neurochem (2013) 126(Suppl 1):94–102. doi:10.1111/jnc.12216
12. Tsou AY, Paulsen EK, Lagedrost SJ, Perlman SL, Mathews KD, Wilmot GR, et al. Mortality in Friedreich ataxia. J Neurol Sci (2011) 307:46–9. doi:10.1016/j.jns.2011.05.023
Pubmed Abstract | Pubmed Full Text | CrossRef Full Text | Google Scholar
13. Kumari D, Usdin K. Chromatin remodeling in the noncoding repeat expansion diseases. J Biol Chem (2009) 284:7413–7. doi:10.1074/jbc.R800026200
Pubmed Abstract | Pubmed Full Text | CrossRef Full Text | Google Scholar
14. Chan PK, Torres R, Yandim C, Law PP, Khadayate S, Mauri M, et al. Heterochromatinization induced by GAA-repeat hyperexpansion in Friedreich’s ataxia can be reduced upon HDAC inhibition by vitamin B3. Hum Mol Genet (2013) 22:2662–75. doi:10.1093/hmg/ddt115
Pubmed Abstract | Pubmed Full Text | CrossRef Full Text | Google Scholar
15. vans-Galea MVE, Carrodus N, Rowley SM, Corben LA, Tai G, Saffery R, et al. FXN methylation predicts expression and clinical outcome in Friedreich ataxia. Ann Neurol (2012) 71:487–97. doi:10.1002/ana.22671
Pubmed Abstract | Pubmed Full Text | CrossRef Full Text | Google Scholar
16. Wells RD. DNA triplexes and Friedreich ataxia. FASEB J (2008) 22:1625–34. doi:10.1096/fj.07-097857
17. Groh M, Lufino MM, Wade-Martins R, Gromak N. R-loops associated with triplet repeat expansions promote gene silencing in Friedreich ataxia and fragile X syndrome. PLoS Genet (2014) 10:e1004318. doi:10.1371/journal.pgen.1004318
Pubmed Abstract | Pubmed Full Text | CrossRef Full Text | Google Scholar
18. Sandi C, Sandi M, Virmouni SA, Al-Mahdawi S, Pook MA. Epigenetic-based therapies for Friedreich ataxia. Front Genet (2014) 5:165. doi:10.3389/fgene.2014.00165
Pubmed Abstract | Pubmed Full Text | CrossRef Full Text | Google Scholar
19. vans-Galea MVE, Hannan AJ, Carrodus N, Delatycki MB, Saffery R. Epigenetic modifications in trinucleotide repeat diseases. Trends Mol Med (2013) 19:655–63. doi:10.1016/j.molmed.2013.07.007
Pubmed Abstract | Pubmed Full Text | CrossRef Full Text | Google Scholar
20. Sarsero JP, Li L, Wardan H, Sitte K, Williamson R, Ioannou PA. Upregulation of expression from the FRDA genomic locus for the therapy of Friedreich ataxia. J Gene Med (2003) 5:72–81. doi:10.1002/jgm.320
21. Libri V, Yandim C, Athanasopoulos S, Loyse N, Natisvili T, Law PP, et al. Epigenetic and neurological effects and safety of high-dose nicotinamide in patients with Friedreich’s ataxia: an exploratory, open-label, dose-escalation study. Lancet (2014) 384(9942):504–13. doi:10.1016/S0140-6736(14)60382-2
Pubmed Abstract | Pubmed Full Text | CrossRef Full Text | Google Scholar
22. Chou CJ, Herman D, Gottesfeld JM. Pimelic diphenylamide 106 is a slow, tight-binding inhibitor of class I histone deacetylases. J Biol Chem (2008) 283:35402–9. doi:10.1074/jbc.M807045200
Pubmed Abstract | Pubmed Full Text | CrossRef Full Text | Google Scholar
23. Rai M, Soragni E, Jenssen K, Burnett R, Herman D, Gottesfeld JM, et al. HDAC inhibitors correct frataxin deficiency in a Friedreich ataxia mouse model. PLoS One (2008) 3:e1958. doi:10.1371/journal.pone.0001958
Pubmed Abstract | Pubmed Full Text | CrossRef Full Text | Google Scholar
24. Soragni E, Herman D, Dent SY, Gottesfeld JM, Wells RD, Napierala M. Long intronic GAA*TTC repeats induce epigenetic changes and reporter gene silencing in a molecular model of Friedreich ataxia. Nucleic Acids Res (2008) 36:6056–65. doi:10.1093/nar/gkn604
Pubmed Abstract | Pubmed Full Text | CrossRef Full Text | Google Scholar
25. Xu C, Soragni E, Chou CJ, Herman D, Plasterer HL, Rusche JR, et al. Chemical probes identify a role for histone deacetylase 3 in Friedreich’s ataxia gene silencing. Chem Biol (2009) 16:980–9. doi:10.1016/j.chembiol.2009.07.010
Pubmed Abstract | Pubmed Full Text | CrossRef Full Text | Google Scholar
26. Rai M, Soragni E, Chou CJ, Barnes G, Jones S, Rusche JR, et al. Two new pimelic diphenylamide HDAC inhibitors induce sustained frataxin upregulation in cells from Friedreich’s ataxia patients and in a mouse model. PLoS One (2010) 5:e8825. doi:10.1371/journal.pone.0008825
Pubmed Abstract | Pubmed Full Text | CrossRef Full Text | Google Scholar
27. Sandi C, Pinto RM, Al-Mahdawi S, Ezzatizadeh V, Barnes G, Jones S, et al. Prolonged treatment with pimelic o-aminobenzamide HDAC inhibitors ameliorates the disease phenotype of a Friedreich ataxia mouse model. Neurobiol Dis (2011) 42:496–505. doi:10.1016/j.nbd.2011.02.016
Pubmed Abstract | Pubmed Full Text | CrossRef Full Text | Google Scholar
28. Soragni E, Miao W, Iudicello M, Jacoby D, Demercanti S, Clerico M, et al. Epigenetic therapy for Friedreich’s ataxia. Ann Neurol (2014) 76:489–508. doi:10.1002/ana.24260
29. Jia H, Kast RJ, Steffan JS, Thomas EA. Selective histone deacetylase (HDAC) inhibition imparts beneficial effects in Huntington’s disease mice: implications for the ubiquitin-proteasomal and autophagy systems. Hum Mol Genet (2012) 21:5280–93. doi:10.1093/hmg/dds379
Pubmed Abstract | Pubmed Full Text | CrossRef Full Text | Google Scholar
30. Jia H, Pallos J, Jacques V, Lau A, Tang B, Cooper A, et al. Histone deacetylase (HDAC) inhibitors targeting HDAC3 and HDAC1 ameliorate polyglutamine-elicited phenotypes in model systems of Huntington’s disease. Neurobiol Dis (2012) 46:351–61. doi:10.1016/j.nbd.2012.01.016
Pubmed Abstract | Pubmed Full Text | CrossRef Full Text | Google Scholar
31. Xu C, Soragni E, Jacques V, Rusche JR, Gottesfeld JM. Improved histone deacetylase inhibitors as therapeutics for the neurodegenerative disease Friedreich’s ataxia: a new synthetic route. Pharmaceuticals (2011) 4:1578–90. doi:10.3390/ph4121578
32. Ku S, Soragni E, Campau E, Thomas EA, Altun G, Laurent LC, et al. Friedreich’s ataxia induced pluripotent stem cells model intergenerational GAATTC triplet repeat instability. Cell Stem Cell (2010) 7:631–7. doi:10.1016/j.stem.2010.09.014
Pubmed Abstract | Pubmed Full Text | CrossRef Full Text | Google Scholar
33. Du J, Campau E, Soragni E, Ku S, Puckett JW, Dervan PB, et al. Role of mismatch repair enzymes in GAA.TTC triplet-repeat expansion in Friedreich ataxia induced pluripotent stem cells. J Biol Chem (2012) 287:29861–72. doi:10.1074/jbc.M112.391961
Pubmed Abstract | Pubmed Full Text | CrossRef Full Text | Google Scholar
34. Somoza JR, Skene RJ, Katz BA, Mol C, Ho JD, Jennings AJ, et al. Structural snapshots of human HDAC8 provide insights into the class I histone deacetylases. Structure (2004) 12:1325–34. doi:10.1016/j.str.2004.04.012
Pubmed Abstract | Pubmed Full Text | CrossRef Full Text | Google Scholar
35. Vannini A, Volpari C, Filocamo G, Casavola EC, Brunetti M, Renzoni D, et al. Crystal structure of a eukaryotic zinc-dependent histone deacetylase, human HDAC8, complexed with a hydroxamic acid inhibitor. Proc Natl Acad Sci U S A (2004) 101:15064–9. doi:10.1073/pnas.0404603101
Pubmed Abstract | Pubmed Full Text | CrossRef Full Text | Google Scholar
36. Watson PJ, Fairall L, Santos GM, Schwabe JW. Structure of HDAC3 bound to co-repressor and inositol tetraphosphate. Nature (2012) 481:335–40. doi:10.1038/nature10728
Pubmed Abstract | Pubmed Full Text | CrossRef Full Text | Google Scholar
37. Malvaez M, McQuown SC, Rogge GA, Astarabadi M, Jacques V, Carreiro S, et al. HDAC3-selective inhibitor enhances extinction of cocaine-seeking behavior in a persistent manner. Proc Natl Acad Sci U S A (2013) 110:2647–52. doi:10.1073/pnas.1213364110
Pubmed Abstract | Pubmed Full Text | CrossRef Full Text | Google Scholar
38. Duggleby RG, Attwood PV, Wallace JC, Keech DB. Avidin is a slow-binding inhibitor of pyruvate carboxylase. Biochemistry (1982) 21:3364–70. doi:10.1021/bi00257a018
39. Weiss WA, Taylor SS, Shokat KM. Recognizing and exploiting differences between RNAi and small-molecule inhibitors. Nat Chem Biol (2007) 3:739–44. doi:10.1038/nchembio1207-739
40. Bantscheff M, Hopf C, Savitski MM, Dittmann A, Grandi P, Michon AM, et al. Chemoproteomics profiling of HDAC inhibitors reveals selective targeting of HDAC complexes. Nat Biotechnol (2010) 29:255–65. doi:10.1038/nbt.1759
Pubmed Abstract | Pubmed Full Text | CrossRef Full Text | Google Scholar
41. Biterge B, Schneider R. Histone variants: key players of chromatin. Cell Tissue Res (2014) 356:457–66. doi:10.1007/s00441-014-1862-4
Pubmed Abstract | Pubmed Full Text | CrossRef Full Text | Google Scholar
42. Di Croce L, Helin K. Transcriptional regulation by Polycomb group proteins. Nat Struct Mol Biol (2013) 20:1147–55. doi:10.1038/nsmb.2669
Pubmed Abstract | Pubmed Full Text | CrossRef Full Text | Google Scholar
43. Bardai FH, Price V, Zaayman M, Wang L, D’Mello SR. Histone deacetylase-1 (HDAC1) is a molecular switch between neuronal survival and death. J Biol Chem (2012) 287:35444–53. doi:10.1074/jbc.M112.394544
Pubmed Abstract | Pubmed Full Text | CrossRef Full Text | Google Scholar
44. Hu Y, Chopra V, Chopra R, Locascio JJ, Liao Z, Ding H, et al. Transcriptional modulator H2A histone family, member Y (H2AFY) marks Huntington disease activity in man and mouse. Proc Natl Acad Sci U S A (2011) 108:17141–6. doi:10.1073/pnas.1104409108
Pubmed Abstract | Pubmed Full Text | CrossRef Full Text | Google Scholar
45. Thomas EA, Coppola G, Desplats PA, Tang B, Soragni E, Burnett R, et al. The HDAC inhibitor 4b ameliorates the disease phenotype and transcriptional abnormalities in Huntington’s disease transgenic mice. Proc Natl Acad Sci U S A (2008) 105:15564–9. doi:10.1073/pnas.0804249105
Pubmed Abstract | Pubmed Full Text | CrossRef Full Text | Google Scholar
46. Buschbeck M, Uribesalgo I, Wibowo I, Rue P, Martin D, Gutierrez A, et al. The histone variant macroH2A is an epigenetic regulator of key developmental genes. Nat Struct Mol Biol (2009) 16:1074–9. doi:10.1038/nsmb.1665
Pubmed Abstract | Pubmed Full Text | CrossRef Full Text | Google Scholar
47. Fiskus W, Pranpat M, Balasis M, Herger B, Rao R, Chinnaiyan A, et al. Histone deacetylase inhibitors deplete enhancer of zeste 2 and associated polycomb repressive complex 2 proteins in human acute leukemia cells. Mol Cancer Ther (2006) 5:3096–104. doi:10.1158/1535-7163.MCT-06-0418
Pubmed Abstract | Pubmed Full Text | CrossRef Full Text | Google Scholar
48. Bommi PV, Dimri M, Sahasrabuddhe AA, Khandekar J, Dimri GP. The polycomb group protein BMI1 is a transcriptional target of HDAC inhibitors. Cell Cycle (2010) 9:2663–73. doi:10.4161/cc.9.13.12147
Pubmed Abstract | Pubmed Full Text | CrossRef Full Text | Google Scholar
49. Beconi M, Aziz O, Matthews K, Moumne L, O’Connell C, Yates D, et al. Oral administration of the pimelic diphenylamide HDAC inhibitor HDACi 4b is unsuitable for chronic inhibition of HDAC activity in the CNS in vivo. PLoS One (2012) 7:e44498. doi:10.1371/journal.pone.0044498
Pubmed Abstract | Pubmed Full Text | CrossRef Full Text | Google Scholar
Keywords: Friedreich’s ataxia, histone deacetylase inhibitor, epigenetics, 2-aminobenzamide, frataxin
Citation: Soragni E, Chou CJ, Rusche JR and Gottesfeld JM (2015) Mechanism of action of 2-aminobenzamide HDAC inhibitors in reversing gene silencing in Friedreich’s ataxia. Front. Neurol. 6:44. doi: 10.3389/fneur.2015.00044
Received: 26 November 2014; Accepted: 19 February 2015;
Published online: 05 March 2015.
Edited by:
Marguerite Evans-Galea, Murdoch Children’s Research Institute, AustraliaReviewed by:
Leon French, University of British Columbia, CanadaAlfredo Ghezzi, The University of Texas at Austin, USA
Copyright: © 2015 Soragni, Chou, Rusche and Gottesfeld. This is an open-access article distributed under the terms of the Creative Commons Attribution License (CC BY). The use, distribution or reproduction in other forums is permitted, provided the original author(s) or licensor are credited and that the original publication in this journal is cited, in accordance with accepted academic practice. No use, distribution or reproduction is permitted which does not comply with these terms.
*Correspondence: Joel M. Gottesfeld, Departments of Cell and Molecular Biology and Chemistry, The Scripps Research Institute, 10550 North Torrey Pines Road, La Jolla, CA 92037, USA e-mail:am9lbGdAc2NyaXBwcy5lZHU=
†Present address: C. James Chou, Medical University of South Carolina, Charleston, SC, USA