 Jing Wang
 Juan Wang
 You Wan
 Xiaoli Li
- 1Department of Neurobiology, School of Basic Medical Sciences, Beijing Institute for Brain Disorders, Capital Medical University, Beijing, China
- 2Institute of Electrical Engineering, Yanshan University, Qinhuangdao, China
- 3Key Laboratory for Neuroscience, Ministry of Education/National Health and Family Planning Commission, Beijing, China
- 4State Key Laboratory of Cognitive Neuroscience and Learning, IDG/McGovern Institute for Brain Research, Beijing Normal University, Beijing, China
Chronic pain is a pathological developing course of pain. In clinic, an objective indicator is needed for diagnosing and better controlling chronic pain. The abnormal neural responses in chronic pain are reflected by multiple event-related potentials (ERPs) in time, frequency, and location domain, respectively. However, multiple changes in ERPs are not applicable in clinic. So, the principal feature covered the most informative changes extracted from these three domains of ERP during the development of chronic pain is needed. In the present study, a parallel factor analysis method was employed to extract time–frequency–channel features of laser-evoked potential (LEP) simultaneously from rats with chronic inflammatory pain. Results showed that the main feature of LEP in channel domain locates in the frontal brain region in rats with chronic inflammatory pain while in the parietal brain region in control rats. In the frequency domain, the main frequency of LEP was significantly higher in chronic inflammatory pain rats than that in control rats. These findings indicate that the frontal region with higher frequency response to nociceptive information is the principal feature in the chronic pain state. Our study provided not only a principal feature of LEP but also a promising strategy for chronic pain, which is potential for clinic application.
Introduction
Chronic pain is a pathological pain state characterized by pain persistence (1). It is believed that chronic pain is not a simple condition of persistent pain perception, but a course of pain chronification that involves sensation, emotion, and cognition (2, 3). Clinically, diagnosis of chronic pain mainly relies on subjective pain report lasting for several months; however, dependence of subjective pain report results in unsatisfied treatment of pain in clinic because of missing the optimal treatment window. Detection of chronic pain with objective measurement at early stage, but not with traditional subjective report is required (4). Thus, it is of importance to explore a measurement or an indicator that is applicable in clinic.
Event-related potentials (ERPs) are a measurement that reflects neuronal processes by frequency, time course, and topography changes (5). ERPs have been applied to study the abnormal neural response in chronic pain conditions (5–7). Most studies employ painful laser stimuli to evoke cortical neural responses that are named laser-evoked potential (LEP). It is widely used in chronic pain clinically (8). Previous researches indicated that LEP in the time, location, and frequency domain was altered in chronic pain. For example, one study found that oscillatory activities in the theta frequency band were enhanced in chronic pain patients in parietal areas (9), indicating changes in the frequency and location domain. In another study, the N170 component (a negative potential appeared at 170 ms after stimulation) of LEP was enhanced in the fronto-central region (10), showing alternation in the time domain at another location domain. In addition, chronic pain patients showed both changes for the N1 component (a negative potential appeared at 100 ms after stimulation) in the temporal region and the N2/P2 component in the vertex region (11). These results demonstrate that multiple time and frequency responses recorded at a number of regions alter in chronic pain condition. Although these multiple changes are sufficient for understanding the mechanism of chronic pain, it is still unclear which are the principal characteristics covered the most informative changes related with chronic pain, and it is not suitable for clinic application. Therefore, a principal feature extracted from abundant information is required for clinic usage.
Effective reduction methods such as principal component analysis (PCA) are traditionally applied for ERPs to explore the principal components and to characterize ERPs (12, 13). However, the PCA method only describes the time and frequency characteristics within single recording area. It cannot extract components for multichannel ERPs (14). The parallel factor analysis (PARAFAC) is a method that could extract features in the time–frequency–channel domain simultaneously from original multichannel EEG data (15). It takes into account the frequency of oscillations in certain time periods among all the recording channels (16) and has been successfully applied to detect abnormal oscillatory activity in epilepsy and Alzheimer’s disease (17).
Therefore, in the present study, in order to explore the principal feature of LEP during the development of chronic inflammatory pain in three domains, we recorded LEP obtained from the electrocorticogram (ECoG) of rats with chronic pain model and applied the PARAFAC method to decompose multichannel LEP data. Components of each rat are the main characteristics of the time–frequency–channel information for brain oscillatory activities.
Animals and Methods
Animals
Thirteen male Sprague-Dawley adult rats (weight 300–350 g) were used. These animals were provided by the Department of Experimental Animal Sciences, Peking University Health Science Center. The animals were housed individually in cages at room temperature of 22 ± 1°C and kept on a 12 h light and dark cycle. Food and water were available ad libitum. The rats were allowed to habituate to the environment and handled by the experimenter daily for 1 week before surgery.
Surgery and Electrodes Implantation
Rats were anesthetized with sodium pentobarbital (50 mg/kg, i.p.). Fourteen stainless steel screws (tip diameter 1 mm, impedance of 300–350 Ω, Kanpu Medical Ltd., China) equipped with a socket were implanted as epidural electrodes on the skull. The locations of the electrodes were determined by the method proposed by Shaw (18), as shown in Figure 1. The electrodes were fixed to the skull with dental cement. Penicillin (60,000 U, i.m.) was administrated in the following 3 days after operation to prevent possible infection. The EEG recording was started 7 days after electrodes implantation operation.
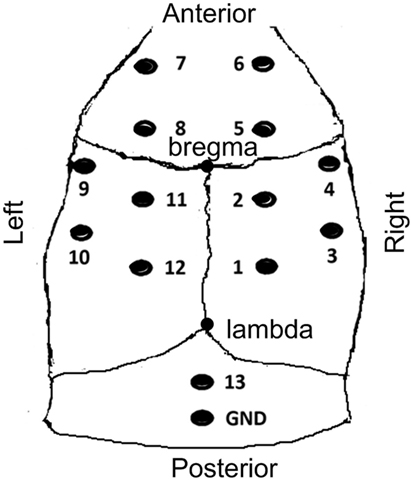
Figure 1. The sketch map of electrodes locations. Anterior to the bregma (A+); posterior to the bregma (A−); left lateral to the bregma (L+); right lateral to the bregma (L−); electrodes 4 and 9 (A 0.0 mm, L ±4.5 mm); electrodes 3 and 10 (A −3.0 mm, L ±4.5 mm); electrodes 6 and 7 (A +4.5 mm, L ±1.5 mm); electrodes 8, 5, 11, 2 (A ±1.5 mm, L ±4.5 mm); electrodes 1 and 12 (A −4.5 mm, L ±1.5 mm); electrode 13 operated as the reference electrode. The reference electrode and ground electrode were positioned 2 and 4 mm caudal to lambda, respectively.
Chronic Inflammatory Pain Model of Rats: Monoarthritis Procedure
A chronic inflammatory pain model of monoarthritis in rats was established according to a previously described method by Butler (19). The procedure was briefly as follows: the complete Freund’s adjuvant (CFA) component includes Mycobacterium butyricum (60 mg), paraffin oil (6 ml), NaCl 0.9% (4 ml), and Tween 80 (1 ml). After being mixed and autoclaved, the mixture (0.05 ml) was injected into the left tibiotarsal joint cavity to induce the monoarthritis pain model (CFA group). Six rats in the control group were injected with an equal volume of vehicle (0.9% NaCl) to the left tibiotarsal joint cavity [normal saline (NS) group]. After injection, rats in the CFA group developed thermal hyperalgesia, which is confirmed by the rat’s hind paw withdrawal response to a lower laser intensity compared with that before injection.
Laser Stimulation
On the day prior to intra-articular injection (D0) and 1, 7, 14, and 28 days after intra-articular injection (D1, D7, D14, and D28), rats received thermal nociceptive stimulation with a laser beam (wavelength 10.6 µm, beam diameter 2.5 mm, pulse width 20 ms), which was delivered by a CO2-laser stimulator (DIMEI-300, Changchun Optics Medical Apparatus Co., Ltd., China). Laser stimuli were applied to the plantar of hind paw when rats were awake and quiet. The appropriate intensity of the laser beam for each individual rat was determined by using an ascending series of laser beam intensities with a 1 W increment. The intensity that generated four to five hind paw withdrawal responses out of six stimuli was selected as the intensity of stimulation. Each rat received 15 stimuli that could induce hind paw withdrawal responses. Each stimulus was targeted at slightly different positions. The interstimulation interval varies from 40 to 150 s.
Recordings of Laser-Evoked ECoG
The EEG/ERP system (CogniTrace ERP, ANT Inc., The Netherlands) was used for EEG data collection. Twelve recording electrodes and one reference electrode were connected to the digital preamplifier, and the ground electrode was connected the GND connector of the amplifier. All signals were referenced to the electrode that was located 2 mm caudal to lambda (the #13 electrode in Figure 1). The sampling frequency of EEG recording was 1,024 Hz. Rat behaviors were videotaped while the ECoG was recording.
Preprocessing
The preparation and preprocessing of data were carried out as follows. The duration of each epoch was set as 1,500 ms (500 ms before and 1,000 ms after the laser stimulation onset). Large baseline drift was checked and removed for all trials and channels. Then, the epoch signals were re-referenced to an average of all channel recordings. Finally, the laser-evoked ECoG data were preprocessed with a band-pass filter of 1–70 Hz (eegfilter.m at EEGLAB software: http://sccn.ucsd.edu/eeglab/), and the ERP data were generated by averaging.
Wavelet Transforms and PARAFAC
Wavelet transformation and PARAFAC were performed as described by Wang (16). Briefly, first, wavelet transforms were used to transform ERP into time-frequency energy for each channel, obtaining a time × frequency matrix. Next, matrices from 12 channels were put together to form a dataset containing time, frequency, and channel information. Then, PARAFAC method was applied to this dataset to obtain its main component. PARAFAC projects the dataset in the time domain, frequency domain, and channel domain and extract several orthogonal components to maximally represent the original dataset. The number of components is controlled by core consistency method (17, 20). After PARAFAC, components consisting of three coefficients matrices, i.e., matrix of time, frequency, and channel was obtained, reflecting the main characteristics in the time, frequency, and channel domain, respectively.
Then, the time points with biggest coefficients and the frequencies with biggest coefficients were selected. For further channel domain analysis, the coefficients of every channel were plotted.
Statistical Analysis
Two-way analysis of variance was used to compare the frequency and time difference between the two groups.
Results
PARAFAC Analysis of LEP
In order to test the accuracy of PARAFAC method, the feature extracted by PARAFAC was compared with original LEP. With PARAFAC analysis, one or more components that represent main characteristics of EEG are obtained for each data. Within each component, it contains three-way information in the time–frequency–channel domain. A representative example with the PARAFAC analysis is shown in Figure 2. These data have two components, which are shown in Figures 2A,B, respectively. In each component, three-dimensional information at the time–frequency–channel domain was obtained. The information in the first component is shown in Figure 2A, a–c. Based on the peak of coefficients, the main characteristic of this multichannel EEG signal was located in the prefrontal region with a frequency of around 6 Hz at approximately 240 ms after the stimulus onset. The corresponding LEP obtained by across-trial averaging in EEGLAB from the channel 6 is plotted in Figure 2A, d. It was obvious that the time feature extracted by the PARAFAC method (~240 ms, seeing Figure 2A, a) matched well with the LEP latency in channel 6 in the prefrontal region (~250 ms, seeing Figure 2A, d). For the second component, the decomposition is shown in Figure 2B, a–c. The main characteristic of this multichannel EEG signal was located in the parietal region with frequency around 2 Hz at approximately 250 ms after the stimulus onset. From the LEP waveform in channel 2 in parietal region, the latency of the LEP was at around 250 ms in the parietal region (Figure 2B, d).
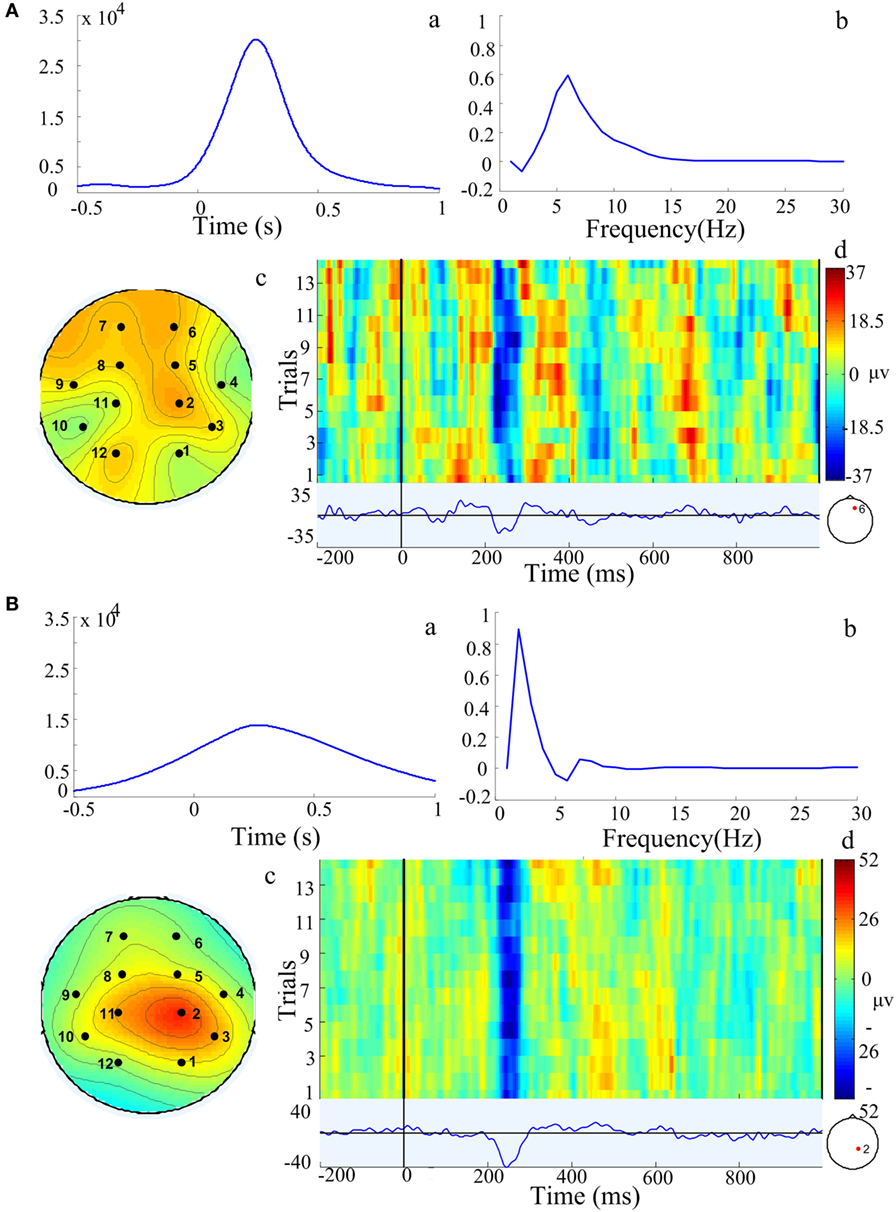
Figure 2. Components extracted by the parallel factor analysis (PARAFAC) method model from one representative example in a chronic arthritic rat. Two components (A,B) were extracted by PARAFAC. In each component, it contained the characteristic in time domain (a), frequency domain (b), and location domain (c) of three-dimensional information; (d) was the corresponding laser-evoked potential and stimulation trials from a single channel marked with red point in a chronic arthritic rat. Based on the peak of these coefficients, component (A) is over frontal region with a frequency of 6 Hz at approximately 240 ms after the stimulus onset; component (B) is over parietal region with a frequency of 2 Hz at 250 ms after stimulation onset.
The Feature of LEP during the Development of Chronic Pain
Table 1 showed that pain threshold, measured by laser intensity that induces rat’s hind paw withdrawal response, was lower in rats with CFA than rats with NS [Fgroup(1,44) = 24.48, P < 0.001], indicating that rats with CFA injection developed thermal hyperalgesia. Post hoc analysis revealed lower threshold at all days in rats with CFA (P < 0.05 for D1, D7, D14, and D28).
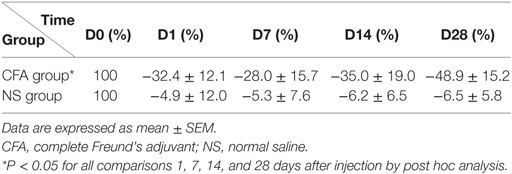
Table 1. Changes of pain threshold relative to baseline (D0).
After the PARAFAC analysis, there were several components extracted by each rats. Each component consisted of three coefficients matrices, i.e., matrix of time, frequency, and channel, reflecting the main characteristics in the time, frequency, and channel domain, respectively. We further collected all the components in each group and then compared each of the three domains between two groups.
To find out the difference in the channel domain between the CFA and NS groups, coefficients of each channel from both the NS and CFA groups at different days before and after pain induction were plotted (Figure 3A). In the CFA group, we found the activity over the prefrontal region increased along the development of chronic pain. The coefficients of the channel 7 were bigger at day 7 (t = 2.21, P < 0.05) and day 28 (t = 2.69, P < 0.05) compared with the coefficients of channel 7 at day 0. Unlike the CFA group, no channels showed difference among all these days in the NS group. The topographic difference between the two groups indicates main feature of LEP locates in the frontal regions in the chronic pain.
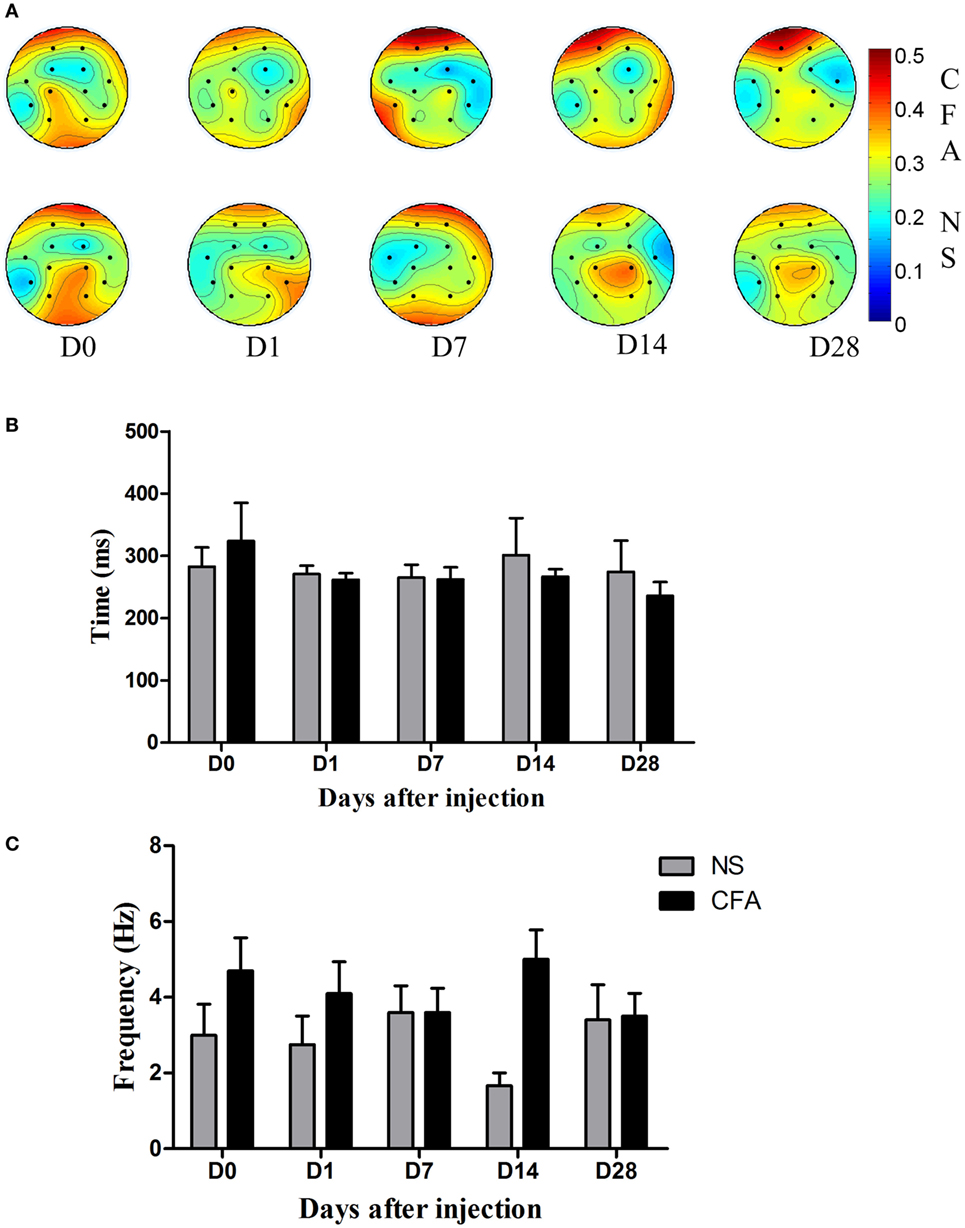
Figure 3. The channel, frequency, and time characteristics in the complete Freund’s adjuvant (CFA) induced monoarthritis and normal saline (NS) control groups. (A) Topography of channel coefficients. The upper picture was average value of coefficients for each channel in control rats at days 0, 1, 7, 14, and 28. The lower picture was the average value of coefficients for each channel in rats with chronic pain at days 0, 1, 7, 14, and 28. (B) The results of the time feature in comparison between the CFA pain and NS control groups at days 0, 1, 7, 14, and 28. There is no difference between groups at each time point in the time domain. (C) The results of the frequency feature in comparison between the CFA pain and NS control groups at days 0, 1, 7, 14, and 28. There is main effect of group [Fgroup(1,69) = 5.3, P = 0.024], indicating the frequency response to the nociceptive stimulation was higher in the CFA group than that in the NS group.
The difference in the time domain and the difference in the frequency domain between the two groups were plotted in Figures 3B,C, respectively. We found that there was no difference between groups at each time point in the time domain [Fgroup(1,69) = 0.63, P = 0.42]. The time information of both groups was around 250 ms.
In the frequency domain, there was a statistically significant higher frequency response in the CFA group than the NS groups [Fgroup(1,69) = 5.3, P = 0.024]. Post hoc analysis revealed no specific day showed difference between groups (P > 0.05).
Discussion
PARAFAC Method
Previous studies showed that the PARAFAC was a promising approach to process multiple channel EEG signals (21) and has been successfully used to characterize the structure of epileptic EEG data (17, 22, 23). In this study, the PARAFAC method was used to extract the information in the time–frequency–channel from the ERPs of rats with chronic pain. The feature extracted by PARAFAC was around 250 ms in the prefrontal and parietal regions. It is noticeable that the feature matches with the corresponding ERP results (Figure 2A, d and Figure 2B, d) and with previous LEP findings that the N2/P2 complex components peaks in the frontal region at approximately 250 ms after stimulus onset (24). These results provided further evidence as suggested by Wang (16) that the PARAFAC is an interesting method to detect the principal character of LEP.
Nociception-Corrected LEP during the Development of Chronic Pain
Laser-evoked potential is dependent on intensity of nociceptive perception (25). Equivalent stimulus intensity leads to significantly different intensity of nociceptive perception between CFA rats and control due to the thermal hyperalgesia in chronic pain. In order to eliminate the influence of stimulus-induced perceptional intensity on the laser-evoked potentials, we corrected the laser intensity for both CFA and NS group based on their nociceptive behavioral response. Laser intensities that produced equivalent nociceptive perception for both CFA and NS rats were used. Thus, the difference of LEP in our study between chronic pain and control is more likely reflect the innate difference in the neural system instead of the difference due to the external stimulus-induced perception.
Based on the definition of chronic pain that pain lasts even after the original tissue damage has cured, the nature of chronic pain is the persistence of pain. Traditional researches that study changes at one time point of chronic pain are limited for providing the ongoing and developmental characteristic of chronic pain. In this study, we explored longitudinal study to find the dynamic changes of ERP features during the development of chronic pain.
Location Feature of LEP during the Development of Chronic Pain
The frontal and parietal brain regions were found to be the principal feature response to the laser nociceptive stimulation at day 0 (Figure 3A). The parietal region is shown to process the sensory component of pain information (26, 27). Besides, the frontal area, the location of the anterior cingulate cortex and prefrontal cortex, which are mainly responsible for in the emotional and cognitive aspect of pain (28), is also involves in processing the laser nociceptive information. This result is in accordance with previous findings in healthy people, showing the sources of the LEP were located in the primary somatosensory cortex of parietal region (28, 29).
Results showed that the coefficients in the frontal region increased in rats with chronic inflammatory pain but did not change in the control rats. It indicates rats with chronic inflammatory pain process the nociceptive information predominantly in the frontal regions. It was in line with previous functional magnetic resonance imaging and electrophysiology studies indicating activity in the prefrontal region was increased in chronic pain condition (9, 30). The difference in channel domain between the control rats and the rats with chronic pain suggests the network for processing pain information changes as chronic pain develops—from the sensory dominant network centered at the parietal brain region to the affective dominant network centered at the frontal region. This dynamic change of network over time supports the idea that the affective aspect of pain gradually outweighs the sensory aspect of pain in the development of chronic pain (31).
The contribution of the frontal region seemed to become smaller over recording days in the NS control group though statistic results showed no difference. This phenomenon was probably due to pain habitation, i.e., reduction of pain and pain-related response by repetitive stimulation (6, 32). Rennefeld reported that pain rating of healthy people was reduced after several days of repeated painful stimulation, indicating subjects are habituation to pain (32). During our experiment, rats received repetitive painful stimuli and became familiar with the nociceptive stimulation and the experimental procedures over time, so the unpleasant component reflected in the frontal region should have decreased gradually due to pain habitation. Interestingly, we found rats with chronic pain did not exhibit reduction of the frontal region activation as control rats did (Figure 3A). It suggests lack of habituation to pain in chronic pain condition.
Frequency Feature of LEP during the Development of Chronic Pain
In the frequency domain, the frequency response was found to be higher in rats with CFA than the control. It is consistent with previous finding that the frontal network predominantly oscillated at higher frequencies in chronic pain (33). It was reported that activity at both delta and theta frequency band (1–3 and 3–8 Hz) was associated with P300 component of ERP (34–36). From this perspective, these frequency responses are all belong to the P300 component. In view of the idea that higher frequency oscillations are incline to promote neural synchronization within focal areas and facilitate neural plasticity than lower frequency (37), the higher frequency in the frontal region in our results is probably related to neural sensitization of local brain region in the chronic pain condition. Results from in vitro studies demonstrating that synaptic plasticity and neural sensitization occur in frontal cortex under chronic pain conditions (38, 39) support this explanation. Although the frequency of ERP could provide extra information that overlaps in traditional time domain studies, the meaning of the frequency of ERP is unclear yet. Therefore, whether the difference between two groups in our results is physiological significance deserves further work. Anyway, our results provide a more detailed characterization of LEP in chronic pain.
Frequency response is usually studied as frequency bands, which could eliminate the individual variation. However, the edge of frequency band is artificial, and the trend of researches is to apply the dominant peak frequency rather than frequency band (40). In our study, we performed specific dominant frequency. Accordingly, it could be a reason for 1 Hz variations in the frequency domain shown at day 0 between two groups and at day 14 between other days.
Limitations and Future Directions
Our exploratory research has several limitations. First, LEP from ECoG of rats with chronic pain could not be transformed to patients, though rats study allows longitudinal study and high ratio of signal to noise. Further experiment from patients and ongoing pain would be performed. Second, the limited spatial resolution of rat ECoG and PARAFAC method is not allowed to be focused on specific brain areas, which is hard to explain the underlying neurophysiology mechanism. Third, the casual and unique relationship between these features and chronic pain is hardly determined from the current study. Intervention research is needed in future. Fourth, small sample size is a weak point because of long-time recordings.
In conclusion, we applied the PARAFAC analysis in the multichannel LEPs during the development of chronic pain. It was found that the frontal region with higher frequency was the principal feature of neural response in the chronic pain condition. These features provide a potential neural network characteristic for chronic pain. Besides, our study provides a promising strategy of applying LEP combined with PARAFAC for assisting chronic pain diagnosis and treatment.
Ethics Statement
All animal experiments were conducted with approval of the Animal Care and Use Committee of our university and were in accordance with the Guidelines of International Association for the Study of Pain.
Author Contributions
JW (first author) carried out the ECoG recording and data analysis, participated in the study design, and drafted the manuscript. JW (second author) carried out the data analysis. YW participated in the study design and helped to draft the manuscript. XL conceived of the study, participated in its design, and helped to draft the manuscript. All the authors read and approved the final manuscript.
Conflict of Interest Statement
The authors declare that the research was conducted in the absence of any commercial or financial relationships that could be construed as a potential conflict of interest.
Acknowledgments
The authors are grateful to Mr. Douglas Richards for critical reading of the manuscript. This work was supported by grants from the National Natural Science Foundation of China (81230023, 81571067, and 81521063), the Ministry of Science and Technology of China (“973” Program, 2013CB531905), the “111 Project”(B07001), and the National High Technology Research and Development Program of China (863 Program, 2015AA020514).
Funding
The first author JW is funded by Beijing Municipal Research Fund for Outstanding Young Scholar (2014000020124G155).
References
1. Merskey H, Bogduk N. Classification of Chronic Pain: Descriptions of Chronic Pain Syndromes and Definitions of Pain Terms. 2nd ed. Washington, DC: International Association for the Study of Pain (1994).
2. Tracey I, Bushnell MC. How neuroimaging studies have challenged us to rethink: is chronic pain a disease? J Pain (2009) 10:1113–20. doi: 10.1016/j.jpain.2009.09.001
3. Apkarian AV, Baliki MN, Farmer MA. Predicting transition to chronic pain. Curr Opin Neurol (2013) 26:360–7. doi:10.1097/WCO.0b013e32836336ad
4. Malaty A, Sabharwal J, Lirette LS, Chaiban G, Eissa H, Tolba R. How to assess a new patient for a multidisciplinary chronic pain rehabilitation program: a review article. Ochsner J (2014) 14(1):96–100.
5. Vossen C, Vossen H, van de Wetering W, Marcus M, van J, Lousberg R. The use of event-related potentials in chronic back pain patients. In: Norasteh AA, editor. Low Back Pain. InTech (2012). Available from: http://www.intechopen.com/books/low-back-pain/the-use-of-event-related-potentials-in-chronic-back-pain-patients
6. Vossen CJ, Vossen HGM, Joosten EA, van Os J, Lousberg R. Does habituation differ in chronic low back pain subjects compared to pain-free controls? A cross-sectional pain rating ERP study reanalyzed with the ERFIA multilevel method. Medicine (Baltimore) (2015) 94:e865. doi:10.1097/MD.0000000000000865
7. Guo Y, Wang Y, Sun Y, Wang J-Y. A brain signature to differentiate acute and chronic pain in rats. Front Comput Neurosci (2016) 10:41. doi:10.3389/fncom.2016.00041
8. Garcia-Larrea L, Convers P, Magnin M, André-Obadia N, Peyron R, Laurent B, et al. Laser-evoked potential abnormalities in central pain patients: the influence of spontaneous and provoked pain. Brain (2002) 125(Pt 12):2766–81. doi:10.1093/brain/awf275
9. Stern J, Jeanmonod D, Sarnthein J. Persistent EEG overactivation in the cortical pain matrix of neurogenic pain patients. Neuroimage (2006) 31:721–31. doi:10.1016/j.neuroimage.2005.12.042
10. Lorenz J, Grasedyck K, Bromm B. Middle and long latency somatosensory evoked potentials after painful laser stimulation in patients with fibromyalgia syndrome. Electroencephalogr Clin Neurophysiol (1996) 100:165–8. doi:10.1016/0013-4694(95)00259-6
11. de Tommaso M, Shevel E, Pecoraro C, Sardaro M, Losito L, Lamberti P, et al. Topographic analysis of laser evoked potentials in chronic tension-type headache: correlations with clinical features. Int J Psychophysiol (2006) 62(1):38–45. doi:10.1016/j.ijpsycho.2005.12.002
12. Bernat EM, Williams WJ, Gehring WJ. Decomposing ERP time-frequency energy using PCA. Clin Neurophysiol (2005) 116:1314–34. doi:10.1016/j.clinph.2005.01.019
13. Jung TP, Makeig S, Westerfield M, Townsend J, Courchesne E, Sejnowski TJ. Analysis and visualization of single-trial event-related potentials. Hum Brain Mapp (2001) 14:166–85. doi:10.1002/hbm.1050
14. Acar E, Yener B. Unsupervised multiway data analysis: a literature survey. IEEE Trans Knowl Data Eng (2009) 21:6–20. doi:10.1109/TKDE.2008.112
16. Wang J, Li X, Lu C, Voss LJ, Barnard JPM, Sleigh JW. Characteristics of evoked potential multiple EEG recordings in patients with chronic pain by means of parallel factor analysis. Comput Math Methods Med (2012) 2012:1–10. doi:10.1155/2012/279560
17. Acar E, Aykut-Bingol C, Bingol H, Bro R, Yener B. Multiway analysis of epilepsy tensors. Bioinformatics (2007) 23:i10–8. doi:10.1093/bioinformatics/btm210
18. Shaw FZ, Chen RF, Tsao HW, Yen CT. A multichannel system for recording and analysis of cortical field potentials in freely moving rats. J Neurosci Methods (1999) 88:33–43. doi:10.1016/S0165-0270(99)00010-2
19. Butler SH, Godefroy F, Besson JM, Weil-Fugazza J. A limited arthritic model for chronic pain studies in the rat. Pain (1992) 48:73–81. doi:10.1016/0304-3959(92)90133-V
20. Nion D, Sidiropoulos ND. Adaptive algorithms to track the PARAFAC decomposition of a third-order tensor. IEEE Trans Sig Process (2009) 57:2299–310. doi:10.1109/TSP.2009.2016885
21. Bro R. PARAFAC. Tutorial and applications. ?Chemometr Intell Lab Syst (1997) 38:149–71. doi:10.1016/S0169-7439(97)00032-4
22. Acar E, Bingöl CA, Bingöl H, Yener B. Computational analysis of epileptic focus localization. Proceedings of the 24th IASTED International Conference on Biomedical Engineering BioMed’06. Anaheim, CA: ACTA Press (2006). p. 317–22. Available from: http://dl.acm.org/citation.cfm?id=1166506.1166562
23. De Vos M, Vergult A, De Lathauwer L, De Clercq W, Van Huffel S, Dupont P, et al. Canonical decomposition of ictal scalp EEG reliably detects the seizure onset zone. Neuroimage (2007) 37:844–54. doi:10.1016/j.neuroimage.2007.04.041
24. Pazzaglia C, Valeriani M. Brain-evoked potentials as a tool for diagnosing neuropathic pain. Expert Rev Neurother (2009) 9:759–71. doi:10.1586/ern.09.16
25. Iannetti GD, Hughes NP, Lee MC, Mouraux A. Determinants of laser-evoked EEG responses: pain perception or stimulus saliency. J Neurophysiol (2008) 100(2):815–28. doi:10.1152/jn.00097.2008
26. Hayashi K, Ikemoto T, Ueno T, Arai Y-CP, Shimo K, Nishihara M, et al. Higher pain rating results in lower variability of somatosensory cortex activation by painful mechanical stimuli: an fMRI study. Clin Neurophysiol (2016) 127:1923–8. doi:10.1016/j.clinph.2016.01.008
27. Almeida TF, Roizenblatt S, Tufik S. Afferent pain pathways: a neuroanatomical review. Brain Res (2004) 1000:40–56. doi:10.1016/j.brainres.2003.10.073
28. Moisset X, Bouhassira D. Brain imaging of neuropathic pain. Neuroimage (2007) 37(Suppl 1):S80–8. doi:10.1016/j.neuroimage.2007.03.054
29. Baumgärtner U, Vogel H, Ohara S, Treede R-D, Lenz F. Dipole source analyses of laser evoked potentials obtained from subdural grid recordings from primary somatic sensory cortex. J Neurophysiol (2011) 106:722–30. doi:10.1152/jn.00135.2011
30. Casey KL, Lorenz J, Minoshima S. Insights into the pathophysiology of neuropathic pain through functional brain imaging. Exp Neurol (2003) 184(Suppl 1):S80–8. doi:10.1016/j.expneurol.2003.07.006
31. Hashmi JA, Baliki MN, Huang L, Baria AT, Torbey S, Hermann KM, et al. Shape shifting pain: chronification of back pain shifts brain representation from nociceptive to emotional circuits. Brain (2013) 136:2751–68. doi:10.1093/brain/awt211
32. Rennefeld C, Wiech K, Schoell ED, Lorenz J, Bingel U. Habituation to pain: further support for a central component. Pain (2010) 148:503–8. doi:10.1016/j.pain.2009.12.014
33. Otti A, Guendel H, Wohlschläger A, Zimmer C, Noll-Hussong M. Frequency shifts in the anterior default mode network and the salience network in chronic pain disorder. BMC Psychiatry (2013) 13:84. doi:10.1186/1471-244X-13-84
34. Bernat EM, Malone SM, Williams WJ, Patrick CJ, Iacono WG. Decomposing delta, theta, and alpha time–frequency ERP activity from a visual oddball task using PCA. Int J Psychophysiol (2007) 64:62–74. doi:10.1016/j.ijpsycho.2006.07.015
35. Gilmore CS, Malone SM, Bernat EM, Iacono WG. Relationship between the P3 event-related potential, its associated time-frequency components, and externalizing psychopathology. Psychophysiology (2010) 47:123–32. doi:10.1111/j.1469-8986.2009.00876.x
36. Jones KA, Porjesz B, Chorlian D, Rangaswamy M, Kamarajan C, Padmanabhapillai A, et al. S-transform time-frequency analysis of P300 reveals deficits in individuals diagnosed with alcoholism. Neurophysiol Clin (2006) 117:2128–43. doi:10.1016/j.clinph.2006.02.028
37. Buzsáki G, Anastassiou CA, Koch C. The origin of extracellular fields and currents – EEG, ECoG, LFP and spikes. Nat Rev Neurosci (2012) 13:407–20. doi:10.1038/nrn3241
38. Wei F, Li P, Zhuo M. Loss of synaptic depression in mammalian anterior cingulate cortex after amputation. J Neurosci (1999) 19:9346–54.
39. Zhuo M. Long-term potentiation in the anterior cingulate cortex and chronic pain. Philos Trans R Soc Lond B Biol Sci (2014) 369:20130146. doi:10.1098/rstb.2013.0146
Keywords: chronic inflammatory pain, event-related potentials, parallel factor analysis, wavelet transform, rat
Citation: Wang J, Wang J, Wan Y and Li X (2017) The Frontal Area with Higher Frequency Response Is the Principal Feature of Laser-Evoked Potentials in Rats with Chronic Inflammatory Pain: A Parallel Factor Analysis Study. Front. Neurol. 8:155. doi: 10.3389/fneur.2017.00155
Received: 15 September 2016; Accepted: 03 April 2017;
Published: 08 May 2017
Edited by:
Luke Henderson, University of Sydney, AustraliaReviewed by:
Guilherme Lucas, University of São Paulo, BrazilChris David Keating, University of Hertfordshire, UK
Copyright: © 2017 Wang, Wang, Wan and Li. This is an open-access article distributed under the terms of the Creative Commons Attribution License (CC BY). The use, distribution or reproduction in other forums is permitted, provided the original author(s) or licensor are credited and that the original publication in this journal is cited, in accordance with accepted academic practice. No use, distribution or reproduction is permitted which does not comply with these terms.
*Correspondence: You Wan, eXdhbkBoc2MucGt1LmVkdS5jbg==;
Xiaoli Li, eGlhb2xpQGJudS5lZHUuY24=