 Maria A. Rocca
 Giancarlo Comi
 Massimo Filippi1,2
- 1Neuroimaging Research Unit, Institute of Experimental Neurology, San Raffaele Scientific Institute, Vita-Salute San Raffaele University, Milan, Italy
- 2Department of Neurology, Institute of Experimental Neurology, San Raffaele Scientific Institute, Vita-Salute San Raffaele University, Milan, Italy
Introduction: Multiple sclerosis (MS) is characterised by the accumulation of permanent neurological disability secondary to irreversible tissue loss (neurodegeneration) in the brain and spinal cord. MRI measures derived from T1-weighted image analysis (i.e., black holes and atrophy) are correlated with pathological measures of irreversible tissue loss. Quantifying the degree of neurodegeneration in vivo using MRI may offer a surrogate marker with which to predict disability progression and the effect of treatment. This review evaluates the literature examining the association between MRI measures of neurodegeneration derived from T1-weighted images and disability in MS patients.
Methods: A systematic PubMed search was conducted in January 2017 to identify MRI studies in MS patients investigating the relationship between “black holes” and/or atrophy in the brain and spinal cord, and disability. Results were limited to human studies published in English in the previous 10 years.
Results: A large number of studies have evaluated the association between the previous MRI measures and disability. These vary considerably in terms of study design, duration of follow-up, size, and phenotype of the patient population. Most, although not all, have shown that there is a significant correlation between disability and black holes in the brain, as well as atrophy of the whole brain and grey matter. The results for brain white matter atrophy are less consistently positive, whereas studies evaluating spinal cord atrophy consistently showed a significant correlation with disability. Newer ways of measuring atrophy, thanks to the development of segmentation and voxel-wise methods, have allowed us to assess the involvement of strategic regions of the CNS (e.g., thalamus) and to map the regional distribution of damage. This has resulted in better correlations between MRI measures and disability and in the identification of the critical role played by some CNS structures for MS clinical manifestations.
Conclusion: The evaluation of MRI measures of atrophy as predictive markers of disability in MS is a highly active area of research. At present, measurement of atrophy remains within the realm of clinical studies, but its utility in clinical practice has been recognized and barriers to its implementation are starting to be addressed.
Introduction
The application of magnetic resonance imaging (MRI) techniques is integral to our understanding of the pathogenesis of multiple sclerosis (MS). Historically, MS was considered to be an autoimmune-driven inflammatory disease characterised by focal white matter (WM) demyelination (1), visualized as gadolinium-enhancing T1 and hyperintense T2 lesions on conventional MRI scans (2). However, the correlation between conventional MRI measures and the extent of clinical disability is limited, particularly when applied to individual patients—a phenomenon known as the “clinical–MRI paradox” (3).
Two major advances in our understanding of MS are helping to resolve this paradox. First, the pathological substrates of MS extend well beyond focal WM lesions. Advanced MRI techniques, as well as postmortem histopathological findings, have shown that MS is also characterised by more widespread damage to the so-called “normal-appearing” WM (NAWM), as well as focal and diffuse damage to the grey matter (GM) of the brain and spinal cord (3, 4). Second, it is also now apparent that at least some of the neurodegenerative changes in MS are independent of inflammatory demyelination (5, 6). Indeed, a number of pathogenic changes have been suggested to drive neurodegeneration, including mitochondrial damage, iron deposition, microglial activation, and altered ion channel activity (7–9).
It is well accepted that neurodegenerative changes, irrespective of their aetiology, underlie the accumulation of permanent neurological disability that characterises MS (10–13). As a consequence, a key area of research in the field of MS is the evaluation of neurodegenerative changes using MRI techniques and their association with clinical disability and cognitive dysfunction. The ultimate aim is to find predictive biomarkers for neurodegeneration and disability and to develop sensitive and specific imaging markers that can be used to monitor disease progression and evaluate the response to treatment.
The aim of this review was to discuss the literature examining the association between MRI measures of neurodegeneration derived from the analysis of T1-weighted images (black holes and atrophy) and disability in patients with MS. Black holes represent areas of focal axonal damage and irreversible tissue destruction (14), while atrophy is a more widespread axonal loss that is thought to be caused by tissue damage within lesions and Wallerian degeneration in related fibre pathways (15). At the level of the GM, neuronal loss and shrinkage also contribute to atrophy (16).
Atrophy is most commonly quantified as the loss of overall brain tissue from T1-weighted images. Some methods for atrophy quantification also work on T2 and FLAIR images. Advances in the methods of analysis have made it possible to measure atrophy of spinal cord, GM, WM, and specific regions and structures of the brain (e.g., thalamus, hippocampus, etc.). A number of techniques are used to quantify atrophy, ranging from manual bi-dimensional assessment to automated or semi-automated volumetric measurement. Methods for the quantification of atrophy are continuously evolving, improving not only image acquisition and analysis strategies but also in terms of increased understanding of the technical (e.g., sequence geometry, WM lesion influence, etc.), physiological (e.g., age, sex, hydration, etc.), lifestyle (e.g., alcohol consumption, smoking, diet), genetics (e.g., apolipoprotein E expression), and other factors (e.g., diabetes, cardiovascular risks) that may affect brain volume results. For instance, it is now established that WM lesions affect atrophy calculations, since they influence the detection of GM/WM/cerebrospinal fluid intensity differences. Different techniques, that can be applied in a wide range of atrophy tools, have been proposed to fill in the signal from these lesions and alleviate this problem. For a review of these techniques and factors, the reader is referred to review articles on this topic (17–20). With regards to the measurement of disability in patients with MS, a number of scales and tests are available. The most commonly used (at least in clinical trials) is the Expanded Disability Status Scale (EDSS), which is measured on a scale of 0 (no disability) to 10 (death due to MS) (21). Others include the timed 25-foot walk (T25FW) (22), the 9-hole peg test (9HPT) (23), and the Multiple Sclerosis Functional Composite (MSFC) (24), which is a composite of the T25FW, 9HPT, and a test of cognitive function. Although of significant interest, studies focusing on the association between atrophy and cognitive dysfunction were beyond the scope of this review and the reader is referred to a recent comprehensive review of the topic (25).
Methods
A systematic PubMed search was conducted in January 2017 to identify studies investigating the relationship between disability and black holes and/or atrophy in the brain and spinal cord. Results were limited to human studies published in English in the previous 10 years. Studies that examined the effect of disease-modifying treatments on measures of neurodegeneration were excluded, as this was outside the scope of this review. The search terminology is summarized in the Table S1 in Supplementary Material.
Results are presented first for studies that assessed black holes/atrophy in the brain, followed by studies that assessed these measures in the spinal cord. Studies that assessed both brain and spinal cord atrophy in relation to disability are presented in a separate section.
Results
Brain Black Holes and Atrophy
Overall, 59 key studies evaluating the association between MRI measures of brain neurodegeneration and disability were identified (Table 1). Of these, 38 were cross-sectional and 21 were longitudinal in design (either for clinical or MRI variables). Most were non-phenotype specific (n = 35), while 10 focused on relapsing-remitting multiple sclerosis (RRMS), four on primary progressive multiple sclerosis (PPMS), three on relapsing MS, two on clinically isolated syndrome (CIS), and one on relapsing onset (i.e., CIS, RRMS, and secondary progressive) MS. The remaining four studies compared MS subtypes. In the majority of studies, the EDSS score was used to assess disability; other disability measures included the MSFC, the Multiple Sclerosis Severity Score (MSSS), the 9HPT, and the T25FW. Most of the studies evaluated whole brain atrophy as a measure of neurodegeneration; other measures included black holes and atrophy of the global GM, global WM, regional GM, and/or GM of specific structures.
Table 1. MRI studies evaluating the relationship between brain black holes/atrophy and disability.
Black Holes
Historically, black holes were introduced as the first MRI measure of neurodegeneration and prevention of the evolution of newly formed lesions into persistent black holes is currently being evaluated as a possible measure of neuroprotection in several treatment trials in patients with MS.
The relationship between black holes and disability was assessed in seven studies (three cross-sectional and four longitudinal) (47, 55, 59, 66, 81, 86, 87). Giorgio et al. evaluated the association between black holes and EDSS scores in patients with RRMS who were followed up for 10 years (66). Higher EDSS scores at the end of the study were significantly correlated with higher numbers and volumes of black holes at baseline (p < 0.001 for both). Over the 10-year follow-up, there was a modest correlation between the increase in EDSS score and black hole volume (p < 0.001). In a stepwise multiple regression analysis, EDSS score worsening over 10 years was best associated with the combination of baseline black hole numbers and increasing black hole volume (p < 0.001) (Figure 1). In another study with a follow-up duration of approximately 12 years, the change in black hole lesion load was the only parameter remaining in the multiple regression model as a predictor of MSSS (81). In contrast, in the 13-year study conducted by Filippi et al., baseline black hole volume did not predict worsening disability assessed using the MSSS or EDSS (78). In a cross-sectional study of patients with untreated MS, the cube root (used to eliminate skew) of the black hole lesion load significantly correlated with the EDSS score (p < 0.01) (47).
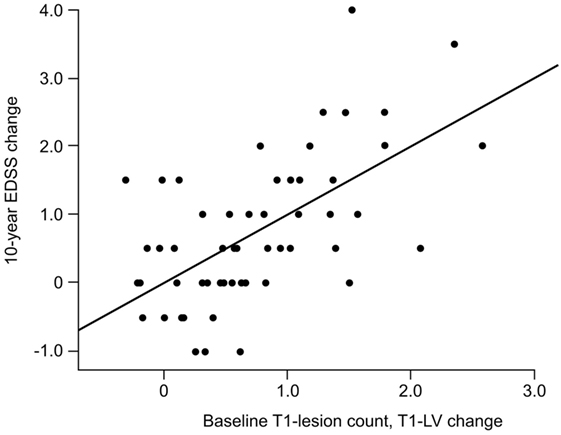
Figure 1. Correlation between the 10-year change in EDSS and the combined measure of baseline T1-hypointense lesion count and 10-year T1-hypointense lesion volume change (r = 0.61; p < 0.001). Reprinted from (66) by Permission of SAGE Publications, Ltd. Copyright © 2014 The authors of the original work.
Several strategies have been proposed to increase black hole detection and improve the correlation with disability, including the restriction of black hole measurements according to their intensity (59) or relaxation time thresholds (55).
Whole Brain Atrophy
Twenty studies (7 cross-sectional and 13 longitudinal) evaluated the association between whole brain atrophy and disability; most included patients with mixed disease phenotype. Five of the cross-sectional studies reported a significant correlation between whole brain atrophy and EDSS (p < 0.05 for all; see Table 1 for individual p-values) (37, 43, 54, 56, 58). In the sixth cross-sectional study, the level of brain atrophy was significantly greater in patients requiring ambulatory assistance compared with those not requiring assistance (p = 0.001) (42).
Of the 13 longitudinal studies, 5 demonstrated a correlation between brain atrophy and disability (75, 77, 80, 81, 86), while 4 indicated that there was no correlation (74, 76, 79, 84). Among these, the study by Jacobsen et al. had the longest follow-up period (5 and 10 years) (77). At 5 years, patients with disability progression had significantly greater whole brain volume loss than those with no progression (p < 0.001), while at 10 years, there was a trend for greater decrease in whole brain volume in patients with disability progression (p = 0.015; statistical significance set at p < 0.01) (77).
Results were mixed in two of the other longitudinal studies. In the study by Tedeschi et al., which included 267 patients with MS, there was a significant correlation between baseline brain volume and the EDSS score at follow-up (2 years) (p < 0.0001). In addition, brain volume was significantly lower in patients with progression vs those with stable or improved disability (p < 0.05). However, baseline brain volume was not related to the change in EDSS score during the follow-up period (70). Pichler et al. found that although there was no association between the decline in whole brain volume and disability, quartiles of percentage change in brain volume were associated with the degree of disability (p = 0.01) (85).
The two remaining longitudinal studies evaluated the predictive value of baseline brain volume and T2 lesion load for subsequent disability. In a 5-year study in patients with RRMS, Vaneckova et al. demonstrated a significant correlation between increased brain atrophy in the first 2 years and EDSS score increase at years 4 and 5 in patients with a low lesion load at baseline (p < 0.01); this correlation was not observed for those with a high baseline lesion burden (65). In another study, the probability of sustained disability progression (an EDSS score ≥3 within 3 years) was almost five times higher in patients with a low brain volume and a high T2 lesion volume compared with patients with a high brain volume and low T2 lesion volume (71).
GM Atrophy
Global
Twelve studies (eight cross-sectional and four longitudinal) evaluated the correlation between global GM loss and disability. Of the six cross-sectional studies that assessed disability using the EDSS, three studies [including one with a large patient population (n = 927)] demonstrated a significant correlation with EDSS score (26, 40, 56), while three showed no significant correlation (28, 32). In the cross-sectional study by Motl et al., GM volume significantly correlated with results of the 6-minute walk (6 MW; p < 0.05), but not the T25FW (52). In the remaining cross-sectional study, in patients with MS, there was a significant difference in GM atrophy in those requiring ambulatory assistance vs those who did not (p = 0.0008) (42).
In the 13-year longitudinal study of patients with MS conducted by Filippi et al., a lower baseline GM fraction predicted worsening disability at final follow-up, as assessed using EDSS (p = 0.01) and MSSS (p = 0.0005) (78). A correlation between GM atrophy and disability (the MSFC score in particular) was also noted in a longitudinal study in an MS population that included patients with CIS, RRMS, and secondary progressive multiple sclerosis (SPMS) (Figure 2) (79). In the large 2-year longitudinal study of patients with MS (78% of whom had RRMS) conducted by Tedeschi et al., there was a significant correlation between GM volume and EDSS score at the end of the follow-up period (p < 0.0001), and baseline GM volume was significantly lower in patients with disability progression compared with those who did not progress (p < 0.05) (70). However, baseline GM atrophy was not related to EDSS change during the 2-year follow-up period. Finally, in the study by Rudick et al., a low baseline GM fraction correlated with an EDSS score ≥6 at final follow-up (mean, 6.6 years), and patients with disability progression (measured using the MSFC, but not the EDSS) had significantly higher GM atrophy rates compared with those who did not progress (p = 0.03) (80).
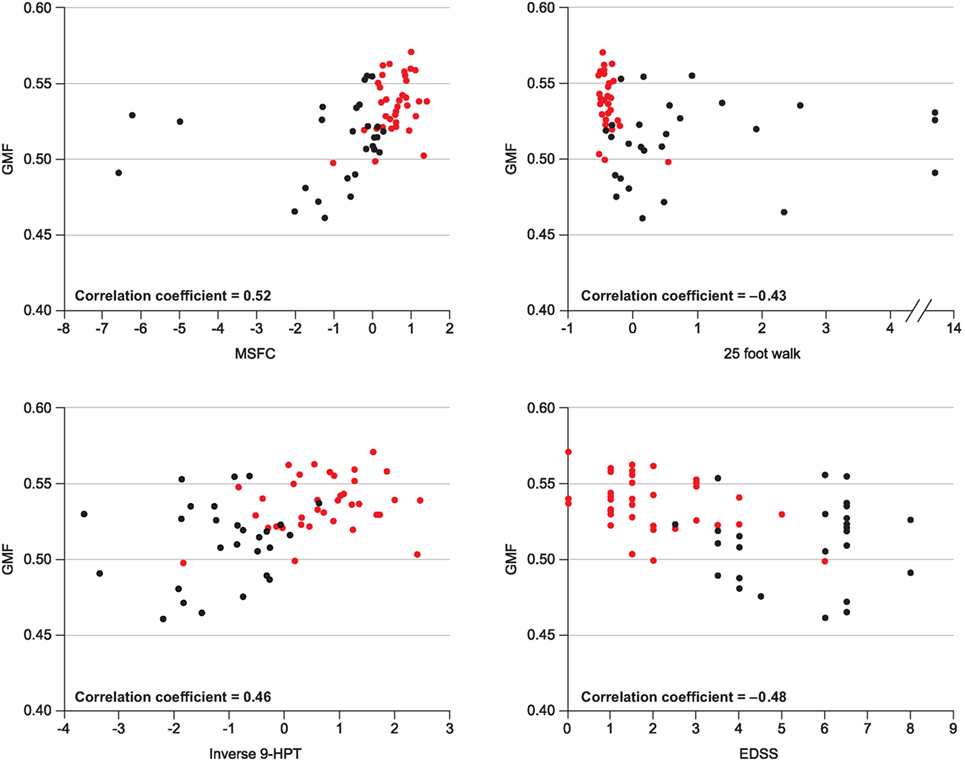
Figure 2. Correlation between GMF and various clinical measures of disability. Republished with permission of John Wiley and Sons Inc, from (79).
Regional GM, Including Specific GM Structures
Several studies have applied different methods of analysis to assess the role of atrophy of specific GM structures (cortex, deep GM structures, etc.) in disability. Many of these studies (mostly cross-sectional) have evaluated the association between cortical GM loss and disability, but with mixed results (see Table 1). The largest of the cross-sectional studies included 208 patients with RRMS, PPMS, or SPMS (41), 128 patients with RRMS (28), and 115 patients with CIS, possible MS, RRMS, or SPMS (46). In the study by Steenwijk et al., reduced cortical thickness was one of the significant predictors of EDSS in a multivariate model (p < 0.05) (41). In the study by Prinster et al., there was a correlation between EDSS score and GM loss in the bilateral primary motor and somatosensory areas and middle frontal gyri (28). Calabrese et al. were unable to demonstrate a correlation between diffuse cortical thinning and EDSS score; however, significant correlations were observed between some of the functional system scores and atrophy of the corresponding cortical areas, e.g., the visual functional system score and atrophy of the visual cortex (46).
Three of the four longitudinal studies demonstrated an association between disability and atrophy of the cortex (p = 0.009) (77), the bilateral cingulate cortex (p = 0.003) (69), and the right precuneus and postcentral gyrus (p < 0.001 for both) (64). In the fourth longitudinal study, conducted in patients with CIS or definite MS, there was no association between the decline in cortical GM volume and progression of disability (85).
A number of studies have shown that there is an association between disability and GM atrophy in the thalamus and basal ganglia (29, 35, 48, 50, 52, 53, 60, 67, 77). For example, Tao et al. demonstrated a significant correlation between atrophy of the thalamus, caudate nucleus, and putamen and EDSS score in a cross-sectional study in patients with relapsing MS (all p < 0.0001) (35). In another cross-sectional study in patients with RRMS, those with EDSS scores >3.0 had more severe GM atrophy in the left basal ganglia and thalamus compared with those with scores ≤3.0 (29). In the longitudinal study conducted by Jacobsen et al., atrophy of the putamen was implicated in disability progression at 5 years (77), and early thalamic atrophy was an independent predictor of disability at 8 years in the study by Rocca et al. (67). However, other studies have not shown a correlation between disability and GM loss in the thalamus and/or basal ganglia (31, 68, 78). This includes the 13-year longitudinal study by Filippi et al., in which baseline thalamic fraction was not an independent predictor of change in EDSS score or MSSS at the final follow-up (78). Also, in the study by Mesaros et al., neither baseline nor mean change in thalamic volume significantly correlated with change in EDSS score over 5 years (68).
Another structure that has been evaluated in a number of studies is the cerebellum. These studies have shown a significant correlation between GM atrophy of the cerebellum and EDSS score (27, 49) and 9HPT (49, 51, 57); the correlation with T25FW was statistically significant in one study (49), but not another (51). In the small study by Anderson et al., however, there was no significant correlation between cerebellar GM volume and a number of disability measures, including EDSS and 9HPT (63). D’Ambrosio et al. evaluated the correlation between the EDSS/9HPT and whole and sub-regional cerebellar volumes; in a multivariate analysis, only the anterior cerebellar volume remained significant (p = 0.003 for the EDSS and p = 0.02 for the 9HPT) (36).
WM Atrophy
Thirteen studies (seven cross-sectional and six longitudinal) assessed the association between global WM atrophy and disability (39, 40, 42, 52, 56, 57, 70, 77–80, 85). In the cross-sectional study by Prinster et al., WM loss correlated with EDSS score (p < 0.0001) (28), while Howard et al. demonstrated a significant difference in WM atrophy in patients requiring ambulatory assistance vs those who did not (p = 0.02) (42). Although Motl et al. showed that there was a significant correlation between global WM atrophy and results of the 6 MW and T25FW tests (p < 0.01 for both), these did not survive in linear regression analysis (52). Three cross-sectional studies—including the large study (n = 927) conducted by Roosendaal et al.—did not show a correlation between WM atrophy and EDSS score (40, 56).
In five of the longitudinal studies, there was no association between global WM atrophy and disability (26, 77–79, 85). In the longitudinal study by Tedeschi et al., there was a significant correlation between WM atrophy and EDSS score at the end of the follow-up period (2 years) (p < 0.0001), but not with the change in the EDSS score during follow-up (70). Finally, in the study by Rudick et al., a lower baseline WM fraction correlated with an EDSS score ≥6 at final follow-up (mean, 6.6 years), but the level of WM atrophy was similar in patients with and without MSFC progression (80).
Three studies (two longitudinal and one cross-sectional) evaluated the association between the corpus callosum index (CCI; a measure that is thought to reflect brain atrophy) and disability. In one longitudinal study, the CCI correlated with EDSS score at diagnosis, but did not predict 7-year disability (72). In the second longitudinal study, baseline CCI was able to distinguish RRMS from SPMS, but did not correlate with the EDSS score after 5 years (73). In the cross-sectional study, there was a significant correlation between the CCI and EDSS score (56). Studies have also evaluated CC area and volume, but with mixed results (34, 56, 82); one of these studies was longitudinal and demonstrated a persistent association between the corpus callosum area and disability during a mean follow-up of 9 years (p < 0.05) (82).
Spinal Cord Atrophy
Spinal cord abnormalities at the onset of MS have important prognostic implications and extensive spinal cord pathology is common as the disease progresses (88). Sixteen studies were identified evaluating the relationship between spinal cord atrophy and disability (Table 2); all but one (89) were cross-sectional, although the study by Yiannakas et al. included a longitudinal subgroup. These studies consistently demonstrated a significant correlation between clinical disability and cervical cord cross-sectional area (CSA) at various cord levels (89–100) as well as regional (C2/C3) and overall volume of the cervical cord (101). Exceptions were the studies by Weier et al. in 202 patients with MS, which found a weak correlation between signs of spinal cord atrophy and EDSS scores (102), and the study by Blamire et al. (n = 11), which found no correlation between spinal cord atrophy and various measures of disability (103). The largest study, which included 335 patients with MS, demonstrated that although cord CSA correlated with EDSS in the overall population (p < 0.0001), there were different effects according to MS clinical phenotype. The association was significant for RRMS (p = 0.001), SPMS (p = 0.001), and PPMS (p = 0.01), but not for CIS or benign MS (95).
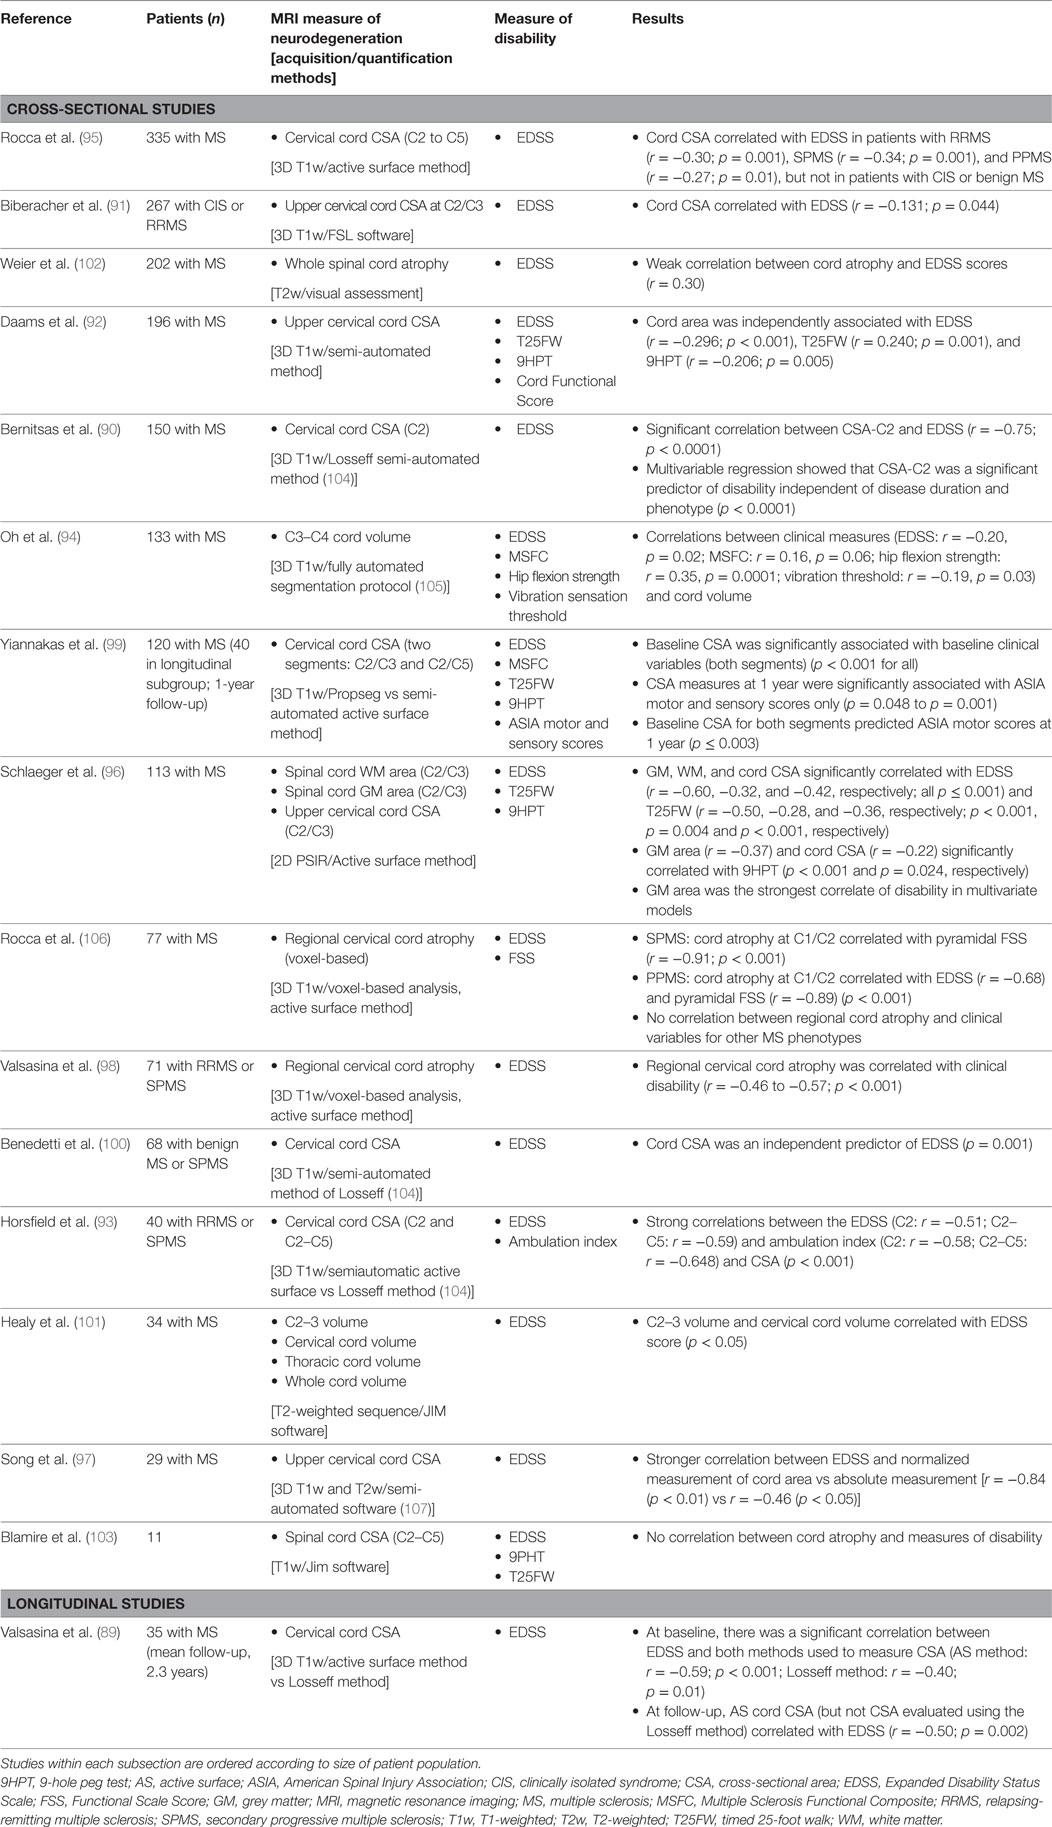
Table 2. MRI studies evaluating the relationship between spinal cord atrophy and disability.
In the longitudinal study of 35 patients with MS conducted by Valsasina et al., there were significant associations between cord CSA and EDSS, both at baseline and follow-up (89). In the subgroup analysis of 40 patients from the study conducted by Yiannakas et al. who were followed up for 1 year, cervical spinal cord CSA at the end of follow-up was significantly associated with American Spinal Injury Association (ASIA) motor and sensory scores (p = 0.048 to p = 0.001), but not with EDSS, MSFC, T25FW, or 9HPT (99). Cord CSA predicted ASIA motor scores at 1 year (p ≤ 0.001) (99).
The association between regional cervical cord involvement and disability has also been explored. In the voxel-based study by Valsasina et al., regional cord atrophy was more widespread in patients with SPMS than in those with RRMS. In the overall population, cervical cord atrophy correlated with clinical disability (p < 0.001) (98). In the study by Rocca et al., the regional distribution of cord atrophy differed significantly among the main MS clinical phenotypes. Regional cord atrophy was correlated with clinical disability and impairment in the pyramidal system for progressive MS (p < 0.001), but there was no correlation between cord atrophy and disability for the other MS phenotypes (CIS, RRMS, and benign MS) (106).
Schlaeger et al. evaluated the association between spinal cord WM and GM area and various measures of disability (96). They demonstrated that GM and WM area (as well as CSA) correlated significantly with EDSS score (p ≤ 0.001 for both) and T25FW results (p < 0.001 and p = 0.004, respectively), whereas only the GM area correlated significantly with the 9HPT results (p = 0.024). In a multivariate model, spinal cord GM area was the strongest correlate of the EDSS score (96). In another study by the same group, which evaluated both brain and spinal cord atrophy (see next section), there was a significant correlation between thoracic cord GM area and lower limb function (108).
Brain and Spinal Cord Atrophy
Fifteen studies (mainly cross-sectional) have evaluated both brain and spinal atrophy correlation with disability (Table 3). Two of the largest studies, one cross-sectional and one longitudinal, were conducted by Lukas et al. (109, 110). In the cross-sectional study, which included 440 patients with MS, spinal cord (but not brain) atrophy and brain black hole volume were independent explanatory factors for the EDSS score, while spinal cord and GM brain atrophy were the strongest explanatory factors for physical disability measured using the T25FW (110). In the longitudinal study, in which 352 patients with MS were followed up for 2 years, baseline cord CSA (p = 0.03) and the annualized percentage change in brain volume (p = 0.07) were significant predictors of disability progression (EDSS score change) at year 2 (109).
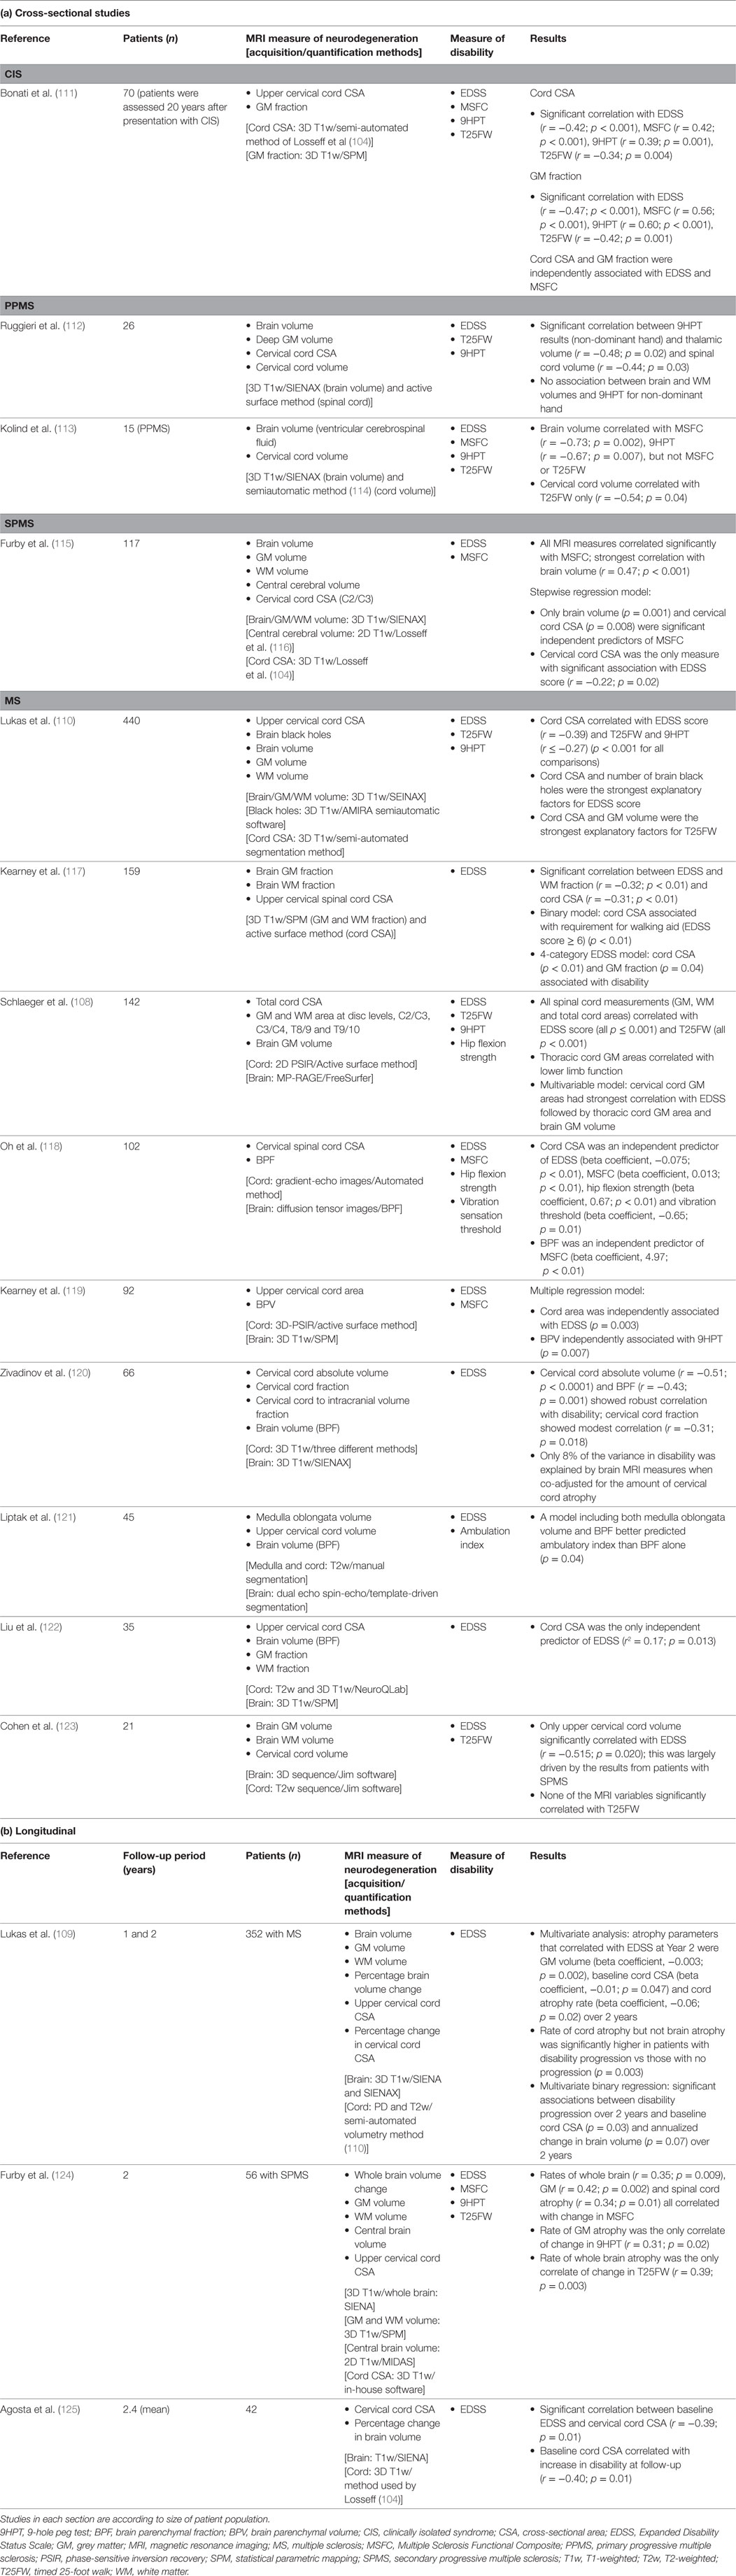
Table 3. MRI studies evaluating the relationship between brain and spinal cord black holes/atrophy and disability.
In three other studies (all cross-sectional), which used multivariate regression to analyse the data, cervical cord CSA was an independent predictor of disability (118, 119, 122). In their cross-sectional study of 142 patients with MS, Schlaeger et al. used multivariate analysis to evaluate the impact on disability of various brain and spinal cord measures of atrophy (108). They found that cervical cord GM area had strongest correlation with the EDSS score, followed by thoracic cord GM area and brain GM volume.
Discussion
This review summarizes the results of studies that have assessed the association between MRI measures of CNS neurodegeneration derived from the assessment of T1-weighted images (mostly atrophy) and disability progression in MS. Relevant studies were identified via a systematic evaluation of the published literature using PubMed, and it is acknowledged that some relevant studies may not have been identified if terms for atrophy and disability were not included in the publication abstract (e.g., studies that evaluated cognition as the primary endpoint). Nevertheless, over 90 studies were identified. Most, though not all, of the studies identified have shown a significant correlation between atrophy and disability. Of the various measures used to assess neurodegeneration, the most consistent results were obtained with GM and spinal cord atrophy. The results for global WM atrophy in the brain were least consistent. Overall, 18 studies assessed both global GM and global WM atrophy; in eight of these, GM but not WM atrophy was shown to correlate with disability (26, 40, 56, 78, 79, 109, 110, 124), compared with only one study showing the opposite (28). In the large study by Tedeschi et al., the EDSS at the end of the 2-year follow-up was significantly correlated with both global GM and global WM atrophy, but the correlation was stronger for the GM (r = −0.423 vs −0.256 for WM) (70). It is possible that degeneration of specific WM tracts contributes to disability and that a global measurement is not sensitive enough to detect this. It should also be borne in mind that conventional MRI techniques are not able to characterise and quantify all of the heterogeneous features of MS pathology (126). Several advanced MRI techniques specific to different aspects of MS pathology have been developed to evaluate the extent and distribution of microstructural tissue abnormalities in MS. Their application is contributing to improvements in the understanding of the mechanisms responsible for the presence and worsening of clinical disability. These include magnetization transfer MRI (127), which measures microstructural tissue abnormalities, and diffusion tensor imaging (128), which allows axonal and myelin injury to be quantified. In addition, the combination of postmortem MRI and histopathological evaluation is providing important insights into the abnormalities observed on MRI, enabling translation of basic pathology to the clinical setting and validation of new MRI techniques (4).
It has been suggested that combining MRI markers may increase sensitivity to disability changes. One composite that combines three MRI measures of MS severity is the Magnetic Resonance Disease Severity Scale (MRDSS), which generates a score between 0 and 10 based on T2 lesion volume, brain volume [brain parenchymal fraction (BPF)] and the ratio of the T1:T2 lesion volume (129). Although the MRDSS showed a larger effect size than any of the individual components in distinguishing patients with RRMS from those with SPMS, the correlation with the EDSS score was similar to that observed with BPF (129). In a subsequent longitudinal study, prediction of disability (EDSS score) progression was significant for T2 lesion volume only (76). More recently, the MRDSS (MRDSS2) has been revised, replacing BPF with GM fraction and adding upper spinal cord CSA (130). The correlation between MRDSS2 and EDSS score was shown to be significant in 55 patients with MS (130). Pardini et al. have proposed a composite MRI-based measure that assesses motor network integrity (131). It is based on fractional anisotropy, magnetization transfer ratio, and normalized tract volume of motor network connections. The ability of this composite measure to predict disability was substantially greater than conventional non-network-based MRI measures (131). Another approach to improving visualization of MS-induced neurodegeneration is the use of multimodal MRI acquisition (132). A correlation with disability was observed when this method was applied to cortical GM and corpus callosum WM in patients with RRMS (132).
In most of the studies in which it was evaluated, there was a correlation between black holes and disability outcome measures. This supports the concept that focal, irreversible tissue loss, as well as more diffuse loss of tissue, has an impact on disability in MS. A number of the studies assessing black holes also evaluated T2 lesion load, which represents focal WM lesions. In the largest of these studies (110), conducted in 440 patients, there was a significant correlation between T2 lesion load and EDSS in the univariate, but not the multivariate analysis, while black hole lesion load was significant in both analyses. Notably, neither parameter was significant in the multivariate analysis of the association with T25FW results (110). In the study by Caramanos et al., the correlation with EDSS was greater for black holes than T2 lesions (47), and in the study by Giorgio et al., EDSS worsening over 10 years was best correlated with the combination of baseline black hole lesion count and increasing black hole lesion volume (66).
When considering the results of the studies included in this review, it should be borne in mind that correlation does not prove causality, and multivariate analysis, to control for confounding variables, was not applied in all studies. It is also clear from the information presented (Tables 1–3) that studies evaluating atrophy and disability are relatively heterogeneous in terms of sample size and follow-up duration, and even within studies, patient populations are heterogeneous, including a range of MS phenotypes. Heterogeneity of patient populations may be of considerable significance as the study conducted by Lukas et al., which was large enough to allow comparisons between MS subtypes, demonstrated differences in spinal cord atrophy between the progressive and relapsing forms, and showed that brain GM atrophy also differed between subtypes (109). Furthermore, in the study by Rocca et al., the correlation between spinal cord atrophy and disability was significant in some MS phenotypes, but not others (95). These differences warrant further research. Another potential confounding factor is possible variations in the use of disease-modifying therapies, which are known to affect brain volume (133, 134). The most commonly used measure of disability in the studies surveyed was the EDSS score. Although this is a very well-established measure of disability, its limitations—in particular its focus on mobility and lack of sensitivity to change—are recognized (135).
Establishing a definitive link between MRI measures of neurodegeneration and disability progression would allow such measures to be used as objective surrogate markers of disease progression, with the potential to predict future disability. They could also be used to evaluate response to treatment, which will become increasingly important as research becomes more focused on developing treatments for progressive stages/forms of MS.
Brain atrophy is already being used as an outcome measure in clinical trials of disease-modifying therapies for MS. Indeed, in a meta-analysis of data from 13 trials (including >13,500 patients with RRMS), treatment effects on disability progression were correlated with treatment effects both on brain atrophy and on active MRI lesions (134). At a recent expert panel meeting, a group of MS neurologists and neuro-radiologists reviewed the current literature on brain atrophy and discussed the challenges in assessing and implementing brain atrophy measurements in clinical practice (136). Brain volume loss was considered a useful longitudinal measure of disease progression and cognitive function in patients with MS (136). However, at present, methodological constraints (e.g., standardization of acquisition, lack of robust post-processing procedures) and physiological confounding factors (e.g., degree of hydration, other medical conditions) mean that brain atrophy measurement, although sufficiently precise for cohort studies, is not suitable for confidently predicting changes in individual patients (19). It has been suggested that the CCI may be a more practical measure of neurodegeneration in MS. It has been shown to correlate with the BPF (an accepted measure of brain atrophy) and is reliable and simple to apply, without the need for sophisticated software (72, 73). However, although it was significantly correlated with disability in a cross-sectional study (56), it was not an independent predictor of long-term disability in a longitudinal study (72).
Concluding Remarks
The evaluation of MRI measures of neurodegeneration as predictive markers of disability in MS is a highly active area of research. Over the last 10 years, a large number of MRI studies have added to the existing literature on this subject, confirming that in general, MRI measures of atrophy correlate with disability. These efforts have culminated in the use of brain atrophy measurements to assess the effects of disease-modifying therapies. Although currently limited to clinical trials, discussions are beginning on how brain atrophy measurement can be applied in clinical practice. The next 10 years promises to be equally fruitful; as MRI techniques evolve, so the pathological substrates of disability will become more clearly delineated. As we work toward this goal, we should not lose sight of the challenges, both technological and financial, of introducing these techniques into everyday clinical practice.
Author Contributions
All the authors were responsible for defining the scope and content of the article. All the authors reviewed each draft and provided approval of the final version.
Conflict of Interest Statement
MR has received speaker honoraria from Biogen Idec, Novartis, Teva Neurosciences, and Genzyme and receives research support from the Italian Ministry of Health and Fondazione Italiana Sclerosi Multipla. GC has received compensation for consulting services for Novartis, Teva, Sanofi, Genzyme, Merck, Biogen, Excemed, Roche, Almirall, Chugai, Receptos and Forward Pharma, and compensation for speaking activities for Novartis, Teva, Sanofi, Genzyme, Merck, Biogen, Excemed, and Roche. MF is Editor-in-Chief of the Journal of Neurology; serves on a scientific advisory board for Teva Pharmaceutical Industries; has received compensation for consulting services and/or speaking activities from Biogen Idec, Merk-Serono, Novartis, and Teva Pharmaceutical Industries; and receives research support from Biogen Idec, Teva Pharmaceutical Industries, Novartis, Italian Ministry of Health, Fondazione Italiana Sclerosi Multipla, Cure PSP, Alzheimer’s Drug Discovery Foundation (ADDF), the Jacques and Gloria Gossweiler Foundation (Switzerland), and ARiSLA (Fondazione Italiana di Ricerca per la SLA).
Funding
Editorial support was provided by Nicky French PhD of Anthemis Consulting Ltd., funded by Teva Pharmaceuticals USA, Frazer, PA, USA. The authors were not compensated for preparation of the manuscript.
Supplementary Material
The Supplementary Material for this article can be found online at http://journal.frontiersin.org/article/10.3389/fneur.2017.00433/full#supplementary-material.
References
1. Meuth SG, Bittner S, Wiendl H. Immunotherapy of multiple sclerosis. Acta Neuropsychiatr (2009) 21(Suppl 2):27–34. doi:10.1017/S092427080003266X
2. Trip SA, Miller DH. Imaging in multiple sclerosis. J Neurol Neurosurg Psychiatry (2005) 76(Suppl 3):iii11–8. doi:10.1136/jnnp.2005.073213
3. Filippi M, Rocca MA, Rovaris M. Clinical trials and clinical practice in multiple sclerosis: conventional and emerging magnetic resonance imaging technologies. Curr Neurol Neurosci Rep (2002) 2(3):267–76. doi:10.1007/s11910-002-0086-2
4. Seewann A, Kooi EJ, Roosendaal SD, Barkhof F, van der Valk P, Geurts JJ. Translating pathology in multiple sclerosis: the combination of postmortem imaging, histopathology and clinical findings. Acta Neurol Scand (2009) 119(6):349–55. doi:10.1111/j.1600-0404.2008.01137.x
5. Centonze D, Muzio L, Rossi S, Furlan R, Bernardi G, Martino G. The link between inflammation, synaptic transmission and neurodegeneration in multiple sclerosis. Cell Death Differ (2010) 17(7):1083–91. doi:10.1038/cdd.2009.179
6. Ziemann U, Wahl M, Hattingen E, Tumani H. Development of biomarkers for multiple sclerosis as a neurodegenerative disorder. Prog Neurobiol (2011) 95(4):670–85. doi:10.1016/j.pneurobio.2011.04.007
7. Friese MA, Schattling B, Fugger L. Mechanisms of neurodegeneration and axonal dysfunction in multiple sclerosis. Nat Rev Neurol (2014) 10(4):225–38. doi:10.1038/nrneurol.2014.37
8. Inglese M, Petracca M. Imaging multiple sclerosis and other neurodegenerative diseases. Prion (2013) 7(1):47–54. doi:10.4161/pri.22650
9. Lassmann H, van Horssen J. The molecular basis of neurodegeneration in multiple sclerosis. FEBS Lett (2011) 585(23):3715–23. doi:10.1016/j.febslet.2011.08.004
10. Confavreux C, Vukusic S. Accumulation of irreversible disability in multiple sclerosis: from epidemiology to treatment. Clin Neurol Neurosurg (2006) 108(3):327–32. doi:10.1016/j.clineuro.2005.11.018
11. Lee JY, Taghian K, Petratos S. Axonal degeneration in multiple sclerosis: can we predict and prevent permanent disability? Acta Neuropathol Commun (2014) 2:97. doi:10.1186/s40478-014-0097-7
12. Luessi F, Siffrin V, Zipp F. Neurodegeneration in multiple sclerosis: novel treatment strategies. Expert Rev Neurother (2012) 12(9):1061–76; quiz 1077. doi:10.1586/ern.12.59
13. Nataf S. Neuroinflammation responses and neurodegeneration in multiple sclerosis. Rev Neurol (2009) 165(12):1023–8. doi:10.1016/j.neurol.2009.09.012
14. van Waesberghe JH, Kamphorst W, De Groot CJ, van Walderveen MA, Castelijns JA, Ravid R, et al. Axonal loss in multiple sclerosis lesions: magnetic resonance imaging insights into substrates of disability. Ann Neurol (1999) 46(5):747–54. doi:10.1002/1531-8249(199911)46:5<747::AID-ANA10>3.0.CO;2-4
15. Filippi M, Rocca MA, Barkhof F, Bruck W, Chen JT, Comi G, et al. Association between pathological and MRI findings in multiple sclerosis. Lancet Neurol (2012) 11(4):349–60. doi:10.1016/S1474-4422(12)70003-0
16. Popescu V, Klaver R, Voorn P, Galis-de Graaf Y, Knol DL, Twisk JW, et al. What drives MRI-measured cortical atrophy in multiple sclerosis? Mult Scler (2015) 21(10):1280–90. doi:10.1177/1352458514562440
17. Miller DH, Barkhof F, Frank JA, Parker GJ, Thompson AJ. Measurement of atrophy in multiple sclerosis: pathological basis, methodological aspects and clinical relevance. Brain (2002) 125(Pt 8):1676–95. doi:10.1093/brain/awf177
18. Radu EW, Bendfeldt K, Mueller-Lenke N, Magon S, Sprenger T. Brain atrophy: an in-vivo measure of disease activity in multiple sclerosis. Swiss Med Wkly (2013) 143:w13887. doi:10.4414/smw.2013.13887
19. Rocca MA, Battaglini M, Benedict RH, De Stefano N, Geurts JJ, Henry RG, et al. Brain MRI atrophy quantification in MS: from methods to clinical application. Neurology (2017) 88(4):403–13. doi:10.1212/WNL.0000000000003542
20. Rojas JI, Patrucco L, Miguez J, Cristiano E. Brain atrophy in multiple sclerosis: therapeutic, cognitive and clinical impact. Arq Neuropsiquiatr (2016) 74(3):235–43. doi:10.1590/0004-282X20160015
21. Kurtzke JF. On the origin of EDSS. Mult Scler Relat Disord (2015) 4(2):95–103. doi:10.1016/j.msard.2015.02.003
22. Motl RW, Cohen JA, Benedict R, Phillips G, LaRocca N, Hudson LD, et al. Validity of the timed 25-foot walk as an ambulatory performance outcome measure for multiple sclerosis. Mult Scler (2017) 23(5):704–10. doi:10.1177/1352458517690823
23. Feys P, Lamers I, Francis G, Benedict R, Phillips G, LaRocca N, et al. The nine-hole peg test as a manual dexterity performance measure for multiple sclerosis. Mult Scler (2017) 23(5):711–20. doi:10.1177/1352458517690824
24. Ontaneda D, LaRocca N, Coetzee T, Rudick R; NMSS MSFC Task Force. Revisiting the Multiple Sclerosis Functional Composite: proceedings from the National Multiple Sclerosis Society (NMSS) Task Force on Clinical Disability Measures. Mult Scler (2012) 18(8):1074–80. doi:10.1177/1352458512451512
25. Vollmer T, Huynh L, Kelley C, Galebach P, Signorovitch J, DiBernardo A, et al. Relationship between brain volume loss and cognitive outcomes among patients with multiple sclerosis: a systematic literature review. Neurol Sci (2016) 37(2):165–79. doi:10.1007/s10072-015-2400-1
26. Fisniku LK, Chard DT, Jackson JS, Anderson VM, Altmann DR, Miszkiel KA, et al. Gray matter atrophy is related to long-term disability in multiple sclerosis. Ann Neurol (2008) 64(3):247–54. doi:10.1002/ana.21423
27. Audoin B, Zaaraoui W, Reuter F, Rico A, Malikova I, Confort-Gouny S, et al. Atrophy mainly affects the limbic system and the deep grey matter at the first stage of multiple sclerosis. J Neurol Neurosurg Psychiatry (2010) 81(6):690–5. doi:10.1136/jnnp.2009.188748
28. Prinster A, Quarantelli M, Lanzillo R, Orefice G, Vacca G, Carotenuto B, et al. A voxel-based morphometry study of disease severity correlates in relapsing-remitting multiple sclerosis. Mult Scler (2010) 16(1):45–54. doi:10.1177/1352458509351896
29. Riccitelli G, Rocca MA, Pagani E, Martinelli V, Radaelli M, Falini A, et al. Mapping regional grey and white matter atrophy in relapsing-remitting multiple sclerosis. Mult Scler (2012) 18(7):1027–37. doi:10.1177/1352458512439239
30. Nygaard GO, Walhovd KB, Sowa P, Chepkoech JL, Bjornerud A, Due-Tonnessen P, et al. Cortical thickness and surface area relate to specific symptoms in early relapsing-remitting multiple sclerosis. Mult Scler (2015) 21(4):402–14. doi:10.1177/1352458514543811
31. Hasan KM, Walimuni IS, Abid H, Datta S, Wolinsky JS, Narayana PA. Human brain atlas-based multimodal MRI analysis of volumetry, diffusimetry, relaxometry and lesion distribution in multiple sclerosis patients and healthy adult controls: implications for understanding the pathogenesis of multiple sclerosis and consolidation of quantitative MRI results in MS. J Neurol Sci (2012) 313(1–2):99–109. doi:10.1016/j.jns.2011.09.015
32. Duan Y, Liu Y, Liang P, Jia X, Yu C, Qin W, et al. Comparison of grey matter atrophy between patients with neuromyelitis optica and multiple sclerosis: a voxel-based morphometry study. Eur J Radiol (2012) 81(2):e110–4. doi:10.1016/j.ejrad.2011.01.065
33. Mesaros S, Rocca MA, Absinta M, Ghezzi A, Milani N, Moiola L, et al. Evidence of thalamic gray matter loss in pediatric multiple sclerosis. Neurology (2008) 70(13 Pt 2):1107–12. doi:10.1212/01.wnl.0000291010.54692.85
34. Llufriu S, Blanco Y, Martinez-Heras E, Casanova-Molla J, Gabilondo I, Sepulveda M, et al. Influence of corpus callosum damage on cognition and physical disability in multiple sclerosis: a multimodal study. PLoS One (2012) 7(5):e37167. doi:10.1371/journal.pone.0037167
35. Tao G, Datta S, He R, Nelson F, Wolinsky JS, Narayana PA. Deep gray matter atrophy in multiple sclerosis: a tensor based morphometry. J Neurol Sci (2009) 282(1–2):39–46. doi:10.1016/j.jns.2008.12.035
36. D’Ambrosio A, Pagani E, Riccitelli GC, Colombo B, Rodegher M, Falini A, et al. Cerebellar contribution to motor and cognitive performance in multiple sclerosis: an MRI sub-regional volumetric analysis. Mult Scler (2017) 23(9):1194–203. doi:10.1177/1352458516674567
37. Mineev KK, Prakhova LN, Il’ves AG, Kataeva GV, Petrov AM, Reznikova TN, et al. Characteristics of neurological and cognitive status in patients with multiple sclerosis in relation to the location and volumes of demyelination foci and the severity of brain atrophy. Neurosci Behav Physiol (2009) 39(1):35–8. doi:10.1007/s11055-008-9086-2
38. Bodini B, Khaleeli Z, Cercignani M, Miller DH, Thompson AJ, Ciccarelli O. Exploring the relationship between white matter and gray matter damage in early primary progressive multiple sclerosis: an in vivo study with TBSS and VBM. Hum Brain Mapp (2009) 30(9):2852–61. doi:10.1002/hbm.20713
39. Galego O, Gouveia A, Batista S, Moura C, Machado E. Brain atrophy and physical disability in primary progressive multiple sclerosis: a volumetric study. Neuroradiol J (2015) 28(3):354–8. doi:10.1177/1971400915594984
40. Roosendaal SD, Bendfeldt K, Vrenken H, Polman CH, Borgwardt S, Radue EW, et al. Grey matter volume in a large cohort of MS patients: relation to MRI parameters and disability. Mult Scler (2011) 17(9):1098–106. doi:10.1177/1352458511404916
41. Steenwijk MD, Geurts JJ, Daams M, Tijms BM, Wink AM, Balk LJ, et al. Cortical atrophy patterns in multiple sclerosis are non-random and clinically relevant. Brain (2016) 139(Pt 1):115–26. doi:10.1093/brain/awv337
42. Howard J, Battaglini M, Babb JS, Arienzo D, Holst B, Omari M, et al. MRI correlates of disability in African-Americans with multiple sclerosis. PLoS One (2012) 7(8):e43061. doi:10.1371/journal.pone.0043061
43. Tauhid S, Neema M, Healy BC, Weiner HL, Bakshi R. MRI phenotypes based on cerebral lesions and atrophy in patients with multiple sclerosis. J Neurol Sci (2014) 346(1–2):250–4. doi:10.1016/j.jns.2014.08.047
44. Preziosa P, Rocca MA, Mesaros S, Pagani E, Drulovic J, Stosic-Opincal T, et al. Relationship between damage to the cerebellar peduncles and clinical disability in multiple sclerosis. Radiology (2014) 271(3):822–30. doi:10.1148/radiol.13132142
45. Yaldizli O, Penner IK, Yonekawa T, Naegelin Y, Kuhle J, Pardini M, et al. The association between olfactory bulb volume, cognitive dysfunction, physical disability and depression in multiple sclerosis. Eur J Neurol (2016) 23(3):510–9. doi:10.1111/ene.12891
46. Calabrese M, Atzori M, Bernardi V, Morra A, Romualdi C, Rinaldi L, et al. Cortical atrophy is relevant in multiple sclerosis at clinical onset. J Neurol (2007) 254(9):1212–20. doi:10.1007/s00415-006-0503-6
47. Caramanos Z, Francis SJ, Narayanan S, Lapierre Y, Arnold DL. Large, nonplateauing relationship between clinical disability and cerebral white matter lesion load in patients with multiple sclerosis. Arch Neurol (2012) 69(1):89–95. doi:10.1001/archneurol.2011.765
48. Ramasamy DP, Benedict RH, Cox JL, Fritz D, Abdelrahman N, Hussein S, et al. Extent of cerebellum, subcortical and cortical atrophy in patients with MS: a case-control study. J Neurol Sci (2009) 282(1–2):47–54. doi:10.1016/j.jns.2008.12.034
49. van de Pavert SH, Muhlert N, Sethi V, Wheeler-Kingshott CA, Ridgway GR, Geurts JJ, et al. DIR-visible grey matter lesions and atrophy in multiple sclerosis: partners in crime? J Neurol Neurosurg Psychiatry (2016) 87(5):461–7. doi:10.1136/jnnp-2014-310142
50. Motl RW, Zivadinov R, Bergsland N, Benedict RH. Thalamus volume and ambulation in multiple sclerosis: a cross-sectional study. Neurodegener Dis Manag (2016) 6(1):23–9. doi:10.2217/nmt.15.71
51. Anderson VM, Fisniku LK, Altmann DR, Thompson AJ, Miller DH. MRI measures show significant cerebellar gray matter volume loss in multiple sclerosis and are associated with cerebellar dysfunction. Mult Scler (2009) 15(7):811–7. doi:10.1177/1352458508101934
52. Motl RW, Hubbard EA, Sreekumar N, Wetter NC, Sutton BP, Pilutti LA, et al. Pallidal and caudate volumes correlate with walking function in multiple sclerosis. J Neurol Sci (2015) 354(1–2):33–6. doi:10.1016/j.jns.2015.04.041
53. Shiee N, Bazin PL, Zackowski KM, Farrell SK, Harrison DM, Newsome SD, et al. Revisiting brain atrophy and its relationship to disability in multiple sclerosis. PLoS One (2012) 7(5):e37049. doi:10.1371/journal.pone.0037049
54. Jaworski J, Psujek M, Janczarek M, Szczerbo-Trojanowska M, Bartosik-Psujek H. Total-tau in cerebrospinal fluid of patients with multiple sclerosis decreases in secondary progressive stage of disease and reflects degree of brain atrophy. Ups J Med Sci (2012) 117(3):284–92. doi:10.3109/03009734.2012.669423
55. Thaler C, Faizy T, Sedlacik J, Holst B, Stellmann JP, Young KL, et al. T1-thresholds in black holes increase clinical-radiological correlation in multiple sclerosis patients. PLoS One (2015) 10(12):e0144693. doi:10.1371/journal.pone.0144693
56. Granberg T, Bergendal G, Shams S, Aspelin P, Kristoffersen-Wiberg M, Fredrikson S, et al. MRI-defined corpus callosal atrophy in multiple sclerosis: a comparison of volumetric measurements, corpus callosum area and index. J Neuroimaging (2015) 25(6):996–1001. doi:10.1111/jon.12237
57. Sbardella E, Petsas N, Tona F, Prosperini L, Raz E, Pace G, et al. Assessing the correlation between grey and white matter damage with motor and cognitive impairment in multiple sclerosis patients. PLoS One (2013) 8(5):e63250. doi:10.1371/journal.pone.0063250
58. Chu R, Tauhid S, Glanz BI, Healy BC, Kim G, Oommen VV, et al. Whole brain volume measured from 1.5T versus 3T MRI in healthy subjects and patients with multiple sclerosis. J Neuroimaging (2016) 26(1):62–7. doi:10.1111/jon.12271
59. Tam RC, Traboulsee A, Riddehough A, Sheikhzadeh F, Li DK. The impact of intensity variations in T1-hypointense lesions on clinical correlations in multiple sclerosis. Mult Scler (2011) 17(8):949–57. doi:10.1177/1352458511402113
60. Zimmermann H, Rolfsnes HO, Montag S, Wilting J, Droby A, Reuter E, et al. Putaminal alteration in multiple sclerosis patients with spinal cord lesions. J Neural Transm (2015) 122(10):1465–73. doi:10.1007/s00702-015-1406-4
61. Gorgoraptis N, Wheeler-Kingshott CA, Jenkins TM, Altmann DR, Miller DH, Thompson AJ, et al. Combining tractography and cortical measures to test system-specific hypotheses in multiple sclerosis. Mult Scler (2010) 16(5):555–65. doi:10.1177/1352458510362440
62. Varoglu AO, Odaci E, Gumus H, Keles ON, Unal B, Deniz O. Evaluation of patients with multiple sclerosis using a combination of morphometrical features and clinical scores. J Clin Neurosci (2010) 17(2):191–5. doi:10.1016/j.jocn.2009.04.023
63. Anderson VM, Wheeler-Kingshott CA, Abdel-Aziz K, Miller DH, Toosy A, Thompson AJ, et al. A comprehensive assessment of cerebellar damage in multiple sclerosis using diffusion tractography and volumetric analysis. Mult Scler (2011) 17(9):1079–87. doi:10.1177/1352458511403528
64. Hofstetter L, Naegelin Y, Filli L, Kuster P, Traud S, Smieskova R, et al. Progression in disability and regional grey matter atrophy in relapsing-remitting multiple sclerosis. Mult Scler (2014) 20(2):202–13. doi:10.1177/1352458513493034
65. Vaneckova M, Seidl Z, Krasensky J, Havrdova E, Horakova D, Dolezal O, et al. Patients’ stratification and correlation of brain magnetic resonance imaging parameters with disability progression in multiple sclerosis. Eur Neurol (2009) 61(5):278–84. doi:10.1159/000206852
66. Giorgio A, Stromillo ML, Bartolozzi ML, Rossi F, Battaglini M, De Leucio A, et al. Relevance of hypointense brain MRI lesions for long-term worsening of clinical disability in relapsing multiple sclerosis. Mult Scler (2014) 20(2):214–9. doi:10.1177/1352458513494490
67. Rocca MA, Mesaros S, Pagani E, Sormani MP, Comi G, Filippi M. Thalamic damage and long-term progression of disability in multiple sclerosis. Radiology (2010) 257(2):463–9. doi:10.1148/radiol.10100326
68. Mesaros S, Rocca MA, Pagani E, Sormani MP, Petrolini M, Comi G, et al. Thalamic damage predicts the evolution of primary-progressive multiple sclerosis at 5 years. AJNR Am J Neuroradiol (2011) 32(6):1016–20. doi:10.3174/ajnr.A2430
69. Eshaghi A, Bodini B, Ridgway GR, Garcia-Lorenzo D, Tozer DJ, Sahraian MA, et al. Temporal and spatial evolution of grey matter atrophy in primary progressive multiple sclerosis. Neuroimage (2014) 86:257–64. doi:10.1016/j.neuroimage.2013.09.059
70. Tedeschi G, Dinacci D, Comerci M, Lavorgna L, Savettieri G, Quattrone A, et al. Brain atrophy evolution and lesion load accrual in multiple sclerosis: a 2-year follow-up study. Mult Scler (2009) 15(2):204–11. doi:10.1177/1352458508098270
71. Gauthier SA, Mandel M, Guttmann CR, Glanz BI, Khoury SJ, Betensky RA, et al. Predicting short-term disability in multiple sclerosis. Neurology (2007) 68(24):2059–65. doi:10.1212/01.wnl.0000264890.97479.b1
72. Yaldizli O, Atefy R, Gass A, Sturm D, Glassl S, Tettenborn B, et al. Corpus callosum index and long-term disability in multiple sclerosis patients. J Neurol (2010) 257(8):1256–64. doi:10.1007/s00415-010-5503-x
73. Figueira FF, Santos VS, Figueira GM, Silva AC. Corpus callosum index: a practical method for long-term follow-up in multiple sclerosis. Arq Neuropsiquiatr (2007) 65(4a):931–5. doi:10.1590/S0004-282X2007000600001
74. Neema M, Arora A, Healy BC, Guss ZD, Brass SD, Duan Y, et al. Deep gray matter involvement on brain MRI scans is associated with clinical progression in multiple sclerosis. J Neuroimaging (2009) 19(1):3–8. doi:10.1111/j.1552-6569.2008.00296.x
75. Minneboo A, Jasperse B, Barkhof F, Uitdehaag BM, Knol DL, de Groot V, et al. Predicting short-term disability progression in early multiple sclerosis: added value of MRI parameters. J Neurol Neurosurg Psychiatry (2008) 79(8):917–23. doi:10.1136/jnnp.2007.124123
76. Moodie J, Healy BC, Buckle GJ, Gauthier SA, Glanz BI, Arora A, et al. Magnetic Resonance Disease Severity Scale (MRDSS) for patients with multiple sclerosis: a longitudinal study. J Neurol Sci (2012) 315(1–2):49–54. doi:10.1016/j.jns.2011.11.040
77. Jacobsen C, Hagemeier J, Myhr KM, Nyland H, Lode K, Bergsland N, et al. Brain atrophy and disability progression in multiple sclerosis patients: a 10-year follow-up study. J Neurol Neurosurg Psychiatry (2014) 85(10):1109–15. doi:10.1136/jnnp-2013-306906
78. Filippi M, Preziosa P, Copetti M, Riccitelli G, Horsfield MA, Martinelli V, et al. Gray matter damage predicts the accumulation of disability 13 years later in MS. Neurology (2013) 81(20):1759–67. doi:10.1212/01.wnl.0000435551.90824.d0
79. Fisher E, Lee JC, Nakamura K, Rudick RA. Gray matter atrophy in multiple sclerosis: a longitudinal study. Ann Neurol (2008) 64(3):255–65. doi:10.1002/ana.21436
80. Rudick RA, Lee JC, Nakamura K, Fisher E. Gray matter atrophy correlates with MS disability progression measured with MSFC but not EDSS. J Neurol Sci (2009) 282(1–2):106–11. doi:10.1016/j.jns.2008.11.018
81. Minneboo A, Uitdehaag BM, Jongen P, Vrenken H, Knol D, van Walderveen MA, et al. Association between MRI parameters and the MS severity scale: a 12 year follow-up study. Mult Scler (2009) 15(5):632–7. doi:10.1177/1352458509102617
82. Martola J, Stawiarz L, Fredrikson S, Hillert J, Bergstrom J, Flodmark O, et al. Progression of non-age-related callosal brain atrophy in multiple sclerosis: a 9-year longitudinal MRI study representing four decades of disease development. J Neurol Neurosurg Psychiatry (2007) 78(4):375–80. doi:10.1136/jnnp.2006.106690
83. Martola J, Stawiarz L, Fredrikson S, Hillert J, Bergstrom J, Flodmark O, et al. Rate of ventricular enlargement in multiple sclerosis: a nine-year magnetic resonance imaging follow-up study. Acta Radiol (2008) 49(5):570–9. doi:10.1080/02841850802039898
84. Martola J, Bergstrom J, Fredrikson S, Stawiarz L, Hillert J, Zhang Y, et al. A longitudinal observational study of brain atrophy rate reflecting four decades of multiple sclerosis: a comparison of serial 1D, 2D, and volumetric measurements from MRI images. Neuroradiology (2010) 52(2):109–17. doi:10.1007/s00234-009-0593-9
85. Pichler A, Khalil M, Langkammer C, Pinter D, Bachmaier G, Ropele S, et al. Combined analysis of global and compartmental brain volume changes in early multiple sclerosis in clinical practice. Mult Scler (2016) 22(3):340–6. doi:10.1177/1352458515593405
86. Masek M, Vaneckova M, Krasensky J, Danes J, Havrdova E, Hrebikova T, et al. Secondary-progressive form of multiple sclerosis: MRI changes versus clinical status. Neuro Endocrinol Lett (2008) 29(4):461–6.
87. Filippi M. MRI measures of neurodegeneration in multiple sclerosis: implications for disability, disease monitoring, and treatment. J Neurol (2015) 262(1):1–6. doi:10.1007/s00415-014-7340-9
88. Kearney H, Miller DH, Ciccarelli O. Spinal cord MRI in multiple sclerosis – diagnostic, prognostic and clinical value. Nat Rev Neurol (2015) 11(6):327–38. doi:10.1038/nrneurol.2015.80
89. Valsasina P, Rocca MA, Horsfield MA, Copetti M, Filippi M. A longitudinal MRI study of cervical cord atrophy in multiple sclerosis. J Neurol (2015) 262(7):1622–8. doi:10.1007/s00415-015-7754-z
90. Bernitsas E, Bao F, Seraji-Bozorgzad N, Chorostecki J, Santiago C, Tselis A, et al. Spinal cord atrophy in multiple sclerosis and relationship with disability across clinical phenotypes. Mult Scler Relat Disord (2015) 4(1):47–51. doi:10.1016/j.msard.2014.11.002
91. Biberacher V, Boucard CC, Schmidt P, Engl C, Buck D, Berthele A, et al. Atrophy and structural variability of the upper cervical cord in early multiple sclerosis. Mult Scler (2015) 21(7):875–84. doi:10.1177/1352458514546514
92. Daams M, Weiler F, Steenwijk MD, Hahn HK, Geurts JJ, Vrenken H, et al. Mean upper cervical cord area (MUCCA) measurement in long-standing multiple sclerosis: relation to brain findings and clinical disability. Mult Scler (2014) 20(14):1860–5. doi:10.1177/1352458514533399
93. Horsfield MA, Sala S, Neema M, Absinta M, Bakshi A, Sormani MP, et al. Rapid semi-automatic segmentation of the spinal cord from magnetic resonance images: application in multiple sclerosis. Neuroimage (2010) 50(2):446–55. doi:10.1016/j.neuroimage.2009.12.121
94. Oh J, Seigo M, Saidha S, Sotirchos E, Zackowski K, Chen M, et al. Spinal cord normalization in multiple sclerosis. J Neuroimaging (2014) 24(6):577–84. doi:10.1111/jon.12097
95. Rocca MA, Horsfield MA, Sala S, Copetti M, Valsasina P, Mesaros S, et al. A multicenter assessment of cervical cord atrophy among MS clinical phenotypes. Neurology (2011) 76(24):2096–102. doi:10.1212/WNL.0b013e31821f46b8
96. Schlaeger R, Papinutto N, Panara V, Bevan C, Lobach IV, Bucci M, et al. Spinal cord gray matter atrophy correlates with multiple sclerosis disability. Ann Neurol (2014) 76(4):568–80. doi:10.1002/ana.24241
97. Song F, Huan Y, Yin H, Ge Y, Wei G, Chang Y, et al. Normalized upper cervical spinal cord atrophy in multiple sclerosis. J Neuroimaging (2008) 18(3):320–7. doi:10.1111/j.1552-6569.2007.00222.x
98. Valsasina P, Rocca MA, Horsfield MA, Absinta M, Messina R, Caputo D, et al. Regional cervical cord atrophy and disability in multiple sclerosis: a voxel-based analysis. Radiology (2013) 266(3):853–61. doi:10.1148/radiol.12120813
99. Yiannakas MC, Mustafa AM, De Leener B, Kearney H, Tur C, Altmann DR, et al. Fully automated segmentation of the cervical cord from T1-weighted MRI using PropSeg: application to multiple sclerosis. Neuroimage Clin (2016) 10:71–7. doi:10.1016/j.nicl.2015.11.001
100. Benedetti B, Rocca MA, Rovaris M, Caputo D, Zaffaroni M, Capra R, et al. A diffusion tensor MRI study of cervical cord damage in benign and secondary progressive multiple sclerosis patients. J Neurol Neurosurg Psychiatry (2010) 81(1):26–30. doi:10.1136/jnnp.2009.173120
101. Healy BC, Arora A, Hayden DL, Ceccarelli A, Tauhid SS, Neema M, et al. Approaches to normalization of spinal cord volume: application to multiple sclerosis. J Neuroimaging (2012) 22(3):e12–9. doi:10.1111/j.1552-6569.2011.00629.x
102. Weier K, Mazraeh J, Naegelin Y, Thoeni A, Hirsch JG, Fabbro T, et al. Biplanar MRI for the assessment of the spinal cord in multiple sclerosis. Mult Scler (2012) 18(11):1560–9. doi:10.1177/1352458512442754
103. Blamire AM, Cader S, Lee M, Palace J, Matthews PM. Axonal damage in the spinal cord of multiple sclerosis patients detected by magnetic resonance spectroscopy. Magn Reson Med (2007) 58(5):880–5. doi:10.1002/mrm.21382
104. Losseff NA, Webb SL, O’Riordan JI, Page R, Wang L, Barker GJ, et al. Spinal cord atrophy and disability in multiple sclerosis. A new reproducible and sensitive MRI method with potential to monitor disease progression. Brain (1996) 119(Pt 3):701–8. doi:10.1093/brain/119.3.701
105. Chen M, Carass A, Oh J, Nair G, Pham DL, Reich DS, et al. Automatic magnetic resonance spinal cord segmentation with topology constraints for variable fields of view. Neuroimage (2013) 83:1051–62. doi:10.1016/j.neuroimage.2013.07.060
106. Rocca MA, Valsasina P, Damjanovic D, Horsfield MA, Mesaros S, Stosic-Opincal T, et al. Voxel-wise mapping of cervical cord damage in multiple sclerosis patients with different clinical phenotypes. J Neurol Neurosurg Psychiatry (2013) 84(1):35–41. doi:10.1136/jnnp-2012-303821
107. Lin X, Blumhardt LD. Inflammation and atrophy in multiple sclerosis: MRI associations with disease course. J Neurol Sci (2001) 189(1–2):99–104. doi:10.1016/S0022-510X(01)00576-7
108. Schlaeger R, Papinutto N, Zhu AH, Lobach IV, Bevan CJ, Bucci M, et al. Association between thoracic spinal cord gray matter atrophy and disability in multiple sclerosis. JAMA Neurol (2015) 72(8):897–904. doi:10.1001/jamaneurol.2015.0993
109. Lukas C, Knol DL, Sombekke MH, Bellenberg B, Hahn HK, Popescu V, et al. Cervical spinal cord volume loss is related to clinical disability progression in multiple sclerosis. J Neurol Neurosurg Psychiatry (2015) 86(4):410–8. doi:10.1136/jnnp-2014-308021
110. Lukas C, Sombekke MH, Bellenberg B, Hahn HK, Popescu V, Bendfeldt K, et al. Relevance of spinal cord abnormalities to clinical disability in multiple sclerosis: MR imaging findings in a large cohort of patients. Radiology (2013) 269(2):542–52. doi:10.1148/radiol.13122566
111. Bonati U, Fisniku LK, Altmann DR, Yiannakas MC, Furby J, Thompson AJ, et al. Cervical cord and brain grey matter atrophy independently associate with long-term MS disability. J Neurol Neurosurg Psychiatry (2011) 82(4):471–2. doi:10.1136/jnnp.2010.205021
112. Ruggieri S, Petracca M, Miller A, Krieger S, Ghassemi R, Bencosme Y, et al. Association of deep gray matter damage with cortical and spinal cord degeneration in primary progressive multiple sclerosis. JAMA Neurol (2015) 72(12):1466–74. doi:10.1001/jamaneurol.2015.1897
113. Kolind S, Seddigh A, Combes A, Russell-Schulz B, Tam R, Yogendrakumar V, et al. Brain and cord myelin water imaging: a progressive multiple sclerosis biomarker. Neuroimage Clin (2015) 9:574–80. doi:10.1016/j.nicl.2015.10.002
114. Tench CR, Morgan PS, Constantinescu CS. Measurement of cervical spinal cord cross-sectional area by MRI using edge detection and partial volume correction. J Magn Reson Imaging (2005) 21(3):197–203. doi:10.1002/jmri.20253
115. Furby J, Hayton T, Anderson V, Altmann D, Brenner R, Chataway J, et al. Magnetic resonance imaging measures of brain and spinal cord atrophy correlate with clinical impairment in secondary progressive multiple sclerosis. Mult Scler (2008) 14(8):1068–75. doi:10.1177/1352458508093617
116. Losseff NA, Wang L, Lai HM, Yoo DS, Gawne-Cain ML, McDonald WI, et al. Progressive cerebral atrophy in multiple sclerosis. A serial MRI study. Brain (1996) 119(Pt 6):2009–19. doi:10.1093/brain/119.6.2009
117. Kearney H, Rocca MA, Valsasina P, Balk L, Sastre-Garriga J, Reinhardt J, et al. Magnetic resonance imaging correlates of physical disability in relapse onset multiple sclerosis of long disease duration. Mult Scler (2014) 20(1):72–80. doi:10.1177/1352458513492245
118. Oh J, Sotirchos ES, Saidha S, Whetstone A, Chen M, Newsome SD, et al. Relationships between quantitative spinal cord MRI and retinal layers in multiple sclerosis. Neurology (2015) 84(7):720–8. doi:10.1212/WNL.0000000000001257
119. Kearney H, Altmann DR, Samson RS, Yiannakas MC, Wheeler-Kingshott CA, Ciccarelli O, et al. Cervical cord lesion load is associated with disability independently from atrophy in MS. Neurology (2015) 84(4):367–73. doi:10.1212/WNL.0000000000001186
120. Zivadinov R, Banas AC, Yella V, Abdelrahman N, Weinstock-Guttman B, Dwyer MG. Comparison of three different methods for measurement of cervical cord atrophy in multiple sclerosis. AJNR Am J Neuroradiol (2008) 29(2):319–25. doi:10.3174/ajnr.A0813
121. Liptak Z, Berger AM, Sampat MP, Charil A, Felsovalyi O, Healy BC, et al. Medulla oblongata volume: a biomarker of spinal cord damage and disability in multiple sclerosis. AJNR Am J Neuroradiol (2008) 29(8):1465–70. doi:10.3174/ajnr.A1162
122. Liu Y, Wang J, Daams M, Weiler F, Hahn HK, Duan Y, et al. Differential patterns of spinal cord and brain atrophy in NMO and MS. Neurology (2015) 84(14):1465–72. doi:10.1212/WNL.0000000000001441
123. Cohen AB, Neema M, Arora A, Dell’oglio E, Benedict RH, Tauhid S, et al. The relationships among MRI-defined spinal cord involvement, brain involvement, and disability in multiple sclerosis. J Neuroimaging (2012) 22(2):122–8. doi:10.1111/j.1552-6569.2011.00589.x
124. Furby J, Hayton T, Altmann D, Brenner R, Chataway J, Smith KJ, et al. A longitudinal study of MRI-detected atrophy in secondary progressive multiple sclerosis. J Neurol (2010) 257(9):1508–16. doi:10.1007/s00415-010-5563-y
125. Agosta F, Absinta M, Sormani MP, Ghezzi A, Bertolotto A, Montanari E, et al. In vivo assessment of cervical cord damage in MS patients: a longitudinal diffusion tensor MRI study. Brain (2007) 130(Pt 8):2211–9. doi:10.1093/brain/awm110
126. Filippi M, Agosta F. Imaging biomarkers in multiple sclerosis. J Magn Reson Imaging (2010) 31(4):770–88. doi:10.1002/jmri.22102
127. Filippi M, Agosta F. Magnetization transfer MRI in multiple sclerosis. J Neuroimaging (2007) 17(Suppl 1):22s–6s. doi:10.1111/j.1552-6569.2007.00129.x
128. Rovaris M, Agosta F, Pagani E, Filippi M. Diffusion tensor MR imaging. Neuroimaging Clin N Am (2009) 19(1):37–43. doi:10.1016/j.nic.2008.08.001
129. Bakshi R, Neema M, Healy BC, Liptak Z, Betensky RA, Buckle GJ, et al. Predicting clinical progression in multiple sclerosis with the Magnetic Resonance Disease Severity Scale. Arch Neurol (2008) 65(11):1449–53. doi:10.1001/archneur.65.11.1449
130. Bakshi R, Neema M, Tauhid S, Healy BC, Glanz BI, Kim G, et al. An expanded composite scale of MRI-defined disease severity in multiple sclerosis: MRDSS2. Neuroreport (2014) 25(14):1156–61. doi:10.1097/WNR.0000000000000244
131. Pardini M, Yaldizli O, Sethi V, Muhlert N, Liu Z, Samson RS, et al. Motor network efficiency and disability in multiple sclerosis. Neurology (2015) 85(13):1115–22. doi:10.1212/WNL.0000000000001970
132. Hasan KM, Walimuni IS, Abid H, Wolinsky JS, Narayana PA. Multi-modal quantitative MRI investigation of brain tissue neurodegeneration in multiple sclerosis. J Magn Reson Imaging (2012) 35(6):1300–11. doi:10.1002/jmri.23539
133. Branger P, Parienti JJ, Sormani MP, Defer G. The effect of disease-modifying drugs on brain atrophy in relapsing-remitting multiple sclerosis: a meta-analysis. PLoS One (2016) 11(3):e0149685. doi:10.1371/journal.pone.0149685
134. Sormani MP, Arnold DL, De Stefano N. Treatment effect on brain atrophy correlates with treatment effect on disability in multiple sclerosis. Ann Neurol (2014) 75(1):43–9. doi:10.1002/ana.24018
135. Meyer-Moock S, Feng YS, Maeurer M, Dippel FW, Kohlmann T. Systematic literature review and validity evaluation of the Expanded Disability Status Scale (EDSS) and the Multiple Sclerosis Functional Composite (MSFC) in patients with multiple sclerosis. BMC Neurol (2014) 14:58. doi:10.1186/1471-2377-14-58
Keywords: multiple sclerosis, disability, neurodegeneration, magnetic resonance imaging, atrophy, black holes
Citation: Rocca MA, Comi G and Filippi M (2017) The Role of T1-Weighted Derived Measures of Neurodegeneration for Assessing Disability Progression in Multiple Sclerosis. Front. Neurol. 8:433. doi: 10.3389/fneur.2017.00433
Received: 03 May 2017; Accepted: 08 August 2017;
Published: 04 September 2017
Edited by:
Achim Gass, Universitätsmedizin Mannheim (UMM), GermanyReviewed by:
Menno Michiel Schoonheim, VU University Medical Center, NetherlandsAlex Rovira, Hospital Universitari Vall d’Hebron, Spain
Copyright: © 2017 Rocca, Comi and Filippi. This is an open-access article distributed under the terms of the Creative Commons Attribution License (CC BY). The use, distribution or reproduction in other forums is permitted, provided the original author(s) or licensor are credited and that the original publication in this journal is cited, in accordance with accepted academic practice. No use, distribution or reproduction is permitted which does not comply with these terms.
*Correspondence: Maria A. Rocca, cm9jY2EubWFyYUBoc3IuaXQ=