 Marco Hermesdorf
 Benedikt Sundermann
 Rajesh Rawal1
 Udo Dannlowski
- 1Institute of Epidemiology and Social Medicine, University of Münster, Münster, Germany
- 2Department of Clinical Radiology, University Hospital Münster, Münster, Germany
- 3Department of Psychiatry, University of Münster, Münster, Germany
Objective: Previous studies on patients with restless legs syndrome (RLS) yielded inconclusive results in the magnetic resonance imaging (MRI)-based analyses of alterations of subcortical structures in the brain. The aim of this study was to compare volumes as well as shapes of subcortical structures and the hippocampus between RLS cases and controls. Additionally, the associations between the genetic risks for RLS and subcortical volumes were investigated.
Methods: We compared volumetric as well as shape differences assessed by 3 T MRI in the caudate nucleus, hippocampus, globus pallidus, putamen, and thalamus in 39 RLS cases versus 117 controls, nested within a population-based sample. In a subsample, we explored associations between known genetic risk markers for RLS and the volumes of the subcortical structures and the hippocampus.
Results: No significant differences between RLS cases and controls in subcortical and hippocampal shapes and volumes were observed. Furthermore, the genetic risk for RLS was unrelated to any alterations of subcortical and hippocampal gray matter volume.
Interpretation: We conclude that neither RLS nor the genetic risk for the disease give rise to changes in hippocampal and subcortical shapes and gray matter volumes.
Introduction
Restless legs syndrome (RLS) is a sensorimotor disorder affecting 2.5–10% of the general population (1). RLS is characterized by unpleasant sensations in the legs or other extremities combined with an urge to move in order to reduce the discomforting sensations. These symptoms typically worsen during periods of rest, thus having a negative impact on sleep and quality of life (2, 3). Genetic factors play an important role in RLS as it has been revealed that several single nucleotide polymorphisms (SNPs) contribute to the development of the disease (4, 5). Furthermore, RLS is believed to be a result of iron insufficiency in the brain, presumably caused by improper iron transportation across the blood–brain barrier leading to dysregulated dopaminergic neurotransmission (6).
Due to the specific role of subcortical structures in dopaminergic neurotransmission (7) and their role in iron deposition and motor function (8), these structures are of particular interest in the search for neurobiological correlates of RLS. Previous studies employing magnetic resonance imaging (MRI) of the brain provided conflicting results regarding volumetric changes of subcortical gray matter in RLS cases. In particular, a reduction in gray matter volume has been observed in the left hippocampus (9), while others found a significant increase in left hippocampal gray matter associated with RLS (10). Increased gray matter volume in the pulvinar nuclei located inside the thalamus has also been reported (11). In contrast, several studies found no significant associations between RLS and alterations of subcortical gray matter volume (12–15). Most of these studies applied voxel-based morphometry for the detection of local changes in gray matter volume across the brain (9–14). However, specific methods have been developed to detect localized shape differences in subcortical regions and the hippocampus, considering the specific signal characteristics of these brain structures (16). Only a single study investigated such localized shape differences of the thalamus, but did not detect significant shape differences in patients with RLS versus controls (15). Localized shape differences in subcortical regions other than the thalamus have not been investigated in patients with RLS.
The present study aimed to contrast potential differences in localized shape and overall volume of several subcortical gray matter structures (caudate nucleus, globus pallidus, putamen, and thalamus) as well as the hippocampus between RLS cases and controls, all participants in the BiDirect Study. Additionally, we investigated associations between known genetic risks for RLS and potential alterations of subcortical gray matter volume, since MRI-detectable changes in these subcortical structures might be a mediator in the pathway between genotype and RLS.
Materials and Methods
Participants
The ongoing BiDirect study is conducted to investigate associations between subclinical arteriosclerosis and depression. For this purpose, the BiDirect study integrates two patient cohorts, one including patients with depression, the other patients with cardiovascular disease, and one general population cohort into one project. Details on methods and design of the BiDirect Study are provided elsewhere (17, 18). Participants in the general population cohort were randomly sampled from the population register of the city of Münster, resulting in 911 individuals included in this cohort. All participants had to be in the age range from 35 to 65 years at recruitment. Informed consent was signed by all study participants in the BiDirect project, which was approved by the ethics committee of the University of Münster and the Westphalian Chamber of Physicians. Within the general population cohort, we performed a nested case-control analysis. Participants from the two patient cohorts of the BiDirect Study were thus not considered in the present analysis. Participants who did not undergo T1-weighted MRI were excluded and RLS-status was assessed in face-to-face interviews by a set of questions that were based on the criteria established by the International RLS Study Group (19). This question set has previously been validated against a standardized neurological examination and both were in good agreement (20). In addition, a physician diagnosis of RLS in the past was assessed. Study participants who positively answered questions on all minimum criteria or reported a physician diagnosis of RLS were classified as RLS cases. In total, 11 participants had a prior physician-based diagnosis of RLS and 28 participants were screened positive by the question set. Participants without a physician diagnosis of RLS and a negative screening were classified as controls. Controls with a previously diagnosed kidney disease and/or diabetes were excluded from the analysis. Based on the group of RLS cases, controls were frequency-matched one to three by the variables age and sex. This resulted in 39 RLS cases and 117 controls for the nested case-control analysis as depicted in Figure 1. Furthermore, we conducted a sensitivity power analysis using G*Power (21), revealing that we can detect substantial effects (f = 0.29) with a power of 95% in the shape analysis.
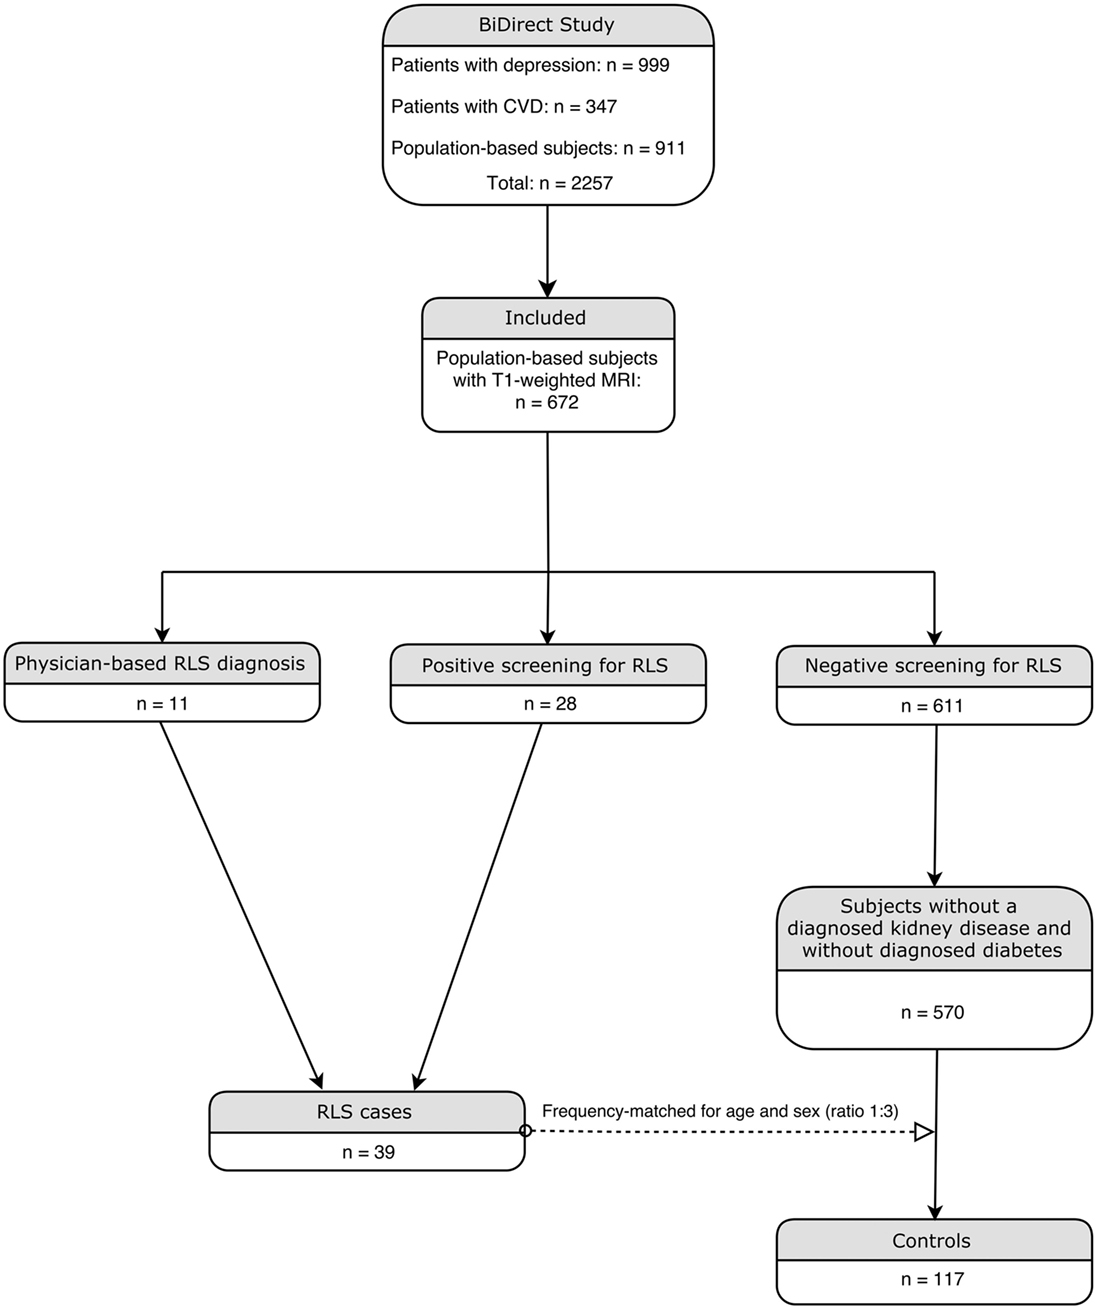
Figure 1. Flowchart illustrating the inclusion procedure.
Image Acquisition
Magnetic resonance imaging of the brain was performed in all BiDirect participants without contraindications. Structural 3D T1-weighted turbo field echo imaging was performed on a 3 T scanner (Intera, Philips, Best, Netherlands) to obtain 160 sagittal slices with a thickness of 2 mm (reconstructed to 1 mm), resulting in a voxel-size of 1 × 1 × 1 mm (TR = 7.26 ms, TE = 3.56 ms, 9° flip angle, matrix dimension 256 × 256, FOV = 256 × 256 mm).
Image Preprocessing
Magnetic resonance imaging data were preprocessed using FSL (22) version 5.06. Images were linearly registered to the MNI152 template using FLIRT (23). If necessary, images were cropped or bias-field corrected with fsl_anat1 to ensure optimal registration. The inverse transformation matrix was then applied to the predefined subcortical shape models provided by FSL. With these predefined shape models in native space, subcortical structures of interest (caudate nucleus, hippocampus, globus pallidus, putamen, and thalamus) were segmented from the participants’ native space images using a Bayesian appearance model in FIRST (16) and modeled as surface meshes. In a last step, the subcortical surfaces were aligned to a sample-specific mean shape of the respective surface structures applying a 6 degree of freedom transformation whereby differences in rotation and translation were removed.
For the purpose of a volume-based analysis, subcortical structures were boundary corrected and the respective volumes of interest were extracted. In order to adjust for the overall brain volume in the course of analyses, brain volume (i.e., gray and white matter) was estimated by partial volume estimation in FAST (24).
Genotyping
Genotyping was conducted using the Illumina PsychChip array (Illumina, San Diego, CA, USA). Several SNPs in MEIS1, BTBD9, MAP2K5, PTPRD, and TOX3/BC034767 (4, 25–27) have previously been associated with RLS and were selected for the study at hand. Imputation was performed using IMPUTE version 2.3.2 (28). SNPs being in linkage disequilibrium (R2 ≥ 0.8) or with a minor allele frequency below 5% were excluded from the analysis. Statistics regarding linkage disequilibrium were derived from the database of the Broad Institute.2
Comorbidities
We assessed comorbidities using data from face-to-face interviews as well as laboratory data. Previous physician-based diagnoses of stroke, myocardial infarction, and cancer were collected by self-report. Participants were classified as hypertensive if the mean of the second and third blood pressure readings for systolic blood pressure was ≥140 mm Hg or the diastolic blood pressure exceeded 89 mm Hg. Furthermore, participants with a self-reported physician-based diagnosis of hypertension in combination with use of antihypertensive medication according to the Anatomical Therapeutic Chemical (ATC) Classification System (ATC C02A, C02D, C02L, C03, C07, C08, C09) were also defined as having hypertension. Depression was assessed as a previous physician-based diagnosis via self-report or if participants scored ≥16 points on the Center for Epidemiologic Studies Depression Scale (29). Body size and weight were assessed and participants with a body mass index larger than 30 were classified as obese. The presence of thyroid disease was assessed by self-report of a physician-based diagnosis or intake of relevant medication (ATC H03). Thyroid-stimulating hormone (TSH) and free thyroxine (fT4) levels were used to estimate hypothyroidism (TSH > 4.8 and fT4 < 13 ) as well as hyperthyroidism (TSH < 0.3 and fT4 > 23 ) and participants in either category were also defined as having thyroid disease. Migraine was assessed as physician-based diagnosis via self-report or current use of relevant medication (ATC N02CA, N02CC). A comorbidity index was calculated by summing up the presence of the previously described conditions (stroke, myocardial infarction, cancer, hypertension, depression, obesity, thyroid disease, and migraine). A similar index of cumulative disease burden has been used previously in the context of RLS (30).
Statistical Analysis
Participants with RLS and controls were compared on orthogonal displacements at each vertex regarding the sample-specific mean surfaces of the subcortical structures of interest. These analyses were conducted with a cluster-based F-test implemented in FSL randomize (31) with 5,000 permutations. Statistical threshold for significance was set to p < 0.05. Extracted volumes of the subcortical structures were compared across groups by several analyses of covariance (ANCOVAs) while adjusting for overall brain volume. The obtained p-values were corrected for false discovery rate (FDR) following the Benjamini–Hochberg procedure (32).
Genotyping data were available for 137 participants. For each participant, the number of risk alleles per SNP was noted. For each respective SNP, a logistic regression was conducted with RLS as dependent variable and risk allele frequency as predictor along with age and sex as covariates of no interest. A weighted genetic risk score (GRS) was calculated for each SNP by multiplying the risk allele frequency of the respective SNP with the odds ratio obtained by the logistic regression. Each respective GRS was used as a predictor in multiple regression analyses with the subcortical brain volumes as dependent variables while adjusting for age, sex, and overall brain volume. The analyses of extracted subcortical volumes and genotyping data were conducted in SPSS version 22 (IBM, Armonk, NY, USA).
Results
Subject Demographics
A comparison of group characteristics is summarized in Table 1. Participants with RLS and controls did not differ in terms of age and sex. Distributions of comorbidity load were significantly different across groups and the median comorbidity load was higher in RLS cases. Genotyping data were available for 137 (87.8%) participants. The remaining 19 participants were thus not considered for the analyses of genotyping data.
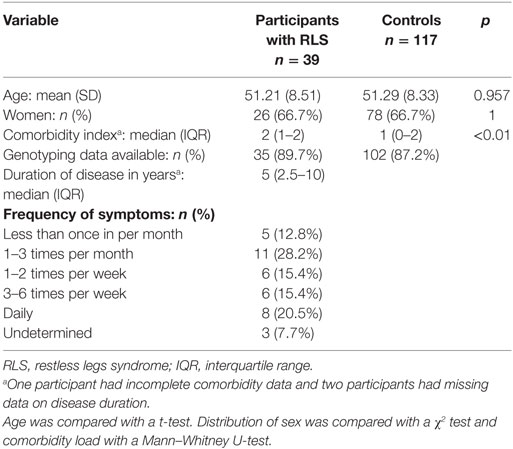
Table 1. Comparison of demographic characteristics across groups.
Shape Analyses
The comparisons of the shapes in the caudate nucleus, hippocampus, globus pallidus, putamen, and thalamus across groups did not yield significant differences in either hemisphere. The subcortical and hippocampal shapes of the sample are shown in Figure 2. The analyses of extracted volumetric data did not reveal significant group differences after FDR correction (Table 2).
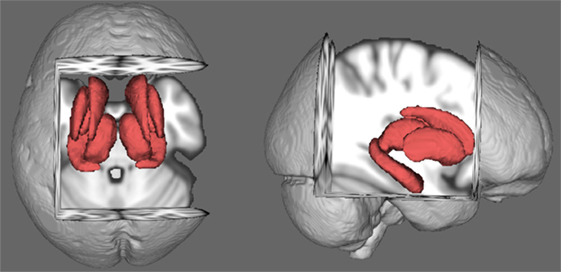
Figure 2. Average shapes of the rigidly aligned subcortical structures in the sample.
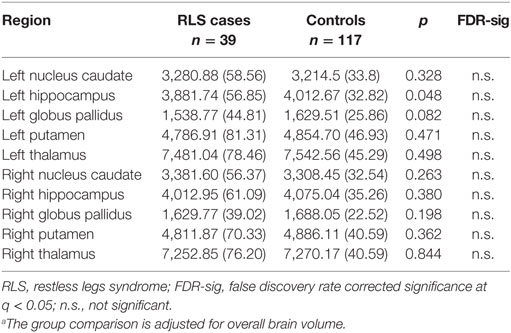
Table 2. Comparison of subcortical volumes (mm3 and SE) across groups.a
Associations Between Risk allele Frequency and RLS
The logistic regressions yielded significant associations between RLS and the risk allele (G) frequency in rs11635424, located in MAP2K5. Due to the small sample size, no significant associations were found for the remaining eight SNPs. However, the magnitude of the odds ratios indicated a higher risk for RLS concerning the majority of the SNPs (Table 3), in line with prior reports (4, 25, 27, 33).

Table 3. Associations between allele frequency and RLS.a
Genetic Risk for RLS and Subcortical Volumes
No significant associations between the odds ratio weighted GRS derived from the respective SNPs and subcortical as well as hippocampal volumes were found. The regression coefficients are presented in Table 4.
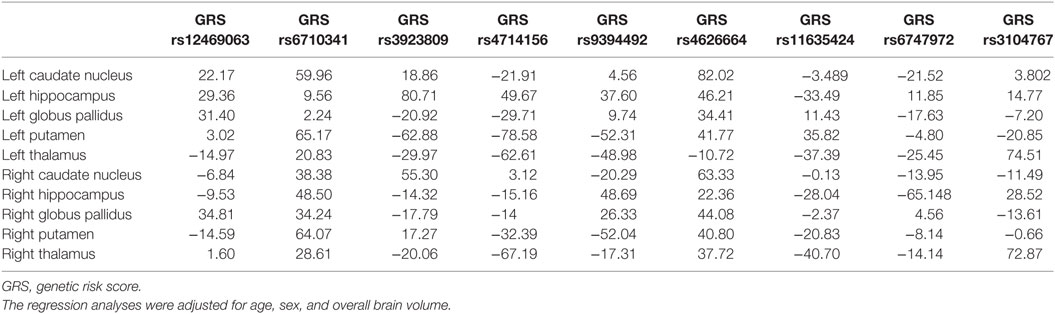
Table 4. Regression coefficients for the GRS per subcortical region.
Discussion
In this nested case-control study, we examined potential alterations in shape and volume of subcortical structures and the hippocampus in cases with RLS versus controls. While potential volumetric alterations of subcortical structures and the hippocampus have been investigated previously using VBM (9–15), shape differences in the caudate nucleus, hippocampus, globus pallidus, and putamen have not been compared before between cases with RLS and controls. Analyzing shape differences, however, is important in order to determine the exact locations where potential anatomical changes in subcortical structures occur. Knowledge of localized shape differences may also aid the interpretation of the relationship with other anatomical findings, e.g., when localized changes in thalamic shape are associated with adjacent reductions of white matter volume (34). Our analyses revealed no group differences in either shape or volume of the caudate nucleus, hippocampus, globus pallidus, putamen, and thalamus. The lack of volume differences supports previous findings (12–15), suggesting that RLS is not accompanied by any changes of subcortical gray matter. Instead, it seems more likely that alterations of the dopaminergic system (6), possibly induced by genes involved in neurodevelopment [MEIS1 (35, 36) and TOX3 (37)], protection of dopaminergic neurons [MAP2K5 (38)], sleep disturbances [BTBD9 (39)], modulation of dopaminergic neurotransmission [PTPRD (40)], and iron regulation within the brain [BTBD9 (41)], may lead to changes in functional brain networks. In particular, increased functional connectivity has been reported in sensory-thalamic, basal ganglia-thalamic, and other cortical and subcortical networks in patients with RLS, whereas symptom severity correlated with increased network connectivity (42). Hence, in the absence of gray matter alterations, RLS is more likely to be characterized by inefficient network performance.
Although RLS has previously been associated with several SNPs within regions of the above-mentioned genes (4), the exact mechanisms how these SNPs contribute to the development of RLS are still unknown. Hence, we also explored potential associations between known genetic risk markers for RLS and alterations of subcortical volumes to evaluate if these are a potential mediator of the genotype-disease association. Only SNP rs11635424 was significantly associated with RLS. While most of the remaining RLS-related SNPs indicated risks, i.e., odds ratios larger than 1 for the risk alleles, these associations did not reach statistical significance given the small sample size in our study. The magnitude of effect sizes is largely in line with previous studies (4, 25, 27, 33), suggesting that larger samples are advantageous to detect effects of allele frequency in the context of RLS. With regards to the volume of the subcortical structures and the hippocampus, we did not find a significant association with SNP rs11635424 or any of the other eight SNPs, suggesting that RLS-related variations in the genome do not play an important part in the volumetric appearance of subcortical structures and the hippocampus.
The present study is limited by its sample size which is rather small regarding the search for genetic factors contributing to the development of RLS. However, the primary aim was to compare subcortical as well as hippocampal shapes and volumes between RLS cases and controls and to analyze the influence of the odds ratio weighted genetic risk for RLS on subcortical and hippocampal volumes. Within the field of 3 T MRI-literature, the present study is the largest investigating potential volumetric alterations in RLS cases versus controls.
We conclude that RLS is unrelated to changes in shape and volume of the caudate nucleus, hippocampus, globus pallidus, putamen, and thalamus. The SNP rs11635424 was significantly associated with RLS in our sample. The odds ratio weighted GRS from each of the nine SNPs as well as a summed GRS do not account for any volume alterations of subcortical gray matter.
Ethics Statement
This study was carried out in accordance with the recommendations of the ethics committee of the University of Münster and the Westphalian Chamber of Physicians with written informed consent from all subjects. All subjects gave written informed consent in accordance with the Declaration of Helsinki. The protocol was approved by the University of Münster and the Westphalian Chamber of Physicians.
Author Contributions
Design and concept of the BiDirect Study: KB. Preprocessing and data analyses: MH, RR, and AS. Drafting the manuscript and figures: MH. Technical assistance and commenting on the preprocessing of imaging data: BS and UD.
Conflict of Interest Statement
MH, BS, RR, AS, and UD have no conflicts of interest to disclose. For the conduction (2007–2014) of a study on the course of restless legs syndrome, KB has received unrestricted grants to the University of Münster from the German Restless Legs Society and Boehringer Ingelheim Pharma, Mundipharma Research, Neurobiotec, Roche Pharma, UCB Germany, UCB Switzerland, and Vifor Pharma.
Acknowledgments
The present work was supported by a grant to KB from the German Federal Ministry of Education and Research (BMBF; grant FKZ-01ER0816 and FKZ-01ER1506). UD was funded by the German Research Foundation (DFG, grant FOR2107 DA1151/5-1; SFB-TRR58, Project C09) and the Interdisciplinary Center for Clinical Research (IZKF) of the medical faculty of Münster (grant Dan3/012/17).
Footnotes
- ^http://fsl.fmrib.ox.ac.uk/fsl/fslwiki/fsl_anat (Accessed: 2017).
- ^https://archive.broadinstitute.org/mpg/snap (Accessed: 2017).
References
1. Garcia-Borreguero D, Egatz R, Winkelmann J, Berger K. Epidemiology of restless legs syndrome: the current status. Sleep Med Rev (2006) 10:153–67. doi:10.1016/j.smrv.2006.01.001
2. Cuellar NG, Strumpf NE, Ratcliffe SJ. Symptoms of restless legs syndrome in older adults: outcomes on sleep quality, sleepiness, fatigue, depression, and quality of life. J Am Geriatr Soc (2007) 55:1387–92. doi:10.1111/j.1532-5415.2007.01294.x
3. Phillips B, Hening W, Britz P, Mannino D. Prevalence and correlates of restless legs syndrome. Chest (2006) 129:76–80. doi:10.1378/chest.129.1.76
4. Winkelmann J, Schormair B, Lichtner P, Ripke S, Xiong L, Jalilzadeh S, et al. Genome-wide association study of restless legs syndrome identifies common variants in three genomic regions. Nat Genet (2007) 39:1000–6. doi:10.1038/ng2099
5. Stefansson H, Rye DB, Hicks A, Petursson H, Ingason A, Thorgeirsson TE, et al. A genetic risk factor for periodic limb movements in sleep. N Engl J Med (2007) 357:639–47. doi:10.1056/NEJMoa072743
6. Earley CJ, Connor J, Garcia-Borreguero D, Jenner P, Winkelman J, Zee PC, et al. Altered brain iron homeostasis and dopaminergic function in restless legs syndrome (Willis-Ekbom disease). Sleep Med (2014) 15:1288–301. doi:10.1016/j.sleep.2014.05.009
7. Haber SN. The place of dopamine in the cortico-basal ganglia circuit. Neuroscience (2014) 282:248–57. doi:10.1016/j.neuroscience.2014.10.008
8. Sullivan EV, Adalsteinsson E, Rohlfing T, Pfefferbaum A. Relevance of iron deposition in deep gray matter brain structures to cognitive and motor performance in healthy elderly men and women: exploratory findings. Brain Imaging Behav (2009) 3:167–75. doi:10.1007/s11682-008-9059-7
9. Chang Y, Chang HW, Song H, Ku J, Earley CJ, Allen RP, et al. Gray matter alteration in patients with restless legs syndrome: a voxel-based morphometry study. Clin Imaging (2015) 39:20–5. doi:10.1016/j.clinimag.2014.07.010
10. Hornyak M, Ahrendts JC, Spiegelhalder K, Riemann D, Voderholzer U, Feige B, et al. Voxel-based morphometry in unmedicated patients with restless legs syndrome. Sleep Med (2007) 9:22–6. doi:10.1016/j.sleep.2006.09.010
11. Etgen T, Draganski B, Ilg C, Schröder M, Geisler P, Hajak G, et al. Bilateral thalamic gray matter changes in patients with restless legs syndrome. Neuroimage (2005) 24:1242–7. doi:10.1016/j.neuroimage.2004.10.021
12. Margariti PN, Astrakas LG, Tsouli SG, Hadjigeorgiou GM, Konitsiotis S, Argyropoulou MI. Investigation of unmedicated early onset restless legs syndrome by voxel-based morphometry, T2 relaxometry, and functional MR imaging during the night-time hours. Am J Neuroradiol (2012) 33:667–72. doi:10.3174/ajnr.A2829
13. Celle S, Roche F, Peyron R, Faillenot I, Laurent B, Pichot V, et al. Lack of specific gray matter alterations in restless legs syndrome in elderly subjects. J Neurol (2010) 257:344–8. doi:10.1007/s00415-009-5320-2
14. Belke M, Heverhagen JT, Keil B, Rosenow F, Oertel WH, Stiasny-Kolster K, et al. DTI and VBM reveal white matter changes without associated gray matter changes in patients with idiopathic restless legs syndrome. Brain Behav (2015) 5(9):e00327. doi:10.1002/brb3.327
15. Rizzo G, Tonon C, Testa C, Manners D, Vetrugno R, Pizza F, et al. Abnormal medial thalamic metabolism in patients with idiopathic restless legs syndrome. Brain (2012) 135:3712–20. doi:10.1093/brain/aws266
16. Patenaude B, Smith SM, Kennedy DN, Jenkinson MA. Bayesian model of shape and appearance for subcortical brain segmentation. Neuroimage (2011) 56:907–22. doi:10.1016/j.neuroimage.2011.02.046
17. Teismann H, Wersching H, Nagel M, Arolt V, Heindel W, Baune BT, et al. Establishing the bidirectional relationship between depression and subclinical arteriosclerosis – rationale, design, and characteristics of the BiDirect Study. BMC Psychiatry (2014) 14:174. doi:10.1186/1471-244X-14-174
18. Teuber A, Sundermann B, Kugel H, Schwindt W, Heindel W, Minnerup J, et al. MR imaging of the brain in large cohort studies: feasibility report of the population- and patient-based BiDirect study. Eur Radiol (2016) 27(1):231–8. doi:10.1007/s00330-016-4303-9
19. Allen RP, Picchietti D, Hening WA, Trenkwalder C, Walters AS, Montplaisi J, et al. Restless legs syndrome: diagnostic criteria, special considerations, and epidemiology. A report from the restless legs syndrome diagnosis and epidemiology workshop at the National Institutes of Health. Sleep Med (2003) 4:101–19. doi:10.1016/S1389-9457(03)00010-8
20. Berger K, Von Eckardstein A, Trenkwalder C, Rothdach A, Junker R, Weiland SK. Iron metabolism and the risk of restless legs syndrome in an elderly general population – the MEMO-study. J Neurol (2002) 249:1195–9. doi:10.1007/s00415-002-0805-2
21. Faul F, Erdfelder E, Lang A-G, Buchner A. G*Power 3: a flexible statistical power analysis program for the social, behavioral, and biomedical sciences. Behav Res Methods (2007) 39:175–91. doi:10.3758/BF03193146
22. Jenkinson M, Beckmann CF, Behrens TEJ, Woolrich MW, Smith SM. FSL. Neuroimage (2012) 62:782–90. doi:10.1016/j.neuroimage.2011.09.015
23. Jenkinson M, Bannister P, Brady M, Smith S. Improved optimization for the robust and accurate linear registration and motion correction of brain images. Neuroimage (2002) 17:825–41. doi:10.1006/nimg.2002.1132
24. Zhang Y, Brady M, Smith S. Segmentation of brain MR images through a hidden Markov random field model and the expectation-maximization algorithm. IEEE Trans Med Imaging (2001) 20:45–57. doi:10.1109/42.906424
25. Schormair B, Kemlink D, Roeske D, Eckstein G, Xiong L, Lichtner P, et al. PTPRD (protein tyrosine phosphatase receptor type delta) is associated with restless legs syndrome. Nat Genet (2008) 40:946–8. doi:10.1038/ng.190
26. Spieler D, Kaffe M, Knauf F, Bessa J, Tena JJ, Giesert F, et al. Restless legs syndrome-associated intronic common variant in Meis1 alters enhancer function in the developing telencephalon. Genome Res (2014) 24:592–603. doi:10.1101/gr.166751.113
27. Winkelmann J, Czamara D, Schormair B, Knauf F, Schulte EC, Trenkwalder C, et al. Genome-wide association study identifies novel restless legs syndrome susceptibility Loci on 2p14 and 16q12.1. PLoS Genet (2011) 7:e1002171. doi:10.1371/journal.pgen.1002171
28. Howie B, Fuchsberger C, Stephens M, Marchini J, Abecasis GR. Fast and accurate genotype imputation in genome-wide association studies through pre-phasing. Nat Genet (2012) 44:955–9. doi:10.1038/ng.2354
29. Radloff LS. The CES-D scale: a self-report depression scale for research in the general population. Appl Psychol Meas (1977) 1:385–401. doi:10.1177/014662167700100306
30. Szentkiralyi A, Volzke H, Hoffmann W, Trenkwalder C, Berger K. Multimorbidity and the risk of restless legs syndrome in 2 prospective cohort studies. Neurology (2014) 82:2026–33. doi:10.1212/WNL.0000000000000470
31. Winkler AM, Ridgway GR, Webster MA, Smith SM, Nichols TE. Permutation inference for the general linear model. Neuroimage (2014) 92:381–97. doi:10.1016/j.neuroimage.2014.01.060
32. Benjamini Y, Hochberg Y. Controlling the false discovery rate: a practical and powerful approach to multiple testing. J R Stat Soc Ser B (1995) 57:289–300.
33. Schormair B, Plag J, Kaffe M, Gross N, Czamara D, Samtleben W, et al. MEIS1 and BTBD9: genetic association with restless leg syndrome in end stage renal disease. J Med Genet (2011) 48:462–6. doi:10.1136/jmg.2010.087858
34. Xia S, Li X, Kimball AE, Kelly MS, Lesser I, Branch C. Thalamic shape and connectivity abnormalities in children with attention-deficit/hyperactivity disorder. Psychiatry Res (2012) 204:161–7. doi:10.1016/j.pscychresns.2012.04.011
35. Waskiewicz AJ, Rikhof HA, Hernandez RE, Moens CB. Zebrafish Meis functions to stabilize Pbx proteins and regulate hindbrain patterning. Development (2001) 128:4139–51.
36. Erickson T, French CR, Waskiewicz AJ. Meis1 specifies positional information in the retina and tectum to organize the zebrafish visual system. Neural Dev (2010) 5:22. doi:10.1186/1749-8104-5-22
37. Sahu SK, Fritz A, Tiwari N, Kovacs Z, Pouya A, Wüllner V, et al. TOX3 regulates neural progenitor identity. Biochim Biophys Acta (2016) 1859:833–40. doi:10.1016/j.bbagrm.2016.04.005
38. Cavanaugh JE, Jaumotte JD, Lakoski JM, Zigmond MJ. Neuroprotective role of ERK1/2 and ERK5 in a dopaminergic cell line under basal conditions and in response to oxidative stress. J Neurosci Res (2006) 84:1367–75. doi:10.1002/jnr.21024
39. DeAndrade MP, Johnson RL, Unger EL, Zhang L, van Groen T, Gamble KL, et al. Motor restlessness, sleep disturbances, thermal sensory alterations and elevated serum iron levels in Btbd9 mutant mice. Hum Mol Genet (2012) 21:3984–92. doi:10.1093/hmg/dds221
40. Earley CJ, Uhl GR, Clemens S, Ferré S. Connectome and molecular pharmacological differences in the dopaminergic system in restless legs syndrome (RLS): plastic changes and neuroadaptations that may contribute to augmentation. Sleep Med (2017) 31:71–7. doi:10.1016/j.sleep.2016.06.003
41. Jellen LC, Beard JL, Jones BC. Systems genetics analysis of iron regulation in the brain. Biochimie (2009) 91:1255–9. doi:10.1016/j.biochi.2009.04.009
Keywords: restless legs syndrome, gray matter volume, subcortical brain structures, genetic risk, risk alleles
Citation: Hermesdorf M, Sundermann B, Rawal R, Szentkirályi A, Dannlowski U and Berger K (2018) Lack of Association Between Shape and Volume of Subcortical Brain Structures and Restless Legs Syndrome. Front. Neurol. 9:355. doi: 10.3389/fneur.2018.00355
Received: 22 December 2017; Accepted: 01 May 2018;
Published: 18 May 2018
Edited by:
Kai Spiegelhalder, Universitätsklinikum Freiburg, GermanyReviewed by:
Martin Gorges, Universität Ulm, GermanyKatja Menzler, Philipps-Universität Marburg, Germany
Copyright: © 2018 Hermesdorf, Sundermann, Rawal, Szentkirályi, Dannlowski and Berger. This is an open-access article distributed under the terms of the Creative Commons Attribution License (CC BY). The use, distribution or reproduction in other forums is permitted, provided the original author(s) and the copyright owner are credited and that the original publication in this journal is cited, in accordance with accepted academic practice. No use, distribution or reproduction is permitted which does not comply with these terms.
*Correspondence: Marco Hermesdorf, aGVybWVzZG9yZkB1bmktbXVlbnN0ZXIuZGU=