 Tanja Schneider1,2*
 André Kemmling3
 Julian Schroeder4Klaus Pantel5
 Markus Glatzel6Gerhard Schoen7Malte Mohme8
 Jens Fiehler1Susanne Gellißen1
- 1Department of Diagnostic and Interventional Neuroradiology, University Medical Center Hamburg-Eppendorf, Hamburg, Germany
- 2Department of Radiology, Schoen Klinik Hamburg Eilbek, Hamburg, Germany
- 3Department of Neuroradiology, University Medical Center Schleswig-Holstein, Luebeck, Germany
- 4Department of Neurology, University Medical Center Hamburg-Eppendorf, Hamburg, Germany
- 5Center for Experimental Medicine, Institute of Tumor Biology, University Medical Center Hamburg-Eppendorf, Hamburg, Germany
- 6Center for Diagnostics, Institute of Neuropathology, University Medical Center Hamburg-Eppendorf, Hamburg, Germany
- 7Department of Medical Biometry and Epidemiology, University Medical Center Hamburg-Eppendorf, Hamburg, Germany
- 8Department of Neurosurgery, University Medical Center Hamburg-Eppendorf, Hamburg, Germany
Background and Aims: Vascular border zones and the gray-white matter junction are preferred sites for the development of brain metastases (BM), whereas microvascular lesions are known to be a protective factor. In this proof of concept study, we aim to study the relationship of blood perfusion and the spatial distribution of BM.
Materials and Methods: An average CT perfusion atlas of 107 healthy patients was created. Voxel-wise reference perfusion values were extracted from BM-negative and BM-positive regions in a second cohort of 100 untreated patients harboring 809 BM confirmed by MRI. A comparison of regional perfusion values was performed using the independent t-test.
Results: In contrast to supratentorial BM that develop preferably in areas with lower CBV/CBF and longer MTT/TTP compared to the average regional perfusion (p < 0.001), infratentorial BM showed a higher CBV/CBF and shorter MTT/TTP (p < 0.001).
Conclusion: Our results imply differing pathophysiological mechanisms underlying supra- and infratentorial BM spreading. The inverse perfusion patterns may result from differences in vascular supply, hemodynamic requirements, and/or production of pro-angiogenic factors.
Introduction
In principal, there are two main hypotheses on the development of brain metastases (BM). The “seed and soil” hypothesis states that metastatic cells favor a particular biochemical environment or tend to colonize selectively in suitable tissues (soils) due to cell surface and endothelium properties (1, 2). Furthermore, the “anatomical-mechanical” theory proposes that dissemination of metastases follows arterial vessel caliber and local blood flow (3).
Prior studies already demonstrated that the presence and the amount of small vessel ischemic disease are protective factors against the development of BM (4–7). Hwang et al. found a higher propensity of BM in vascular border zones and the gray-white matter junction (8). These findings suggest a relevant impact of brain perfusion on BM formation.
Here, we aim to study the relationship of the spatial distribution of the BM of 100 untreated patients and the underlying blood perfusion pattern. We hypothesize that all BM would preferably develop in areas where physiological perfusion is rather high compared to areas without any BM. We further hypothesize that central necrotic BM tend to colonize in areas with less perfusion.
Materials and Methods
This single center, retrospective study was conducted in compliance with the local ethics committee (Ethik-Kommission der Aerztekammer Hamburg, WF-018/15) with a waiver of informed consent.
CT Perfusion Atlas
Cerebral blood flow in cancer patients has been shown to be altered due to paraneoplastic changes, chemotherapy administration, neoangiogenesis, and/or disruption of the blood-brain barrier (9, 10). Therefore, we used pooled whole-brain CT perfusion datasets of a reference population. The perfusion atlas was generated from 107 patients who were triaged by CT perfusion for symptoms of transient ischemic attack but without evidence of infarction or any perfusion abnormality, symptoms on follow up, or vascular abnormality that was verified by MRI 24 h later (11). Quantitative perfusion maps were obtained for cerebral blood volume (CBV in ml/100 g brain tissue), cerebral blood flow (CBF in ml/100 g brain tissue/min), mean transit time (MTT in s), and time to peak (TTP in s). CT perfusion was performed on a Somatom Flash scanner (Siemens Healthcare, Erlangen, Germany) by applying the following scan parameters: 80 kV, 200 mAs, collimation 2 × 64 × 0.6 mm, 5 mm slice reconstruction, 1.5 s sampling rate for 45 s, biphasic i.v. injection with 30 ml of 400 mM/ml iodinated contrast medium followed by 30 ml NaCl chaser bolus with a flow rate of 4 ml/s.
All perfusion raw data were processed in a central core-lab on a workstation dedicated for perfusion analysis with motion correction and low band temporal noise removal (Syngo mmwp VE52A with VPCT-Neuro; Siemens Healthcare, Erlangen, Germany). Non-parenchymal voxels corresponding to bone, vasculature, calcification, and cerebrospinal fluid were automatically excluded by adaptive intensity thresholding. Perfusion parameter maps were calculated based on a deconvolution model by least mean squares fitting (12). Perfusion data sets with erratic or incomplete arterial and venous attenuation time curves were excluded (n = 5). All calculated perfusion maps were reformatted to 1 mm Montréal Neurological Institute (MNI) standard space using the Oxford Centre for Functional Magnetic Resonance Imaging of the Brain (FMRIB) Software Library 5.0 (Analysis Group, Oxford, UK) with nearest neighbor interpolation so that quantitative image gray values remained unchanged (13). Mean voxel-wise perfusion parameter maps normalized to the MNI space were then used in our study cohort to obtain normal perfusion values for each voxel of the perfusion map and each voxel with a BM (Figures 1A–D).
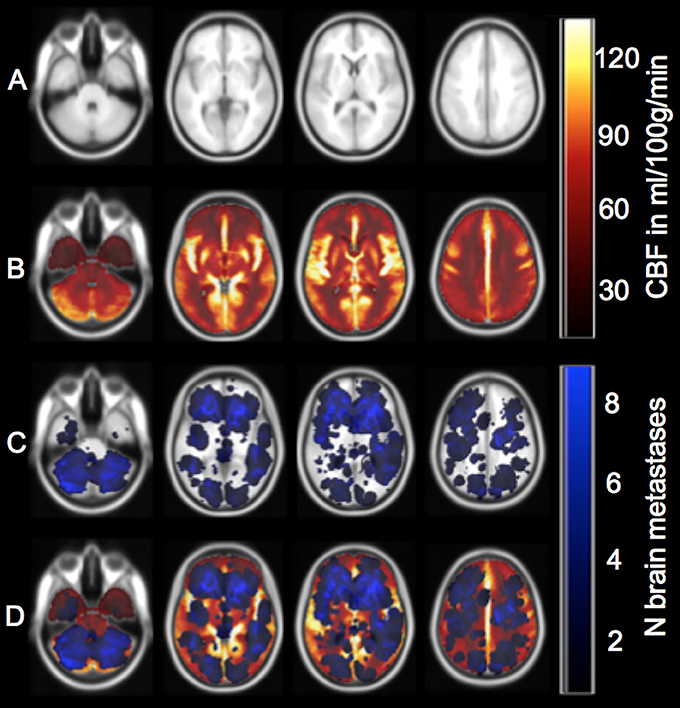
Figure 1. Overview of perfusion calculation from caudal to cranial (1–4). (A) Example of the 1 mm MNI brain that served as a template for co-registration of the patient's contrast-enhanced T1-weighted images and the CT perfusion map. (B) Display of the cerebral blood flow (CBF) map (see color scale on the upper right; light yellow also corresponds to CBF values ≥120 ml/100 g/min due to better visualization). Cerebral blood volume (CBV), mean transit time (MTT), and time to peak (TTP) maps are not depicted. (C) Cumulative brain metastases frequency map (see color scale on the lower right; light blue also corresponds to ≥8 brain metastases due to better visualization). (D) Overlay of the metastases sum map, the perfusion map, and the MNI brain. CBF, CBV, MTT, and TTP values were extracted for each voxel-group with and without a BM.
BM Atlas
Since CT does not offer sufficient tissue contrast for reliable detection of BM we decided to delineate and define BM location by contrast-enhanced MRI due to its superior resolution (14). One hundred consecutive patients with different tumor entities screened between 01/2014 and 03/2015 in our university hospital fulfilled the inclusion and exclusion criteria given in Figure 2. In particular, all patients included were not known to have BM prior to MRI and were therefore untreated for BM.
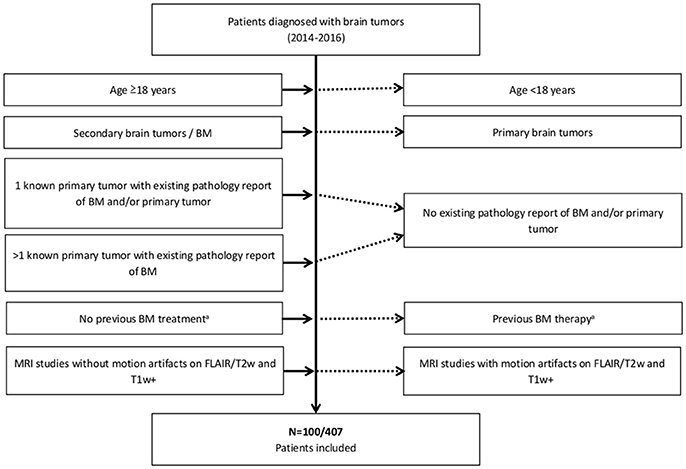
Figure 2. Summary of the inclusion (Left) and exclusion criteria (Right). aNo surgery, radiotherapy, or chemotherapy (e.g., bevacizumab) for treatment of BM previous to MRI.
MRI Protocol
The study was conducted using 1.5 Tesla MRI systems in 94 patients (Magnetom® Sonata, Siemens Healthcare, Erlangen, Germany; Magnetom® Symphony, Siemens Healthcare, Erlangen, Germany, or Magnetom® Avanto, Siemens Healthcare, Erlangen, Germany) and 3 Tesla MRI scanners in 6 patients (Magnetom+ Skyra, Siemens Healthcare, Erlangen, Germany or Ingenia, Philips Medical Systems, Best, The Netherlands).
The standard imaging protocol always included axial T1w spin echo (2D T1 SE+) with flow compensation and/or three-dimensional T1w gradient echo sequences (3D T1 GRE+) following weight-adjusted i.v. Gadolinium injection, respectively. If both sequences were acquired, axial 3D T1 GRE+ was processed for further analysis. Sequence parameters for the different MRI scanners are given in Table 1.
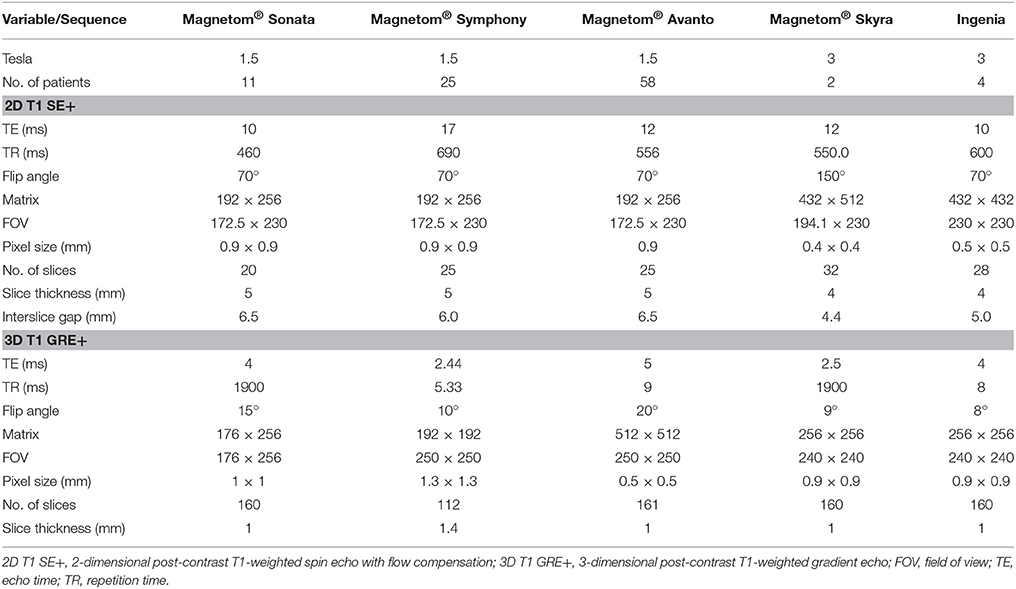
Table 1. Sequence parameters of the axial post-contrast T1w spin echo with flow compensation (2D T1 SE+) and/or three-dimensional T1w gradient echo sequence (3D T1 GRE+) of different MRI scanners.
A necrotic BM was defined as central hypointense area surrounded by a rim of marked enhancement on post-contrast T1-weighted MR images.
Segmentation of BM
In 100 patients we detected and semi-manually segmented a total of 809 BM. Semi-automated segmentation was performed using the Analyze Software System 11.0 (Biomedical Imaging Resource, Mayo Clinic, Rochester, MN, USA) (15). Afterwards, axial post-contrast T1-weighted MR images were automatically co-registered to the MNI 1 mm brain by using the FMRIB Software Library 5.0 linear (affine) registration tool. Correct registration of all post-contrast T1-weighted MR images and the segmented BM to the MNI brain was secured through visual inspection by two readers (T. S. and S. S.). From all BM masks in MNI space, a binary sum mask was created, subdividing the MNI brain in regions with (BMpos) and without BM (BMneg).
Statistical Analysis
Statistical analysis was conducted using IBM SPSS Statistics® software (IBM® 2011, version 20, Armonk, New York, USA) and R (The R Foundation, version 3.3.1 Vienna, Austria). The differences in CBF, CBV, MTT, and TTP between all BMpos and BMneg voxels were compared by the independent t-test since we had a large enough sample size. Voxels with more than one BM were weighted according to the number of BM occurring within the voxel. Mann-Whitney U-test was performed to determine voxel-wise differences of perfusion values among BM with and without central necrosis. If not otherwise indicated, data are given as median ± standard deviation.
Results
Descriptive Statistics
Patient age at diagnosis of BM was 62 ± 12.5 years. The number of patients, number of BM, and number of BM with central necrosis for the whole group and for the different primary tumors are described in Table 2. Primary tumor entities were lung cancer (n = 51: 37 non-small lung cancer and 14 small cell lung cancer), skin cancer (n = 17: 16 melanoma and one Merkel-cell carcinoma), breast cancer (n = 10), genitourinary cancer (n = 10: one choriocarcinoma, two prostate, two kidney, three urothelial cell cancer, and two testicular cancer), cancer of unknown primary (n = 6), gastrointestinal cancer (n = 4: two colon and two rectal cancer), and sarcoma (n = 2).
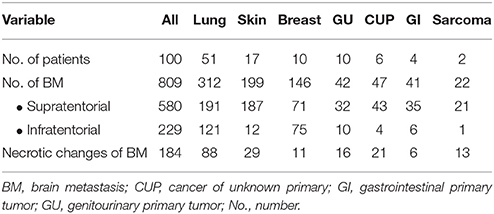
Table 2. BM characteristics among the whole cohort and the different primaries.
Perfusion Patterns
Among all patients, CBF (56 ± 34 vs. 59 ± 35 ml/100 g/min, p < 0.001) and CBV (3.7 ± 2.0 vs. 3.9 ± 2.1 ml/100 g, p < 0.001) were lower and MTT (4.8 ± 0.7 vs. 4.7 ± 0.7 s, p < 0.01) and TTP (9.3 ± 0.9 vs. 9.2 ± 0.9 s, p < 0.001) were higher in BMpos than within BMneg.
When studying perfusion values for the supra- and infratentorial area separately, we found a marked difference: supratentorial BM occurred more often in areas with lower CBF (51 ± 33 vs. 58 ± 35 ml/100 g/min, p < 0.001) and CBV (3.3 ± 1.9 vs. 3.7 ± 2.1 ml/100 g, p < 0.001) and higher MTT (4.6 ± 0.8 vs. 4.5 ± 0.8 s, p < 0.001) and TTP (9.3 ± 1.1 vs. 9.1 ± 1.1 s, p < 0.001) indicating lower perfusion compared to BMneg. On the contrary, infratentorial BM favored areas with higher CBF (55 ± 33 vs. 39 ± 29 ml/100 g/min, p < 0.001) and CBV (3.7 ± 2.0 vs. 2.7 ± 1.9 ml/100 g, p < 0.001) and shorter MTT (4.7 ± 0.7 vs. 4.7 ± 0.6 s, p < 0.001) and TTP (9.4 ± 0.6 vs. 9.6 ± 0.7 s, p < 0.001) implying higher perfusion compared to BMneg (Figures 3A–D).
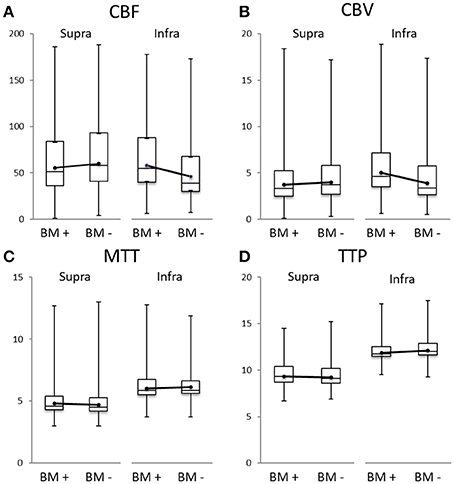
Figure 3. Boxplots of cerebral blood flow (CBF in ml/100 g/min, A), cerebral blood volume (CBV in ml/100 g, B), mean transit time (MTT in s, C), and time to peak (TTP in s, D) of the supra- (left side of each panel) and infratentorial area (right side), always for the brain metastases (BMpos = BM +) and their corresponding area without any BM (BMneg = BM –). The dots represent the mean. For better comparability between BMpos and BMneg, they are connected by a line.
Supratentorially, these differences were found to be greater when adjusting for the number of BM occurring within a voxel: in voxels containing a high number of BM the median CBF was even lower compared to the median CBF in all supratentorial voxels.
On the contrary, the highest CBF values infratentorially were observed in voxels containing less BM (Figures 4A,B).
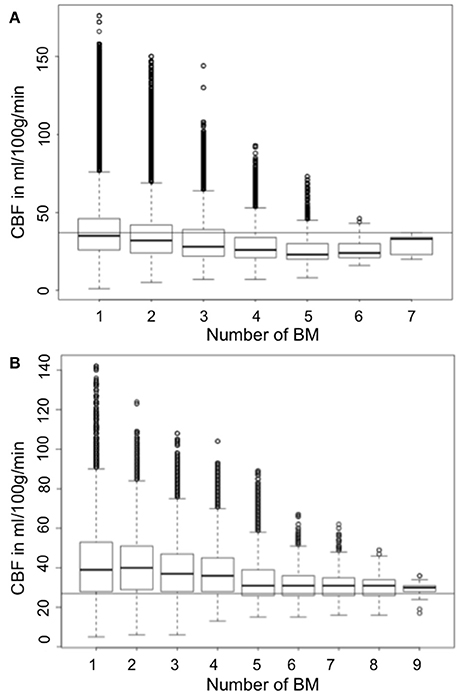
Figure 4. Boxplot showing the median CBF (y-axis) according to number of BM (x-axis) in relation to the median CBF (A) supra- and (B) infratentorial (continuous horizontal line).
Perfusion and Central Necrosis
BM with central necrosis showed a lower CBF (53 ± 33 vs. 59 ± 35 ml/100 g/min, p < 0.001) and CBV (3.5 ± 2.0 vs. 3.9 ± 2.1 ml/100 g, p < 0.001) and higher MTT (4.8 ± 0.8 vs. 4.7 ± 0.7 s, p = 0.002) compared to BM without necrosis. The difference for TTP was not significant (9.4 ± 0.6 vs. 9.3 ± 0.6 s, p = 0.182).
Discussion
In a cohort of 100 untreated BM patients we were able to demonstrate an inverse relationship between BM location and brain perfusion depending on lesion location. BM development in proportionally higher perfused areas occurred infratentorially whereas supratentorial BM favored lower-perfused areas. Supratentorial, these results were strengthened by our finding that the difference in perfusion increased with the number of metastases per brain voxel. Furthermore, we found that BM with central necrosis more often developed in areas with lower blood flow that corresponds to the pathophysiology of tumor necrosis.
The observed differences in BM location were greater for CBF and CBV and only marginal for MTT and TTP. This is likely due to the greater physiological heterogeneity of CBF and CBV between anatomical and structural brain regions whereas MTT and TTP values of the gray and white matter are comparatively similar and do not show large variance throughout the brain (16). But what structural differences may explain our opposite supra- and infratentorial perfusion patterns? One important difference is that in evolutionary terms, the cerebellum and brainstem are older compared to the cerebral neocortex what involves a characteristic vascular architecture (17). De Reuck et al. showed that there is only one type of cerebellar cortical arterial branches whereas the vascularization of the neocortex is more complex and the type of cortical branch is cell layer-dependent (18). Furthermore, one could hypothesize that the perfusion differences are primary due to hemodynamic mechanisms. The vessel cross sectional area of the vertebral arteries is much smaller compared to the internal carotid arteries; therefore, less blood volume arrives infratentorially. Hence, higher perfusion might be a requirement for the development of cerebellar BM. We found the differences in median CBF and CBV of BMpos and BMneg for infratentorial BM being much greater compared to supratentorial BM what may support this hypothesis further.
Preclinical studies showed that the process of metastastic spread to the brain in lung adenocarcinoma and breast cancer cells requires production of vascular endothelial growth factor-A (VEGF-A) that induces early neoangiogenesis whereas metastatic melanoma cells were shown to proliferate along pre-existing and remodeled vessels (vessel cooption) independently from VEGF-A (19–21). Hence, our study findings could indicate that supratentorial BM rely more on VEGF-A-mediated mechanisms of angiogenesis compared to infratentorial BM.
Limitations
The main limitation of our study—since the results imply a relationship between brain perfusion and the occurrence of BM—is that it is unclear whether the perfusion preferences also existed in the individual BM patient because it was derived from a mean perfusion map template. For this purpose, additional perfusion imaging on serial brain MRI for staging purposes could be performed in future clinical studies. However, since Nudelman et al. already demonstrated alterations of the cerebral perfusion in non-metastatic breast cancer patients, this will be difficult to interpret (9). In addition, interindividual as well as longitudinal comparison would be limited.
Our measured perfusion parameter differences are partially very subtle (yet significant) rather for MTT/TTP than for CBF/CBV and thus raise the question about the clinical relevance for an individual BM patient when observing the entire cohort. The following separation into supra- and infratentorial BM showed that the inverse behavior of infratentorial BM amortized initial larger perfusion value differences. Thus, we believe that our findings do have clinical significance, especially when looking for a supra- or infratentorial BM distribution. Interestingly, our median infratentorial CBV was 3.7 ml/100 g in BMpos and 2.7 ml/100 g in BMneg whereas the ischemia CBV threshold was reported to be 2.0 ml/100 g (16, 22, 23).
As we considered this a proof of concept study, we refrained from analyzing differences in primary tumor entities and histological or molecular subtypes. Since, for example, epidermal growth factor receptor in lung cancer was shown to influence the preferred anatomical distribution of BM, future studies should elucidate the influence of those factors on the perfusion pattern or vice versa (24).
Conclusions
We demonstrated that supratentorial BM developed preferentially in areas with low-normal perfusion, compared to BM of the cerebellum and brainstem, which primarily established growth in areas of high perfusion. Our findings point to diverse growth characteristics of supra- and infratentorial BM, which could be based on a differential vascular supply, hemodynamic requirements, production of pro-angiogenic factors, and/or anatomical homing behavior of different types of BM. Further characterization of those processes could lead to earlier detection of BM and may even provide a novel therapeutic approach.
Author Contributions
Conceptualization: TS, AK, GS, and SG. Investigation: TS, AK, JS, KP, MG, GS, MM, JF, and SG. Methodology: TS, AK, GS, and SG. Software: AK and SG. Writing ± original draft: TS, AK, JS, and SG. Writing ± review & editing: TS, AK, JS, KP, MG, GS, MM, JF, and SG.
Conflict of Interest Statement
The authors declare that the research was conducted in the absence of any commercial or financial relationships that could be construed as a potential conflict of interest.
References
1. Paget S. The distribution of secondary growths in cancer of the breast. 1889. Cancer Metastasis Rev. (1989) 8:98–101.
2. Fidler IJ, Yano S, Zhang RD, Fujimaki T, Bucana CD. The seed and soil hypothesis: vascularisation and brain metastases. Lancet Oncol. (2002) 3:53–7. doi: 10.1016/S1470-2045(01)00622-2
3. Ewing J. Neoplastic Diseases: A Treatise on Tumors. 3rd ed. Philadelphia, PA: Wb saunders (1928).
4. Mazzone PJ, Marchi N, Fazio V, Taylor JM, Masaryk T, Bury L, et al. Small vessel ischemic disease of the brain and brain metastases in lung cancer patients. PLoS ONE (2009) 4:e7242. doi: 10.1371/journal.pone.0007242
5. Berk BA, Nagel S, Hering K, Paschke S, Hoffmann KT, Kortmann RD, et al. White matter lesions reduce number of brain metastases in different cancers: a high-resolution mri study. J Neurooncol. (2016) 130:203–9. doi: 10.1007/s11060-016-2235-5
6. Quattrocchi CC, Errante Y, Mallio CA, Carideo L, Scarciolla L, Santini D, et al. Inverse spatial distribution of brain metastases and white matter hyperintensities in advanced lung and non-lung cancer patients. J Neurooncol. (2014) 120:321–30. doi: 10.1007/s11060-014-1554-7
7. Quattrocchi CC, Errante Y, Mallio CA, Santini D, Tonini G, Zobel BB. Brain metastatic volume and white matter lesions in advanced cancer patients. J Neurooncol. (2013) 113:451–8. doi: 10.1007/s11060-013-1137-z
8. Hwang TL, Close TP, Grego JM, Brannon WL, Gonzales F. Predilection of brain metastasis in gray and white matter junction and vascular border zones. Cancer (1996) 77:1551–5.
9. Nudelman KN, Wang Y, McDonald BC, Conroy SK, Smith DJ, West JD, et al. Altered cerebral blood flow one month after systemic chemotherapy for breast cancer: a prospective study using pulsed arterial spin labeling mri perfusion. PLoS ONE (2014) 9:e96713. doi: 10.1371/journal.pone.0096713
10. Schwarzbach CJ, Schaefer A, Ebert A, Held V, Bolognese M, Kablau M, et al. Stroke and cancer: the importance of cancer-associated hypercoagulation as a possible stroke etiology. Stroke (2012) 43:3029–34. doi: 10.1161/STROKEAHA.112.658625
11. Feyen L SH, Niederstadt T, Heindel W, Kemmling A Standardization of dynamic whole brain perfusion ct: a comprehensive database of regional perfusion parameters; dgnr 2010 - jahrestagung der deutschen gesellschaft für neuroradiologie. Clin Neuroradiol. (2010) 20:189–220. doi: 10.1007/s00062-010-0025-6
12. Abels B, Klotz E, Tomandl BF, Kloska SP, Lell MM. Perfusion ct in acute ischemic stroke: a qualitative and quantitative comparison of deconvolution and maximum slope approach. AJNR Am J Neuroradiol. (2010) 31:1690–98. doi: 10.3174/ajnr.A2151
13. Kemmling A, Wersching H, Berger K, Knecht S, Groden C, Nolte I. Decomposing the hounsfield unit: Probabilistic segmentation of brain tissue in computed tomography. Clin Neuroradiol. (2012) 22:79–91. doi: 10.1007/s00062-011-0123-0
14. Sze G, Milano E, Johnson C, Heier L. Detection of brain metastases: comparison of contrast-enhanced mr with unenhanced mr and enhanced ct. AJNR Am J Neuroradiol. (1990) 11:785–91.
15. Robb RA. The biomedical imaging resource at mayo clinic. IEEE Trans Med Imaging (2001) 20:854–67. doi: 10.1109/42.952724
16. Konstas AA, Goldmakher GV, Lee TY, Lev MH. Theoretic basis and technical implementations of ct perfusion in acute ischemic stroke, part 2: technical implementations. AJNR Am J Neuroradiol. (2009) 30:885–92. doi: 10.3174/ajnr.A1492
17. Florio M, Huttner WB. Neural progenitors, neurogenesis and the evolution of the neocortex. Development (2014) 141:2182–94. doi: 10.1242/dev.090571
18. De Reuck J. The cortico-subcortical arterial angio-architecture in the human brain. Acta Neurol Belg. (1972) 72:323–9.
19. Kienast Y, von Baumgarten L, Fuhrmann M, Klinkert WE, Goldbrunner R, Herms J, et al. Real-time imaging reveals the single steps of brain metastasis formation. Nat Med. (2010) 16:116–22. doi: 10.1038/nm.2072
20. Yano S, Shinohara H, Herbst RS, Kuniyasu H, Bucana CD, Ellis LM, et al. Expression of vascular endothelial growth factor is necessary but not sufficient for production and growth of brain metastasis. Cancer Res. (2000) 60:4959–67.
21. Kim LS, Huang S, Lu W, Lev DC, Price JE. Vascular endothelial growth factor expression promotes the growth of breast cancer brain metastases in nude mice. Clin Exp Metastasis (2004) 21:107–18. doi: 10.1023/B:CLIN.0000024761.00373.55
22. Wintermark M, Flanders AE, Velthuis B, Meuli R, van Leeuwen M, Goldsher D, et al. Perfusion-ct assessment of infarct core and penumbra: receiver operating characteristic curve analysis in 130 patients suspected of acute hemispheric stroke. Stroke (2006) 37:979–85. doi: 10.1161/01.STR.0000209238.61459.39
23. Wintermark M, Reichhart M, Thiran JP, Maeder P, Chalaron M, Schnyder P, et al. Prognostic accuracy of cerebral blood flow measurement by perfusion computed tomography, at the time of emergency room admission, in acute stroke patients. Ann Neurol. (2002) 51:417–32. doi: 10.1002/ana.10136
Keywords: blood-brain barrier, cerebral blood flows, hemodynamics, MR tomography, multidetector computed tomography, neoplasm metastases, neoplasms, perfusion imaging
Citation: Schneider T, Kemmling A, Schroeder J, Pantel K, Glatzel M, Schoen G, Mohme M, Fiehler J and Gellißen S (2018) Inverse Perfusion Requirements of Supra- and Infratentorial Brain Metastases Formation. Front. Neurol. 9:391. doi: 10.3389/fneur.2018.00391
Received: 27 March 2018; Accepted: 14 May 2018;
Published: 30 May 2018.
Edited by:
Sandro M. Krieg, Technische Universität München, GermanyReviewed by:
Sunit Das, St. Michael's Hospital, Toronto, CanadaCarsten Friedrich, University of Rostock, Germany
Copyright © 2018 Schneider, Kemmling, Schroeder, Pantel, Glatzel, Schoen, Mohme, Fiehler and Gellißen. This is an open-access article distributed under the terms of the Creative Commons Attribution License (CC BY). The use, distribution or reproduction in other forums is permitted, provided the original author(s) and the copyright owner are credited and that the original publication in this journal is cited, in accordance with accepted academic practice. No use, distribution or reproduction is permitted which does not comply with these terms.
*Correspondence: Tanja Schneider, dGFuLnNjaG5laWRlckB1a2UuZGU=