 Yen-Ting Chen
 Shengai Li
 Elaine Magat1,2
 Ping Zhou
 Sheng Li
- 1Department of Physical Medicine and Rehabilitation, McGovern Medical School, University of Texas Health Science Center – Houston, Houston, TX, United States
- 2TIRR Research Center, TIRR Memorial Hermann Hospital, Houston, TX, United States
The phenomenon of exaggerated motor overflow is well documented in stroke survivors with spasticity. However, the mechanism underlying the abnormal motor overflow remains unclear. In this study, we aimed to investigate the possible mechanisms behind abnormal motor overflow and its possible relations with post-stroke spasticity. 11 stroke patients (63.6 ± 6.4 yrs; 4 women) and 11 healthy subjects (31.18 ± 6.18 yrs; 2 women) were recruited. All of them were asked to perform unilateral isometric elbow flexion at submaximal levels (10, 30, and 60% of maximum voluntary contraction). Electromyogram (EMG) was measured from the contracting biceps (iBiceps) muscle and resting contralateral biceps (cBiceps), ipsilateral flexor digitorum superficialis (iFDS), and contralateral FDS (cFDS) muscles. Motor overflow was quantified as the normalized EMG of the resting muscles. The severity of motor impairment was quantified through reflex torque (spasticity) and weakness. EMG-EMG coherence was calculated between the contracting muscle and each of the resting muscles. During elbow flexion on the impaired side, stroke subjects exhibited significant higher motor overflow to the iFDS muscle compared with healthy subjects (ipsilateral or intralimb motor overflow). Stroke subjects exhibited significantly higher motor overflow to the contralateral spastic muscles (cBiceps and cFDS) during elbow flexion on the non-impaired side (contralateral or interlimb motor overflow), compared with healthy subjects. Moreover, there was significantly high EMG-EMG coherence in the alpha band (6–12 Hz) between the contracting muscle and all other resting muscles during elbow flexion on the non-impaired side. Our results of diffuse ipsilateral and contralateral motor overflow with EMG-EMG coherence in the alpha band suggest subcortical origins of motor overflow. Furthermore, correlation between contralateral motor overflow to contralateral spastic elbow and finger flexors and their spasticity was consistently at moderate to high levels. A high correlation suggests that diffuse motor overflow to the impaired side and spasticity likely share a common pathophysiological process. Possible mechanisms are discussed.
Introduction
When a stroke survivor with spastic hemiplegia is asked to squeeze the hand or flex the elbow joint on the non-impaired side as shown in Figure 1, there is involuntary activation of spastic finger and elbow flexors on the impaired side (Figures 1A, B). This phenomenon of involuntary activation of spastic muscles can occur in about 30% of hemiplegic stroke (1). It is often referred as motor overflow or associated reaction (1–8). Other terms, such as mirror movement, global synkinesis, are sometimes used interchangeably for the same clinical observation (8). Motor overflow is one form of the spastic muscle overactivity. Other types of muscle overactivity are also seen clinically, such as spastic dystonia, co-contraction (9, 10).
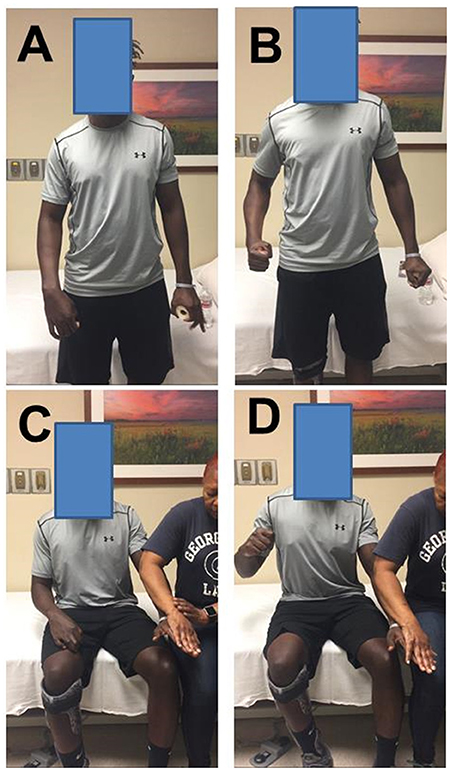
Figure 1. Motor overflow in a 41 year old stroke survivor with right spastic hemiplegia from a left middle cerebral artery hemorrhagic stroke. (A) standing and relaxed; (B) standing and left hand squeezing; (C) sitting and relaxed; (D) sitting and resisted hand/finger extension on the left side. Photos were recently taken from PI's spasticity clinic, a written consent of media release was signed by the patient.
Motor overflow is commonly observed in the contralateral homologous resting muscle(s). It can also be seen from proximal muscles to distal muscles in a form of abnormal synergy (11, 12), and between limbs on the impaired side through interlimb coupling (13). As demonstrated in Figures 1C,D, motor overflow to the contralateral spastic finger and elbow flexors occurs during voluntary finger extension on the non-impaired side. These clinical presentations indicate that motor overflow to the spastic muscles is non-selective, diffuse, and concomitantly with voluntary activation of other muscles. In contrast, motor overflow seen in neurologically intact adults is mainly in contralateral homologous muscles in the context of extreme effort or fatigue [see review (14)]. Therefore, motor overflow in stroke survivors is likely mediated by different mechanisms than in healthy adults. However, the underlying mechanisms for motor overflow after stroke are poorly understood.
A number of methods have been used in the literature to evaluate motor overflow after neurological impairments, including surface EMG, goniometry, dynamometry, electrogoniometry, and clinician rating form. Surface EMG is the most commonly used laboratory-based method (8). In our recent studies (15, 16), involuntary EMG activities of the contralateral resting muscles were used to quantify the extent of motor overflow during unilateral voluntary elbow flexion tasks. Using quantitative assessment, the level of motor overflow is found to be graded by the effort of the non-impaired muscles (3). Furthermore, EMG-EMG coherence analysis between EMG signals from the contracting muscle and the contralateral resting muscles could provide potential sources of motor overflow. Coherence analysis is based on the cross-correlation between two separate signals in the frequency domain. Coherence values fall between 0 and 1. Commonly studied frequency bands include 6–12 Hz (alpha band), 13–30 Hz (beta band), and 30–60 Hz (gamma band). It is well accepted that both beta and gamma bands have cortical origins (17–20). Coherence in the alpha band is believed to have subcortical influences, may be related to the reticulospinal drive (21). For example, EMG signals were recorded from bilateral homologous muscles, such as biceps muscles during motoric responses of acoustic startle reflex and during similar voluntary movements in healthy subjects. EMG-EMG coherence in the alpha band was significantly greater during startle reflex responses than during voluntary movement, suggestive of a reticulospinal origin of such coherence in the alpha band (21).
Motor overflow is often seen and elicited in stroke survivors with spasticity. Its relation with post-stroke spasticity remains controversial. Motor overflow is found to be associated with spasticity in some studies (2, 3, 6), but not in others (1, 4). In all these studies, spasticity was assessed using clinical scales, such as modified Ashworth scale or Tardieu scale. Quantitative assessment is likely to provide better insights into this relationship. Based on the velocity-dependent increase in resistance feature of spasticity, a quantitative assessment with computerized control of external stretch was developed (22, 23). In this approach, a joint is stretched by a motorized device at a controlled, constant speed. Resistance torque is obtained to quantify responses from spastic muscles. Reflex torque is quantified objectively by subtracting passive resistance at a very slow speed of stretch, e.g., 5°/s from that at a fast speed, e.g., 100°/s. Reflex torque is attributed primarily to underlying neural mechanisms of spasticity. In a previous study (24), we have demonstrated that reflex torque was velocity-dependent at the same wrist position (muscle length), and changed with various wrist positions at the same speed of stretch. This biomechanical quantification of spasticity is also sensitive to quantify reflex and non-reflex responses from spastic elbow flexors in response to controlled cold exposure (25).
In the present study, the specific aim was to examine the possible mechanisms mediating the phenomenon of motor overflow in chronic stroke. Stroke survivors and healthy controls were instructed to flex the elbow joint voluntarily at submaximal levels. Surface EMG signals were recorded from bilateral elbow flexors and finger flexors to quantify motor overflow. Within-limb and between-limb EMG-EMG coherence analyses were performed. Elbow flexor spasticity was quantified using our established biomechanical approach. Since motor overflow is commonly seen in stroke survivors with spasticity, they may share the same underlying pathophysiology. We hypothesized that there is greater motor overflow to the spastic elbow and finger flexors and that greater motor overflow is highly correlated with spasticity, as compared to the control group. Furthermore, post-stroke spasticity is primarily attributed to reticulospinal hyperexcitability and has separate underlying mechanisms for weakness (26, 27). between-limb intermuscular EMG signals were hypothesized to have significant EMG-EMG coherence in the alpha band to reflect reticulospinal hyperexcitability. Motor overflow was further hypothesized to correlate with spasticity (reflex torque), but not weakness.
Methods
Participants
Eleven healthy adults (Age: 31.18 ± 6.18 yrs; 2 women) and 11 stroke patients (63.6 ± 6.4 yrs; 4 women) participated in this study. All healthy subjects reported no known neuromusculoskeletal impairments and were right-handed. Inclusion criteria for the stroke subjects were: (1) hemiplegia secondary to an ischemic or hemorrhage stroke; (2) at least 6 months post-stroke; (3) residual voluntary elbow flexion force; (4) spastic hypertonia in elbow flexors of the impaired side, rated as Modified Ashworth Scale (MAS) less than 3; and (5) able to understand and follow instructions related to the experiment. Exclusion criteria for the stroke subjects included: (1) a history of multiple strokes or bilateral involvement; (2) presence of contracture that would limit full elbow range of motion on the impaired side; (3) presence of cocontractions between flexors and extensors at rest during clinical assessment; (4) spatial-visual neglect; (5) elbow flexor MAS score of 3 or 4 in the impaired elbow that would make it difficult to position the elbow and forearm in a customized device; and (6) taking baclofen or any medication which could alter the severity of muscle spasticity. The detail information of the stroke subjects is listed in Table 1. The Committee for the Protection of Human Subjects at the University of Texas Health Science Center at Houston approved the procedures of this study. All participants provided written informed consent before participating in the study.
Table 1. Stroke subjects list.
Experimental Tasks
In this study, we aimed to examine motor overflow and its relations to spasticity and weakness in chronic stroke. Motor overflow was assessed from the contracting biceps muscle (iBiceps) to the contralateral resting biceps (cBiceps), ipsilateral flexor digitorum superficialis (iFDS), and contralateral FDS (cFDS) muscles in healthy and stroke subjects. There were four motor overflow tasks as follows: (1) Dominant elbow flexion (DEF) tasks for healthy subjects; (2) Non-dominant elbow flexion (NDEF) tasks for healthy subjects; (3) Impaired elbow flexion (IPEF) tasks for stroke subjects; (4) Non-impaired elbow flexion (NIPEF) tasks for stroke subjects. In addition, spasticity and weakness of elbow flexors were quantified using an established biomechanical paradigm as described below.
Each subject was comfortably seated in an upright position on a height-adjustable chair. The subject was asked to keep a symmetric position with their both arms under the following configuration. The shoulder joint was kept approximately in 45° of flexion and 30° of abduction, while the elbow joint was kept in 90° flexion. The forearm was placed in neutral position. The active arm was placed in a customized arm device, while the forearm was secured against two adjustable metal plates with a padded strap approximately 2-4 inches proximal from the wrist. The resting arm was rested on a height-adjustable table. A 20-inch monitor (Model: 2001FP, Dell Computer Corp., Texas, USA) was used to provide visual feedback of the force produced by elbow flexion and the target force. The monitor was placed about 1 meter in front of the subject at eye level. All subjects reported that they could see the display clearly. Subjects performed the following tasks.
1) Muscle strength testing: Maximum voluntary contraction (MVC) force was estimated 3 times for elbow flexion and grip strength of both sides, respectively. The subjects were asked to produce a maximum force for 3–5 s. The highest force among 3 attempts was considered the MVC force. Maximum force of elbow flexion was used to pre-define the target force in the main experiments. One-minute rest was provided between consecutive MVC attempts.
2) Motor overflow tasks: Before a trial began, a target force level was provided as a red horizontal line in the middle of the monitor. The real-time force signal was provided as a white trace on the screen. It ran from left to right during each 12 s trial. For each trial, the subjects were asked to wait about 1 s (to show the baseline) and then increase their elbow isometric contraction force to reach the target within 2 s. Subjects were encouraged to match the white line (force) with the red line (target) as closely as possible throughout the trial. One to three practice trials were given to the subjects for familiarization of the force task.
Figure 2 illustrates the raw data of representative DEF task from one healthy subject, NIPEF task and IPEF task from one representative stroke subject. All the healthy subjects were asked to perform DEF and NDEF tasks with 10, 30, and 60% of the MVC forces as the targets, respectively. All the stroke subjects were asked to perform IPEF and NIPEF tasks with 10, 30, and 60% of the MVC forces as the targets, respectively. All subjects were asked to perform six trials for each force level. The order of the three force levels was randomized for each subject. During isometric contraction, subjects were explicitly instructed to keep other muscles relaxed. Adequate rest breaks were allowed between trials to minimize any possible fatigue effect.
3) Quantification of elbow flexor spasticity: Only the impaired elbow of stroke subjects was passively stretched in this task. An established experimental paradigm was used (25, 28). Subjects were asked to relax during the passive stretch tasks. The servo motor moved the forearm from elbow flexion 50° to full extension (0°) and then moved it back to the initial position, i.e., the range of the stretch was elbow flexion 50° to full extension. The servo motor was set motionless 2 s before the stretch, 2 s after reaching full extension, and 2 s after moving back to the initial position during a trial. The total length of a trial depended on the stretch speed. There were two different stretch speeds: 5 and 100°/s. Each task was performed three times in a roll, and the order of the two tasks was randomized between subjects. There was approximately 1 minute rest between trials.
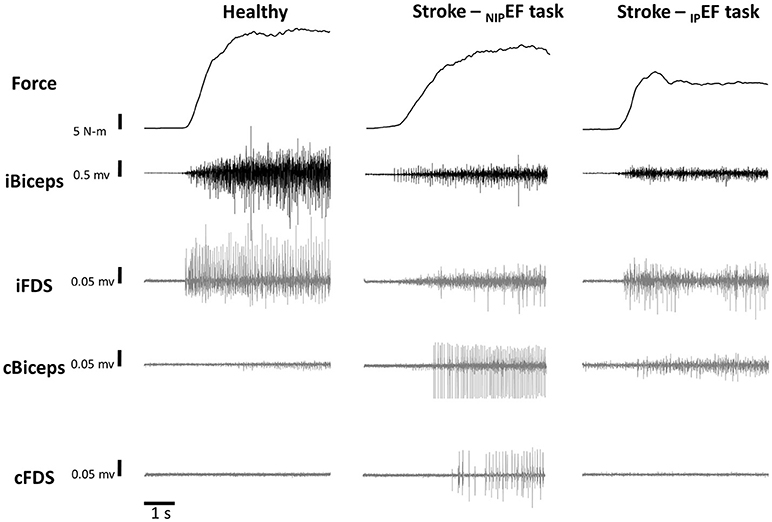
Figure 2. Representative trials of force and EMG during a 60% MVC NDEF task of one healthy subject and 60% MVC NIPEF and IPEF tasks of one stroke subject. Note that the scale for the iBiceps is 0.5 mV and the scales for the overflow muscles (iFDS, cBicep, and cFDS) are 0.05 mV.
Data Collection
Elbow flexion force was measured using a torque sensor (Model: TRS-500, Transducer Techniques, Temecula, CA, USA). The sensor was located in line with the center of the rotation of the active elbow joint. During MVC task, Grip strength was measured using a hand dynamometer (Jamar Plus+; Sammons Preston, Rolyon, Bolingbrook, IL). Surface EMG electrodes (Delsys 2.1 Single Differential Configuration, Delsys Inc., Boston, MA, USA) were placed on the biceps and FDS muscles bilaterally according to the European Recommendations for Surface Electromyography (29). The EMG signals were collected through a Bagnoli EMG system (Delsys Inc.), amplified 1000 times. All the collected signals were sampled at 1,000 Hz with a NI-DAQ card (Model: PCI-6229, National Instruments, Austin, TX, USA) and stored on a personal computer.
Data Analysis
Data was analyzed off-line using custom-written Matlab programs (MathWorksTM Inc., Natick, Massachusetts, USA). The raw torque signal was low-pass filtered at 10 Hz with a fourth-order, zero-lag Butterworth digital filter before further analysis. The following parameters were calculated:
Root-Mean-Square (RMS) EMG and Motor Overflow
Before RMS EMG calculation, the raw EMG signal was detrended in order to remove the offset before further analysis. For MVC trials, RMS EMG was calculated over a 2-s window centered on the peak force. For submaximal isometric tasks, a 2-s segment of EMG signals in the middle of each trial was used to standardize the analysis as used in our recent studies (15, 30, 31). Subjects were able to generate a steady force output during this time window. RMS EMG values were calculated for biceps and FDS on both sides for each trial. RMS EMG values were further normalized to the MVC trials of the corresponding muscles (nEMG).
As shown in representative trials in Figure 2, there were EMG activities in resting non-contracting muscles (ipsilateral FDS, contralateral biceps, contralateral FDS) during unilateral isometric elbow flexion tasks in both healthy and stroke subjects. Motor overflow was defined as nEMG in these muscles in this study, reflecting involuntary activation of the resting muscles.
Reflex Torque
A resistance torque was generated during the passive rotation of the elbow joint by a servomotor. The total resistance torque of a passive stretching task was calculated as the differences between the mean torque over a 200 ms window prior to stretching (the baseline) and the highest torque during the stretch as described in our recent study (28). The total resistance torque includes both reflex and non-reflex resistances. The total resistance torque to slow stretching (5°/s) is considered to reflect the passive and non-reflex property of spastic muscles. The difference in the total resistance torque between fast (100°/s) and slow stretching thus represents the reflex component of spastic muscles (24, 28, 32). Therefore, the reflex torque was calculated as the difference in the total resistance torque between 5 and 100°/s stretch speeds.
Weakness
Peak values of individual MVC tasks were measured on both sides for elbow flexion and grip tasks. The weakness of a task on the impaired side was quantified as the percent of the MVC force of the impaired muscle with reference to the MVC force on the contralateral side.
EMG-EMG Coherence
Before EMG-EMG coherence calculation, the raw EMG signal was detrended in order to remove the offset. Coherence was calculated between iBiceps muscle with the other three muscles, respectively. For all healthy subjects, we pooled all the EMG signals from DEF and NDEF tasks for iBiceps, cBiceps, iFDS, and cFDS muscles, respectively. For all stroke patients, we pooled the EMG signals for iBiceps, cBiceps, iFDS and cFDS muscles for IPEF and NIPEF tasks, separately. The EMG power spectrum of each muscle was calculated with a 500 ms (500 data points) epoch, with zero overlap moving windows using the built-in fft function in Matlab. The same 2-s window used for RMS EMG calculation was used to calculate the coherence for each trial, so the total epochs used in EMG-EMG coherence calculation for healthy subjects were 1,584 (4 epochs/trial × 6 trials × 3 force levels × 2 sides of upper limbs × 11 subjects). For IPEF task in stroke subjects, there were total 792 epochs (4 epochs/trial × 6 trials × 3 force levels × 11 subjects) between iBiceps and cBiceps and between iBiceps and cFDS muscles, while there were only 648 (4 epochs/trial × 6 trials × 3 force levels × 9 subjects) epochs between iBiceps and iFDS muscles due to no voluntary contraction of impaired FDS muscle in two stroke subjects. For NIPEF task in stroke patients, similar to IPEF task, there were total 792 epochs (4 epochs/trial × 6 trials × 3 force levels × 11 subjects) between iBiceps and cBiceps and between iBiceps and iFDS muscles, while there were only 648 epochs (4 epochs/trial × 6 trials × 3 force levels × 9 subjects) between iBiceps and cFDS muscle due to no voluntary contraction of impaired FDS muscle in two stroke patients. We used the following equation to calculate EMG-EMG coherence:
Where Cxy represents the coherence between EMG signal x and y, and f is the frequency. Pxx and Pyy represent autospectra for signal x and y, while Pxy represents the cross spectrum of signal x and y. The EMG-EMG coherence calculation described above is one of the standard methods in the literature (17, 33, 34). Coherence values were calculated between 0 and 350 Hz. We focused on significant coherence during 6–12 Hz (alpha band), 13–30 Hz (beta band), and 30–60 Hz (gamma band) frequency bands because they have been previously associated with cortical or subcortical origins (17–20).
Statistical Analysis
The dependent variables in this study were: (1) MVC force; (2) normalized RMS EMG (nEMG); (3) reflex torque; (4) weakness; and (5) EMG-EMG coherence. Paired t-test (two-tailed) was used to test the difference between dominant and non-dominant MVC forces in healthy subjects, and impaired and non-impaired MVC forces in stroke subjects, respectively. Two-way repeated measure ANOVAs were used to compare the effect of dominance for the nEMG parameters in healthy subjects with factors of SIDE (dominant or non-dominant) and FORCE LEVEL (10, 30, and 60% of MVC). Data were then averaged from two sides for healthy subjects for further comparisons with stroke data since no statistical significance was found. Two-way mixed ANOVAs were used to compare the differences between healthy and stroke subjects for the nEMG parameters with a between-group factor of GROUP (healthy and stroke) and a within-group factor of FORCE LEVEL (10, 30, and 60% of MVC) for each side (impaired, IPGROUP and non-impaired, NIPGROUP) separately.
In order to test the correlation between severity of motor impairment and motor overflow, Pearson coefficient correlations (r) were calculated between severity parameters (reflex torque and weakness) and nEMG of cBicep, iFDS, and cFDS muscles. For EMG-EMG coherence, because the different number of epochs among different coherence calculations, the coherence value was considered significant when it was above two standard deviation of the mean coherence value between 0 and 350Hz during each pair of EMG-EMG coherence calculation (33–35). All statistical analyses, except EMG-EMG coherence, were performed with the Statistica 13 software (StatSoft Inc. CA, USA). The alpha level for all statistical tests was 0.05. Data are reported as mean ±SD within the text and as mean ± SEM in the figures. Only the significant main effects are presented, unless otherwise noted.
Results
MVC Tasks
There was no significant difference in MVC values between the dominant and non-dominant sides of the healthy subjects for elbow flexion tasks (42.1 ± 10.7 N-m vs. 37.9 ± 6.9 N-m; p = 0.14). However, healthy subjects exhibited smaller grip strength with the non-dominant hand (36.0 ± 9.2 Kg) compared to the dominant hand (43.8 ± 9.7 Kg; p < 0.01). Moreover, stroke subjects exhibited significant lower elbow flexion (IP: 15.3 ± 8.8 N-m; NIP: 36.2 ± 7.7 N-m, p < 0.01) and grip (IP: 12.2 ± 10.2 Kg; NIP: 33.7 ± 7.3 Kg, p < 0.01) strength on the impaired (IP) side compared to the non-impaired (NIP) side. There were two stroke subjects who cannot perform voluntary grasping, so the averaged grip strength of the impaired side was from 9 stroke subjects.
Motor Overflow in Healthy Subjects
EMG activities of the contracting biceps (iBiceps) of each side increased with the level of force. A two-way repeated measures ANOVA showed that there was a main effect of FORECE LEVEL on the nEMG of iBiceps [F(2, 20) = 125.9, p < 0.01] (Figure 3A). The nEMG increased with force levels of the tasks for iBiceps on each side (pooled data: 10% MVC: 7.0 ± 4.6%; 30% MVC: 16.9 ± 9.0%; 60% MVC: 45.3 ±17.0%). However, there were no significant main effects of SIDE or SIDE x FORCE LEVEL interactions.
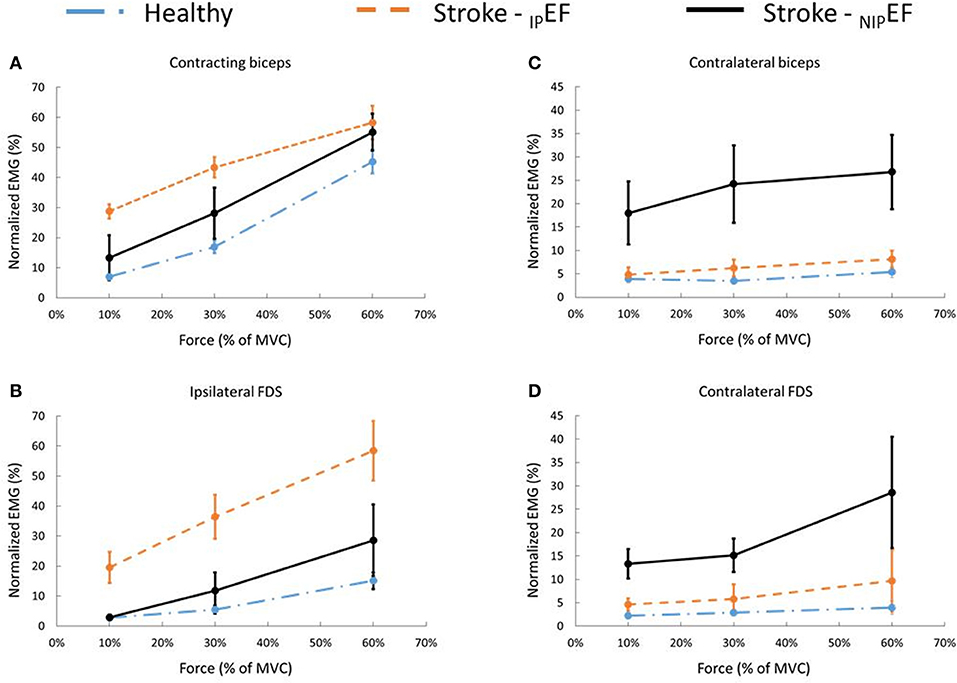
Figure 3. Muscle activity during DEF and NDEF tasks for healthy subjects and IPEF and NIPEF tasks for stroke subjects during 10, 30, and 60% of the MVC contraction task. (A) iBiceps muscle (contracting muscle) activity of stroke patients during IPEF and NIPEF tasks and the averaged iBiceps muscle activity of healthy subjects. (B) iFDS muscle activity of stroke patients during IPEF and NIPEF tasks and the averaged iFDS muscle activity of healthy subjects. (C) cBiceps muscle activity of stroke patients during IPEF and NIPEF tasks and the averaged cBiceps muscle activity of healthy subjects. (D) cFDS muscle activity of stroke patients during IPEF and NIPEF tasks and the averaged cFDS muscle activity of healthy subjects.
Motor overflow to the non-contracting, resting muscles, or the nEMG, showed a similar pattern for cBiceps and iFDS (Figures 3B,C). There was a significant main effect of FORCELEVEL on the nEMG of cBiceps [F(2, 20) = 5.3, p = 0.01], and iFDS [F(2, 20) = 26.0, p < 0.01]. Motor overflow increased with the level of isometric elbow flexion of iBiceps, respectively for cBiceps (10% MVC: 3.5 ± 2.9%; 30% MVC: 3.5 ± 2.2%; 60% MVC: 5.4 ± 4.9%), and iFDS (10% MVC: 2.7 ± 3.2%; 30% MVC: 5.5 ± 5.8%; 60% MVC: 15.1 ± 11.4%). However, motor overflow to the resting cFDS was not level-dependent. The nEMG of cFDS was 2.3 ± 3.4% at 10% MVC; 2.9 ± 3.1% at 30% MVC; 3.9 ± 5.8% at 60% MVC (p = 0.19), respectively. Furthermore, there were no significant effects of SIDE or SIDE x FORCE LEVEL interactions on the nEMG of cBicep, iFDS, and cFDS (all p > 0.1). These results showed that muscle activity and motor overflow pattern was similar between DEF and NDEF tasks in healthy subjects. The nEMG values were averaged between DEF and NDEF tasks for each muscle under each force levels. The averaged nEMG values were used to compare with stroke subjects for the rest of the analyses.
Motor Overflow in Stroke Subjects
There was a similar pattern of force level-dependent increase in normalized EMG activities (nEMG) in both impaired and non-impaired side of stroke subjects (Figure 3A). There was no significant difference in nEMG of the contracting biceps between the non-impaired side of stroke subjects and healthy controls (all p > 0.1). However, the nEMG of the contracting biceps was greater in the impaired side of stroke subjects than in healthy subjects. There were main effects of IPGROUP [F(1, 20) = 7.8, p = 0.01], FORCELEVEL [F(2, 40) = 96.1, p < 0.01], and IPGROUP x FORCELEVEL interactions [F(2, 40) = 3.8, p = 0.03] (Figure 2A). Post-hoc analyses indicated that both healthy and stroke subjects exhibited higher nEMG with the increase of generated force (Healthy, pooled data 10% MVC: 7.0 ± 3.5%; 30% MVC: 16.9 ± 6.7%; 60% MVC: 45.3 ± 13.0%; Stroke: 10% MVC: 28.7 ± 24.6%; 30% MVC: 43.3 ± 28.1%; 60% MVC: 58.2 ± 20.2% on the impaired side). Furthermore, stroke subjects exhibited significantly higher iBiceps nEMG during 10% and 30 % MVC tasks on the impaired side compared with healthy subjects.
Motor overflow was observed in the resting muscles during both IPEF and NIPEF tasks. As shown in representative trials, the pattern of motor overflow was different, depending on the task, i.e., which arm is the active arm (Figure 2). However, IPEF and NIPEF tasks generated different patterns of motor overflow to the resting muscles in ipsilateral and contralateral sides (Figures 3B–D). Note that there were two stroke subjects who cannot perform voluntary grip force, so there were only 9 subjects who had nEMG for iFDS during IPEF tasks and cFDS during NIPEF tasks.
When the impaired biceps was contracting during the IPEF tasks, there was significantly greater motor overflow to the distal finger flexors (iFDS), but similar motor overflow to the contralateral resting muscles (cBiceps and cFDS) as compared to healthy controls (Figure 3). Two-way ANOVA tests showed significant effects of IPGROUP [F(1, 18) = 18.7, p < 0.01], FORCELEVEL [F(2, 36 = 31.4, p < 0.01], and IPGROUP × Force interaction [F(2, 36) = 8.3, p < 0.01] for iFDS nEMG (Figure 3B). Post-hoc analyses indicated that stroke subjects exhibited higher iFDS nEMG during 10% (19.5 ± 17.2% vs. 2.7 ± 2.5%), 30% (36.4 ± 24.3% vs. 5.5 ± 4.4%), and 60% (58.4 ± 33.2% vs.15.1 ± 9.2%) MVC IPEF tasks compared with healthy subjects. Furthermore, although the iFDS nEMG increased with the force level for both stroke [F(2, 16) = 15.9, p < 0.01] and healthy [F(2, 20) = 26.0, p < 0.01] subjects, the significant interaction indicated that the increment slope was sharper in stroke subjects compared with healthy subjects. There were no significant differences between stroke and healthy subjects in terms of cBiceps and cFDS nEMG (all p > 0.1).
When the non-impaired biceps was contracting during the NIPEF tasks, there was significantly greater motor overflow to the contralateral spastic muscles (cBiceps and cFDS) of the impaired side, but similar motor overflow to the distal finger flexors (iFDS) as compared to healthy subjects. There were significant effects of NIPGROUP [F(1, 20) = 6.2, p = 0.02), FORCE LEVEL [F(2, 40) = 8.0, p < 0.01], and NIPGROUP x FORCE LEVEL interactions [F(2, 40) = 4.0, p = 0.03] for cBiceps nEMG (Figure 3C). Post-hoc analyses revealed that stroke subjects exhibited higher cBicep nEMG during 60% MVC NIPEF task compared with healthy subjects (Stroke: 26.8 ± 26.2%; Healthy: 5.4 ± 3.9%). Similarly, there were main effects of NIPGROUP [F(1, 18) = 8.2, p < 0.01), FORCE LEVEL [F(2, 36) = 6.7, p < 0.01], and NIPGROUP x FORCE LEVEL interactions [F(2, 40) = 4.0, p = 0.03) for cFDS nEMG (Figure 3D). Post-hoc analyses indicated that stroke subjects exhibited higher cFDS nEMG during 10% (19.5 ± 17.2% vs. 2.7 ± 2.5%), 30% (36.4 ± 24.3% vs. 5.5 ± 4.4%), and 60% (58.4 ± 33.2% vs. 15.1 ± 9.2%) MVC NIPEF tasks as compared with healthy subjects. Furthermore, the cFDS nEMG increased with the force level in stroke subjects [F(2, 16) = 9.3, p < 0.01], but not healthy subjects [F(2, 20) = 1.8, p = 0.18].
Correlation Between Impairment and Motor Overflow
Linear correlation analyses between impairment severity parameters (reflex torque and weakness) and motor overflow parameters (nEMG of cBicep, iFDS, and cFDS muscles) were performed to investigate whether the impairment level correlated with altered motor overflow. The correlation coefficients were summarized in Table 2. When the biceps on the non-impaired side was contracting during NIPEF tasks, correlation coefficient between motor overflow and spasticity of the biceps (reflex torque) was moderate to high. The correlation was very high across all force levels for cFDS. There was no consistent pattern of correlation between motor overflow and reflex torque during IPEF tasks. No consistent correlation between motor overflow and weakness was observed. Note that we excluded two stroke subjects for the correlation analyses. One of the stroke subjects cannot relax during the passive stretch tasks, and the 5°/s stretch data was missing in another subjects, so there were only 9 subjects available for the calculation of correlation between reflex torque and motor overflow. Furthermore, due to no voluntary contraction of impaired FDS muscles as we mentioned above, we also excluded those two subjects from correlation analyses for cFDS during NIPEF tasks and iFDS during IPEF tasks (n = 7).
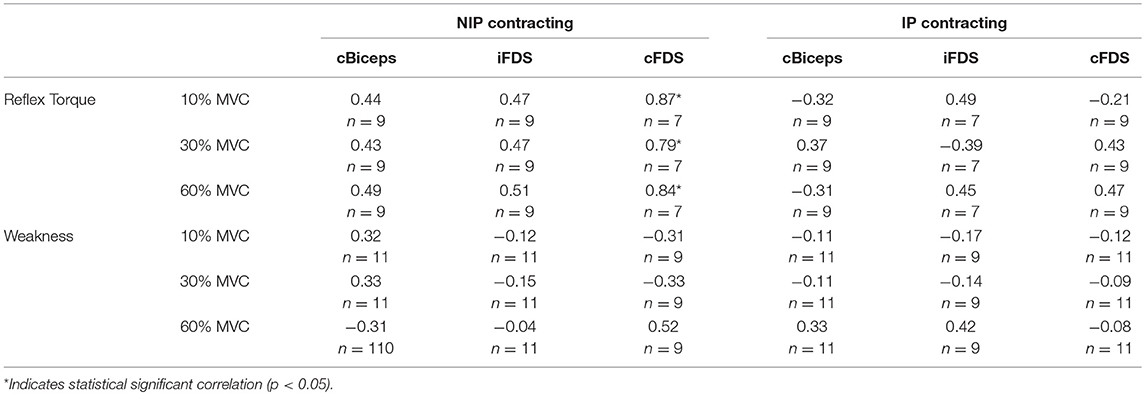
Table 2. Pearson correlation coefficients of reflex torque and weakness with nEMG of cBiceps, iFDS, and cFDS.
Coherence Between Contracting Biceps and Resting Muscles
Coherence between contracting biceps and ipsilateral FDS (Figures 4A–C, upper row): For healthy subjects, there was significant coherence in the gamma band between 30 and 54Hz (coherence power range 0.011–0.023) (Figure 4A). During IPEF tasks in stroke subjects, there was significant coherence in the beta band between 18 and 20Hz (range: 0.006–0.008) (Figure 4B). During NIPEF tasks in stroke patients, the significant coherence shifted further to the alpha band at 6–10Hz (range: 0.015–0.063), although coherence level was relatively high in the gamma band as well (Figure 4C).
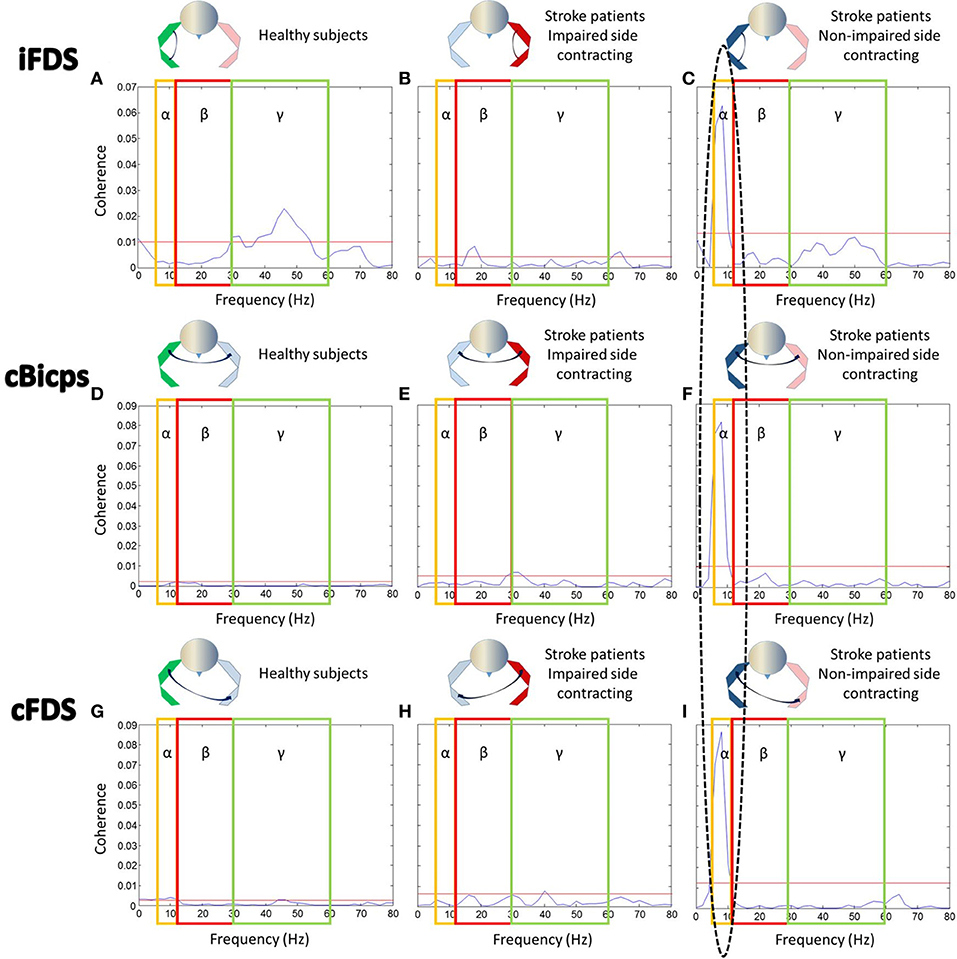
Figure 4. EMG-EMG coherence between contracting biceps and other resting muscles. Note that the ellipse highlights the significant coherence in the alpha band. Yellow boxes, red boxes, and blue boxes indicated the range of alpha band, beta band, and gamma band, respectively. Red lines indicated significant level for each figure. Coherence between (A) iBiceps and iFDS muscles in healthy subjects, (B) iBiceps and iFDS muscles during IPEF tasks in stroke patients, (C) iBiceps and iFDS muscles during NIPEF tasks in stroke patients, (D) iBiceps and cBiceps muscles in healthy subjects, (E) iBiceps and cBiceps muscles during IPEF tasks in stroke patients, (F) iBiceps and cBiceps muscles during NIPEF tasks in stroke patients, (G) iBiceps and cFDS muscles in healthy subjects, (H) iBiceps and cFDS muscles during IPEF tasks in stroke patients, and (I) iBiceps and cFDS muscles during NIPEF tasks in stroke patients.
Coherence between contracting biceps and contralateral biceps (Figures 4D–F, middle row): For healthy subjects, there was no significant coherence in all three frequency bands (Figure 4D). During IPEF tasks in stroke patients, there was significant coherence in the beta band and gamma bands between 28 and 32Hz (range: 0.005–0.007) (Figure 4E). During NIPEFs tasks in stroke patients, the significant coherence happened in the alpha band between 6 and 10Hz (range: 0.015–0.081) (Figure 4F).
Coherence between contracting biceps and contralateral FDS (Figures 4G–I, lower row): for healthy subjects, there was significant coherence in the alpha and gamma bands between 6 and 12Hz (range: 0.003–0.004) and 44–60Hz (0.003), respectively (Figure 4G). During IPEF tasks in stroke subjects, there was significant coherence in the gamma band at 40 Hz (0.008) (Figure 4H). During NIPEF tasks in stroke subjects, the significant coherence happened in the alpha band between 6 and 10Hz (range: 0.02–0.09) (Figure 4I).
Discussion
In this study, stroke survivors with spastic elbow and finger flexors and healthy controls performed unilateral isometric elbow flexion tasks at 10, 30, and 60% of MVC. Motor overflow was quantified as EMG activity of a resting muscle normalized to its corresponding MVC value (nEMG). We found that stroke subjects exhibited greater motor overflow to the impaired side in general, either from the proximal to distal muscle during elbow flexion on the impaired side or from the non-impaired to impaired side during elbow flexion on the non-impaired side. This pattern of motor overflow is schematically presented in Figure 5. Exaggerated motor overflow increased as the level of voluntary contraction increased. Correlation between exaggerated motor overflow and severity of spasticity (reflex torque) was consistently at moderate to high levels. No consistent correlation between motor overflow and weakness was observed. Furthermore, exaggerated motor overflow has a significantly high EMG-EMG coherence in the alpha band with the contracting biceps muscles on the non-impaired side. No qualitative difference in EMG-EMG coherence was observed between healthy subjects and stroke subjects during unilateral elbow flexion tasks on the impaired side. Findings from comprehensive analyses of motor overflow (nEMG, correlation with spasticity and weakness, and EMG-EMG coherence) shed light on the mechanisms of this phenomenon.
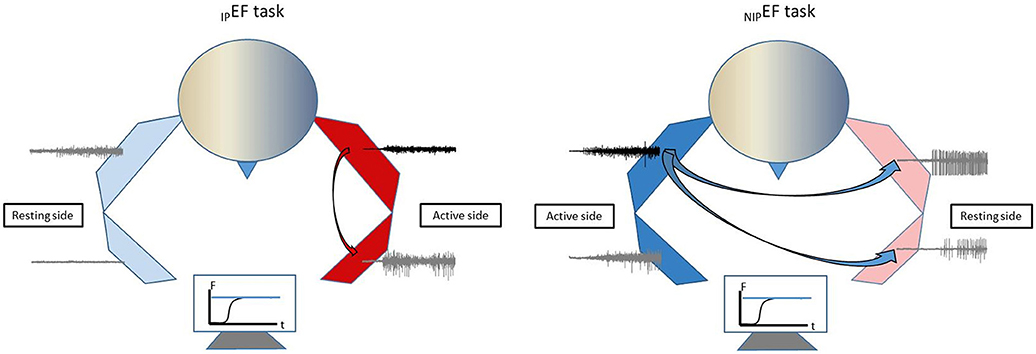
Figure 5. Schematic illustration of motor overflow patterns in chronic stroke.
Correlation Between Motor Overflow and Post-stroke Spasticity
In the present study, our findings of greater and force level-dependent motor overflow in stroke subjects are consistent with our previous studies (15, 16) and other reports in the literature (3, 8). Our results also showed that stroke subjects who had greater reflex torque exhibited more motor overflow using an established biomechanical approach, i.e., there was moderate to high correlation between motor overflow and spasticity. This finding is consistent with many previous studies (2, 3, 6). However, two studies did not report any significant correlation between motor overflow and spasticity (1, 4). In Ada and O'Dwyer paper (1), stroke subjects with either spasticity or contracture were recruited. Associated reaction (i.e., motor overflow) was determined by the presence of muscle activity and was quantified as elbow flexor torque produce on the impaired side during moderate elbow flexion tasks on the contralateral side. Spasticity was identified by the presence of abnormal reflex activity. They reported presence of contracture in half of the stroke subjects. The incidence of motor overflow was the same as of spasticity. However, the correlation between spasticity and motor overflow was determined by non-parametric analysis. The relation between spasticity and motor overflow is likely affected by non-selective subject enrollment and non-quantitative assessment of spasticity. In another study (4), Bhakta et al. found that the abnormal motor overflow of peak grip force on the impaired side during maximum voluntary grip on the contralateral side was not correlated with the summed MAS over elbow, wrist and finger flexors on the impaired side. The use of summed MAS was not justified and may have changed the relations.
Possible Mechanisms of Motor Overflow and Spasticity—A Common Pathophysiological Process
A significant coherence in the alpha band between EMGs of the contracting biceps muscle on the non-impaired side and other EMGs of resting muscles (ipsilateral distal FDS, contralateral spastic biceps muscles, and FDS) suggests a subcortical origin of motor overflow, likely from the reticulospinal drive (21). Alternatively, the alpha band coherence could also be originated from spinal mechanisms (36). In this study, Monkeys were trained to perform slow unilateral finger movements. Coherence between local field potentials and movement acceleration was found to be significant at 6–13 Hz for all tested areas in cerebellar nuclei, pontomedullary reticular formation, and the spinal cord. Further detailed analysis revealed that convergence of antiphase oscillations of cortical and subcortical descending inputs at the spinal cord motoneuronal level limited motor drive to muscles at a frequency at 10 Hz. This phase cancelation mechanism at the spinal cord was viewed to improve movement precision. However, this mechanism is not likely to explain involuntary EMG activity of the resting muscle on the contralateral side.
A different phenomenon was observed during bimanual tasks (37). Cortical activity using EEG and muscle activity of bilateral flexor pollicis brevis using surface EMG were recorded when healthy adult subjects performed bimanual force coordination tasks. Corticomuscular (EEG and EMG) coherence was significant in the beta band (16–30 Hz), consistent with the corticospinal beta-band drive for the contralateral limb muscles. Intermuscular coherence between bilateral EMGs was only observed in the alpha band (5-12Hz) and increased with bimanual coordination. The alpha band coherence was subcortical in origin. These results are supportive that multiple parallel pathways are involved in motor tasks (38). In case of stroke that damages primary motor cortex and/or its descending corticospinal pathways, descending projections of subcortical origins, particularly medial reticulospinal projections, are unopposed and upregulated for possible compensation (39, 40). As such, the alpha-band coherence in this study is most likely a release from cortical control, and is consistent with a reticulospinal drive (21). This view is supported by the findings from a recent longitudinal study (41).
It is known that there is bilateral activation of reticulospinal pathways (42–49). Motor overflow could be attributed to the accompanied non-selective activation of reticulospinal projections during voluntary movement. In particular, this non-selective activation is likely to bring spinal motor neurons which are commonly hyperexcitable but at the sub-threshold levels to fire for these spastic muscles, or to increase spontaneous firing activities of these neurons (50, 51). In this study, we observed motor overflow from proximal to distal muscles on the impaired side, and to both proximal and distal muscles on the impaired side during voluntary flexion on the non-impaired side. Reticulospinal hyperexcitability is considered a possible underlying pathophysiology of post-stroke spasticity (26, 27). Our results of high correlation between motor overflow and spasticity further support the shared underlying mechanism of these two phenomena.
Rehabilitation Relevance
Better understanding of mechanism of motor overflow and its relations with spasticity helps guide management of these clinical problems. Reticulospinal hyperexcitability is a maladaptive plastic change in the course of post-stroke motor recovery. In our previous study, motor overflow was only in the patients who have spastic hemiplegia (spastic stage), but not in those with good motor recovery and no spasticity (recovered stage), suggesting the important role of reticulospinal pathway in the development of spasticity, rather than contributions to motor recovery after stroke (16). Even in the spastic stages where stroke survivors have various degrees of spasticity, reticulospinal hyperexcitability does not contribute to development of muscle strength. Recent studies have demonstrated involuntary activation of spastic muscles during and after voluntary contraction (30, 50, 51). When reticulospinal pathways are stimulated by acoustic stimulation during sustained elbow flexion, the induced force increase is similar between stroke survivors with spasticity as compared to healthy subjects (52).
Motor overflow needs to be suppressed if the problem is exaggerated and intervenes activities of daily living. As shown in Figure 1, this patient has suffered from exaggerated motor overflow to his spastic right arm and hand. Every time when he exerts moderate to strenuous effort with his left hand, such as lifting a heavy object, working out in the gym, his right arm and wrist and fingers flexes synergistically. His right wrist reaches to his chest at times. Apparently, this exaggerated motor overflow further affects posture, and walking. Interventions, such as Botulinum toxin injection to his left elbow, wrist and finger flexors, help reduce motor overflow, and improve comfort in performing activity of daily living.
It is important to pay attention of the role of motor overflow in bilateral tasks. Motor overflow may present as bilateral synergistic coupling (53, 54). In our previous study (54), when hemiparetic stroke survivors are instructed to flex bilateral elbow joints simultaneously to match a visually guided constant force (i.e., target), the paretic side and the contralateral side are able to generate and share the total force proportionally with reference to individual maximum strength. When the visual gain of force from one side is altered, up to 8 times easier (× 8) or harder (× 1/8), the force on the other side is able to adjust its force proportionally to match the visual target. In other words, the relation between forces of each side is maintained despite of alteration of visual gain for force from only one limb. Therefore, motor rehabilitation programs involving bilateral training need to be utilized with cautions in spastic hemiplegia.
There are limitations of this study. No age-matched controls were tested, though commonly recommended. Generally speaking, the patterns from the young, healthy group data are used as a reference point. We expect that these patterns would be the same if age- and gender matched controls were enrolled in the study, since pathological patterns of motor overflow should not be expected in neurologically intact healthy controls as we discussed in the Introduction section. In this study, the patterns of EMG-EMG coherence and motor overflow were similar between the non-impaired side of stroke subjects and the healthy controls. Such findings support our expectations. Due to required isometric elbow flexion tasks on the impaired side, stroke subjects with more severe spasticity and motor impairment were not enrolled. The established biomechanical paradigm allowed quantitative grading and assessment of spasticity and correlation analysis between spasticity and motor overflow. Spastic co-contraction often occurs during elbow flexion on the impaired side. It is a missed opportunity to assess triceps activity during elbow flexion tasks. We understand that our study only provides indirect evidence regarding brainstem mechanisms for post-stroke motor overflow. However, localization of brainstem nuclei and pathways is not available even with most advanced neuroimaging techniques. Due to technical limitations, our results significantly advance our understanding of underlying mechanisms of this common phenomenon of post-stroke motor overflow.
Conclusions
To summarize, our results demonstrated that unilateral elbow flexion caused diffuse motor overflow from proximal to distal muscles on the impaired side (within-limb motor overflow) and from non-impaired side to the impaired side (between-limb motor overflow) in stroke subjects There were moderate to high correlations between the severity of spasticity and motor overflow. Furthermore, both within-limb and between-limb EMG-EMG coherence analysis showed significant coherence in the alpha band, suggestive of subcortical origins. Collectively, these results suggest that diffuse motor overflow and spasticity share a common pathophysiological process. Reticulospinal hyperexcitability is likely the candidate to mediate these clinical phenomena.
Author Contributions
Y-TC, SGL, EM, PZ, and SL: Experimental design; Y-T C, SGL, SL: Data Collection; Y-T C, SGL, EM, PZ, and SL: Data Analysis and interpretation; Y-T C and SL: Manuscript Draft; Y-T C, SGL, EM, PZ, and SL: Discussion, intellectual inputs and final approval of the manuscript.
Funding
This study was supported in part by NIH NICHD/NCMRR R21HD087128, R21HD090453.
Conflict of Interest Statement
The authors declare that the research was conducted in the absence of any commercial or financial relationships that could be construed as a potential conflict of interest.
Abbreviations
cBiceps, contralateral biceps muscle; cFDS, contralateral flexor digitorum superficialis; DEF, dominant elbow flexion; FDS, flexor digitorum superficialis; iBiceps, contracting biceps muscle; iFDS, ipsilateral flexor digitorum superficialis; IPEF, impaired elbow flexion; IPGROUP, impaired group; MVC, maximum voluntary contraction; NDEF, non-dominant elbow flexion; nEMG, normalized electromyography; NIPEF, non-impaired elbow flexion; NIPGROUP, non-impaired group; RMS, root-mean-square
References
1. Ada L, O'Dwyer N. Do associated reactions in the upper limb after stroke contribute to contracture formation? Clin Rehabil. (2001) 15:186–94. doi: 10.1191/026921501676635731
2. Dickstein R, Pillar T, Abulaffio N. Electromyographic activity of the biceps brachii muscles and elbow flexion during associated reactions in hemiparetic patients. Am J Phys Med Rehabil. (1995) 74:427–31. doi: 10.1097/00002060-199511000-00006
3. Dvir Z, Penturin E, Prop I. The effect of graded effort on the severity of associated reactions in hemiplegic patients. Clin Rehabil. (1996) 10:155–8.
4. Bhakta BB, Cozens JA, Chamberlain MA, Bamford JM. Quantifying associated reactions in the paretic arm in stroke and their relationship to spasticity. Clin Rehabil. (2001) 15:195–206. doi: 10.1191/026921501671342614
5. Bakheit AMO, Sawyer J. The effects of botulinum toxin treatment on associated reactions of the upper limb on hemiplegic gait - A pilot study. Disabil Rehabil. (2002) 24:519–22. doi: 10.1080/09638280110112891
6. Honaga K, Masakado Y, Oki T, Hirabara Y, Fujiwara T, Ota T, et al. Associated reaction and spasticity among patients with stroke. Am J Phys Med Rehabil. (2007) 86:656–61. doi: 10.1097/PHM.0b013e318116090c
7. Bhakta BB, O'Connor RJ, Cozens JA. Associated reactions after stroke: a randomized controlled trial of the effect of botulinum toxin type A. J Rehabil Med. (2008) 40:36–41. doi: 10.2340/16501977-0120
8. Kahn MB, Mentiplay BF, Clark RA, Bower KJ, Williams G. Methods of assessing associated reactions of the upper limb in stroke and traumatic brain injury: a systematic review. Brain Inj. (2016) 30:252–66. doi: 10.3109/02699052.2015.1117657
9. Gracies JM, Bayle N, Vinti M, Alkandari S, Vu P, Loche CM, et al. Five-step clinical assessment in spastic paresis. Eur. J Phys. Rehabi.l Med. (2010) 46:411–21.
10. Yelnik AP, Simon O, Parratte B, Gracies JM. How to clinically assess and treat muscle overactivity in spastic paresis. J Rehabil Med. (2010) 42:801–7. doi: 10.2340/16501977-0613
11. Lum PS, Burgar CG, Shor PC. Evidence for strength imbalances as a significant contributor to abnormal synergies in hemiparetic subjects. Muscle Nerve (2003) 27:211–21. doi: 10.1002/mus.10305
12. Ellis MD, Schut I, Dewald JPA. Flexion synergy overshadows flexor spasticity during reaching in chronic moderate to severe hemiparetic stroke. Clin Neurophysiol. (2017) 128:1308–14. doi: 10.1016/j.clinph.2017.04.028
13. Kline TL, Schmit BD, Kamper DG. Exaggerated interlimb neural coupling following stroke. Brain (2007) 130:159–69. doi: 10.1093/brain/awl278
14. Addamo PK, Farrow M, Hoy KE, Bradshaw JL, Georgiou-Karistianis N. The effects of age and attention on motor overflow production–A review. Brain Res Rev. (2007) 54:189–204. doi: 10.1016/j.brainresrev.2007.01.004
15. Chang S-H, Durand-Sanchez A, DiTommaso C, Li S. Interlimb interactions during bilateral voluntary elbow flexion tasks in chronic hemiparetic stroke. Physiol Rep. (2013) 1:e00010. doi: 10.1002/phy2.10
16. Li S, Chang SH, Francisco GE, Verduzco-Gutierrez M. Acoustic startle reflex in patients with chronic stroke at different stages of motor recvoery: a pilot study. Top Stroke Rehabil. (2014) 21:358–70. doi: 10.1310/tsr2104-358
17. Brown P. Cortical drives to human muscle: the Piper and related rhythms. Prog Neurobiol. (2000) 60:97–108. doi: 10.1016/S0301-0082(99)00029-5
18. Kilner JM, Baker SN, Salenius S, Hari R, Lemon RN. Human cortical muscle coherence is directly related to specific motor parameters. J Neurosci. (2000) 20:8838–45. doi: 10.1523/JNEUROSCI.20-23-08838.2000
19. Grosse P, Cassidy MJ, Brown P. EEG–EMG, MEG–EMG and EMG–EMG frequency analysis: physiological principles and clinical applications. Clin Neurophysiol. (2002) 113:1523–31. doi: 10.1016/S1388-2457(02)00223-7
20. von Carlowitz-Ghori K, Bayraktaroglu Z, Hohlefeld FU, Losch F, Curio G, Nikulin VV. Corticomuscular coherence in acute and chronic stroke. Clin Neurophysiol. (2014) 125:1182–91. doi: 10.1016/j.clinph.2013.11.006
21. Grosse P, Brown P. Acoustic startle evokes bilaterally synchronous oscillatory EMG activity in the healthy human. J Neurophysiol. (2003) 90:1654–61. doi: 10.1152/jn.00125.2003
22. Powers RK, Marder-Meyer J, Rymer WZ. Quantitative relations between hypertonia and stretch reflex threshold in spastic hemiparesis. Ann Neurol. (1988) 23:115–24. doi: 10.1002/ana.410230203
23. Powers RK, Campbell DL, Rymer WZ. Stretch reflex dynamics in spastic elbow flexor muscles. Ann Neurol. (1989) 25:32–42. doi: 10.1002/ana.410250106
24. Li S, Kamper DG, Rymer WZ. Effects of changing wrist positions on finger flexor hypertonia in stroke survivors. Muscle Nerve (2006) 33:183–90.
25. Li S, Shin H, Zhou P, Li X. Different effects of cold stimulation on reflex and non-reflex components of poststroke spastic hypertonia. Front Neurol. (2017b) 8:169. doi: 10.3389/fneur.2017.00169
26. Li S, Francisco G. New insights into the pathophysiology of post-stroke spasticity. Front Hum Neurosci. (2015) 9:192. doi: 10.3389/fnhum.2015.00192
27. Li S. Spasticity, motor recovery, and neural plasticity after stroke. Front Neurol. (2017) 8:120. doi: 10.3389/fneur.2017.00120
28. Bhadane MY, Gao F, Francisco GE, Zhou P, Li S. Correlation of resting elbow angle with spasticity in chronic stroke survivors. Front Neurol. (2015) 6:183. doi: 10.3389/fneur.2015.00183
29. Hermens HJ, Freriks B, Merletti R, Stegeman D, Blok J, Rau G, et al. SENIAM 8: European Recommendations for Surface Electromyography. Enschede: Roessingh Research and Development (2000).
30. Chang SH, Francisco GE, Zhou P, Rymer WZ, Li S. Spasticity, weakness, force variability, and sustained spontaneous motor unit discharges of resting spastic-paretic biceps brachii muscles in chronic stroke. Muscle Nerve (2013b) 48:85–92. doi: 10.1002/mus.23699
31. Bhadane M, Liu J, Rymer WZ, Zhou P, Li S. Re-evaluation of EMG-torque relation in chronic stroke using linear electrode array EMG recordings. Sci Rep. (2016) 6:28957. doi: 10.1038/srep28957
32. Kamper DG, Harvey RL, Suresh S, Rymer WZ. Relative contributions of neural mechanisms versus muscle mechanics in promoting finger extension deficits following stroke. Muscle Nerve (2003) 28:309–18. doi: 10.1002/mus.10443
33. Farmer SF, Gibbs J, Halliday DM, Harrison LM, James LM, Mayston MJ, et al. Changes in EMG coherence between long and short thumb abductor muscles during human development. J Physiol. (2007) 579:389–402. doi: 10.1113/jphysiol.2006.123174
34. Petersen TH, Kliim-Due M, Farmer SF, Nielsen JB. Childhood development of common drive to a human leg muscle during ankle dorsiflexion and gait. J Physiol. (2010) 588:4387–400. doi: 10.1113/jphysiol.2010.195735
35. Halliday DM, Rosenberg JR, Amjad AM, Breeze P, Conway BA, Farmer SF. A framework for the analysis of mixed time series/point process data–theory and application to the study of physiological tremor, single motor unit discharges and electromyograms. Prog. Biophys. Mol. Biol. (1995) 64:237–78.
36. Williams ER, Soteropoulos DS, Baker SN. Spinal interneuron circuits reduce approximately 10-Hz movement discontinuities by phase cancellation. Proc Natl Acad Sci USA. (2010) 107:11098–103. doi: 10.1073/pnas.0913373107
37. de Vries IEJ, Daffertshofer A, Stegeman DF, Boonstra TW. Functional connectivity in the neuromuscular system underlying bimanual coordination. J Neurophysiol. (2016) 116:2576–85. doi: 10.1152/jn.00460.2016
38. Tresch MC, Jarc A. The case for and against muscle synergies. Curr Opin Neurobiol. (2009) 19:601–7. doi: 10.1016/j.conb.2009.09.002
39. Zaaimi B, Edgley SA, Soteropoulos DS, Baker SN. Changes in descending motor pathway connectivity after corticospinal tract lesion in macaque monkey. Brain (2012) 135:2277–89. doi: 10.1093/brain/aws115
40. Herbert WJ, Powell K, Buford JA. Evidence for a role of the reticulospinal system in recovery of skilled reaching after cortical stroke: initial results from a model of ischemic cortical injury. Exp Brain Res. (2015) 233:3231–51. doi: 10.1007/s00221-015-4390-x
41. Ejaz N, Xu J, Branscheidt M, Hertler B, Schambra H, Widmer M, et al. Evidence for a subcortical origin of mirror movements after stroke: a longitudinal study. Brain (2018) 141:837–47. doi: 10.1093/brain/awx384
42. Davidson AG, Buford JA. Motor outputs from the primate reticular formation to shoulder muscles as revealed by stimulus-triggered averaging. J Neurophysiol. (2004) 92:83–95. doi: 10.1152/jn.00083.2003
43. Davidson AG, Buford JA. Bilateral actions of the reticulospinal tract on arm and shoulder muscles in the monkey: stimulus triggered averaging. Exp Brain Res. (2006) 173:25–39. doi: 10.1007/s00221-006-0374-1
44. Davidson AG, Schieber MH, Buford JA. Bilateral spike-triggered average effects in arm and shoulder muscles from the monkey pontomedullary reticular formation. J Neurosci. (2007) 27:8053–8. doi: 10.1523/JNEUROSCI.0040-07.2007
45. Riddle CN, Edgley SA, Baker SN. Direct and indirect connections with upper limb motoneurons from the primate reticulospinal tract. J Neurosci. (2009) 29:4993–9. doi: 10.1523/JNEUROSCI.3720-08.2009
46. Herbert WJ, Davidson AG, Buford JA. Measuring the motor output of the pontomedullary reticular formation in the monkey: do stimulus-triggered averaging and stimulus trains produce comparable results in the upper limbs? Exp Brain Res. (2010) 203:271–83. doi: 10.1007/s00221-010-2231-5
47. Baker SN. The primate reticulospinal tract, hand function and functional recovery. J Physiol. (2011) 589:5603–12. doi: 10.1113/jphysiol.2011.215160
48. Montgomery LR, Herbert WJ, Buford JA. Recruitment of ipsilateral and contralateral upper limb muscles following stimulation of the cortical motor areas in the monkey. Exp Brain Res. (2013) 230:153–64. doi: 10.1007/s00221-013-3639-5
49. Ortiz-Rosario A, Berrios-Torres I, Adeli H, Buford JA. Combined corticospinal and reticulospinal effects on upper limb muscles. Neurosci Lett. (2014) 561:30–4. doi: 10.1016/j.neulet.2013.12.043
50. Mottram CJ, Suresh NL, Heckman CJ, Gorassini MA, Rymer WZ. Origins of abnormal excitability in biceps brachii motoneurons of spastic-paretic stroke survivors. J Neurophysiol. (2009) 102:2026–38. doi: 10.1152/jn.00151.2009
51. Mottram CJ, Wallace CL, Chikando CN, Rymer WZ. Origins of spontaneous firing of motor units in the spastic-paretic biceps brachii muscle of stroke survivors. J Neurophysiol. (2010) 104:3168–79. doi: 10.1152/jn.00463.2010
52. Li S, Bhadane M, Gao F, Zhou P. The reticulospinal pathway does not increase its contribution to the strength of contralesional muscles in stroke survivors as compared to ipsilesional side or healthy controls. Front Neurol. (2017a) 8:627. doi: 10.3389/fneur.2017.00627
53. Rice MS, Newell KM. Upper-extremity interlimb coupling in persons with left hemiplegia due to stroke. Arch Phys Med Rehabil. (2004) 85:629–34. doi: 10.1016/j.apmr.2003.08.084
Keywords: motor overflow, stroke, spasticity, EMG-EMG coherence, reticulospinal tract
Citation: Chen Y-T, Li S, Magat E, Zhou P and Li S (2018) Motor Overflow and Spasticity in Chronic Stroke Share a Common Pathophysiological Process: Analysis of Within-Limb and Between-Limb EMG-EMG Coherence. Front. Neurol. 9:795. doi: 10.3389/fneur.2018.00795
Received: 12 March 2018; Accepted: 04 September 2018;
Published: 09 October 2018.
Edited by:
Yves Vandermeeren, Université Catholique de Louvain, BelgiumReviewed by:
Thierry Deltombe, CHU Dinant Godinne UCL Namur, BelgiumMichelle L. Harris-Love, George Mason University, United States
Bernhard Sehm, Max-Planck-Institut für Kognitions- und Neurowissenschaften, Germany
Copyright © 2018 Chen, Li, Magat, Zhou and Li. This is an open-access article distributed under the terms of the Creative Commons Attribution License (CC BY). The use, distribution or reproduction in other forums is permitted, provided the original author(s) and the copyright owner(s) are credited and that the original publication in this journal is cited, in accordance with accepted academic practice. No use, distribution or reproduction is permitted which does not comply with these terms.
*Correspondence: Sheng Li, c2hlbmcubGlAdXRoLnRtYy5lZHU=