 Lindell K. Weaver1,2,3*
 Steffanie H. Wilson4
 Anne S. Lindblad4Susan Churchill1,2Kayla Deru1,2Robert Price5Christopher S. Williams6William W. Orrison6†Jigar B. Patel6James M. Walker6Anna Meehan6
 Susan Mirow3,6 and the NORMAL Study Team
- 1Division of Hyperbaric Medicine Intermountain Medical Center, Murray, UT, United States
- 2Intermountain LDS Hospital, Salt Lake City, UT, United States
- 3Department of Internal Medicine, School of Medicine, University of Utah, Salt Lake City, UT, United States
- 4The Emmes Corporation, Rockville, MD, United States
- 5Evans Army Community Hospital, Fort Carson, CO, United States
- 6Lovelace Biomedical Research, Albuquerque, NM, United States
Introduction: Even though mild traumatic brain injury is common and can result in persistent symptoms, traditional measurement tools can be insensitive in detecting functional deficits after injury. Some newer assessments do not have well-established norms, and little is known about how these measures perform over time or how cross-domain assessments correlate with one another. We conducted an exploratory study to measure the distribution, stability, and correlation of results from assessments used in mild traumatic brain injury in healthy, community-dwelling adults.
Materials and Methods: In this prospective cohort study, healthy adult men and women without a history of brain injury underwent a comprehensive brain injury evaluation that included self-report questionnaires and neurological, electroencephalography, sleep, audiology/vestibular, autonomic, visual, neuroimaging, and laboratory testing. Most testing was performed at 3 intervals over 6 months.
Results: The study enrolled 83 participants, and 75 were included in the primary analysis. Mean age was 38 years, 58 were male, and 53 were civilians. Participants did not endorse symptoms of post-concussive syndrome, PTSD, or depression. Abnormal neurological examination findings were rare, and 6 had generalized slowing on electroencephalography. Actigraphy and sleep diary showed good sleep maintenance efficiency, but 21 reported poor sleep quality. Heart rate variability was most stable over time in the sleep segment. Dynavision performance was normal, but 41 participants had abnormal ocular torsion. On eye tracking, circular, horizontal ramp, and reading tasks were more likely to be abnormal than other tasks. Most participants had normal hearing, videonystagmography, and rotational chair testing, but computerized dynamic posturography was abnormal in up to 21% of participants. Twenty-two participants had greater than expected white matter changes for age by MRI. Most abnormal findings were dispersed across the population, though a few participants had clusters of abnormalities.
Conclusions: Despite our efforts to enroll normal, healthy volunteers, abnormalities on some measures were surprisingly common.
Trial Registration: This study was registered at www.clinicaltrials.gov, trial identifier NCT01925963.
Introduction
The Centers for Disease Control and Prevention report that in 2010, 2.2 million people in the United States sought care at Emergency Departments for traumatic brain injury (TBI) (1). Most TBIs are classified as mild in nature, generally meaning that they result in a relatively brief loss of consciousness (none or <30 min) or interval of altered consciousness or posttraumatic amnesia (<24 h) (2). While most individuals who experience a mild TBI have an uneventful recovery, some have persistent symptoms such as headache, memory complaints, or affective problems (3, 4). A recent prospective study found 22% of individuals with mild TBI experienced functional problems 12 months after injury (5). However, identifying functional deficits in these individuals can be challenging: traditional neuropsychological testing can be insensitive (6), focal neurological findings may be rare or subtle (4, 7), and structural neuroimaging is often normal (8). Assessment of post-concussive symptoms can be sensitive, but these problems occur in other conditions such as chronic pain (9, 10), affective disorders (11), and post-traumatic stress disorder (PTSD) (12). Some providers may interpret the lack of “objective” findings, independent of patient report, as evidence that the patient's complaints are exaggerated.
In addition, the lack of sensitive, widely accepted, validated assessment tools complicates clinical trials of potential treatments for persistent post-concussive symptoms. Some newer assessments do not have robust, well-established norms, while others, such as advanced neuroimaging (13, 14), have inter-equipment and inter-rater variability that limits the utility of published normative data. There is also very little information about how assessments of healthy volunteers across a wide variety of domains correlate with one another.
Objectives
The U.S. Department of Defense has embarked on a series of trials of hyperbaric oxygen for persistent post-concussive symptoms in military personnel. One of those studies, the Brain Injury and Mechanisms of Action of hyperbaric oxygen for persistent post-concussive symptoms after mild TBI (BIMA) study (www.ClinicalTrials.gov: NCT01611194), incorporated extensive outcome measures, including neuroimaging and auditory/vestibular, autonomic, neurological, visual, and sleep function. As a complement to that effort, we conducted an exploratory observational study of healthy volunteers evaluated periodically over 6 months utilizing the same outcome assessments, facilities, equipment, and study personnel. The objective of this study was to develop a normative dataset that could provide information about the distributional properties, expected variability over time, and sensitivity of specific outcome measures in post-concussive symptoms, specifically to inform results from the mild TBI BIMA population (15, 16). We are unaware of any other prospective comprehensive study of those with sequelae following mild TBI who have been compared to volunteers evaluated this extensively and almost identically.
Materials and Methods
Following institutional review board (IRB) approval from the United States Army Medical Research and Materiel Command IRB (approval number M-10226), volunteers were recruited from the Colorado Springs, Colorado area (elevation 6,000 feet above sea level). Recruitment methods included registration on clinicaltrials.gov (NCT01925963), postings in local establishments or on the internet, radio advertisements, and word of mouth. Interested individuals called a Study Coordinating Center for an initial assessment of eligibility and then were referred to the local site (the Outcomes Assessment Center (OAC), Colorado Springs) for informed consent and in-person assessment.
Eligibility Criteria
Healthy adult men (18–65 years old) and women (18–35 years old, to match women in the military) without a history of brain injury were eligible for study participation. Participants could be active duty, veteran, or civilian but could not have traveled to a combat zone environment. A history of uncomplicated birth and normal development were required. Participants could not have significant medical or psychological history, nor could they endorse any current brain injury symptoms. Individuals taking daily prescription drugs were excluded except for men at least 45 years old taking statins or angiotensin-converting-enzyme (ACE) inhibitors and women using oral or injectable contraceptives. The full eligibility criteria are listed in Table 1.
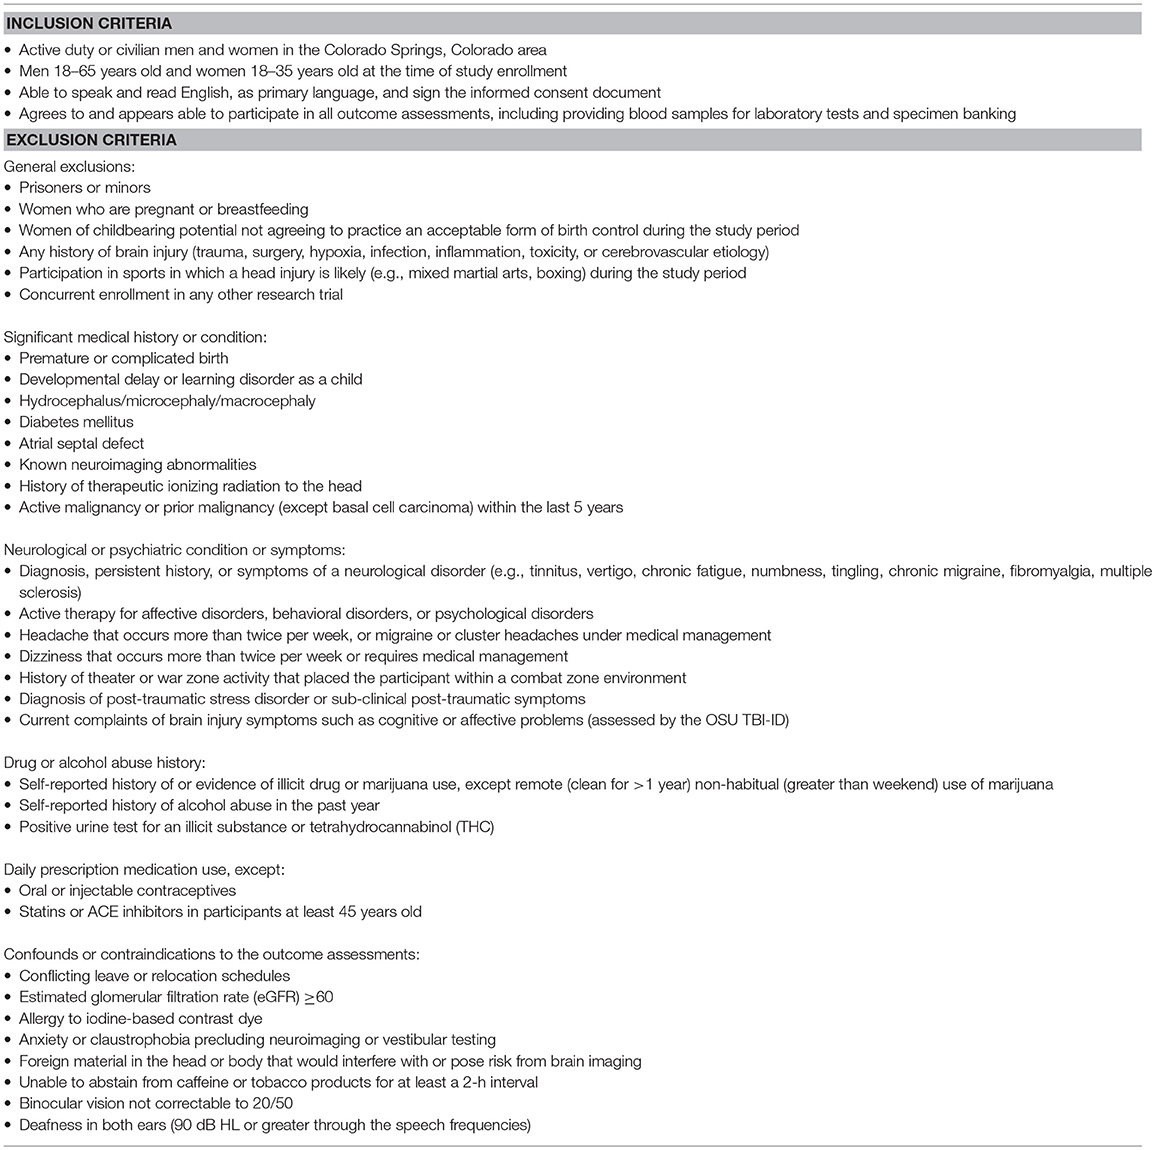
Table 1. Eligibility criteria.
Screening and Enrollment
After obtaining consent, the study team reviewed the participant's self-reported medical history, performed a focused physical examination, and collected a urine specimen to rule out illicit drug use and pregnancy. Traumatic brain injury history was assessed by structured interview (17) and individuals endorsing 1 or more current post-concussive symptoms during this interview were excluded. Potential participants reporting an active mental disorder (receiving current treatment) such as depression, anxiety, and PTSD were excluded. Participants who were asymptomatic at the time of consent but were subsequently found to have underlying pathology were referred for clinical management and, in some cases, withdrawn from the study.
Outcome Assessments
Participants completed a battery of self-report questionnaires, neuroimaging, autonomic monitoring, sleep assessments, neurological function tests, visual, audiology, and vestibular evaluations, and laboratory tests (Table 2).
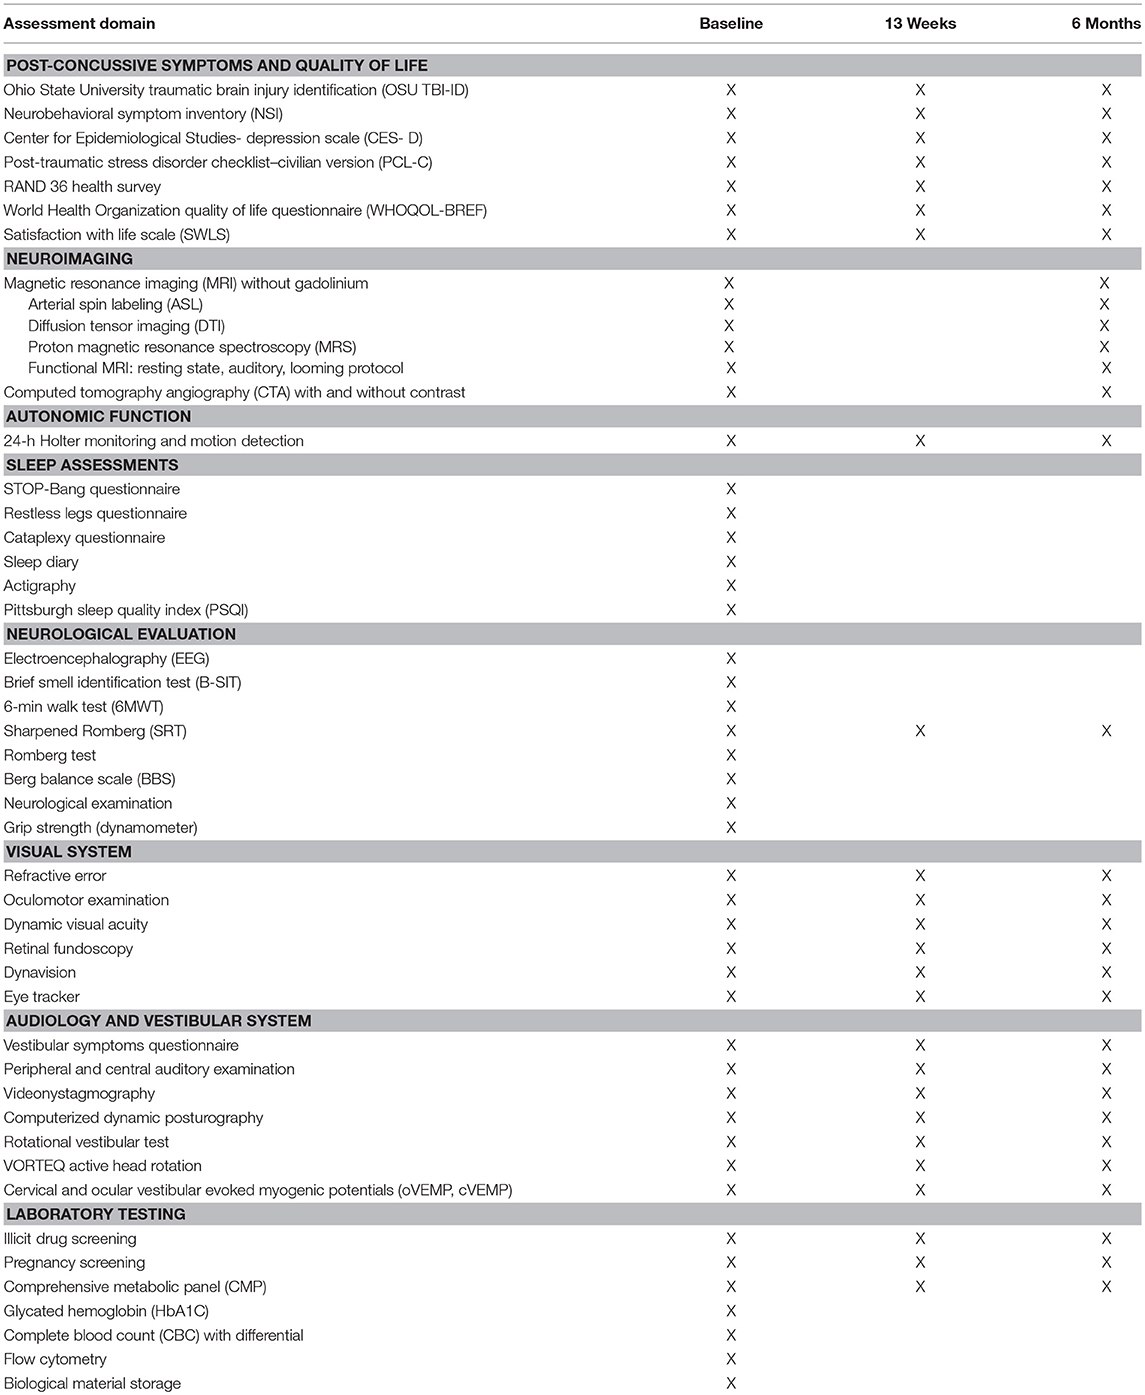
Table 2. Outcome assessments.
Self-report questionnaires assessed post-concussive symptoms, depression (18), PTSD (19), and quality of life (20–22). These were administered in paper-and-pencil format. For 24-h ambulatory electrocardiography (ECG), study staff placed a single-channel (lead II) ECG monitor with triaxial accelerometer (Actiwave Cardio, CamNtech, London) on each participant's chest. Data were segmented into wakefulness, sleep, controlled aerobic exercise, and standing still. Linear analysis of cardiac data (NevroKard v.13.2.2, Slovenia) produced heart rate variability measures, including the time between sequential R-waves (R-R intervals), high frequency (parasympathetic) and low frequency (sympathetic) activity, and long-term segment variability.
A board-certified neurologist performed a detailed neurological examination (guided by checklist) assessing mental status, cranial nerves, motor and deep tendon reflexes, gait, cerebellar function, and sensory domains (23). The neurologist evaluated hand grip strength by dynamometer (24) (Tracker Freedom Wireless Grip, JTECH Medical, Midvale, UT, United States) and balance (25) and performed a detailed oculomotor examination, including near point of convergence and the Romberg and Sharpened Romberg tests (23). For the Sharpened Romberg test (26–28), if the participant could not hold their position or changed foot position independent of upper body movement within 30 s, the test was considered positive. Participants attempted four trials, two trials for each foot forward, and the best of the four trials was the score analyzed.
Trained study staff administered the Brief Smell Identification Test (29) and the 6-min walk test, and a certified electroencephalography (EEG) technician performed a 30-min EEG (Cadwell Easy III, Cadwell, Kennewick, WA, United States). The EEG protocol required participants to refrain from caffeine or tobacco for 30 min before the visit and to sleep as normal the night before. The EEG tasks included background rhythm, eyes closed and open, self-reading, basic math problems, hyperventilation, photic stimulation, and a nap opportunity (30). Two board-certified neurologists/clinical neurophysiologists interpreted and scored each EEG, and a third adjudicated in the event of disagreement. The EEG data was also processed using computer algorithms to precisely quantify absolute and relative signal power and the relationships betweens signals recorded at different electrodes (qEEG).
To assess sleep, participants wore an actigraphy device (GTX3, Actigraphy, Pensacola, FL, United States) and completed a sleep diary for a 2-week interval. Participants also completed a series of questionnaires assessing sleep quality and duration (31), risk for sleep apnea (32), restless legs (33), and cataplexy (34, 35).
Participants completed a vestibular symptoms questionnaire (36), and then an AuD audiologist performed a battery of vestibular-balance assessments (36): dynamic visual acuity and posturography (37), rotational chair testing (38), active head rotation (39), videonystagmography (37), and cervical and ocular vestibular evoked potentials (40). The audiologist also performed audiometry and auditory evoked potentials testing (36, 41).
Refractive error (autorefractor) and ocular torsion (retinal fundoscopy) (42, 43) were measured, as were static and dynamic (23, 44) (EDTRS chart) visual acuity. An EyeLink 1000 (SR Research Ltd., Ottawa, ON, Canada) configured for pupil-corneal tracking recorded the horizontal and vertical positions of each eye at 500 Hz as participants performed a series of visual tracking tasks (moving gaze between two static points, horizontal and vertical step and ramp, memory guided, reading, random pursuit, circular, anti-saccade, and horizontal sine) designed in the SR Research Experiment Builder.
Participants received magnetic resonance imaging (MRI) without gadolinium on a 3.0 Tesla scanner (Philips Medical System) with a 32-channel head coil. Images were acquired by 3 certified technologists at maximum spatial resolution while maintaining good signal quality. Anatomical images included T1-weighted (1.0 × 1.0 × 1.0 mm), T2-weighted, T2 FLAIR, and T2*-weighted sequences. Quantitative data was collected for mathematical and volumetric analysis of structures. Standard diffusion tensor imaging (DTI) analysis using commercially available FDA-approved software (Olea Sphere; Olea Medical SAS, La Ciotat, France) was performed for fractional anisotropy and mean diffusivity values.
Resting state (i.e., without external stimulation), looming, and auditory functional MRI (fMRI) paradigms were delivered to the patient using the ESys system (InVivo Corporation). In the looming paradigm, two types of visual stimuli (human faces with neutral facial expressions and cars) slowly approached or withdrew from the participant (i.e., expanded or contracted in size) for a 16-s interval. Investigators calculated percent signal change vs. offset of global signal for defined regions of interest in the dorsal interparietal sulcus and ventral premotor. Auditory fMRI tasks included responsive naming, semantic decision, text reading vs. non- linguistic symbols, rhyming, silent word generation, simple object naming, passive listening, visual language comprehension, silent verb generation, word listening, rhyming, and noun-verb semantic association. The fMRI data was analyzed for blood oxygen level dependent (BOLD) tissue enhancement, with resulting brain function activity mapped to the patient's anatomical images.
Participants also underwent water-suppressed multi-voxel proton magnetic resonance spectroscopy (MRS) with point resolved spectroscopy (PRESS) localized above the lateral ventricles and within the brain parenchyma (avoiding calvarial contamination) for N-acetylaspartate, creatinine, and choline.
MRI scans were clinically interpreted by 2 independent neuroradiologists. If there was a discrepancy in the interpretation, the two readers discussed to reach a consensus. If consensus could not be reached, the more conservative of the two interpretations (i.e., the interpretation closer to “normal”) was used. If the participant had significant lesions, those scans were more closely evaluated to determine if there were changes in the lesions over time. Readers were blinded to the order in which they reviewed the scans (baseline and month 6).
Brain perfusion was assessed via two modalities, MRI arterial spin labeling and computed tomography angiography (CTA). Whole brain CTA data was acquired using a 320 × 0.5 mm detector row configuration (Aquilion ONE, Toshiba Medical Systems, Tokyo, Japan), and participants received 50 ml iodinated contrast (Isovue 370, Coviedien Pharmaceutical Products, Hazelwood, Missouri) at 4 ml/sec. DICOM data was reconstructed with Vitria fX software (Vital Images, Minnetonka, MN, United States) using a tracer delay invariant single value decomposition plus deconvolution algorithm. The CT images were clinically interpreted by a single neuroradiologist and were additionally analyzed quantitatively using a combination of independent component analyses and machine learning strategies.
Laboratory testing included comprehensive metabolic panel (CMP), complete blood count (CBC) with differential, human chorionic gonadotropin (female participants of childbearing potential), and carboxyhemoglobin. In addition, participants provided blood for flow cytometry to measure CD34+ and total stem cell count. Serum and plasma was banked for genotyping and future studies. A urine sample was collected for drug screening (all participants) and human chorionic gonadotropin (female participants of childbearing potential).
Assessment Schedule
The duration of the assessment battery required that the components be scheduled over several days at each testing interval. Participants underwent the complete assessment battery at baseline, at 13 weeks, and 6 months following study enrollment, with the following exceptions (Figure 1):
• Sleep assessments were conducted only at baseline.
• The EEG and comprehensive neurological examination were performed only at baseline. The Sharpened Romberg test was conducted at all three intervals.
• The MRI and CTA were performed at baseline and 6 months.
• Laboratory testing at 13 weeks and 6 months was limited to CMP and drug and pregnancy screening.
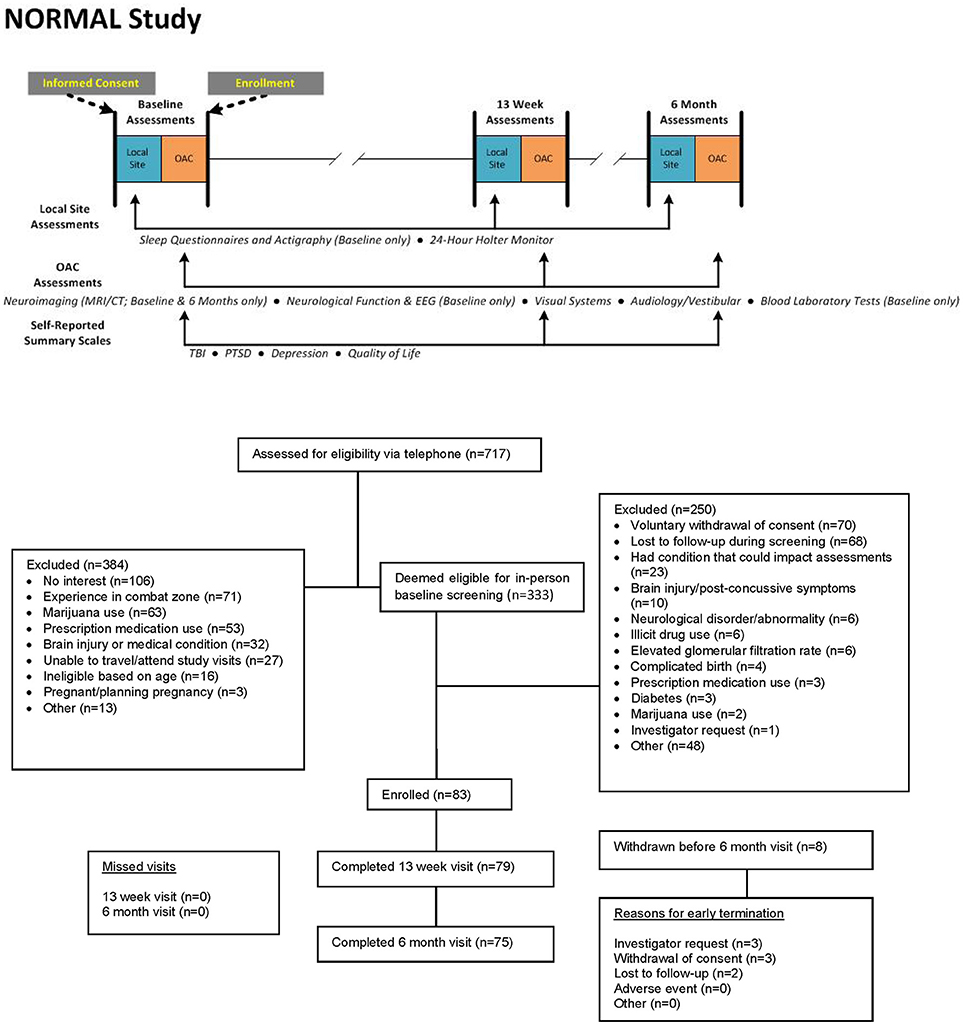
Figure 1. Study design and CONSORT diagram.
The decision to forego some assessments at all three intervals was based upon risk and burden to the participant and allocation of study resources. In addition to the in-person visits, study personnel contacted participants by telephone at 1 and 2 months after enrollment to assess adverse events and maintain communication. Participants were compensated for time and inconvenience as they completed the tests for each interval ($400 for baseline assessments, $600 at 13 weeks, and $800 after completion of the 6-month visit), subject to military and Federal civilian personnel compensation guidelines.
Statistical Considerations
In this study, neuroimaging data was the primary driver for sample size. Literature on power for quantitative neuroimaging outcomes indicated that a sample size of 10–20 participants per group could provide sufficient statistical power (≥80%) to detect medium to large within-group effect sizes in fMRI activation (45–47), and radiology subject matter experts endorsed 10–15 participants per group as sufficient for radiological interpretation. Therefore, based on age and sex, participants were assigned to 1 of 5 subgroups of up to 15 people: men ages 18–35 years, 36–45 years, 46–55 years, and 56–65 years, and women ages 18–35 years (to approximate the age range of most women in the military), with the intent that age and sex subgroups could be combined for analyses if there were no differences between subgroups. The protocol permitted replacement of participants to fill each subgroup.
Statistical methods were determined a priori. The statistical analysis plan was finalized before data lock, which occurred after the last participant's 6-month assessment. The primary analysis population for this study included all participants who enrolled, completed 13-week and 6-months visits, and were not found to violate inclusion/exclusion criteria following enrollment.
The planned analyses were primarily exploratory in nature and performed with the objective of analyzing the underlying distribution of the outcome assessments and evaluating reliability over time. Univariate tests of change from baseline to each follow-up visit were conducted using paired t-tests for continuous outcomes and McNemar's or exact binomial tests for discrete outcomes. For outcomes measured at follow-up visits, linear mixed models and generalized estimating equations were used to model outcomes over time that showed evidence of change from baseline in univariate testing, adjusting for age and gender subgroups as well as other covariates. Hypothesis testing was two-sided, α = 0.05 level unadjusted for multiple comparisons.
Results
From January 2014 to January 2016, 717 potential participants were screened by telephone, and 333 were eligible to be screened in-person. Of these, 83 were successfully screened at the site and enrolled in the study, and 75 were included in the primary analysis population (see CONSORT diagram in Figure 1). Baseline characteristics are presented in Table 3. Median age was 38 years (range 18–65 years), 58 (77%) were male, and 69 (92%) had at least some college education. At the time of study enrollment, one was active duty military, 21 (28%) were veterans, and 53 (71%) were civilians.
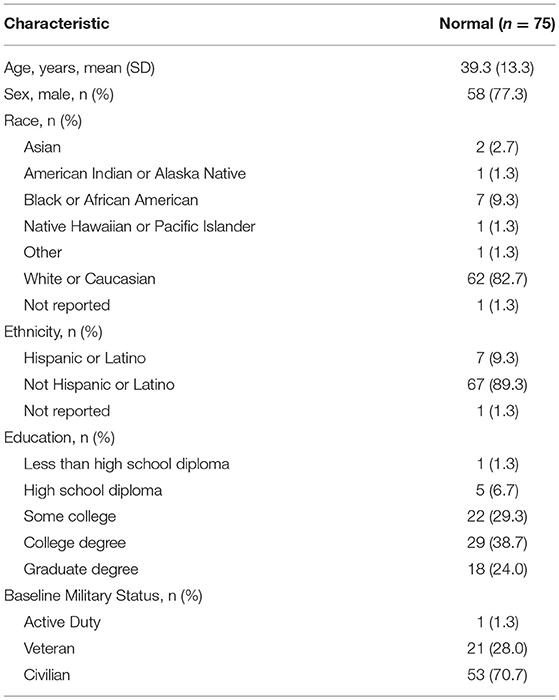
Table 3. Baseline characteristics.
Sixty-three participants (84%) reported taking medications or non-prescribed supplements at the baseline assessment interval (median 3, range 1–11); half of the reported drugs were nutritional supplements. Eight women were using oral/continuous contraceptives, and one man used tamsulosin hydrochloride for benign enlarged prostate. Thirty-eight participants reported as-needed use of over-the-counter pain medications, 14 used daily or as-needed decongestants/antihistamines for allergies or upper respiratory illness, 7 used drugs for gastroesophogeal reflux, 3 used daily asthma drugs, and 3 were taking antibiotics or antivirals. Eight participants took aspirin daily for cardiac prophylaxis, 6 took statins, and 4 (all >55 years) used anti-hypertensives.
At baseline, participants did not endorse post-concussive symptoms or symptoms of PTSD or depression (Table 4). Quality of life and life satisfaction scores were at or above average (Table 4). Group mean scores showed little change at 13 weeks and 6 months, though individual participants had some variability as evidenced by wide minimum and maximum change scores (Table 4). Longitudinal models indicated no significant overall effects by time in these outcomes with the exception of WHOQOL-BREF psychological health scores (p = 0.04), where a decrease in scores (improvement) was observed over time. Post-hoc tests from longitudinal models indicated an estimated mean difference between 6 months and baseline of −2.23 [95% CI (−3.96, −0.50)].
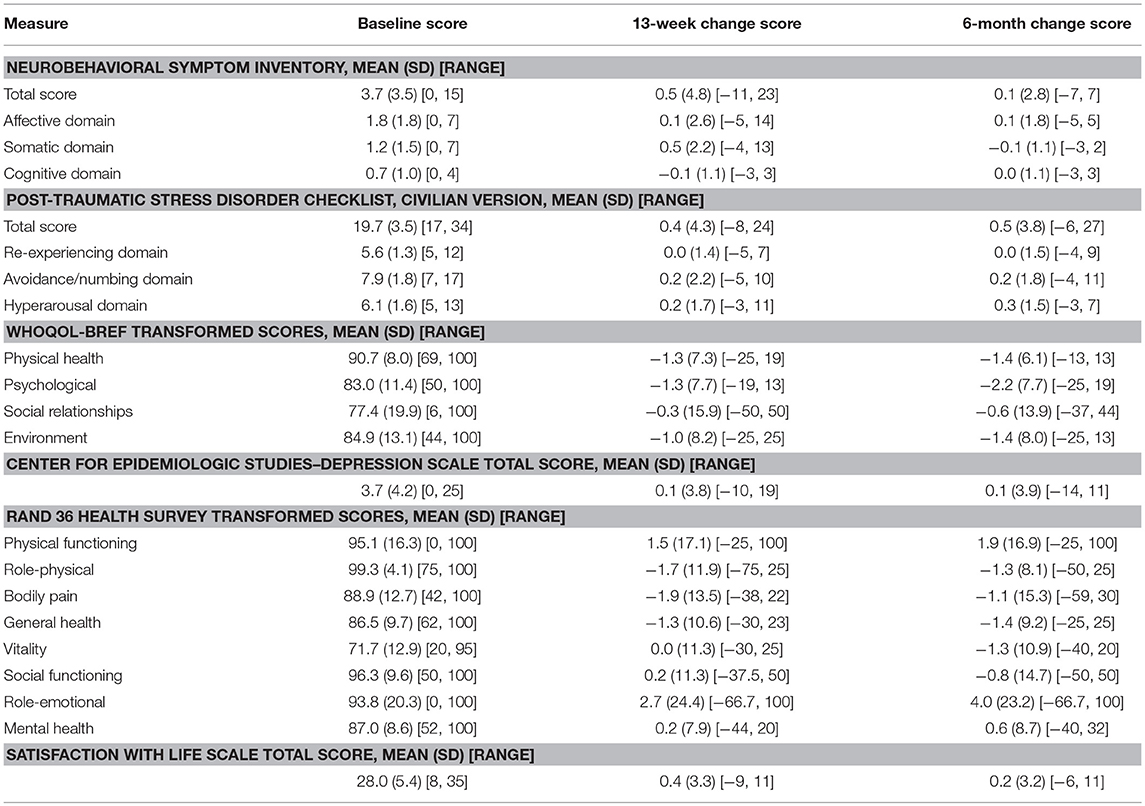
Table 4. Standardized symptom and quality of life questionnaire results.
The neurological examination found infrequent abnormalities: alertness (2 participants), rigidity (1), abnormal jaw reflex (1), heel-to-shin testing (1), and tandem gait (1). All other mental status, cranial nerve, motor, reflex, sensory, and cerebellar testing elements of the neurological examination were normal. All participants had a normal Romberg test, but 16 (21%) could not perform the Sharpened Romberg test to 30 s [compared to expected performance rate of 95% in normal volunteers (28)]. At 13 weeks, 58 (81%) had no change in Sharpened Romberg, 8 (11%) with abnormal Sharpened Romberg at baseline were successful at this interval, and 6 (8%) who could perform this test at baseline could no longer do so. Similar variability was observed at 6 months: 8 previously abnormal participants were successful at 6 months, while 5 who had performed it previously were unsuccessful at this interval.
Thirty-seven of 74 (50%) had near point of convergence >12.7 cm at baseline (48), and this rate in those above 45 years old was 75%. None were rated “impaired” by the Berg Balance Scale. The median number of odors correctly identified on the Brief Smell Identification Test was 11 of 12 (range 6–12). Two participants had abnormal olfactory function relative to age. The median grip strength (both hands) was 66.7 lbs (range 20–112 lbs), and 21 participants had lower-than-expected agerage sustained grip strength (<35 lbs (16 kg) for women and <64 lbs (29 kg) for men). The median distance traveled during the 6-min walk test was 1,816 feet (range 1,226–2,644 feet); only 1 participant walked fewer than 1,312 feet (400 m). Six participants (8%) had generalized slowing on the clinical EEG, but no other EEG abnormalities were noted.
By STOP-Bang questionnaire, one participant was at high risk for obstructive sleep apnea, 13 (17%) were at intermediate risk, and 61 (81%) at low risk. Two participants were symptomatic for restless legs, and no participant reported symptoms of cataplexy. Twenty-one (28%) scored at least 5 on the Pittsburgh Sleep Quality Index global score, indicating poor sleep quality. Median total estimated sleep time was 438 min by sleep diary (99% sleep maintenance efficiency) and 417 min by actigraphy (92% sleep maintenance efficiency). Full sleep results are reported in Table 5.
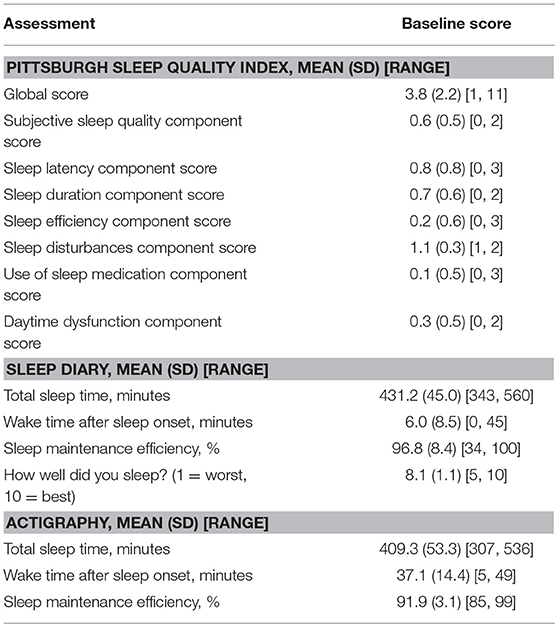
Table 5. Sleep evaluation results.
Changes over time, especially at month 6, were identified in several heart rate variability (HRV) outcomes (Table 6), and this finding was particularly evident in analysis of the 24-h segment. In longitudinal models of the 24-h segment (49), significant time effects were identified in log-transformed root square mean of the successive differences (RMSSD) (p = 0.01), high frequency (HF) power (p = 0.01), log-transformed LF/HF (p = 0.01), log-transformed SD1 (p = 0.01) and log-transformed SD1/SD2 (p = 0.02).
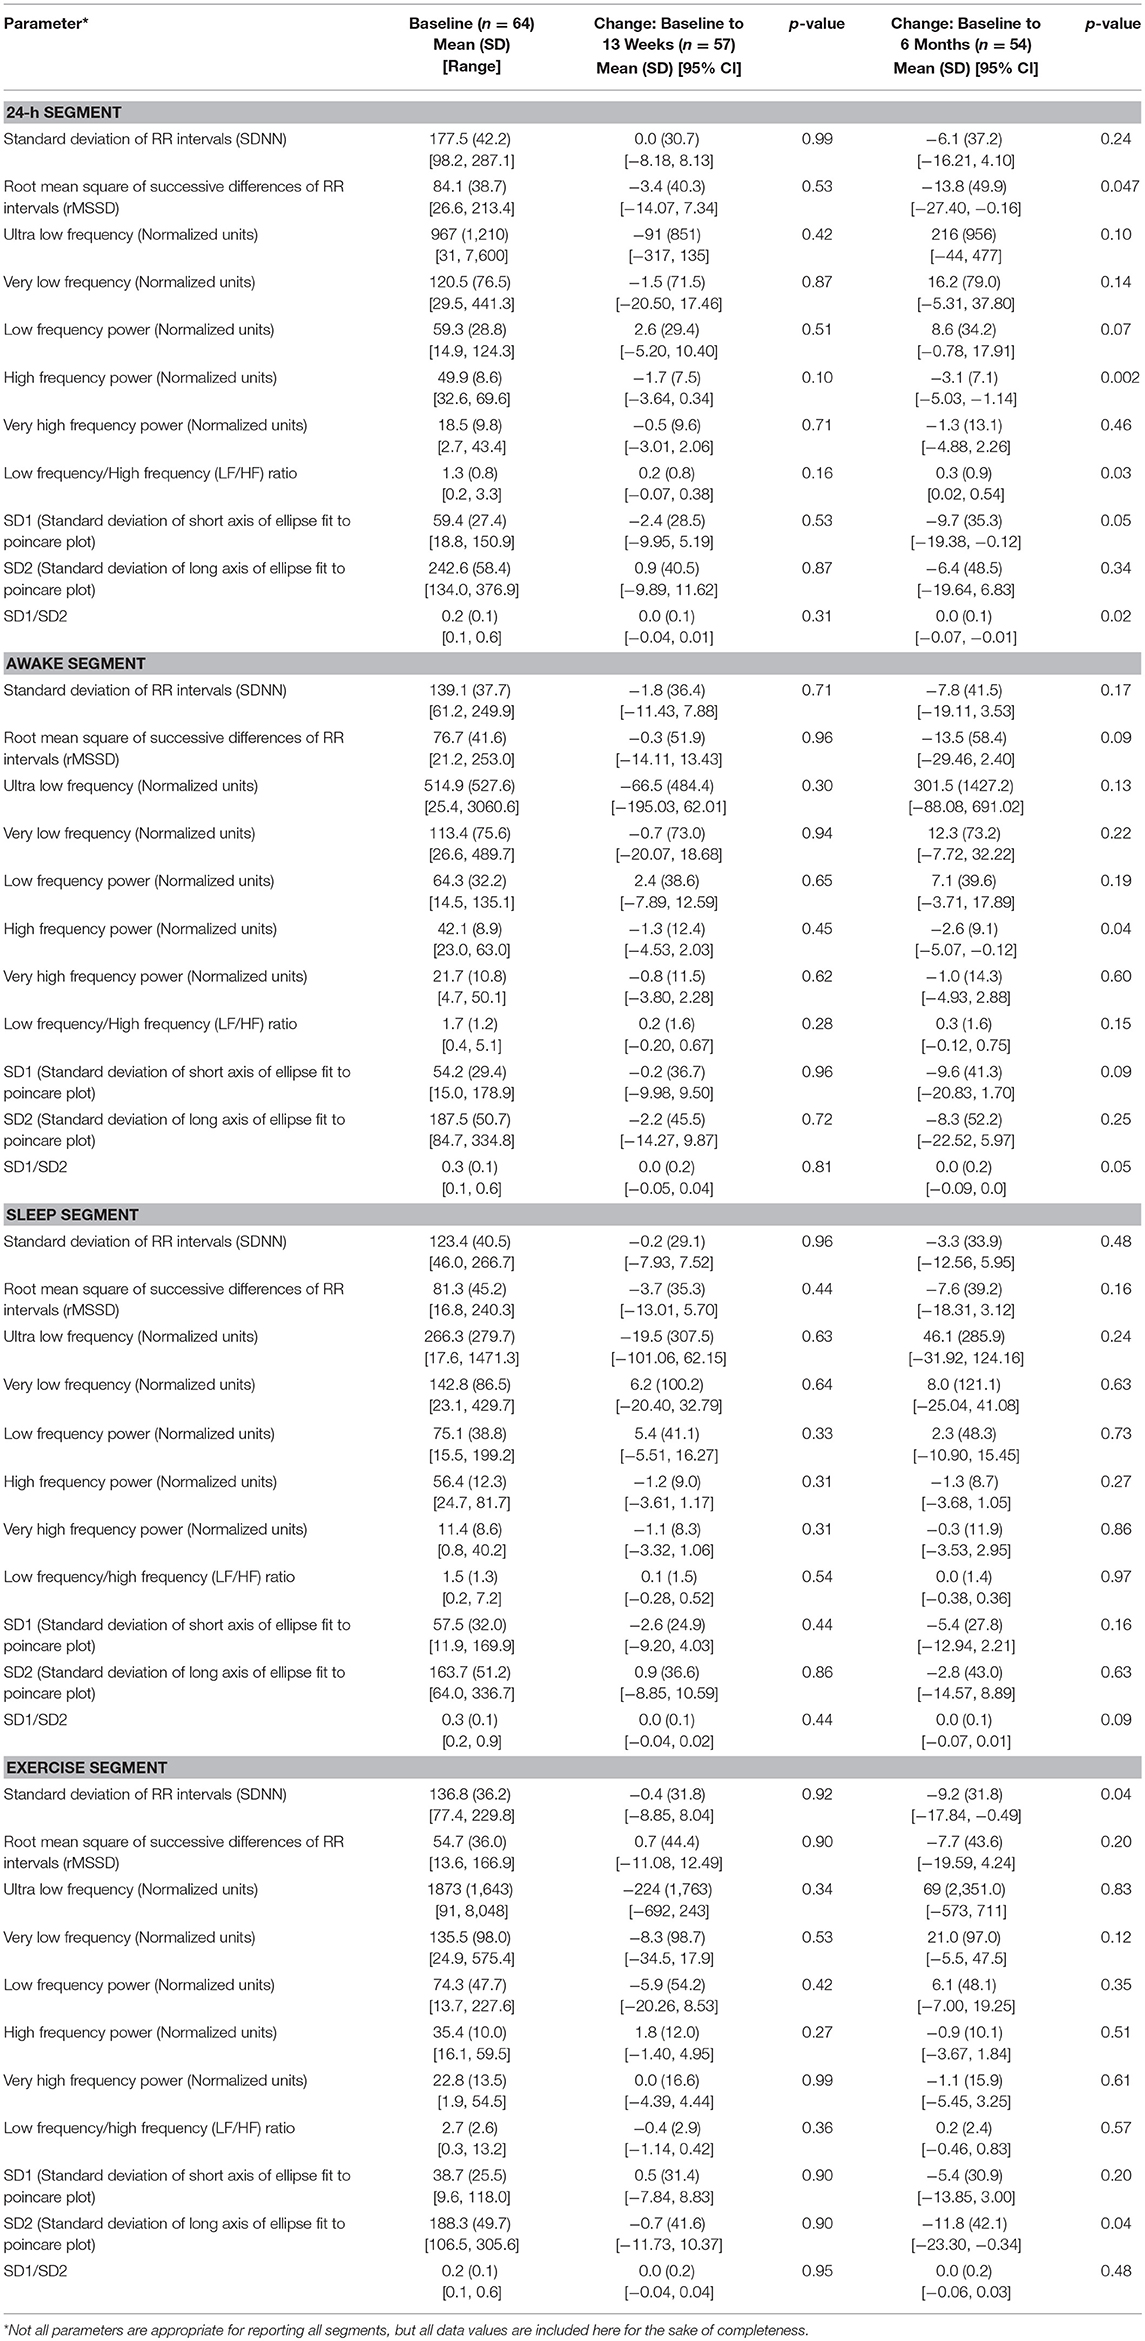
Table 6. Heart rate variability measures at baseline and change across time.
No significant overall time effects were identified for HRV outcomes in the sleep segment, suggesting greater stability of outcomes during this period of the ECG recording. Although some differences in HRV outcomes were expected at baseline between age and gender groups, differences between the subgroups in changes over a 6 month time period were not necessarily expected. Differences in changes over time between age and gender groups were observed in outcomes in several segments, most notably the 24-h segment. Results of longitudinal models indicated that no significant overall age and gender-by-time interactions were observed in outcomes from the sleep segment, suggesting that HRV outcomes measured during sleep may be the least susceptible to noise and best for future studies.
In the visual system evaluation (Table 6), no participant experienced a myopic change >1 spherical equivalent as measured by autorefractor over the course of the study. With both eyes open, all participants had normal dynamic visual acuity (by EDTRS chart) at baseline, but 1 participant was abnormal at 13 weeks and 6 months. Forty-one of 72 participants (57%) had a fundus angle >7°, and 21 (29%) had a significant change in fundus angle (normal to abnormal, or abnormal to normal) at 13 weeks compared to baseline. All participants performed within the normal range on the Dynavision reaction time, self-paced, and forced attention tests. Changes in visual, motor, and physical reaction time were not significant over time, but participants were able to perform significantly more self-paced and forced attention hits at 13 weeks and 6 months.
By eye tracker, participants were most likely to have abnormalities on the circular, horizontal ramp, and reading tasks (Table 7). Forty participants (53%) had normal performance on all 3 tasks at all 3 timepoints. Another 16 participants (21%) were abnormal on just 1 task at any timepoint. Thirteen participants had 2 or 3 abnormal scores, and 6 participants had 4 or more abnormal scores.
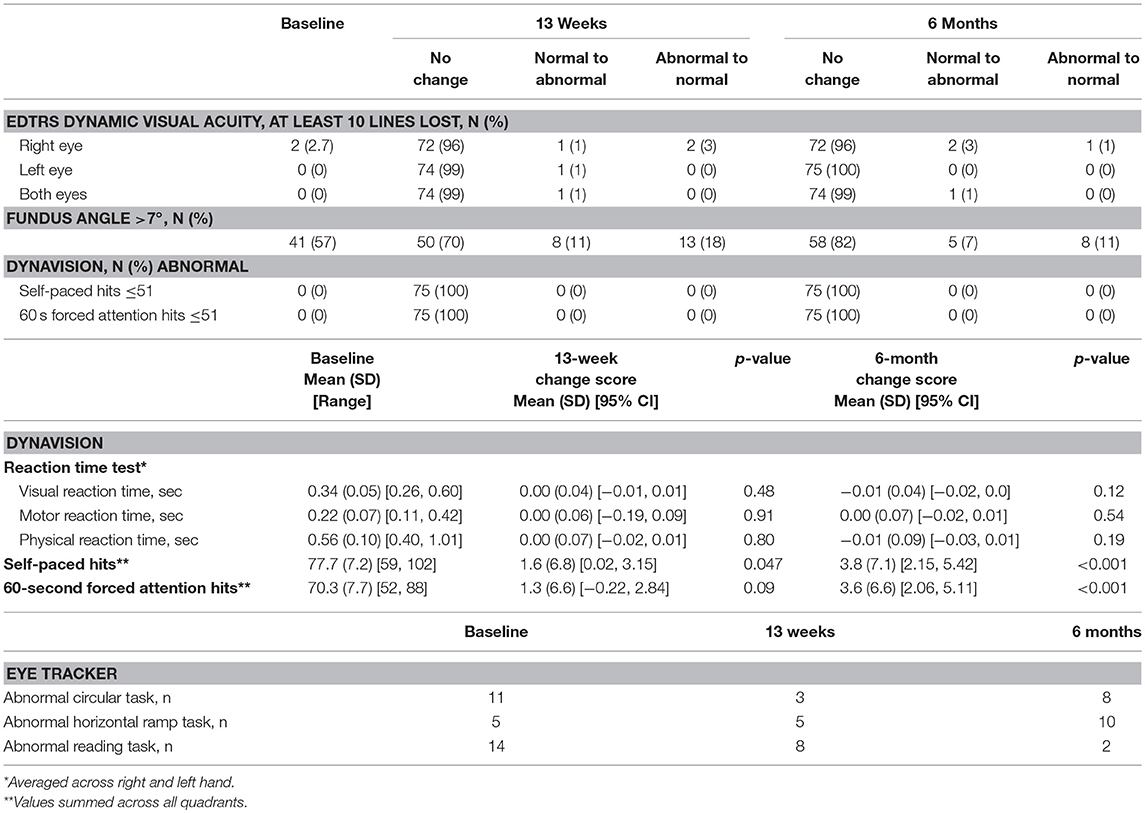
Table 7. Visual system evaluation results.
Clinical interpretation of vestibular and audiology test results are presented in Table 8. During administration of the Vestibular Symptoms Questionnaire at baseline, 12 participants (16%) reported some hearing loss and 11 (15%) reported tinnitus. Ten (13%) reported provocation of vestibular symptoms during motion activities in the direct vestibular assessment. Baseline videonystagmography was normal for most participants. Four (5%) had abnormal head thrust and head shake, and 22 (30%) had an abnormal response to monothermal, warm air caloric testing. On computerized dynamic posturography, sensory organization testing was normal; however, during the dynamic visual acuity component, 10–21% of participants had abnormal test results, depending on the parameter measured. During the rotational vestibular test, no participant had nystagmus and 4 (5%) had square wave jerks. Abnormal vertical saccades were more common than horizontal and most frequently seen in the velocity domain. Ten participants (13%) were unable to even partially complete the VORTEQ head velocity test under the 4 kHz horizontal test condition, and 1 failed the 3 kHz vertical test. Ocular VEMPs were absent in 32 participants (43%) at baseline. While this finding is difficult to interpret in isolation, participants reported that ocular VEMPs were fatiguing, and some failed to maintain an upward gaze, which resulted in invalid testing.
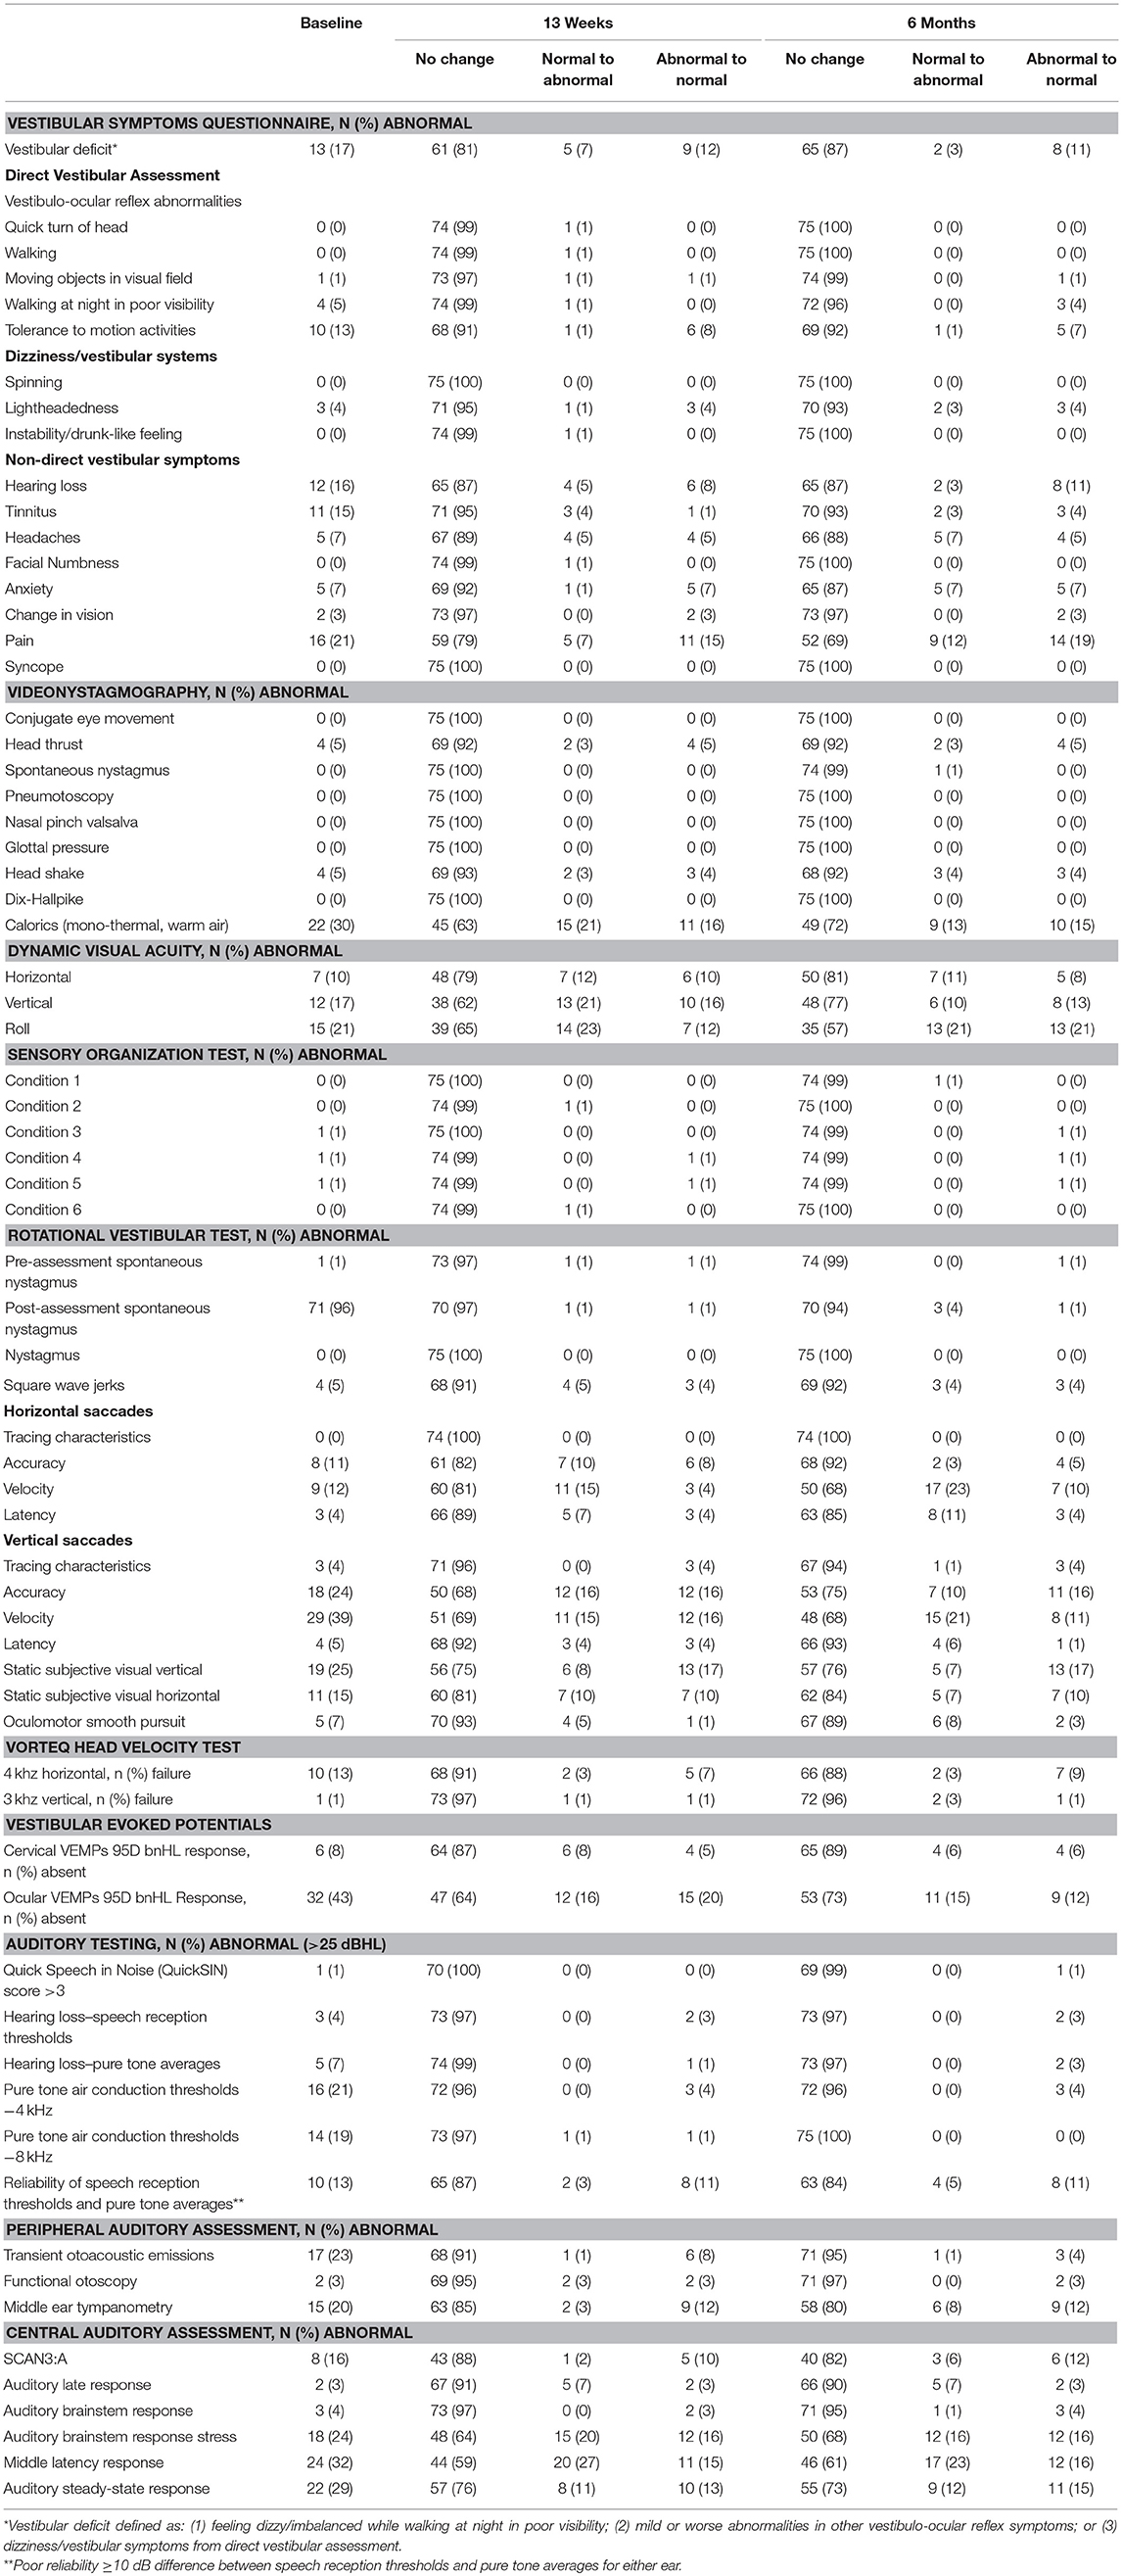
Table 8. Vestibular and audiology system results.
On auditory testing, few participants had hearing loss defined as >25 dbHL (3 by speech reception thresholds and 5 by pure tone averages). Reliability of speech reception thresholds and pure tone averages was 87% (<10 dB difference between the two measurements). Twenty to 30% had abnormal features of their peripheral and central auditory assessments. Most vestibular and audiology measures were stable over time. Although at least 20% of participants had significant interval-to-interval changes in pain reporting, dynamic visual acuity performance, some horizontal and vertical saccades domains, subjective visual vertical, ocular VEMPs, and some central auditory measures, longitudinal models indicated no significant overall time effects in these assessments.
Neuroimaging abnormalities were surprisingly common in this population that was carefully selected to be healthy, without prior brain injury. The clinical MRI interpretation was positive at baseline in 45 participants (61%) for non-specific white matter changes (e.g., T2 white matter hyperintensities). Other common findings were diffusion tensor imaging (44, 60%), cavum septum (32, 46%), dilated perivascular spaces (34, 47%), and pineal cysts (31, 44%). Based on overall clinical impression of the individual scans, only 34 participants (45%) had no white matter lesions, while 22 were identified by the neuroradiologists as having a lesion burden (based on number and size of lesions) greater than expected for age. The remaining 19 participants had white matter lesions but the number and size may be within the expected range for age (50, 51). When comparing baseline and 6-month scans individually, the apparent lesion burden increased in 19 (26%) and decreased in 5 (7%) (p = 0.07), but when these scans were compared side-by-side, the neuroradiologists found 96% of participants had no significant changes in their MRI, and the observable changes were in mastoid fluid and sinus disease, which were common at baseline in this population (38, 54%).
With regard to quantitative analysis (by FreeSurfer and Neuroquant), significant increases from baseline to month 6 were observed in several regions of interest, primarily in white matter volumes (data not shown). However, some statistically significant changes were expected given the large number of regions measured. Although some baseline differences were observed between age and gender groups in FreeSurfer outcomes, no significant age-by-time or gender-by-time interactions were observed, suggesting stability over time across subgroups.
On diffusion tensor imaging, the mean axial diffusivity across the corpus callosum was 1.58 ± 0.06 (range 1.38–1.71) and the radial diffusivity was 0.51 ± 0.03 (range 0.43–0.58) at baseline. No clinically significant changes were observed over time. Two participants had both fractional anisotropy and radial diffusivity measures that were >2 standard deviations outside the mean.
Relative metabolite ratios for MR spectroscopy are listed in Table 9. Auditory and resting state fMRI data will be presented elsewhere. On the looming measure, the study population as a whole had significantly decreased responses from baseline to month 6 to face stimuli, specifically in the right hemispheres of the dorsal interparietal sulcus and ventral premotor areas.
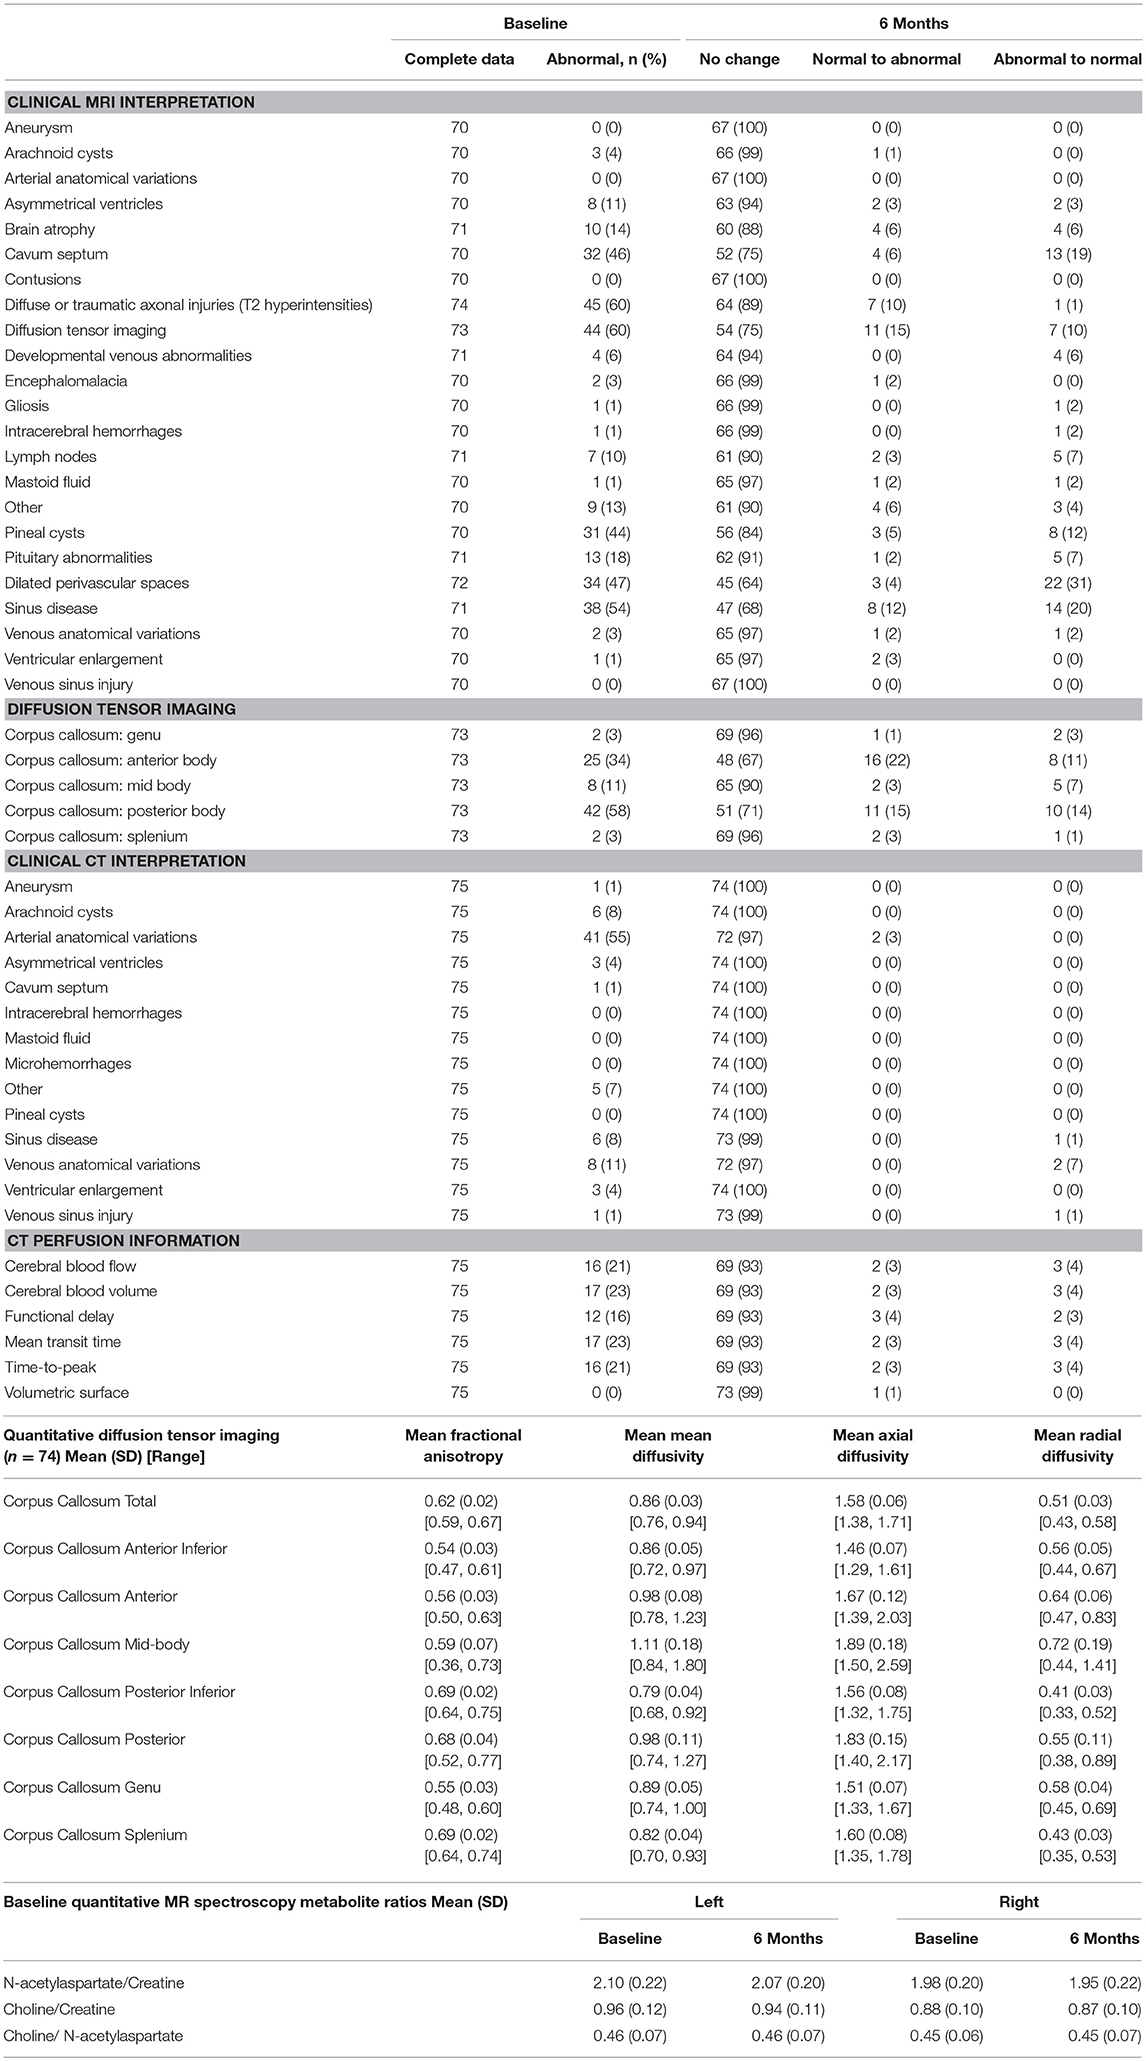
Table 9. Neuroimaging findings.
Images acquired via arterial spin labeling were of poor quality and contained no useable information about brain perfusion. Clinical interpretation of CTA was more sensitive than that of MRI in identifying vascular anatomical variations (Table 9), but less sensitive in identification of other structural abnormalities. While the volumetric surfaces were normal, other perfusion measures were abnormal in 16–23% of participants. Perfusion tended to be stable over time (Table 9).
All participants had CD34+ and total stem cell counts within the normal range (mean 0.04 ± 0.01% and 2.1 ± 1.0 cells/uL, respectively).
Population Distribution of Abnormalities
Figure 2 presents a participant-level distribution of the abnormalities found in this normal population. Generally, for the measures presented (selected to represent various functional domains), abnormalities were widely distributed across the population. A handful of participants were strikingly abnormal on many measures. Of interest, many domains expected to overlap did not. For example, there was no overlap between abnormal qEEG and clinical EEG interpretation. Similarly, abnormal eye tracking did not correlate with overall findings in the vestibular domain or with near point of convergence. Abnormal MRI did not appear to be associated with abnormal findings on other measures. Even participants with strikingly abnormal brain MRI had few or no clinical findings. When those with abnormal MRI, based on white matter lesion burden (50) or overall MRI impression, were compared to the rest of the group, they were not significantly more likely to express clinical abnormality (Table 10).
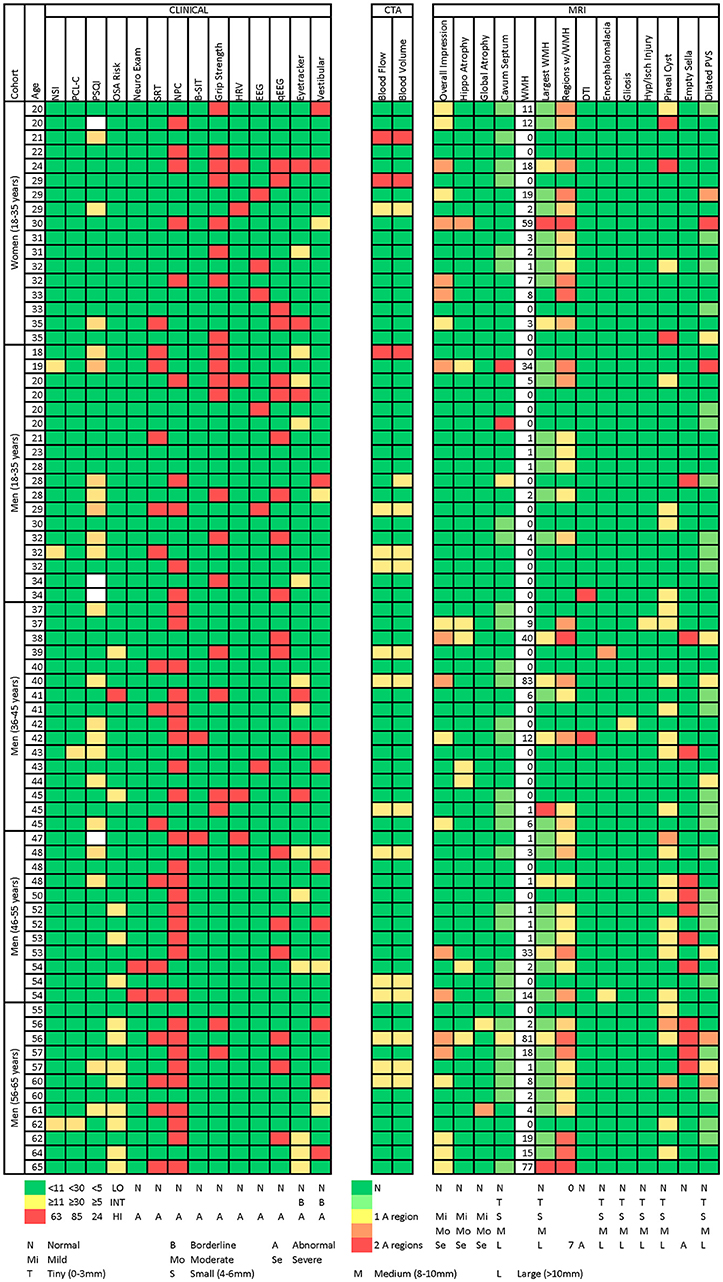
Figure 2. Heatmap of abnormalities over selected measures for age and gender subgroups. The following methods were used to generate this figure:
1. Neurobehavioral Symptom Inventory (NSI) total score: green if ≤10, yellow to red from 11 to 63 (maximum possible score).
2. PTSD Checklist–Civilian Version (PCL-C) total score: green if ≤29, yellow to red from 30 to 85 (maximum possible score).
3. Pittsburgh Sleep Quality Index (Sleep) total score: green if ≤4, yellow to red from 5 to 24 (maximum possible score).
4. Neurological Examination: green if normal, red if abnormal (findings present on exam).
5. Sharpened Romberg Test (SRT): green if normal, red if abnormal (unable to perform to 30 seconds on any of 4 attempts).
6. Near Point of Convergence: green if ≤12.7 cm, red if >12.7 cm.
7. Brief Smell Identification Test (B-SIT): green if normal for age, red if abnormal for age.
8. Sustained Grip Strength: green if within 2SD of mean for age (70).
9. Heart Rate Variability (HRV): identified by subject matter expert as having abnormal HRV measures on 24-h Holter monitoring.
10. Electroencephalography (EEG): green if normal, red if abnormal. All abnormalities identified by clinical EEG testing in this population were generalized slowing.
11. Quantitative Electroencephalography (qEEG): green if normal, red if abnormal.
12. Eye Tracking: green if normal, yellow if abnormal performance on circular, horizontal ramp, or reading tasks 2 or 3 times over 3 testing intervals, red if abnormal 4 or more times over 3 testing intervals.
13. Vestibular: green if normal, yellow if identified by subject matter expert as having findings warranting clinical concern and further evaluation, red if identified by subject matter expert as having clinically abnormal vestibular testing.
14. Computed Tomography Angiography (CTA): cerebral blood flow and cerebral blood volume green if normal. Yellow if abnormal blood flow in 1 of 16 brain regions, red if abnormal in 2 regions (maximum observed). All abnormalities were were focal non-uniformities representing decreased arterial flow and volume. Regions were right and left frontal, parietal, temporal, occipital, basal ganglia, cerebellum, pons, and brain stem.
15. Overall MRI Impression: based on white matter lesion burden (clinical interpretation based on lesion count and size). Green if no lesions or lesions consistent with normal aging. Yellow if lesion burden greater than expected for age but unlikely to be seen at routine imaging. Orange if lesion burden greater than expected for age and likely to be seen at routine imaging. Red if severe/significant lesion burden.
16. Hippocampal and global atrophy: graded as normal (green), mild (yellow), moderate (orange), severe (red).
17. Cavum Septum, Size of Largest White Matter Hyperintensity, Encephalomalacia, Gliosis, Hypoxia/Ischemic Injury, Pineal Cyst, and Dilated Perivascular Spaces: graded as normal (green), tiny (0–3 mm) (yellow-green), small (4–6 mm) (yellow), medium (8–10 mm), large (>10 mm) (red).
18. Number of white matter hyperintensities.
19. Number of Regions with White Matter Hyperintensities: green if normal, red if abnormal in 7 of 19 regions (maximum observed). Regions were right and left frontal, parietal, temporal, occipital, cerebellum, corpus collosum genu, body, and splenium, midbrain, pons, and medulla.
20. Diffusion Tensor Imaging (DTI): green if normal, red if abnormal (fractional anisotropy and radial diffusivity >2 standard deviations outside the mean).
21. Empty Sella: green if normal, red if abnormal.
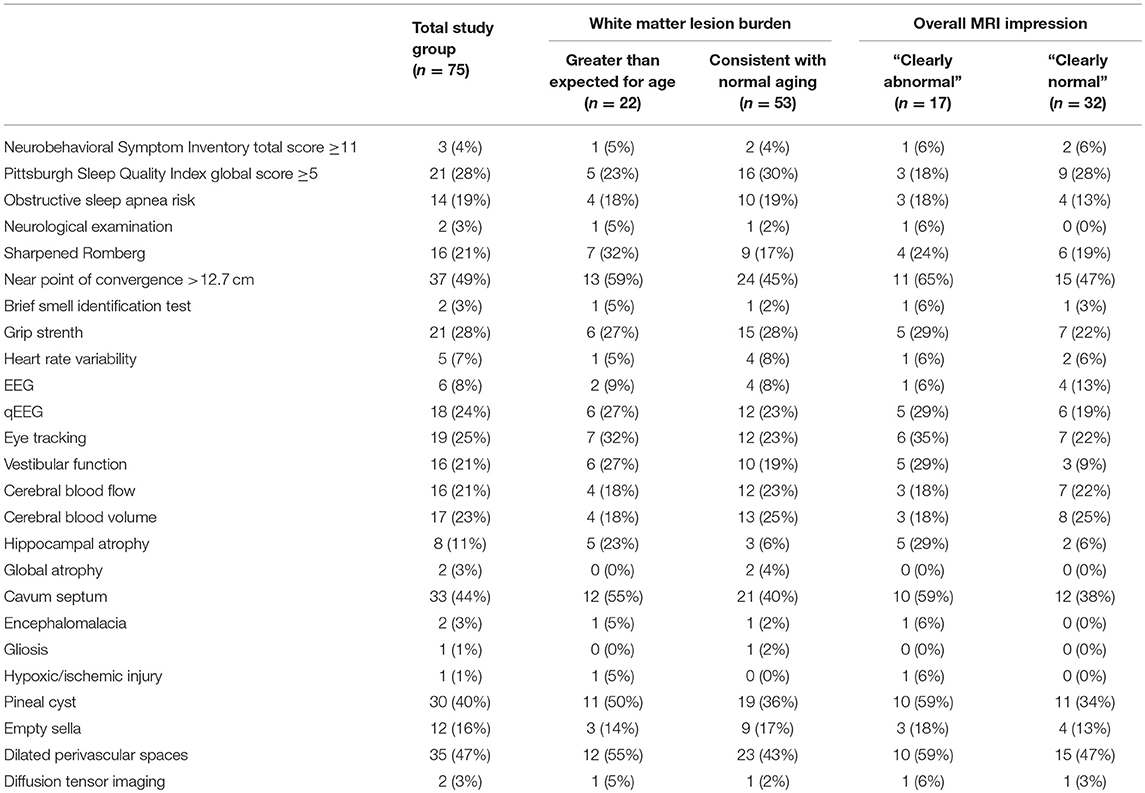
Table 10. Number and percent of participants with abnormalities by white matter lesion burden and overall MRI impression.
Results of Subgroup Analyses
By subgroup analysis, age and gender did have an effect over some measures (Table 11). For example, gender had an effect on standardized questionnaires at baseline (worse in men), but age did not. Men had better neurological function but worse sleep outcomes and quantitative neuroimaging, while older age was correlated with worse vestibular performance, sleep, and neuroimaging. Age and gender had less effect on changes over time, and age and gender were not associated with white matter hyperintensity burden (Figure 3).
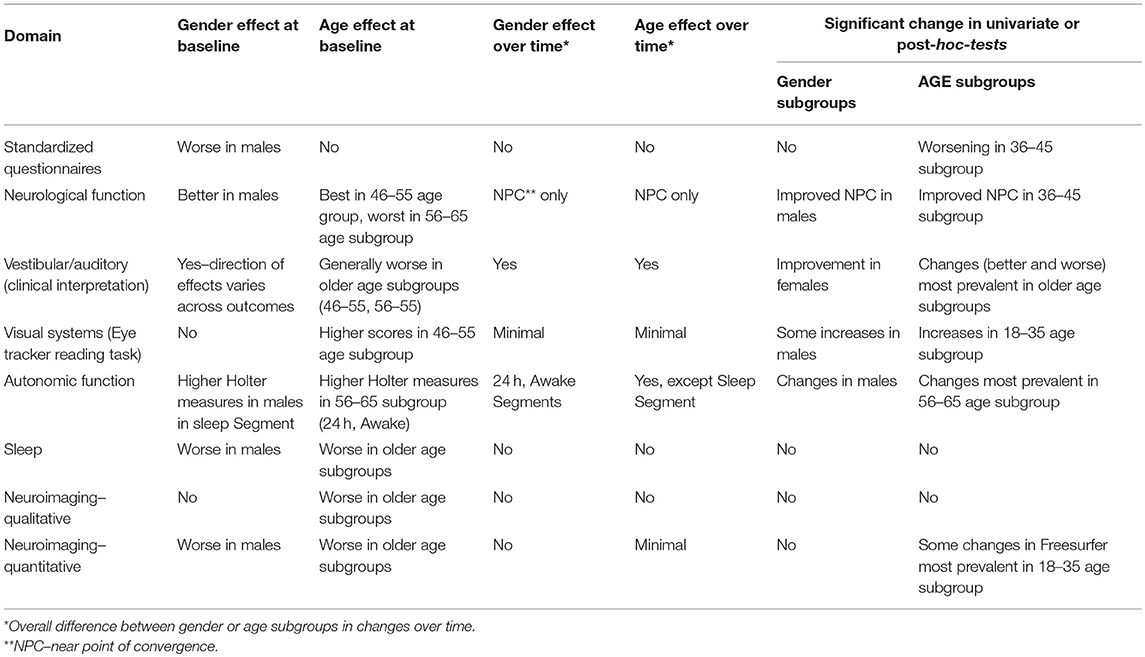
Table 11. Age and gender subgroup analyses in selected domains.
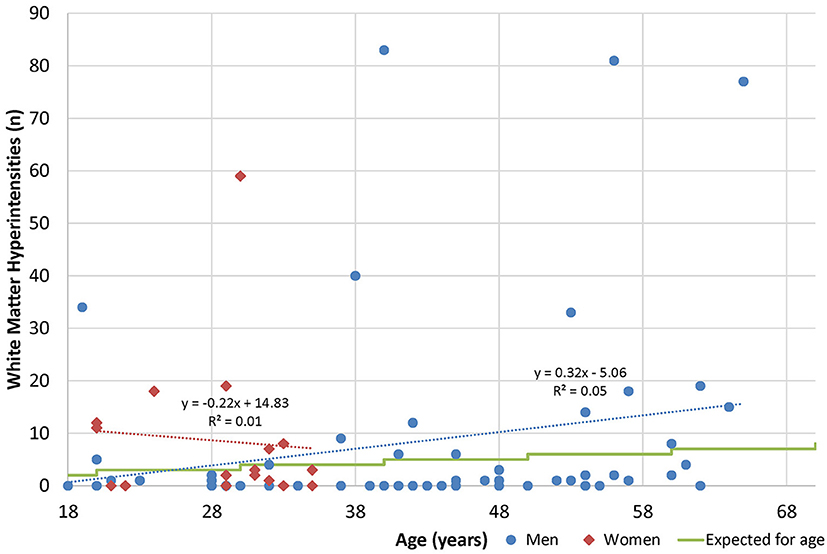
Figure 3. Age and white matter hyperintensities. Radiologists are commonly taught that one lesion per decade of life is considered normal (50).
Safety
Because this was a non-interventional study, the definition of adverse events was limited to only those deemed to be related to study procedures (assessments). No participant experienced a serious adverse event during the study. Generally, the assessment battery was well-tolerated, including the 2.5-h-long MRI. Nearly half of adverse events were associated with the rigorous vestibular battery: 8 participants had nausea and/or vomiting, 3 reported dizziness, 2 had onset of headache, and 1 participant each experienced neck pain, fatigue, anxiety, and ear canal abrasion. Nine participants had skin irritation associated with Holter lead placement, and 5 experienced dizziness, vomiting, or hypotension in conjunction with the exercise segment of Holter monitoring. Three participants reported anxiety and 1 (age 29 years) reported vertigo with MRI. Three participants experienced a complication of IV placement for the CT scan (2 hematoma, 1 extravasation), and 1 developed a rash after contrast administration.
Discussion
To our knowledge, this exploratory, observational study is the first to comprehensively evaluate normal, healthy volunteers across a variety of functional domains with a focus on measures of brain injury. Some measures used in this study, such as eye tracking, do not have sufficient published normative data available. Many measures used in this study have been tested in healthy populations (Table 12), but they have not necessarily been evaluated for stability over time, and very few have been correlated with measures in other functional domains. This study represents a unique effort to describe how a healthy population recruited from the community might perform on a wide variety of functional measures, and from that data, to better understand the “normal” brain. It also provides valuable information about changes over time in many of these measures.
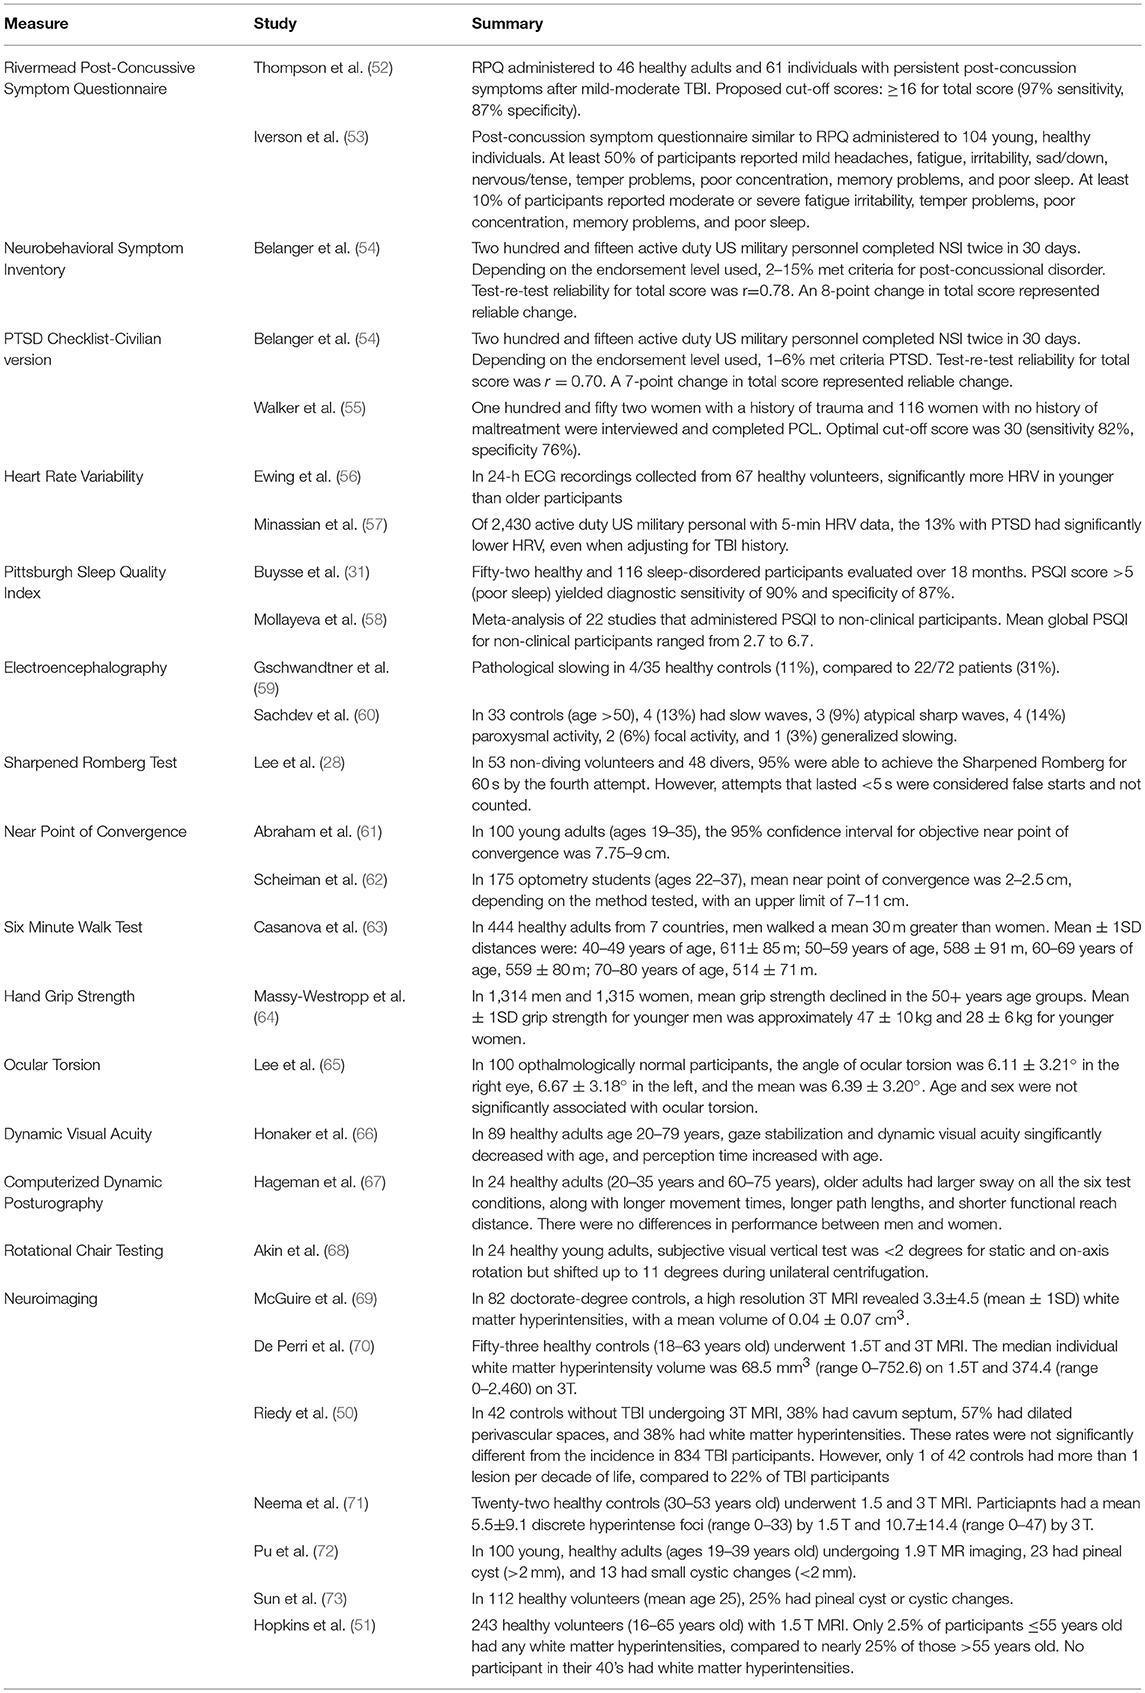
Table 12. Sample of normal studies.
Contrary to what one might expect, we found abnormalities dispersed across the study population (Figure 2). The number of abnormalities may be a function of the large number of tests that these participants underwent, in that had they undertaken fewer tests, there would likely be fewer findings. This suggests that some number of healthy individuals may be expected to have abnormal performance on any given measure at any time.
Direct comparisons of results between other “normal” studies is challenging. Often, normative values are collected for the purpose of comparison to patients with a specific disease or condition, and “healthy” or “normal” are defined as the lack of that disease or condition. Because these participants were intended to be compared to military personnel with mild TBI, we focused on screening out brain injury and conditions that might manifest similar to mild TBI. Other studies that have collected normative data may have enrolled participants who differ in significant ways from participants in this study. In addition, differences in equipment, personnel, and administration and scoring methodology can confound attempts to directly compare normative values from one study to another.
A handful of participants in this study appeared to have clusters of abnormalities and may have underlying brain dysfunction, possibly due to prior brain trauma, though we did not establish a threshold for determining what might represent brain injury beyond screening for TBI and other brain injuries using validated instruments. The study had strict enrollment criteria, and any history of brain insult was an absolute exclusion for participation. Participants underwent multiple layers of screening before they were assessed, yet, based on outcome data, it appears that a few participants with possible brain injury joined the study. These individuals may truly have no history of brain injury, they may have had no recollection of prior brain injury, or they may have been disingenuous during screening procedures in order to be compensated for participation. Nevertheless, these participants likely comprise a small minority of the study group and do not account for the abnormalities that are distributed across many study participants.
It is possible that our enrollment criteria were insufficiently strict to exclude all individuals with brain dysfunction. In designing this study, we considered requiring all participants to have a normal screening brain MRI. However, we felt this requirement would select “supernormal” individuals that would not represent a true normal population. Had we required a normal screening MRI, nearly 60% of our study group would have been excluded. However, this requirement would not have necessarily reduced the frequency of abnormalities in other domains (Table 10).
When comparing our enrollment criteria to studies recruiting normal volunteers, particularly for brain imaging, our criteria were more stringent. For example, one component of the Human Connectome project recruiting healthy volunteers allows individuals with up to 2 lifetime mild TBIs or a history of substance abuse (without severe symptoms) to participate (74). Another component of this project (NCT02193425) recruiting healthy volunteers allows head trauma with loss of consciousness up to 30 min, and volunteers with positive urine drug screens are invited to return for scanning after a few days. Whether these methods can more reliably enroll individuals with “normal” neuroimaging is unknown.
Despite the number of individual abnormalities discovered, this study's participants, as a group, differentiated from the group of individuals with mild TBI who underwent the same evaluations. For example, abnormal facial sensation, tandem gait, tremor, and Sharpened Romberg were more common in the mild TBI group, as were generalized and localized slowing on EEG. Similarly, group mean data for HRV parameters (16), sleep measurements (75), and eye tracking measures (76) were significantly different between the two groups.
The number and degree of abnormalities noted on neuroimaging in this study was unexpected. In our study, participants were scanned on a 32-coil 3.0 Tesla MRI with 1 mm sections, and this high resolution may have allowed more neuroimaging abnormalities to be identified. White matter hyperintensities are a non-specific finding associated with trauma (77), carbon monoxide poisoning (78), hypoxia (79), microvascular disease [as in diabetes mellitus (80)], illicit drug use (81), and the aura form of migraine (82). This study excluded all these populations based on participant self-report, and laboratory testing was negative for diabetes mellitus and illicit drug use. Yet, our results (25 of 65 participants (38%) ≤55 years old with at least 2 white matter hyperintensities) stand in contrast to other work reporting the prevalence of white matter hyperintensities in healthy individuals as 5.3%, with increased numbers of lesions in those age ≥55 years old (51), though this prior study was performed on a 1.5 Tesla scanner.
Untreated hypertension may be associated with white matter hyperintensities in the elderly (83). Four participants in the older age group were receiving medical therapy for hypertension, and 3 had more lesions than expected for age. The highest blood pressure reading recorded during this study (152/87 mmHg) occurred in a 62-year-old man with no white matter hyperintentisities, and because this measurement did not follow current best practice guidelines, its clinical significance is unclear. Obstructive sleep apnea may increase the risk for white matter changes independent of its contribution to hypertension (84). Our study participants were recruited from a locale 6,000 feet (1,840 m) above sea level, and increased altitude is associated with sleep disordered breathing in healthy adults and worsened sleep apnea in patients (85). We did not perform nighttime oximetry or polysomnography to screen for or diagnose sleep apnea, but 14 participants had high or intermediate risk for obstructive sleep apnea by STOP-Bang; however, this measure was not associated with MRI findings.
In addition to assessing the prevalence of abnormalities in healthy volunteers, another purpose of this study was to measure changes over time in a population that should be relatively stable. The standardized questionnaires administered in this study exhibited strong temporal reliability, as did the visual systems assessments (dynamic visual acuity by ETDRS chart, retinal fundoscopy, and eye tracking, except the reading task), and neuroimaging. In contrast, most vestibular, auditory, autonomic, and neurological function measures (near point of convergence and Sharpened Romberg test) were more variable over time.
The primary limitation to this study is the relatively small sample size, particularly given the large number of outcome measures and the interest in age/gender subgroup analysis. The study's sample size was determined according to estimates provided in the literature on detecting signal on quantitative neuroimaging measures; however, the assessment battery also included over 100 other outcomes across multiple domains. While this study enrolled more participants than many studies of normal volunteers (Table 12), the complexity and number of measurements would likely require a much larger sample size to estimate the true rate of abnormalities or to detect differences among subgroups in adults without brain injury across this substantial number of outcomes. However, a larger sample size was limited by available personnel and equipment resources, the geographic recruitment pool, and budgetary constraints.
The high rate of abnormalities observed on some measures may suggest the prevalence of these findings in the general population could be higher than anticipated, or it may suggest that our specific population had underlying brain dysfunction, which would limit the degree in which our results generalize to a truly healthy population. Regardless, a much larger study would be needed to define the base rate of abnormalities in the general population. In addition, fewer women were enrolled so that we could better match the brain-injured military population enrolled in the companion interventional studies for persistent post-concussive symptoms, and therefore information about older women is lacking.
Whether our normative data extrapolates to any other normal population is unknown. In our study, the mean age was 39, other normative populations may not be age matched or education matched. It is possible that some of the questionnaires could be influenced by age and education but we are underpowered to address those specific subgroups.
Additional study limitations include recruiting participants from a single metropolitan area. While the single assessment site brings standardization in equipment and methodology, there may be features of the study population that are not generalizeable. The significant time commitment required from participants and the level of compensation may have biased both recruitment and study results. The study was conducted at increased altitude and in a state where recreational marijuana use is legal, and nearly 10% of potential participants were excluded based on marijuana or illicit drug use, which may have influenced the composition of the study population. However, no participants in the analysis population had positive drug screens during study participation. An additional limitation is the omission of formal neuropsychological testing, which was not done because our anticipated enrollment into this exploratory study was relatively small, and norms for these tests are well-established from larger studies. In retrospect, an assessment of neuropsychological performance would have provided a more complete clinical picture of this study population.
For clinicians caring for individuals with brain injury, we recommend being circumspect about the results of this study compared to the results of other studies of healthy volunteers. While this study incorporated a prospective design and comprehensive, multi-domain assessments and represents a unique, concerted effort to establish normal brain function, its results are at odds with much of the other literature. Whether these results extrapolate to other populations is truly unknown, but we believe that rejecting abnormalities discovered in patients with a clinical history of brain injury as normal variants is not justified by this study's results.
This study was designed to recruit participants with no history of brain injury, and the results of this paper may be most valuable as a comparator to TBI studies (16, 75, 76) than for use as broadly generalizeable population norms. Ultimately, our results demonstrate that defining a “normal” population is challenging. Nevertheless, when paired with results in individuals with mild TBI undergoing the same tests, using the same equipment, personnel, and facilities, these studies provide important information about the differentiation between normal, healthy individuals and those with persistent post-concussive symptoms following mild TBI.
Ethics Statement
This study was conducted in accordance with the International Conference on Harmonization guidelines for Good Clinical Practice and the Declaration of Helsinki. In the conduct of research where humans are the subjects, the investigator(s) adhered to the policies regarding the protection of human subjects as prescribed by Code of Federal Regulations (CFR) Title 45, Volume 1, Part 46; Title 32, Chapter 1, Part 219; and Title 21, Chapter 1, Part 50 (Protection of Human Subjects). The NORMAL study was approved by the United States Army Medical Research and Materiel Command Institutional Review Board; written informed consent was obtained for all participants prior to administering study assessments. The views, opinions and/or findings contained in this report are those of the author(s) and should not be construed as an official Department of the Army position, policy or decision unless so designated by other documentation.
Author Contributions
All the authors vouch for the accuracy and completeness of the data and data analyses and for the fidelity of the trial to the protocol. SW and AL performed the data analysis. LW and KD prepared the first draft of the manuscript. LW, SW, AL, SC, KD, RP, CW, WO, JP, JW, AM, and SM participated in the writing of the manuscript and approved the draft that was submitted for publication. The results were reviewed by the Sponsor.
Conflict of Interest Statement
All authors received salary support from the study Sponsor (United States Army Medical Research and Materiel Command) through their employers, except RP, who was active duty for the duration of this study.
Acknowledgments
This work is supported by the US Army Medical Research and Materiel Command under Contract No.W81XWH-15-D-0039-0003. We thank Sharon A. Gilbert, Ph.D., (Tunnell Government Services) for her participation in data and manuscript review. We acknowledge the following team members for their support and contributions to study operations, and when appropriate, for their contributions to study concept, design, and conduct:
Fort Carson Army Community Hospital: COL RP, CDR Laura Grogan, MAJ Karl Brewer, MAJ Gerald Surrett, MAJ Doug Langford, COL Otto Boneta, COL(ret) Heidi Terrio, CDR Renee Pazdan, LTC Mike Anderson, Courtney Tripp, Vicki Carberry, Stephanie Mazey, Don Albrandt, SFC Rommel Cruz, SSG Stanley Brown, SSG Bryan Ritchie, MG(ret) Jimmie Keenan, COL John McGrath, COL Thomas Rogers, COL Dennis LeMaster, LTC Matthew Hudkins, Damon Fletcher, Lonnie Nelson, COL Charles Taylor, MAJ Mark Thomasulo, LTC Dave Haight, COL Mark Reeves.
Study Coordinating Center/LDS Hospital: LW, SC, KD, Anita Austin, Jeanette Davis, Christy Christiansen, Rebecca Summers, Mardee Merrill.
Emmes Corporation: Alex Brindley, Amarnath Vijayarangan, Andrew Lewandowski, Anil Kumar, AL, Bonita Bender, Caitlyn Hill, Carla Casey, Carolyn Burke, Cathryn Luther-Lemmon, Chandrapal Mandloi, Charlanna Ray, Chelsea Patrichuk, Crystal Love, Damon Collie, Daniel Falleroni, Diane Brandt, Eleanore Hernandez, Elizabeth Hebert, Ellen Lane, Ellen Parker, Erin Rosenbaum, Gayathri Natarajan, George Lindblad, Gillian Armstrong, Hardik Raizada, Harlan Campbell, Jan Peterson, Jean Crawford, Joshua Hagel, Joy Esterlitz, Kristine Nelson, Kunal Narang, Latticia Thomas, Mahesh Minnakanti, Maria Abraham, Mark Polanski, Michael Wierzbicki, Michelle Weeks, Nagaraju Peraboina, Nathan James, Nilay Shah, Noble Shore, Noga Lewin, Omid Neyzari, Priyanka Basa, Radhika Kondapaka, Rebecca Morgan, Robert Lindblad, Ross Nelson, Sarah Moore, Scott McCrimmon, Shilpa Puyamurthy, SW, Stephanie Monroe, Sunny Verma, Susan Parks, Timothy Heitman, TingTing Lu, Traci Scheer, Tricia Schurman, Whitney Sheffer, Zorayr Manukyan.
Henry M. Jackson Foundation: Jami Egan, AM, Elizabeth Searing, Mark Greeder, Barbara Mayhugh, Jill York, Jennifer Gardino, Ricki Skaggs, Challa Lowry, Derin Wester, Kris Spalloni, Teresa Thomas, Paul Garibay, Pat Nelson, Cody Turner, Cyndi Pink, Laura Crews, Tina Scheid, Gayle Russell, Tiffany Cripps, Allison Thibodeaux.
Lovelace: WO, COL (ret) CW, Mark Spitz, John Foley, JW, Paul Wetzel, SM, JP, David Cifu, Carla Wilson, Bryan Layton, Daphne Holt, Bruce Fischl, Xaomin Yue, Jeff Lewine, Darlene Harbour.
United States Army Medical Research and Materiel Command/USAMMDA: COL (ret) R. Scott Miller, COL Austin Chhoeu, Mike Husband, CAPT Brett Hart, Marie Cochran, Kyle Martin, Maria Malone, Nicole Johnston, Timothy Ebner, Krista Davis, Cory Uscilowicz, Sherree Grebenstein, Sandra Vazquez, Heather Hedrick, Thomas Jackson, Robert Labutta, Melissa Askin, Christie Lawrence, Dixion Rwakasyaguri, William McCarthy, Jennifer Rebelez, Stacey Brook, BG (ret) Lori Sutton, MAJ Keith Scorza, COL (ret) Brian McCrary, COL (ret) Ric Ricciardi, Robert Miller, MG(ret) James Gilman, LTG(ret) Eric Schoomaker, Wayman Cheatham, LT Kevin Marrs, Adam Johnson, CDR Rene Hernandez, COL Dallas Hack, CPT Leonard Skipper, Jami Brake.
National Intrepid Center of Excellence: Gerard Riedy, Terrence Oakes, Priya Santhanam, Joseph Hennessey, Jenni Pacheco, Theresa Teslovich, Mark Varvaris, Jim Kelley, JP, Pavel Krapiva.
Philips Healthcare: Tom Perkins
Nevada Imaging: Eric Hansen
Toshiba: Tim Marn
Leidos: Joel Glover
Naval Health Research Center: Ed Gorham, Ilka De Leon.
References
1. Centers for Disease Control and Prevention. Report to Congress on Traumatic Brain Injury in the United States: Epidemiology and Rehabilitation. Atlanta, GA: National Center for Injury Prevention and Control; Division of Unintentional Injury Prevention (2015).
2. Carroll LJ, Cassidy JD, Holm L, Kraus J, Coronado VG W. H. O. Collaborating Centre Task Force on Mild Traumatic Brain Injury. Methodological issues and research recommendations for mild traumatic brain injury: the WHO Collaborating Centre Task Force on Mild Traumatic Brain Injury. J Rehabil Med. (2004) (43 Suppl.):113–25. doi: 10.1080/16501960410023877
3. Department of Veterans Affairs Department of Defense. VA/DoD Clinical Practice Guideline for Management of Concussion/Mild Traumatic Brain Injury (mTBI). Washington, DC (2009).
4. Arciniegas DB, Anderson CA, Topkoff J, McAllister TW. Mild traumatic brain injury: a neuropsychiatric approach to diagnosis, evaluation, and treatment. Neuropsychiatr Dis Treat. (2005) 1:311–27.
5. McMahon P, Hricik A, Yue JK, Puccio AM, Inoue T, Lingsma HF, et al. Symptomatology and functional outcome in mild traumatic brain injury: results from the prospective TRACK-TBI study. J Neurotrauma (2014) 31:26–33. doi: 10.1089/neu.2013.2984
6. Binder LM, Rohling ML, Larrabee GJ. A review of mild head trauma. Part I: meta-analytic review of neuropsychological studies. J Clin Exp Neuropsychol. (1997) 19:421–31. doi: 10.1080/01688639708403870
7. Mac Donald CL, Johnson AM, Wierzechowski L, Kassner E, Stewart T, Nelson EC, et al. Prospectively assessed clinical outcomes in concussive blast vs nonblast traumatic brain injury among evacuated US military personnel. JAMA Neurol. (2014) 71:994–1002. doi: 10.1001/jamaneurol.2014.1114
8. Lewine JD, Davis JT, Bigler ED, Thoma R, Hill D, Funke M, et al. Objective documentation of traumatic brain injury subsequent to mild head trauma: multimodal brain imaging with MEG, SPECT, and MRI. J Head Trauma Rehabil. (2007) 22:141–55. doi: 10.1097/01.HTR.0000271115.29954.27
9. Smith-Seemiller L, Fow NR, Kant R, Franzen MD. Presence of post-concussion syndrome symptoms in patients with chronic pain vs mild traumatic brain injury. Brain Injury (2003) 17:199–206. doi: 10.1080/0269905021000030823
10. Gasquoine PG. Postconcussional symptoms in chronic back pain. Appl Neuropsychol. (2000) 7:83–9. doi: 10.1207/S15324826AN0702_3
11. Lange RT, Brickell TA, Kennedy JE, Bailie JM, Sills C, Asmussen S, et al. Factors influencing postconcussion and posttraumatic stress symptom reporting following military-related concurrent polytrauma and traumatic brain injury. Arch Clin Neuropsychol. (2014) 29:329–47. doi: 10.1093/arclin/acu013
12. Bryant R. Post-traumatic stress disorder vs traumatic brain injury. Dialogues Clin Neurosci. (2011) 13:251–62.
13. Mirzaalian H, Ning L, Savadjiev P, Pasternak O, Bouix S, Michailovich O, et al. Inter-site and inter-scanner diffusion MRI data harmonization. Neuroimage (2016) 135:311–23. doi: 10.1016/j.neuroimage.2016.04.041
14. Kostro D, Abdulkadir A, Durr A, Roos R, Leavitt BR, Johnson H, et al. Correction of inter-scanner and within-subject variance in structural MRI based automated diagnosing. Neuroimage (2014) 98:405–15. doi: 10.1016/j.neuroimage.2014.04.057
15. Weaver LK, Chhoeu AH, Lindblad AS, Churchill S, Wilson SH. Progress of the brain injury and mechanisms of action of hyperbaric oxygen for persistent post-concussive symptoms after mild traumatic brain injury study. Undersea Hyperb Med. (2016) 43:485–9.
16. Weaver LK, Wilson SH, Lindblad AS, Churchill S, Deru K, Price RC, et al. Hyperbaric oxygen for post-concussive symptoms in United States military service members: a randomized clinical trial. Undersea Hyperb Med. (2018) 45:129–56. doi: 10.22462/03.04.2018.1
17. Corrigan JD, Bogner J. Initial reliability and validity of the Ohio State University TBI identification method. J Head Trauma Rehabil. (2007) 22:318–29. doi: 10.1097/01.HTR.0000300227.67748.77
18. Radloff LS. The CES-D Scale: a self-report depression scale for research in the general population. Appl Psychol Meas. (1977) 1:385–401. doi: 10.1177/014662167700100306
19. Ruggiero KJ, Del Ben K, Scotti JR, Rabalais AE. Psychometric properties of the PTSD checklist-civilian version. J Trauma Stress. (2003) 16:495–502. doi: 10.1023/A:1025714729117
20. Brazier JE, Harper R, Jones NM, O'Cathain A, Thomas KJ, Usherwood T, et al. Validating the SF-36 health survey questionnaire: new outcome measure for primary care. BMJ (1992) 305:160–4. doi: 10.1136/bmj.305.6846.160
21. Skevington SM, Lotfy M, O'Connell KA, Group W. The World Health Organization's WHOQOL-BREF quality of life assessment: psychometric properties and results of the international field trial. A report from the WHOQOL group. Qual Life Res. (2004) 13:299–310. doi: 10.1023/B:QURE.0000018486.91360.00
22. Diener E, Emmons RA, Larsen RJ, Griffin S. The satisfaction with life scale. J Pers Assess. (1985) 49:71–5. doi: 10.1207/s15327752jpa4901_13
23. Williams CS, Weaver LK, Lindblad AS, Kumar S, Langford DR. Baseline neurological evaluations in a hyperbaric trial of post-concussive syndrome. Undersea Hyperb Med. (2016) 43:511–9.
24. Edwards RH, Hyde S. Methods of measuring muscle strength and fatigue. Physiotherapy (1977) 63:51–5.
25. Berg KO, Wood-Dauphinee SL, Williams JI, Maki B. Measuring balance in the elderly: validation of an instrument. Can J Public Health (1992) 83(Suppl. 2):S7–11.
26. Notermans NC, van Dijk GW, van der Graaf Y, van Gijn J, Wokke JH. Measuring ataxia: quantification based on the standard neurological examination. J Neurol Neurosurg Psychiatry (1994) 57:22–6. doi: 10.1136/jnnp.57.1.22
27. Fitzgerald B. A review of the sharpened Romberg test in diving medicine. SPUMS J. (1996) 26:142–6.
29. Doty RL, Marcus A, Lee WW. Development of the 12-item Cross-Cultural Smell Identification Test (CC-SIT). Laryngoscope (1996) 106(3 Pt 1):353–6. doi: 10.1097/00005537-199603000-00021
30. Williams CS, Spitz MC, Foley JF, Weaver LK, Lindblad AS, Wierzbicki MR. Baseline EEG abnormailities in mild traumatic brain injury from the BIMA study. Undersea Hyperb Med. (2016) 43:521–30.
31. Buysse DJ, Reynolds CF, III, Monk TH, Berman SR, Kupfer DJ. The pittsburgh sleep quality index: a new instrument for psychiatric practice and research. Psychiatry Res. (1989) 28:193–213. doi: 10.1016/0165-1781(89)90047-4
32. Chung F, Yang Y, Brown R, Liao P. Alternative scoring models of STOP-bang questionnaire improve specificity to detect undiagnosed obstructive sleep apnea. J Clin Sleep Med. (2014) 10:951–8. doi: 10.5664/jcsm.4022
33. Allen RP, Picchietti D, Hening WA, Trenkwalder C, Walters AS, Montplaisi J. Restless legs syndrome: diagnostic criteria, special considerations, and epidemiology. A report from the restless legs syndrome diagnosis and epidemiology workshop at the National Institutes of Health. Sleep Med. (2003) 4:101–19. doi: 10.1016/S1389-9457(03)00010-8
34. Anic-Labat S, Guilleminault C, Kraemer HC, Meehan J, Arrigoni J, Mignot E. Validation of a cataplexy questionnaire in 983 sleep-disorders patients. Sleep (1999) 22:77–87.
35. Sateia MJ. International classification of sleep disorders-third edition: highlights and modifications. Chest (2014) 146:1387–94. doi: 10.1378/chest.14-0970
36. Meehan A, Searing E, Weaver LK, Lewandowski A. Baseline vestibular and auditory findings in a trial of post-concussive syndrome. Undersea Hyperb Med. (2016) 43:567–84.
37. Jacobson GP, Shepard NT. Balance Function Assessment And Management. San Diego, CA: Plural Publishing (2008).
38. O'Leary DP, Davis LL. High-frequency autorotational testing of the vestibulo-ocular reflex. Neurol Clin. (1990) 8:297–312. doi: 10.1016/S0733-8619(18)30357-8
39. Hirvonen TP, Aalto H, Pyykko I, Juhola M. Comparison of two head autorotation tests. J Vestib Res. (1999) 9:119–25.
40. Felipe L, Kingma H. Ocular vestibular evoked myogenic potentials. Int Arch Otorhinolaryngol. (2014) 18:77–9. doi: 10.1055/s-0033-1352503
41. Katz J, Medwetsky L, Burkard R, Hood L. Handbook of Clinical Audiology. 6th Edn. Baltimore, MD: Lippincott Williams & Wilkins (2009).
42. Kothari MT, Venkatesan G, Shah JP, Kothari K, Nirmalan PK. Can ocular torsion be measured using the slitlamp biomicroscope? Indian J Ophthalmol. (2005) 53:43–7. doi: 10.4103/0301-4738.15284
43. Lefevre F, Leroy K, Delrieu B, Lassale D, Pechereau A. [Study of the optic nerve head-fovea angle with retinophotography in healthy patients]. J Fr Ophtalmol. (2007) 30:598–606. doi: 10.1016/S0181-5512(07)89664-1
44. Badke MB, Shea TA, Miedaner JA, Grove CR. Outcomes after rehabilitation for adults with balance dysfunction. Arch Phys Med Rehabil. (2004) 85:227–33. doi: 10.1016/j.apmr.2003.06.006
45. Hayasaka S, Peiffer AM, Hugenschmidt CE, Laurienti PJ. Power and sample size calculation for neuroimaging studies by non-central random field theory. Neuroimage (2007) 37:721–30. doi: 10.1016/j.neuroimage.2007.06.009
46. Desmond JE, Glover GH. Estimating sample size in functional MRI (fMRI) neuroimaging studies: statistical power analyses. J Neurosci Methods (2002) 118:115–28. doi: 10.1016/S0165-0270(02)00121-8
47. Mumford JA, Nichols TE. Power calculation for group fMRI studies accounting for arbitrary design and temporal autocorrelation. Neuroimage (2008) 39:261–8. doi: 10.1016/j.neuroimage.2007.07.061
48. Chaikin LR. Disorders of vision and visual-perception dysfunction. In: Umphred DA, Burton GU, Lazaro RT, Roller ML, editors. Neurological Rehabilitation. 6th Edn. St Louis, MO: Elsevier Mosby (2012). p. 863–94.
49. Mirow S, Wilson SH, Weaver LK, Churchill S, Deru K, Lindblad AS. Linear analysis of heart rate variability in post-concussive syndrome. Undersea Hyperb Med. (2016) 43:531–47.
50. Riedy G, Senseney JS, Liu W, Ollinger J, Sham E, Krapiva P, et al. Findings from structural MR imaging in military traumatic brain injury. Radiology (2016) 279:207–15. doi: 10.1148/radiol.2015150438
51. Hopkins RO, Beck CJ, Burnett DL, Weaver LK, Victoroff J, Bigler ED. Prevalence of white matter hyperintensities in a young healthy population. J Neuroimaging (2006) 16:243–51. doi: 10.1111/j.1552-6569.2006.00047.x
52. Thompson C, Davies P, Herrman L, Summers M, Potter S. Approaches to establishing validated cut-off scores on the Rivermead Post Concussion Symptoms Questionnaire (RPQ). In: Eleventh World Congress on Brain Injury (International Brain Injury Association) (Hague) (2016).
53. Iverson GL, Lange RT. Examination of “postconcussion-like” symptoms in a healthy sample. Appl Neuropsychol. (2003) 10:137–44. doi: 10.1207/S15324826AN1003_02
54. Belanger HG, Kretzmer T, Vanderploeg RD, French LM. Symptom complaints following combat-related traumatic brain injury: relationship to traumatic brain injury severity and posttraumatic stress disorder. J Int Neuropsychol Soc. (2010) 16:194–9. doi: 10.1017/S1355617709990841
55. Walker EA, Newman E, Dobie DJ, Ciechanowski P, Katon W. Validation of the PTSD checklist in an HMO sample of women. Gen Hosp Psychiatry (2002) 24:375–80. doi: 10.1016/S0163-8343(02)00203-7
56. Ewing DJ, Neilson JM, Shapiro CM, Stewart JA, Reid W. Twenty four hour heart rate variability: effects of posture, sleep, and time of day in healthy controls and comparison with bedside tests of autonomic function in diabetic patients. Br Heart J. (1991) 65:239–44.
57. Minassian A, Geyer MA, Baker DG, Nievergelt CM, O'Connor DT, Risbrough VB, et al. Heart rate variability characteristics in a large group of active-duty marines and relationship to posttraumatic stress. Psychosom Med. (2014) 76:292–301. doi: 10.1097/PSY.0000000000000056
58. Mollayeva T, Thurairajah P, Burton K, Mollayeva S, Shapiro CM, Colantonio A. The Pittsburgh sleep quality index as a screening tool for sleep dysfunction in clinical and non-clinical samples: A systematic review and meta-analysis. Sleep Med Rev. (2016) 25:52–73. doi: 10.1016/j.smrv.2015.01.009
59. Gschwandtner U, Pflueger MO, Semenin V, Gaggiotti M, Riecher-Rössler A, Fuhr P. EEG: a helpful tool in the prediction of psychosis. Eur Arch Psychiatry Clin Neurosci. (2009) 259:257–62. doi: 10.1007/s00406-008-0854-3
60. Sachdev P, Brodaty H, Roubina S, Mackenzie RA. An electroencephalographic investigation of late-onset schizophrenia. Int Psychogeriatr. (1999) 11:421–9. doi: 10.1017/S1041610299006031
61. Abraham NG, Srinivasan K, Thomas J. Normative data for near point of convergence, accommodation, and phoria. Oman J Ophthalmol. (2015) 8:14–8. doi: 10.4103/0974-620X.149856
62. Scheiman M, Gallaway M, Frantz KA, Peters RJ, Hatch S, Cuff M, et al. Nearpoint of convergence: test procedure, target selection, and normative data. Optom Vis Sci. (2003) 80:214–25. doi: 10.1097/00006324-200303000-00011
63. Casanova C, Celli BR, Barria P, Casas A, Cote C, de Torres JP, et al. Six Minute Walk Distance Project (ALAT). The 6-min walk distance in healthy subjects: reference standards from seven countries. Eur Respir J. (2011) 37:150–6. doi: 10.1183/09031936.00194909
64. Massy-Westropp NM, Gill TK, Taylor AW, Bohannon RW, Hill CL. Hand Grip Strength: age and gender stratified normative data in a population-based study. BMC Res Notes (2011) 4:127. doi: 10.1186/1756-0500-4-127
65. Lee DH, Lee SJ, Park SH. Ocular torsion in normal Korean population. J Korean Ophthalmol Soc. (2004) 45:797–802.
66. Honaker JA, Shepard NT. Age effect on the Gaze Stabilization test. J Vestib Res. (2010) 20:357–62. doi: 10.3233/VES-2010-0365
67. Hageman PA, Leibowitz JM, Blanke D. Age and gender effects on postural control measures. Arch Phys Med Rehabil. (1995) 76:961–5. doi: 10.1016/S0003-9993(95)80075-1
68. Akin FW, Murnane OD, Pearson A, Byrd S, Kelly KJ. Normative data for the subjective visual vertical test during centrifugation. J Am Acad Audiol. (2011) 22:460–8. doi: 10.3766/jaaa.22.7.6
69. McGuire S, Sherman P, Profenna L, Grogan P, Sladky J, Brown A, et al. White matter hyperintensities on MRI in high-altitude U-2 pilots. Neurology (2013) 81:729–35. doi: 10.1212/WNL.0b013e3182a1ab12
70. Di Perri C, Dwyer M, Bergsland N, Schirda C, Poloni GU, Wack D, et al. White matter hyperintensities on 1.5 and 3 Tesla brain MRI in healthy individuals. J Biomed Graph Comput. (2013) 3:53–32. doi: 10.5430/jbgc.v3n3p53
71. Neema M, Guss ZD, Stankiewicz JM, Arora A, Healy BC, Bakshi R. Normal findings on brain fluid-attenuated inversion recovery MR images at 3T. AJNR Am J Neuroradiol. (2009) 30:911–6. doi: 10.3174/ajnr.A1514
72. Pu Y, Mahankali S, Hou J, Li J, Lancaster JL, Gao JH, et al. High prevalence of pineal cysts in healthy adults demonstrated by high-resolution, noncontrast brain MR imaging. AJNR Am J Neuroradiol. (2007) 28:1706–9. doi: 10.3174/ajnr.A0656
73. Sun B, Wang D, Tang Y, Fan L, Lin X, Yu T, et al. The pineal volume: a three-dimensional volumetric study in healthy young adults using 3.0 T MR data. Int J Dev Neurosci. (2009) 27:655–60. doi: 10.1016/j.ijdevneu.2009.08.002
74. Van Essen DC, Smith SM, Barch DM, Behrens TE, Yacoub E, Ugurbil K, et al. The WU-Minn Human Connectome Project: an overview. Neuroimage (2013) 80:62–79. doi: 10.1016/j.neuroimage.2013.05.041
75. Walker JM, Mulatya C, Hebert D, Wilson SH, Lindblad AS, Weaver LK. Sleep assessment in a randomized trial of hyperbaric oxygen in U.S. service members with post concussive mild traumatic brain injury compared to normal controls. Sleep Med. (2018) 51:66–79. doi: 10.1016/j.sleep.2018.06.006
76. Wetzel PA, Lindblad AS, Raizada H, James N, Mulatya C, Kannan MA, et al. Eye Tracking Results in Postconcussive Syndrome Versus Normative Participants. Invest Ophthalmol Vis Sci. (2018) 59:4011–9. doi: 10.1167/iovs.18-23815
77. Bigler ED, Abildskov TJ, Goodrich-Hunsaker NJ, Black G, Christensen ZP, Huff T, et al. Structural Neuroimaging Findings in Mild Traumatic Brain Injury. Sports Med Arthrosc. (2016) 24:e42–52. doi: 10.1097/JSA.0000000000000119
78. Parkinson RB, Hopkins RO, Cleavinger HB, Weaver LK, Victoroff J, Foley JF, et al. White matter hyperintensities and neuropsychological outcome following carbon monoxide poisoning. Neurology (2002) 58:1525–32. doi: 10.1212/WNL.58.10.1525
79. Huang BY, Castillo M. Hypoxic-ischemic brain injury: imaging findings from birth to adulthood. Radiographics (2008) 28:417–39; quiz 617. doi: 10.1148/rg.282075066
80. Gouw AA, van der Flier WM, Fazekas F, van Straaten EC, Pantoni L, Poggesi A, et al. Progression of white matter hyperintensities and incidence of new lacunes over a 3-year period: the Leukoaraiosis and Disability study. Stroke (2008) 39:1414–20. doi: 10.1161/STROKEAHA.107.498535
81. Alaee A, Zarghami M, Farnia S, Khademloo M, Khoddad T. Comparison of brain white matter hyperintensities in methamphetamine and methadone dependent patients and healthy controls. Iran J Radiol. (2014) 11:e14275. doi: 10.5812/iranjradiol.14275
82. Kruit MC, van Buchem MA, Launer LJ, Terwindt GM, Ferrari MD. Migraine is associated with an increased risk of deep white matter lesions, subclinical posterior circulation infarcts and brain iron accumulation: the population-based MRI CAMERA study. Cephalalgia (2010) 30:129–36. doi: 10.1111/j.1468-2982.2009.01904.x
83. de Leeuw FE, de Groot JC, Oudkerk M, Witteman JC, Hofman A, van Gijn J, et al. Hypertension and cerebral white matter lesions in a prospective cohort study. Brain (2002) 125(Pt 4):765–72. doi: 10.1093/brain/awf077
84. Kim H, Yun CH, Thomas RJ, Lee SH, Seo HS, Cho ER, et al. Obstructive sleep apnea as a risk factor for cerebral white matter change in a middle-aged and older general population. Sleep (2013) 36:709–15B. doi: 10.5665/sleep.2632
Keywords: neurological evaluation, healthy volunteers, neuroepidemiology, white matter hyperintensities, brain imaging, mild traumatic brain injury
Citation: Weaver LK, Wilson SH, Lindblad AS, Churchill S, Deru K, Price R, Williams CS, Orrison WW, Patel JB, Walker JM, Meehan A, Mirow S and the NORMAL Study Team (2018) Comprehensive Evaluation of Healthy Volunteers Using Multi-Modality Brain Injury Assessments: An Exploratory, Observational Study. Front. Neurol. 9:1030. doi: 10.3389/fneur.2018.01030
Received: 24 August 2018; Accepted: 15 November 2018;
Published: 17 December 2018.
Edited by:
Tracey Weiland, The University of Melbourne, AustraliaReviewed by:
Tom M. McMillan, University of Glasgow, United KingdomGeorge A. Jelinek, The University of Melbourne, Australia
Copyright © 2018 Weaver, Wilson, Lindblad, Churchill, Deru, Price, Williams, Orrison, Patel, Walker, Meehan, Mirow and the NORMAL Study Team. This is an open-access article distributed under the terms of the Creative Commons Attribution License (CC BY). The use, distribution or reproduction in other forums is permitted, provided the original author(s) and the copyright owner(s) are credited and that the original publication in this journal is cited, in accordance with accepted academic practice. No use, distribution or reproduction is permitted which does not comply with these terms.
*Correspondence: Lindell K. Weaver, bGluZGVsbC53ZWF2ZXJAaW1haWwub3Jn
†Deceased