 Xiao-Feng Du
 Jiao Liu
- Department of Radiology, Hwa Mei Hospital, University of Chinese Academy of Sciences, Ningbo, China
Objective: To identify the abnormal regional spontaneous brain activity associated with relapsing-remitting multiple sclerosis (RRMS) using fractional amplitude of low-frequency fluctuation (fALFF) analysis and their relationships with clinical features.
Methods: A total of 26 RRMS (11 males, 15 females; age, 36.58 ± 10.82 years) and 27 status-matched healthy group (HGs; 12 males, 15 females; age, 35.85 ± 12.05 years) underwent an Expanded Disability Status Scale (EDSS) examination. fALFF was applied to evaluate the abnormal regional brain activity associated with RRMS. Pearson's correlation analysis was applied to calculate the correlations between the signal values of brain areas that exhibited abnormal fALFF values and clinical features. Receiver operating characteristic (ROC) curve was performed to evaluate the sensitivity and specificity of those altered brain areas to distinguish between RRMS and HGs.
Results: Compared with HGs, RRMS exhibited higher fALFF in the right cerebellum posterior lobe, left orbitofrontal cortex, left dorsolateral prefrontal cortex, bilateral supplementary motor area, and right fusiform gyrus and lower fALFF values in the left hippocampus and right precuneus. ROC revealed that these areas showed two good and five fair AUC values (0.77 ± 0.03, 0.729~0.822). However, four combinations with more than five brain regions received the same best discriminatory power with a sensitivity of 96.3% and a specificity of 88.5%. EDSS revealed a negative correlation with supplementary motor area (r = −0.395, p = 0.046).
Conclusions: RRMS is associated with abnormal regional brain activity deficits of motor- and cognitive-related areas. The fALFF parameter may serve as a potential biological marker to discriminate between the two groups.
Introduction
Multiple sclerosis (MS) is a demyelinating disease in axonal degeneration with commonly diagnosed in the prime of life. In addition to classic inflammatory white matter lesions, extensive gray matter demyelination have been gradually known (1, 2). Extensive involvements of clinical symptoms-related (3, 4) gray matter abnormalities could be found by routine and functional magnetic resonance imaging (MRI) (5–7), these disease-related cortical abnormalities may delay and perturb syntonic intrinsic signals across cortico-cortical and cortico-subcortical wirings and lead to several clinical manifestations, such as fatigue, sensorimotor deficits, cognitive dysfunction, even chronic disability (2). Although extensive neurotoxic effects of MS on brain and behavior have been known, the neurobiological mechanism of complex brain network impairments underlying MS remains ambiguous.
It is proposed that resting-state functional MRI (rs-fMRI) is a useful tool for the mechanism research of brain disease (8) and exhibited an effective way to characterize the resting-state brain activity without any tasks that may represent more than 95% of the total activity of the brain (9). The rs-fMRI can be used to describe the regional spontaneous neuronal brain activity without exposing to the radioactive tracers (8). In contrast to magnetoencephalography and conventional electrophysiologic methods, the rs-fMRI has the capacity to map the physiological effects of neuronal activity with high spatial resolution. Cordani et al. found widespread gray matter atrophy, microstructural white matter abnormalities, and decreased resting state functional connectivity in motor and cognitive networks in patients with MS, which contribute to explain motor disability in MS patients (10). Plata-Bello et al. found a decrease of amplitude of low-frequency fluctuations (ALFF) in the left inferior frontal gyrus in MS patients, and this area correlated with the gray matter volume of the left inferior parietal lobule (11). van Geest et al. found that compared to non-depressed MS patients, depressed MS patients had lower white matter volume (p < 0.01), decreased fractional anisotropy of the uncinate fasciculus (p < 0.05), and lower resting-state functional connectivity between the amygdala and the frontal regions (p < 0.05) (12). Furthermore, the disease duration, fractional anisotropy of the uncinate fasciculus, and the functional connectivity pair could explain 48% of variance in the severity of depression. These findings help us understand the pathophysiology of the MS.
The ALFF and fractional ALFF (fALFF) are two important parts of the rs-fMRI. The spontaneous LFFs have been suggested to arise from neurovascular mechanisms (13). Although the nature of the LFFs remains unclear, the proposed ALFF method (14) may be associated with regional spontaneous neuronal activity (15) and has served as a sensitive biological indicator to discriminate one group from the other group (16). However, this method is sensitive to physiological noise, which may hamper us to describe the alterations of regional spontaneous neuronal brain activity. The fALFF may overcome this limitation (17). The improved method could provide a more specific index of low-frequency oscillatory phenomena by measuring local fluctuations in neuronal activity rather than generalized neuronal activity (18). The proposed new method of fALFF has been shown to decrease bias and increase sensitivity relative to the ALFF method (17). Recently the fALFF method has been widely used to explore the neurobiological mechanism for several diseases, such as schizophrenia (19), depressive disorder (20), and Alzheimer's disease (21). Liu et al. (22) found that abnormal regional brain activity was detected in patients with MS with simple spinal cord involvement by this method. However, relapsing-remitting MS (RRMS) has not been studied by this method. RRMS is associated with changes in behavior, brain function, and brain structure. However, the nature of these changes have not been well-understood. Motivated by previous work, in the present study, it is the first to utilize the fALFF method to identify the regional spontaneous brain activity associated with RRMS.
Materials and Methods
Subjects
Total of 26 RRMS (11 males, 15 females; mean age, 36.58 ± 10.82 years; mean education, 10.69 ± 2.53 years) and 27 age-, sex-, and education-matched healthy groups (HGs; 12 males, 15 females; mean age, 35.85 ± 12.05 years; mean education, 11.07 ± 2.85 years) were recruited.
The RRMS met the pertinent inclusion criteria: (1) met the diagnostic criteria of RRMS as defined by McDonald; (2) had mild to moderate RRMS as defined by the Expanded Disability Status Scale (EDSS) examination (EDSS ≤ 5), to prevent confounding factors in the analysis; (3) had not received steroids-based therapy or experiencing a clinical relapse, or other concomitant therapy as antidepressant or therapy for fatigue for at least 2 months prior and during this study; (4) had no sleep disorders and other psychiatric disorders, as defined by the DSM-IV; (5) had no brain tumor, brain injury, intracerebral hemorrhage, according to the conventional MRI. The disease duration was recorded in months from the symptom onset date to the MRI scan date.
The HGs had no history of brain tumor, brain injury, inborn or other acquired diseases, neurological or psychiatric disorders, sleep disorders, alcohol abuse, drug abuse, systemic illness, intracerebral hemorrhage, and foreign implants in the body. All subjects were right-handed, as defined by the Edinburgh Inventory.
All volunteers underwent a thorough physical examination using the EDSS by an experienced neurologist. The EDSS score is from 0 to 10, where zero score indicates normal, and higher EDSS score shows more disability. All volunteers participated voluntarily and were explained the purposes, methods, and potential risks. Before the MRI session, all subjects voluntarily signed their informed consent form. This study was approved by the Human Research Ethics Committee.
MRI
MRI scan was performed on 3-Tesla MR scanners (Trio, Siemens, Erlangen, Germany). High-resolution T1-weighted anatomical images were acquired with a three-dimensional magnetization prepared rapid-gradient-echo sequence in a sagittal orientation: the brain volume with 176 slice phase encoding directions (repetition time = 2,300 ms, echo time = 2.98 ms, slice thickness = 1.0 mm, acquisition matrix = 256 × 256, field of view = 256 mm × 256 mm, flip angle = 9°) were obtained. Total of 240 functional images (repetition time = 2,000 ms, echo time = 30 ms, slice thickness = 4.0 mm, gap = 1.2 mm, acquisition matrix = 64 × 64, flip angle = 90°, field of view = 220 mm × 220 mm, 32 slices) covering the whole brain were obtained, which took about 8 min for functional data acquisition. Other sequences, such as T1WI, T2WI, T2 FLAIR, and diffusion-weighted imaging, were also acquired.
Data Analysis
The first 10 time points of the functional images were discarded due to the possible instability of the initial MRI signal and inadaptation to the scanning environment (23). On the basis of MATLAB2010a (Mathworks, Natick, MA, USA), data pre-processing of the remaining resting-state images was performed by Data Processing & Analysis for Brain Imaging (DPABI 2.1, http://rfmri.org/DPABI) toolbox (24), including form transformation, slice timing, head motion correction, spatial normalization, and smooth with a Gaussian kernel of 6 × 6 × 6 mm3 full-width at half-maximum. The 3D T1-weighted images for each subject were coregistered to the mean of the realigned EPI template and then segmented into gray matter, white matter, and cerebrospinal fluid (CSF) using the Diffeomorphic Anatomical Registration Through Exponentiated Lie Algebra (DARTEL) segmentation. Participants with more than 1.5 mm maximum translation in x, y, or z directions and 1.5° degree of motion rotation were removed. The Friston 24 head motion parameters model, including six head motion parameters, six head motion parameters, and 12 corresponding squared items, was used to regress out the head motion effects based on recent work showing that the higher-order models benefit from the removal of head motion effects (25–28). In RRMS, T1-hypointense lesions were manually identified and were semiautomated painted as regions of interest (ROIs) using the T1 sagittal images converted to axial. Lesion masks for each patient were created (transforming the ROIs into independent images) and then binarized using ImCalc module. After this step, the binary lesion masks together with the T1 sagittal images were used to create new structural images. The created images were automatically transformed from the individual space to the Montreal Neurological Institute (MNI) space. Linear regression was applied to remove other sources of spurious covariates along with their temporal derivatives, including the global mean signal, white matter and cerebrospinal fluid signal. After the head-motion correction, the functional MRI images were spatially normalized to the MNI space and resampled at a resolution of 3 × 3 × 3 mm3. After pre-processing, the time series for each voxel were linearly detrended to reduce the low-frequency drift and physiological high-frequency respiratory and cardiac noise.
The ALFF measure at each voxel was the averaged square root of the power spectrum of low-frequency (0.01–0.08 Hz). The fALFF value was the ratio of this power spectrum to entire frequency range. The fALFF was calculated by DPABI toolbox.
Statistical Analysis
The demographic factors (age, education, and years of education) and the questionnaire data were compared between groups using two sample t-test. Chi-square (χ2) test was used for categorical data. The statistical analysis was performed using IBM Statistical Package for the Social Sciences version 21.0 (SPSS 21.0). Data are presented as mean ± standard deviation. All results were quoted as two-tailed, and P < 0.05 was considered as statistically significant.
Two-sample t-tests were used to investigate the fALFF differences in brain regions between RRMS and HGs with age, sex, and years of education as nuisance covariates of no interest. A corrected threshold of two-tailed voxel-wise p < 0.001 and cluster-level p < 0.001, corrected for multiple comparisons by false discovery rate (FDR), was used for one-sample t-tests. A loose corrected threshold of two-tailed voxel-wise p < 0.01 and cluster-level p < 0.05 with a minimum continuous cluster voxel volume of 540 mm3 was used for two-sample t-tests.
Recently, ROC curve was increasingly applied into the exploration of the reliability of one neuroimaging parameter as a potential biological indicator in distinguishing one group from another group (8, 16, 29–31). The mean beta values of those brain regions exhibiting abnormal fALFF in RRMS relative to HGs were entered into ROC curve analysis. Pearson correlation analysis was performed to evaluate the relationships between the behavioral performances (disease duration and EDSS score) and the fALFF value of those different brain regions. p < 0.05 was considered to be significant differences.
Results
Sample Characteristics
The demographic characteristics of the subjects are presented in Table 1. There were no significant differences in sex (χ2 = 0.025, p = 0.875), mean age (t = 0.23, p = 0.819), and mean education (t = −0.515, p = 0.609) between RRMS and HGs. The mean disease duration and EDSS score of RRMS was 22.02 (±32.96) days and 3.62 (±1.8), respectively.
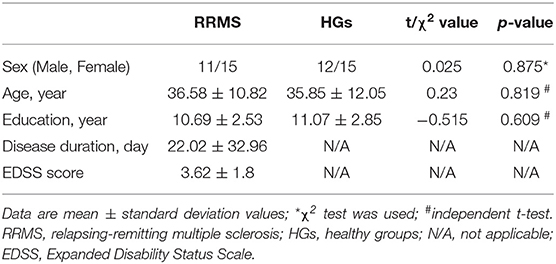
Table 1. Demographics and clinical characteristics.
fALFF Differences Between Groups
First, we reported within-group statistic maps for fALFF measurement for RRMS (Figure 1A) and HGs (Figure 1B) using one sample t-test (p < 0.001, FDR corrected). We found that the two groups showed significantly similar fALFF value in brain areas, but the covered areas in RRMS are wider than those in HGs (Figure 2). Next, the fALFF differences between RRMS and HGs were compared. Compared with HGs, RRMS exhibited significantly higher fALFF values in the right cerebellum posterior lobe, left orbitofrontal cortex (BA 47), left dorsolateral prefrontal cortex (BA 46) in the salience network, bilateral supplementary motor area (BA 6) in the salience network, and right fusiform gyrus (BA20) and lower fALFF values in the left hippocampus (BA28) and right precuneus (BA 7) in the occipital cortex (Figure 2; Table 2).
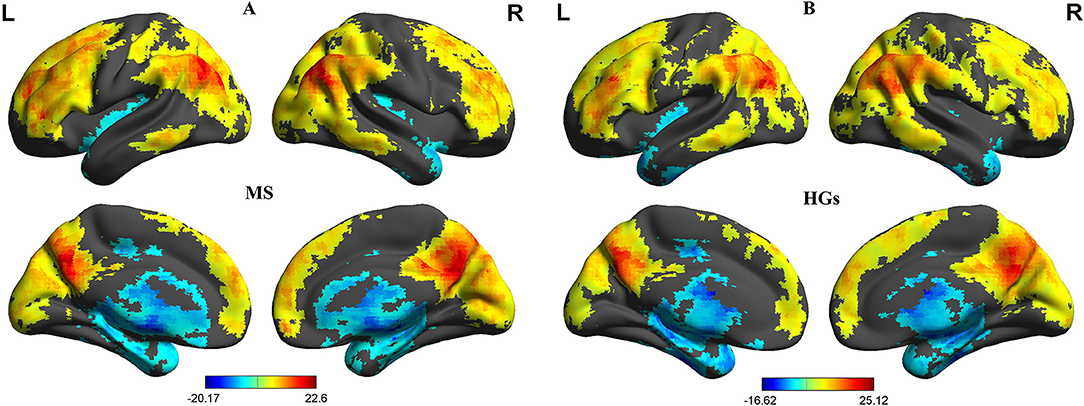
Figure 1. One sample t-tests of fALFF differences. One sample t-tests of fALFF differences in MS (A) and HGs (B). RRMS, relapsing-remitting multiple sclerosis; HGs, healthy groups; R, right; L, left; fALFF, fractional amplitude of low-frequency fluctuation.
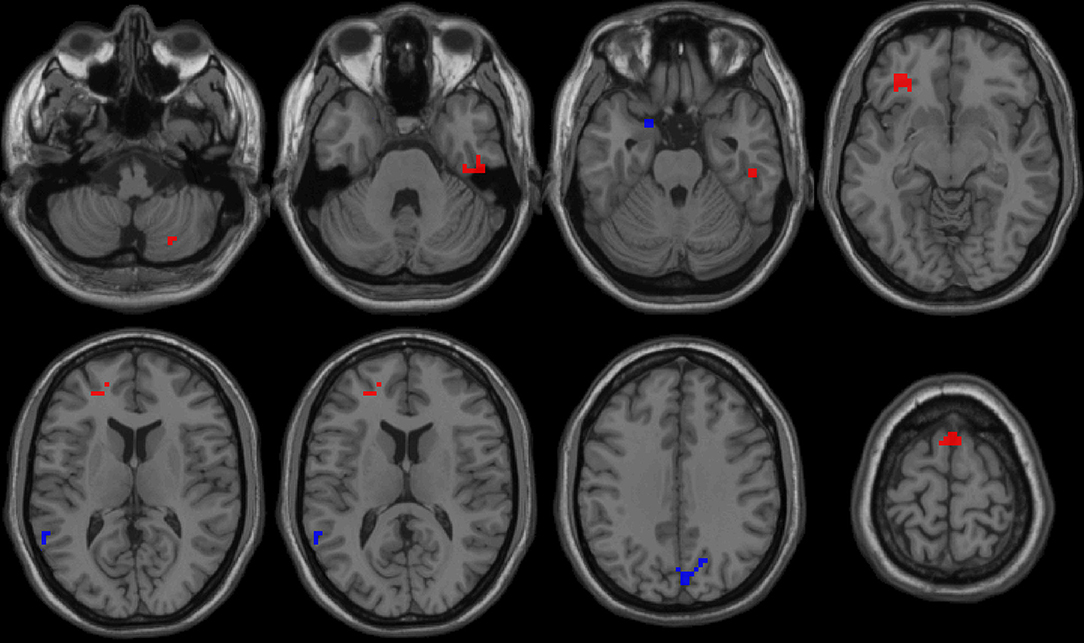
Figure 2. fALFF differences between RRMS and HGs. RRMS, relapsing-remitting multiple sclerosis; HGs, healthy groups; R, right; L, left; fALFF, fractional amplitude of low-frequency fluctuation.
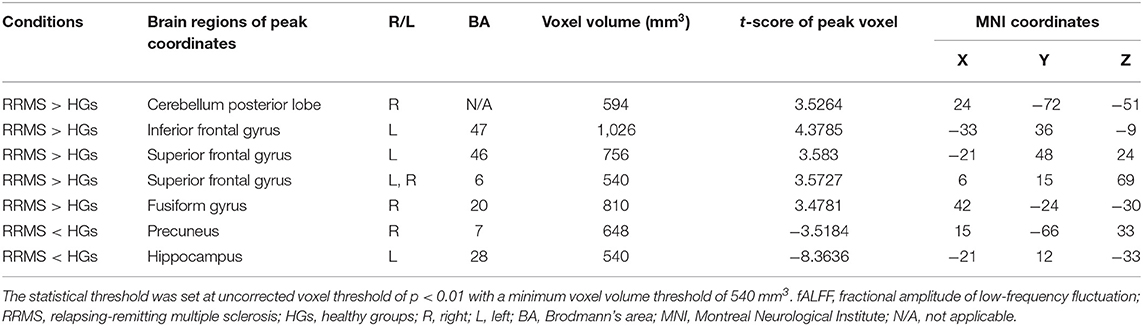
Table 2. fALFF differences between RRMS and HGs.
Pearson Linear Correlation
The mean fALFF values of these different areas were extracted (Figure 3) and used for Pearson linear correlation analysis. As shown in Figure 4, EDSS revealed a negative linear correlation with fALFF value in the bilateral supplementary motor area (BA 6) in the salience network (r = −0.395, p = 0.046), but no significant difference can be found after multiple testing. No other significant linear correlations between fALFF value in those different brain areas and the behavioral performances were found (p > 0.05).
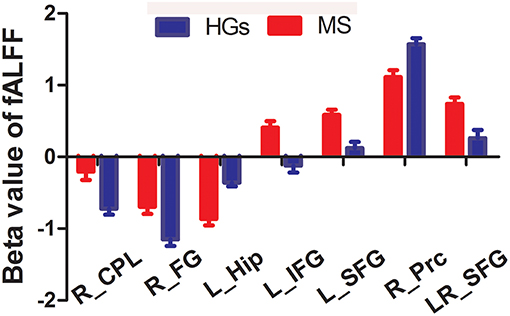
Figure 3. Beta value of between-group differences in fALFF. Data are mean ± standard error values. fALFF, fractional amplitude of low-frequency fluctuation; R, right; L, left; MS, multiple sclerosis; HGs, healthy groups; CPL, cerebellum posterior lobe; FG, fusiform gyrus; Hip, hippocampus; IFG, inferior frontal gyrus; SFG, superior frontal gyrus; Prc, precuneus.
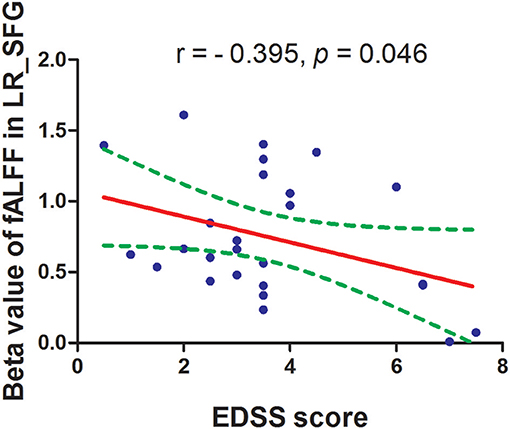
Figure 4. Pearson's correlation between EDSS score and beta value of caudate head. fALFF, fractional amplitude of low-frequency fluctuation; EDSS, Expanded Disability Status Scale.
High Sensitivity and Specificity
Since the different fALFF areas might be utilized as markers to separate the RRMS from the HGs, the mean fALFF values of these different areas were extracted and used for ROC curve to explore whether the fALFF have the potential ability to distinguish the RRMS from the HGs. In the present study, the ROC analysis revealed that the seven areas exhibiting abnormal fALFF values showed two good and five fair AUC values (0.77 ± 0.03, 0.729~0.822) to discriminate the two groups (Figures 5A,B; Table 3). Further diagnostic analysis demonstrated that the mean beta values of these brain areas demonstrated low-high degree of sensitivities (74.93% ± 12.52, 57.7~92.6%) and specificities (74.84% ± 13.39, 59.3~96.3%). Next, we investigated the discriminatory power of the combinations with more brain regions (≥2) and found that combining with more brain regions could improve the discriminatory power. Each of the four combinations with more than five brain regions exhibiting abnormal fALFF received the same best discriminatory power to distinguish the two groups with a sensitivity of 96.3% and a specificity of 88.5% (Figure 5C; Table 3). These findings indicate that the fALFF parameter may serve as a potential marker to distinguish the RRMS from the HGs.
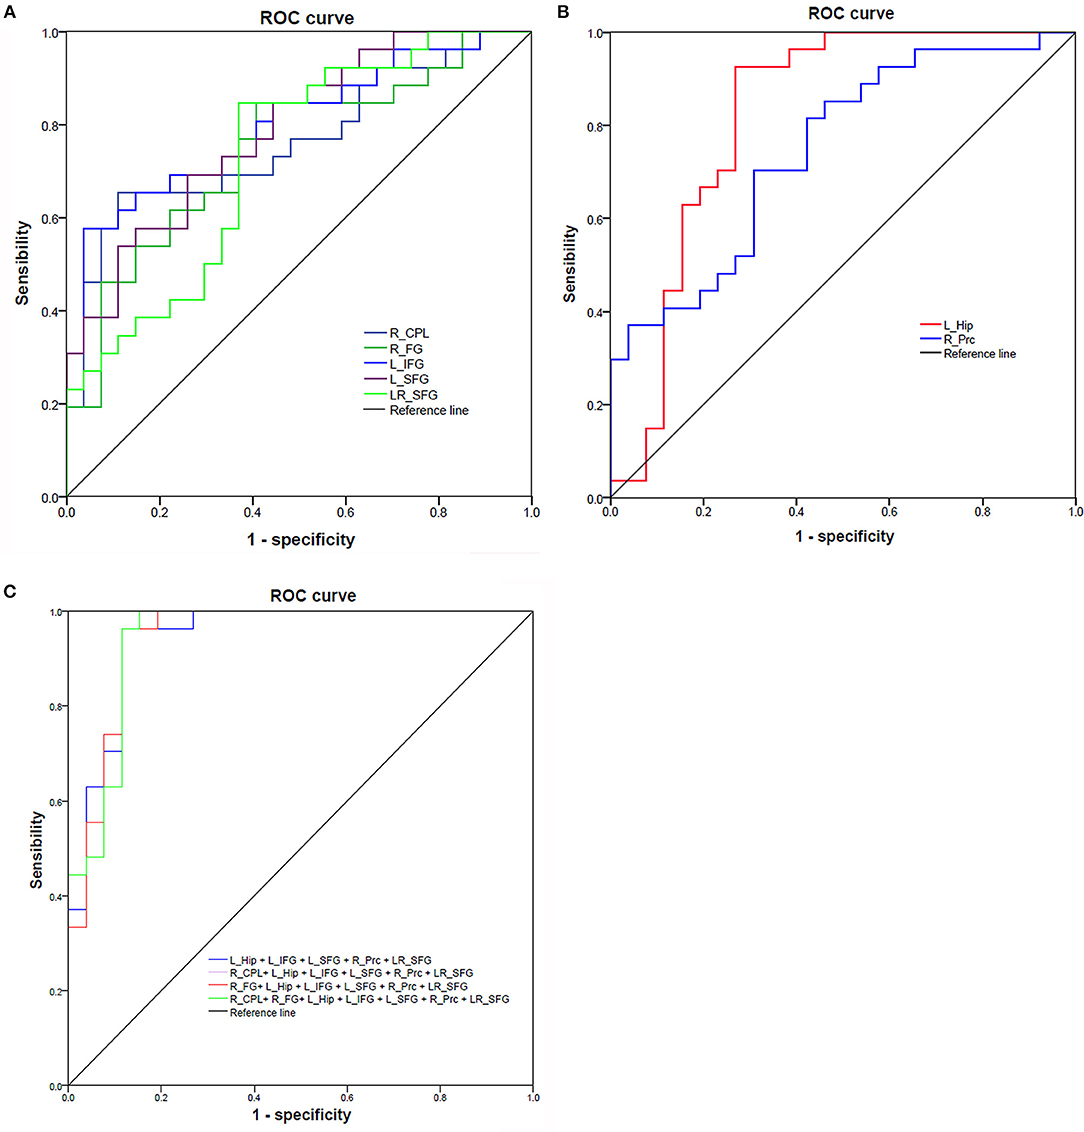
Figure 5. ROC curve of mean fALFF values value of those different brain regions between RRMS and HGs. ROC curve of increased (A) and decreased (B) fALFF differences and four combinations with more than five brain regions (C). ROC, receiver operating characteristic; R, right; L, left; RRMS, relapsing-remitting multiple sclerosis; HGs, healthy groups; CPL, cerebellum posterior lobe; FG, fusiform gyrus; Hip, hippocampus; IFG, inferior frontal gyrus; SFG, superior frontal gyrus; Prc, precuneus.
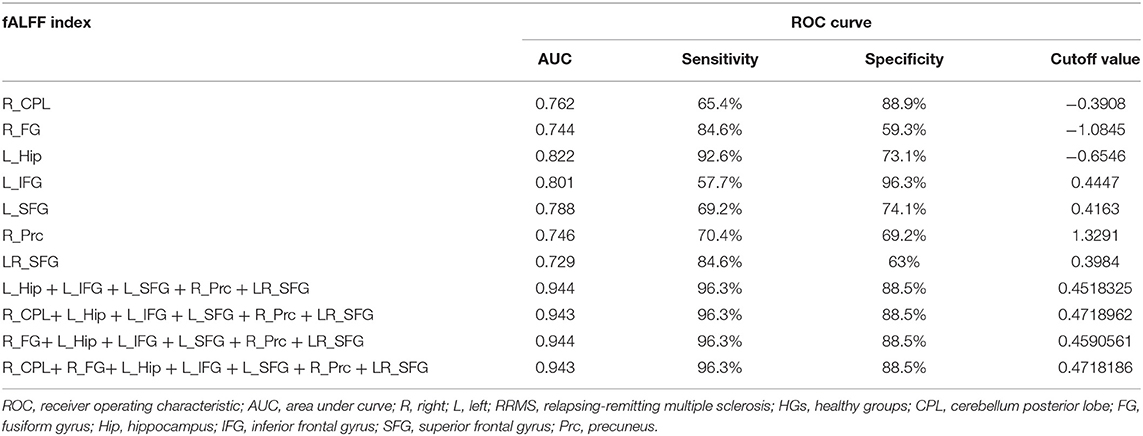
Table 3. ROC curve analysis for the fALFF difference in brain areas between RRMS and HGs.
Discussion
The study is the first to utilize the fALFF analysis to identify the RRMS-related abnormal regional brain activity and their correlations with demographic characteristics. RRMS was associated with widespread changes in brain areas, including cerebellum, orbitofrontal cortex, dorsolateral prefrontal cortex, supplementary motor area, and fusiform gyrus with higher fALFF values, and left hippocampus and precuneus in the occipital cortex with lower fALFF values. Recently, the ROC curve analysis has been widely applied into the exploration of the reliability and the potential of one neuroimaging approach to serve as an indicator in distinguishing one group from the other group (8, 16, 29). In the present study, the ROC curve revealed excellent AUC values for the combined areas, and further diagnostic analysis demonstrated that these combinations alone discriminated between the RRMS and the healthy subjects, with high degree of sensitivities and specificities. Thus, the resting-state fALFF analysis might serve as a potential biological indicator to characterize the abnormal regional brain activity in RRMS. Furthermore, in the RRMS group, the supplementary motor area negatively correlated with EDSS score, which may suggest that the motor cortex could predict the disability status of RRMS.
In the present study we found that the altered regional brain activity of the brain areas mainly manifested as increased fALFF values. There are two prevalent speculations (32). One explanation of this finding could be interpreted as brain compensation, in which the brain utilizes additional resources to help achieve the same level of performance as before. RRMS, disseminated in axonal degeneration and inflammatory demyelination in the central nervous system, is relative to the extensive white matter and gray matter damage (1, 2, 33). Another explanation of this finding could be interpreted as an enhanced neural effort to offset the noxious effects on the human brain function and structure.
RRMS is characterized by motor system disorder (1, 2), and extensive involvements of disease-related cortical changes may lead to several clinical symptoms, such as sensorimotor and cognitive deficits (2). The symptoms-related abnormal regional resting-state brain activity of RRMS may emerge ahead of the presence of visible brain lesions on T2WI (22). These regional areas covered the motor and visual systems. The cerebellum posterior lobe(s) works with cerebrum to complete several advanced cognitive and movement functions (34–36). The cerebellum posterior lobe is associated with regulation of coordinating movement (16, 23, 37). The cerebellar circuit has been associated with motor control function and motor behavior (32, 38). Abnormal regional resting-state brain activity, long-range functional connectivity, and gray matter atrophy in the motor systems (such as cerebellum) were also observed in the RRMS (39–41). The notion of dysfunctional neural integration in the cerebellum is supported by several positron emission tomography studies with decreased glucose metabolism in the bilateral cerebellum in early RRMS, which was ascribed to the remote effect of demyelinating lesions (42, 43). In support of these findings, our study showed altered regional brain activity in the cerebellum and supplementary motor area. Furthermore, the motor system correlated with the disability status of RRMS. Therefore, we speculated that the altered fALFF in the motor-related areas may be interpreted as functional deficit of the motor system caused by the RRMS, which may explain, at least partially, the motor system disorder of RRMS.
Cognitive function impairment may be involved with 43~70% of RRMS patients (44, 45). Previous studies primarily focused on how brain volume alteration (e.g., hippocampal) or T2 lesion load affect cognitive function (46, 47). These changes showed robust correlations with cognitive function (48, 49) and appear to be important predictors for cognitive function impairment in RRMS (50). In the present study, we explored how regional functional brain activity alterations of advanced cognitive function-related areas affect cognitive function. Here, we found fALFF differences in several cognitive-related areas (hippocampal, dorsolateral prefrontal lobe, and orbitofrontal cortex) in the RRMS relative to the HGs. The hippocampal and dorsolateral prefrontal areas are associated with advanced cognitive function, such as working memory (51–55). The orbitofrontal cortex (OFC), connected with prefrontal and deep structures known to mediate sensorimotor processing, motivation, and self-evaluation, is thought to be responsible for mediating the interactions between emotional processes and cognitive functions (56, 57) and play a significant role in fatigue, executive functions, attention, and motivation (58–60). Altered fALFF values of these advanced cognitive function-related areas may indicate cognition deficit of RRMS.
Conclusions
In summary, the fALFF parameter may serve as an early potential biological marker to describe the abnormal regional brain activity associated with RRMS, ahead of visible brain lesion. Our study demonstrated that RRMS is associated with abnormal regional brain activity deficits in motor- and cognitive-related areas. These findings may provide intriguing insights into guide tailored treatment decisions and help provide us with a more comprehensive understanding of the pathophysiology of RRMS. However, the small number of subjects may be a major limitation; a larger number of sample sizes are necessary to corroborate our findings.
Data Availability Statement
The raw data supporting the conclusions of this manuscript will be made available by the authors, without undue reservation, to any qualified researcher.
Ethics Statement
All volunteers participated voluntarily and were explained the purposes, methods, and potential risks. Before the MRI session, all subjects voluntarily signed their informed consent form. This study was approved by the Human Research Ethics Committee of HwaMei Hospital, University of Chinese Academy of Sciences. No any additional considerations of the study in cases where vulnerable populations were involved (for example minors, persons with disabilities or endangered animal species).
Author Contributions
X-FD and JL conceived and designed the whole experiment. Q-FH and Y-JW collected the data. JL took responsibility for the integrity of the data, the accuracy of the data analysis, and the statistical data analysis. X-FD wrote the main manuscript text. All authors contributed to the final version of the paper and have read, as well as, approved the final manuscript.
Conflict of Interest
The authors declare that the research was conducted in the absence of any commercial or financial relationships that could be construed as a potential conflict of interest.
References
1. Vercellino M, Masera S, Lorenzatti M, Condello C, Merola A, Mattioda A, et al. Demyelination, inflammation, and neurodegeneration in multiple sclerosis deep gray matter. J Neuropathol Exp Neurol. (2009) 68:489–502. doi: 10.1097/NEN.0b013e3181a19a5a
2. Minagar A, Barnett MH, Benedict RH, Pelletier D, Pirko I, Sahraian MA, et al. The thalamus and multiple sclerosis: modern views on pathologic, imaging, and clinical aspects. Neurology. (2013) 80:210–9. doi: 10.1212/WNL.0b013e31827b910b
3. Rovaris M, Filippi M, Minicucci L, Iannucci G, Santuccio G, Possa F, et al. Cortical/subcortical disease burden and cognitive impairment in patients with multiple sclerosis. AJNR. (2000) 21:402–8. Available online at: http://www.ajnr.org/content/21/2/402
4. Vrenken H, Pouwels PJ, Geurts JJ, Knol DL, Polman CH, Barkhof F, et al. Altered diffusion tensor in multiple sclerosis normal-appearing brain tissue: cortical diffusion changes seem related to clinical deterioration. J Magn Reson Imaging. (2006) 23:628–36. doi: 10.1002/jmri.20564
5. Vrenken H, Geurts JJ, Knol DL, van Dijk LN, Dattola V, Jasperse B, et al. Whole-brain T1 mapping in multiple sclerosis: global changes of normal-appearing gray and white matter. Radiology. (2006) 240:811–20. doi: 10.1148/radiol.2403050569
6. Calabrese M, De Stefano N, Atzori M, Bernardi V, Mattisi I, Barachino L, et al. Detection of cortical inflammatory lesions by double inversion recovery magnetic resonance imaging in patients with multiple sclerosis. Arch Neurol. (2007) 64:1416–22. doi: 10.1001/archneur.64.10.1416
7. Geurts JJ, Pouwels PJ, Uitdehaag BM, Polman CH, Barkhof F, Castelijns JA. Intracortical lesions in multiple sclerosis: improved detection with 3D double inversion-recovery MR imaging. Radiology. (2005) 236:254–60. doi: 10.1148/radiol.2361040450
8. Dai XJ, Liu CL, Zhou RL, Gong HH, Wu B, Gao L, et al. Long-term total sleep deprivation decreases the default spontaneous activity and connectivity pattern in healthy male subjects: a resting-state fMRI study. Neuropsychiatr Dis Treat. (2015) 11:761–72. doi: 10.2147/NDT.S78335
9. Gao W, Jiao Q, Lu S, Zhong Y, Qi R, Lu D, et al. Alterations of regional homogeneity in pediatric bipolar depression: a resting-state fMRI study. BMC Psychiatry. (2014) 14:222. doi: 10.1186/s12888-014-0222-y
10. Cordani C, Meani A, Esposito F, Valsasina P, Colombo B, Pagani E, et al. Imaging correlates of hand motor performance in multiple sclerosis: A multiparametric structural and functional MRI study. Mult Scler. (2019) 18:1352458518822145. doi: 10.1177/1352458518822145
11. Plata-Bello J, Pérez-Martín Y, Castañón-Pérez A, Modroño C, Hernández-Martín E, González-Platas M, et al. The relationship between amplitude of low frequency fluctuations and gray matter volume of the mirror neuron system: differences between low disability multiple sclerosis patients and healthy controls. IBRO Rep. (2018) 5:60–6. doi: 10.1016/j.ibror.2018.09.002
12. van Geest Q, Boeschoten RE, Keijzer MJ, Steenwijk MD, Pouwels PJ, Twisk JW, et al. Fronto-limbic disconnection in patients with multiple sclerosis and depression. Mult Scler. (2019) 25:715–26. doi: 10.1177/1352458518767051
13. Biswal B, Yetkin FZ, Haughton VM, Hyde JS. Functional connectivity in the motor cortex of resting human brain using echo-planar MRI. Mag Reson Med. (2010) 34:537–41. doi: 10.1002/mrm.1910340409
14. Zang YF, He Y, Zhu CZ, Cao QJ, Sui MQ, Liang M, et al. Altered baseline brain activity in children with ADHD revealed by resting-state functional MRI. Brain Dev. (2007) 29:83–91. doi: 10.1016/j.braindev.2006.07.002
15. Fox MD, Raichle ME. Spontaneous fluctuations in brain activity observed with functional magnetic resonance imaging. Nat Rev Neurosci. (2007) 8:700–11. doi: 10.1038/nrn2201
16. Dai XJ, Nie X, Liu X, Pei L, Jiang J, Peng DC, et al. Gender differences in regional brain activity in patients with chronic primary insomnia: evidence from a resting-state fmri study. J Clin Sleep Med. (2016) 12:363–74. doi: 10.5664/jcsm.5586
17. Zou QH, Zhu CZ, Yang Y, Zuo XN, Long XY, Cao QJ, et al. An improved approach to detection of amplitude of low-frequency fluctuation (ALFF) for resting-state fMRI: fractional ALFF. J Neurosci Methods. (2008) 172:137–41. doi: 10.1016/j.jneumeth.2008.04.012
18. Liu CH, Ma X, Wu X, Fan TT, Zhang Y, Zhou FC, et al. Resting-state brain activity in major depressive disorder patients and their siblings. J Affect Disord. (2013) 149:299–306. doi: 10.1016/j.jad.2013.02.002
19. Hoptman MJ, Zuo XN, Butler PD, Javitt DC, D'Angelo D, Mauro CJ, et al. Amplitude of low-frequency oscillations in schizophrenia: a resting state fMRI study. Schizophr Res. (2010) 117:13–20. doi: 10.1016/j.schres.2009.09.030
20. Huang M, Lu S, Yu L, Li L, Zhang P, Hu J, et al. Altered fractional amplitude of low frequency fluctuation associated with cognitive dysfunction in first-episode drug-naive major depressive disorder patients. BMC Psychiatry. (2017) 17:11. doi: 10.1186/s12888-016-1190-1
21. Yang L, Yan Y, Wang Y, Hu X, Lu J, Chan P, et al. Gradual disturbances of the amplitude of low-frequency fluctuations (ALFF) and fractional ALFF in Alzheimer spectrum. Front Neurosci. (2018) 12:975. doi: 10.3389/fnins.2018.00975
22. Liu Y, Meng B, Zeng C, Wang J, Li Y, Yin P, et al. Abnormal baseline brain activity in patients with multiple sclerosis with simple spinal cord involvement detected by resting-state functional magnetic resonance imaging. J Comput Assist Tomogr. (2015) 39:866–75. doi: 10.1097/RCT.0000000000000299
23. Dai XJ, Gong HH, Wang YX, Zhou FQ, Min YJ, Zhao F, et al. Gender differences in brain regional homogeneity of healthy subjects after normal sleep and after sleep deprivation: a resting-state fMRI study. Sleep Med. (2012) 13:720–7. doi: 10.1016/j.sleep.2011.09.019
24. Yan CG, Wang XD, Zuo XN, Zang YF. DPABI: data processing & analysis for (resting-state) brain imaging. Neuroinformatics. (2016) 14:339–51. doi: 10.1007/s12021-016-9299-4
25. Satterthwaite TD, Elliott MA, Gerraty RT, Ruparel K, Loughead J, Calkins ME, et al. An improved framework for confound regression and filtering for control of motion artifact in the preprocessing of resting-state functional connectivity data. Neuroimage. (2013) 64:240–56. doi: 10.1016/j.neuroimage.2012.08.052
26. Yan CG, Cheung B, Kelly C, Colcombe S, Craddock RC, Di Martino A, et al. A comprehensive assessment of regional variation in the impact of head micromovements on functional connectomics. Neuroimage. (2013) 76:183–201. doi: 10.1016/j.neuroimage.2013.03.004
27. Van Dijk KR, Sabuncu MR, Buckner RL. The influence of head motion on intrinsic functional connectivity MRI. Neuroimage. (2012) 59:431–8. doi: 10.1016/j.neuroimage.2011.07.044
28. Power JD, Barnes KA, Snyder AZ, Schlaggar BL, Petersen SE. Spurious but systematic correlations in functional connectivity MRI networks arise from subject motion. Neuroimage. (2012) 59:2142–54. doi: 10.1016/j.neuroimage.2011.10.018
29. Li HJ, Dai XJ, Gong HH, Nie X, Zhang W, Peng DC. Aberrant spontaneous low-frequency brain activity in male patients with severe obstructive sleep apnea revealed by resting-state functional MRI. Neuropsychiatr Dis Treat. (2015) 11:207–14. doi: 10.2147/NDT.S73730
30. Chen L, Qi X, Zheng J. Altered regional cortical brain activity in healthy subjects after sleep deprivation: a functional magnetic resonance imaging study. Front Neurol. (2018) 9:588. doi: 10.3389/fneur.2018.00588
31. Dai XJ, Liu BX, Ai S, Nie X, Xu Q, Hu J, et al. Altered inter-hemispheric communication of default-mode and visual networks underlie etiology of primary insomnia : altered inter-hemispheric communication underlie etiology of insomnia. Brain Imaging Behav. (2019). doi: 10.1007/s11682-019-00064-0
32. Luo X, Guo L, Dai XJ, Wang Q, Zhu W, Miao X, et al. Abnormal intrinsic functional hubs in alcohol dependence: evidence from a voxelwise degree centrality analysis. Neuropsychiatr Dis Treat. (2017) 13:2011–20. doi: 10.2147/NDT.S142742
33. Prinster A, Quarantelli M, Orefice G, Lanzillo R, Brunetti A, Mollica C, et al. Grey matter loss in relapsing-remitting multiple sclerosis: a voxel-based morphometry study. Neuroimage. (2006) 29:859–67. doi: 10.1016/j.neuroimage.2005.08.034
34. Parvizi J, Anderson SW, Martin CO, Damasio H, Damasio AR. Pathological laughter and crying: a link to the cerebellum. Brain. (2001) 124:1708–19. doi: 10.1093/brain/124.9.1708
35. Yoo SS, Teh EK, Blinder RA, Jolesz FA. Modulation of cerebellar activities by acupuncture stimulation: evidence from fMRI study. Neuroimage. (2004) 22:932–40. doi: 10.1016/j.neuroimage.2004.02.017
36. Desmond J, Marvel C. Cognition: cerebellum role. Encyc Neurosci. (2009) 2:1079–85. doi: 10.1016/B978-008045046-9.00411-3
37. Sullivan EV, Rosenbloom MJ, Pfefferbaum A. Pattern of motor and cognitive deficits in detoxified alcoholic men. Alcohol Clin Exp Res. (2000) 24:611–21. doi: 10.1111/j.1530-0277.2000.tb02032.x
38. Rzepecki-Smith CI, Meda SA, Calhoun VD, Stevens MC, Jafri MJ, Astur RS, et al. Disruptions in functional network connectivity during alcohol intoxicated driving. Alcohol Clin Exp Res. (2010) 34:479–87. doi: 10.1111/j.1530-0277.2009.01112.x
39. Dogonowski AM, Andersen KW, Madsen KH, Sorensen PS, Paulson OB, Blinkenberg M, et al. Multiple sclerosis impairs regional functional connectivity in the cerebellum. Neuroimage Clin. (2014) 4:130–8. doi: 10.1016/j.nicl.2013.11.005
40. Dogonowski AM, Siebner HR, Sorensen PS, Wu X, Biswal B, Paulson OB, et al. Expanded functional coupling of subcortical nuclei with the motor resting-state network in multiple sclerosis. Mult Scler. (2013) 19:559–66. doi: 10.1177/1352458512460416
41. Cruz Gomez AJ, Ventura Campos N, Belenguer A, Avila C, Forn C. Regional brain atrophy and functional connectivity changes related to fatigue in multiple sclerosis. PLoS ONE. (2013) 8:e77914. doi: 10.1371/journal.pone.0077914
42. Blinkenberg M, Rune K, Jensen CV, Ravnborg M, Kyllingsbaek S, Holm S, et al. Cortical cerebral metabolism correlates with MRI lesion load and cognitive dysfunction in MS. Neurology. (2000) 54:558–64. doi: 10.1212/WNL.54.3.558
43. Derache N, Marie RM, Constans JM, Defer GL. Reduced thalamic and cerebellar rest metabolism in relapsing-remitting multiple sclerosis, a positron emission tomography study: correlations to lesion load. J Neurol Sci. (2006) 245:103–9. doi: 10.1016/j.jns.2005.09.017
44. Chiaravalloti ND, DeLuca J. Cognitive impairment in multiple sclerosis. Lancet Neurol. (2008) 7:1139–51. doi: 10.1016/S1474-4422(08)70259-X
45. Filippi M, Rocca MA. MRI and cognition in multiple sclerosis. Neurol Sci. (2010) 31:S231–4. doi: 10.1007/s10072-010-0367-5
46. Langdon DW. Cognition in multiple sclerosis. Curr Opin Neurol. (2011) 24:244–9. doi: 10.1097/WCO.0b013e328346a43b
47. Pinter D, Sumowski J, DeLuca J, Fazekas F, Pichler A, Khalil M, et al. Higher education moderates the effect of T2 lesion load and third ventricle width on cognition in multiple sclerosis. PLoS ONE. (2014) 9:e87567. doi: 10.1371/journal.pone.0087567
48. Filippi M, Rocca MA, Benedict RH, DeLuca J, Geurts JJ, Rombouts SA, et al. The contribution of MRI in assessing cognitive impairment in multiple sclerosis. Neurology. (2010) 75:2121–8. doi: 10.1212/WNL.0b013e318200d768
49. Grassiot B, Desgranges B, Eustache F, Defer G. Quantification and clinical relevance of brain atrophy in multiple sclerosis: a review. J Neurol. (2009) 256:1397–412. doi: 10.1007/s00415-009-5108-4
50. Lazeron RH, Boringa JB, Schouten M, Uitdehaag BM, Bergers E, Lindeboom J, et al. Brain atrophy and lesion load as explaining parameters for cognitive impairment in multiple sclerosis. Mult Scler. (2005) 11:524–31. doi: 10.1191/1352458505ms1201oa
51. Lansink CS, Goltstein PM, Lankelma JV, McNaughton BL, Pennartz CM. Hippocampus leads ventral striatum in replay of place-reward information. PLoS Biol. (2009) 7:e1000173. doi: 10.1371/journal.pbio.1000173
52. Pennartz CM, Ito R, Verschure PF, Battaglia FP, Robbins TW. The hippocampal-striatal axis in learning, prediction and goal-directed behavior. Trends Neurosci. (2011) 34:548–59. doi: 10.1016/j.tins.2011.08.001
53. Singer AC, Frank LM. Rewarded outcomes enhance reactivation of experience in the hippocampus. Neuron. (2009) 64:910–21. doi: 10.1016/j.neuron.2009.11.016
54. Gao L, Bai L, Zhang Y, Dai XJ, Netra R, Min Y, et al. Frequency-dependent changes of local resting oscillations in sleep-deprived brain. PLoS ONE. (2015) 10:e0120323. doi: 10.1371/journal.pone.0120323
55. Chuah YML, Venkatraman V, Dinges DF, Chee MWL. The neural basis of interindividual variability in inhibitory efficiency after sleep deprivation. J Neurosci. (2006) 26:7156–62. doi: 10.1523/JNEUROSCI.0906-06.2006
56. Etkin A, Egner T, Kalisch R. Emotional processing in anterior cingulate and medial prefrontal cortex. Trends Cogn Sci. (2011) 15:85–93. doi: 10.1016/j.tics.2010.11.004
57. Libedinsky C, Smith DV, Teng CS, Namburi P, Chen VW, Huettel SA, et al. Sleep deprivation alters valuation signals in the ventromedial prefrontal cortex. Front Behav Neurosci. (2011) 5:70. doi: 10.3389/fnbeh.2011.00070
58. Hong SB, Kim JW, Choi EJ, Kim HH, Suh JE, Kim CD, et al. Reduced orbitofrontal cortical thickness in male adolescents with internet addiction. Behav Brain Funct. (2013) 9:11. doi: 10.1186/1744-9081-9-11
59. Pardini M, Bonzano L, Roccatagliata L, Mancardi GL, Bove M. The fatigue-motor performance paradox in multiple sclerosis. Sci Rep. (2013) 3:2001. doi: 10.1038/srep02001
Keywords: cognitive function, fractional amplitude of low-frequency fluctuation, functional magnetic resonance imaging, motor system, multiple sclerosis, receiver operating characteristic
Citation: Du X-F, Liu J, Hua Q-F and Wu Y-J (2019) Relapsing-Remitting Multiple Sclerosis Is Associated With Regional Brain Activity Deficits in Motor- and Cognitive-Related Brain Areas. Front. Neurol. 10:1136. doi: 10.3389/fneur.2019.01136
Received: 13 March 2019; Accepted: 10 October 2019;
Published: 26 November 2019.
Edited by:
Pamela Ann McCombe, University of Queensland, AustraliaReviewed by:
Katie McMahon, Queensland University of Technology, AustraliaXi-jian Dai, The Chinese University of Hong Kong, China
Sizhi Ai, The First Affiliated Hospital of Xinxiang Medical University, China
Copyright © 2019 Du, Liu, Hua and Wu. This is an open-access article distributed under the terms of the Creative Commons Attribution License (CC BY). The use, distribution or reproduction in other forums is permitted, provided the original author(s) and the copyright owner(s) are credited and that the original publication in this journal is cited, in accordance with accepted academic practice. No use, distribution or reproduction is permitted which does not comply with these terms.
*Correspondence: Jiao Liu, MTM0NTYxNTUwMDlAMTYzLmNvbQ==