 Taeho Kim
 Phuc Nguyen
 Nhat Pham
 Nam Bui1
 Hoang Truong
 Tam Vu
- 1Department of Computer Science, University of Colorado, Boulder, CO, United States
- 2Department of Computer Science and Engineering, University of Texas at Arlington, Arlington, TX, United States
- 3Department of Computer Science, University of Oxford, Oxford, United Kingdom
One-fourths of the patients have medication-resistant seizures and require seizure detection and treatment continuously to cope with sudden seizures. Seizures can be detected by monitoring the brain and muscle activities, heart rate, oxygen level, artificial sounds, or visual signatures through EEG, EMG, ECG, motion, or audio/video recording on the human head and body. In this article, we first discuss recent advances in seizure sensing, signal processing, time- or frequency-domain analysis, and classification algorithms to detect and classify seizure stages. Then, we show a strong potential of applying recent advancements in non-invasive brain stimulation technology to treat seizures. In particular, we explain the fundamentals of brain stimulation approaches, including (1) transcranial magnetic stimulation (TMS), (2) transcranial direct current stimulation (tDCS), (3) transcranial focused ultrasound stimulation (tFUS), and how to use them to treat seizures. Through this review, we intend to provide a broad view of both recent seizure diagnoses and treatments. Such knowledge would help fresh and experienced researchers to capture the advancements in sensing, detection, classification, and treatment seizures. Last but not least, we provide potential research directions that would attract seizure researchers/engineers in the field.
1. Introduction
Epileptic seizure is a transient occurrence of signs or symptoms due to abnormal excessive or synchronous neuronal activity in the brain (1). Currently, about 2.3 million adults and more than 450,000 children and adolescents in the United States live with epilepsy. About 150,000 people are diagnosed with epileptic seizures each year (2). Epileptic seizures all start in the brain with sudden abnormal electrical discharges1. Among patients with epileptic seizures, two-thirds can control seizures through anti-epileptic medication, and another 8-10% could benefit from surgery. The remaining 25% have medication-resistant epileptic seizures and experience sudden seizure symptoms (3). Therefore, it is essential to notify the patient's medication-resistant epileptic seizure to the caretaker and analyze the pattern of related signals before, during, and after the seizure onset.
This article contributes to organizing seizure detection, classification, and treatment. We also provide potential research directions that would attract seizure researchers/engineers in the field. The existing seizure surveys reviewed seizure detection (4), classification (5–8), or treatment (9, 10). This paper discusses state-of-the-art techniques for (1) capturing the physiology signals of seizures, (2) detecting and classifying types of seizures, (3) seizures therapy, and (4) the challenges and potential seizure-related research directions.
First, accurately and reliably capturing physiology signals related to seizure is a critical step for designing robust seizure detection systems. Monitoring brain activity signal (e.g., Electroencephalogram, EEG) is the most common method to detect seizures. The EEG recording of patients with epileptic seizures has two categories of abnormal activity: interictal, abnormal signals recorded between epileptic seizures, and ictal, the activity recorded during an epileptic seizure (6). We focused on epileptic seizure detection and considered interictal and ictal EEG signals except postictal state to detect abnormal EEG signals. The EEG signature of an inter-ictal activity is occasional transient waveforms, while that of an ictal activity is composed of a continuous discharge of polymorphic waveforms of variable amplitude and frequency (11). There are two kinds of traditional EEG recording techniques: Invasive EEG and scalp EEG. The invasive EEG recording is necessary to do surgery to implant the electrodes in the brain. In the case of the scalp EEG, the user is required to attach multiple electrodes that are connecting to a monitoring device through many wires. Therefore, Patients have to suffer the inconvenience of inserting something into the body or attaching multiple electrodes. Also, for the scalp EEG, a trained physician does such a complicated setup, and the studies are often conducted in hospitals. Besides the traditional EEG-based approach, epileptic seizures can also be detected through eye (lid) movement, heart rate, blood pressure, arterial oxygenation (SpO2), respiration, sweating, and so on (4). These activities can be captured from physiology signals, including Electrooculography (EOG), electrocardiography (ECG), electromyography (EMG), electrodermal activity (EDA), motion, audio/video recording, and multimodality sensing approaches (4, 7).
We also discuss in detail the key components of these state of the art systems to provide a detailed picture of recent efforts on extracting these physiological signals for seizure detection. These systems often include some essential components as following: (1) signal acquisition, (2) signal processing, (3) feature extraction. The signal acquisition component is designed to capture physiological signals that are directly or indirectly related to seizures (4, 12). These signals often contain a lot of noises, which will be processed further using novel, yet complex algorithms to extract the signal of interests (13, 14). Next, many recent efforts have focused on building a stable setup features representing the presence of seizures to improve the detection accuracy (15–18). Hybrid time-frequency analysis features are often used to overcome the impact of human motion artifacts as well as to improve the system sensitivities (19–21). Specifically, wavelet transform analysis (WT) approaches are employed (22) to provide detailed resolutions of the seizure-related signatures on both time and frequency domains (23).
Second, after capturing the physiology signals, it is important to accurately detect and classify the type of detected seizures (5, 6, 24). Existing seizure classification methods primarily include classical machine learning approaches [e.g., support vector machine (SVM)] and novel deep-learning solutions [e.g., artificial neural network (ANN) (7)]. SVM divides data belonging to two groups into a hyperplane (25, 26). The original SVM is a binary classification, whereas the class for seizure is divided into at least three (focal seizure, generalized seizure, and healthy). State of the art SVM-approaches only can classify two classes of seizures (seizure vs. non-seizure) with high accuracy (27, 28). It is not sufficient for seizure classification. Multiclass SVM methods have been used by splitting one multiclass problem into several binary classification problems (29, 30). Although many related works have used multiclass SVM to classify various seizure types, it is impractical due to the low classification accuracy and many false alarms (29, 31, 32). Many recent efforts have focused on developing more complex learning algorithms. Especially, deep-learning solutions to detect a variety of seizures attract much attention from researchers (33). The classification performance depends on how the system structures hidden layers, such as multilayer perceptron neural network (MLPNN), adaptive neuro-fuzzy inference system (ANFIS), radial basis function neural network (RBFNN), convolutional neural network (CNN), and recurrent neural network (RNN) (34). ANN is the preferred method over SVM because it is not affected by the number of classes.
Third, after detecting and classifying different types of seizures, treatment methods need to be developed to reduce or remove the impact of seizures on patients' normal life. Even though it is difficult to find existing works in this direction, we believe that these can be done by exploring the uses of state of the art brain stimulation technique. We also discuss how the recent development in brain stimulation and interventions would help to treat seizures, such as decreasing cortical excitability with low-frequency magnetic stimulation (35) or counterbalancing the neuronal hyper-excitation through electric neural modulation (36). In particular, brain stimulation has been noted as an alternative to drug therapy to decrease the frequency of seizure or reduce the symptom. It is mostly divided into invasive and non-invasive. Although the invasive brain stimulation stimulates the problematic seizure part of the brain directly and provides a fast and accurate effect, it is necessary to do surgery to implant the stimulator inside the brain. It is very costly and may damage the brain during the operation. Thus, many patients are reluctant to this type of therapy. For non-invasive brain stimulation, there are two principal methods: transcranial magnetic stimulation (TMS) and transcranial direct current stimulation (tDCS) (10). TMS uses the principle of electromagnetic induction to focus induced current in the brain (37). The magnetic fields generated by TMS penetrate human tissue painlessly and induces electric currents that can depolarize neurons or their axons in the brain (38). tDCS is one of transcranial electrical stimulation (tES) and applies low-amplitude direct currents via scalp electrodes and penetrate the skull to enter the brain (37). Unlike other tES methods, tDCS delivers a sustained current (39) and can make the therapeutic effect through the sustained current. However, TMS and tDCS provide low spatial resolutions, which lead to modulate neuronal activity not only in the target but also in surrounding circuits (40). Transcranial focused ultrasound (tFUS) is emerging as a method that can complement the low degree of spatial focality of TMS and tDCS. We examine how brain stimulation can reduce seizures based on these three approaches.
Last but not least, inspiring from the recent development in seizure detection and classification method, we found that more efforts are needed to put into the following research direction to realize a complete, reliable, and low-cost seizure detection systems. First, we believe that the state-of-the-art seizure detection system performance is sufficient to build a robust and reliable wearable device that could be used for daily seizure monitoring and classification. Second, as the seizure signatures are detected and monitor, the recent brain-stimulation techniques can be used to reduce seizure. We also suggest different directions on how to build reliable and wearable seizure therapy systems. Lastly, we discuss how to build an integrated monitoring and stimulating seizure.
In the following, we first describe the state-of-the-art approach to capture physiological signals related to seizures in section 2 reliably. Next, we discuss recent efforts on building machine learning techniques to detect and classify seizures in section 3. In section 4, we discuss the different approaches to seizure therapy. Lastly, we summarize the overall contents of this article and provide the prospect of future research.
2. Analyzing Physiology Signals of Epileptic Seizure
Seizure detection and therapy systems generally consist of five processes: (1) signal acquisition, (2) signal processing, (3) feature extraction, (4) classification, and (5) therapy (5, 6, 24). The processes mentioned above are illustrated in Figure 1. In this section, we discuss the needed signal processing steps to analyze the captured physiology signals of epileptic seizures. Upon the processed data, detection and classification algorithms could be built.
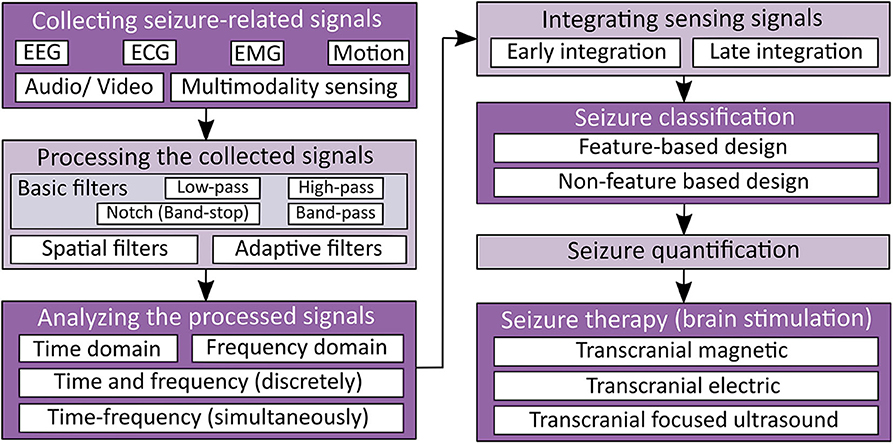
Figure 1. Seizure detection and therapy overview.
2.1. Collecting Seizure-Related Signals
A seizure can be detected by monitoring various physiological signals from the human body through (1) EEG, (2) EMG, (3) ECG, (4) motion, and (5) audio/video recording (4, 7). Among these physiological signals, EEG is the most popular choice because of its advantages, such as (1) the ability to capture the neural activation of the brain, (2) high temporal, and (3) spatial resolutions. However, the main limitation of traditional EEG measurement lies in its obtrusiveness and complicated setup, so it can only be performed in a controlled environment by a specialized technician. Also, some kinds of seizures like generalized onset motor seizures can be detected more clearly by measuring body movements or other physiological signals (18, 41). Thus, researchers have developed seizure detection devices using various non-EEG signals as well as EEG signals (17, 18). In the following discussion, we discuss how these recorded signals are used to detect seizure events by dividing into EEG and non-EEG methods.
2.1.1. Electroencephalogram (EEG)-Based Approach
EEG recording is the most common method to get the biosignals for seizure detection. It measures the electrical activity of the brain. Since epileptic seizure activities appear as abnormal signal patterns on the EEG, we can use the EEG signal variation to detect seizures. EEG signals with paroxysmal abnormality show spikes, spike-and-slow waves, and sharp waves in Figure 2A. Spikes are the primary form, and their time length is 20–70 ms. The spike-and-slow waves appear after spike-wave, and their time length is 200–500 ms. Sharp waves are similar to spike-wave, but their time length is 70–200 ms (5).
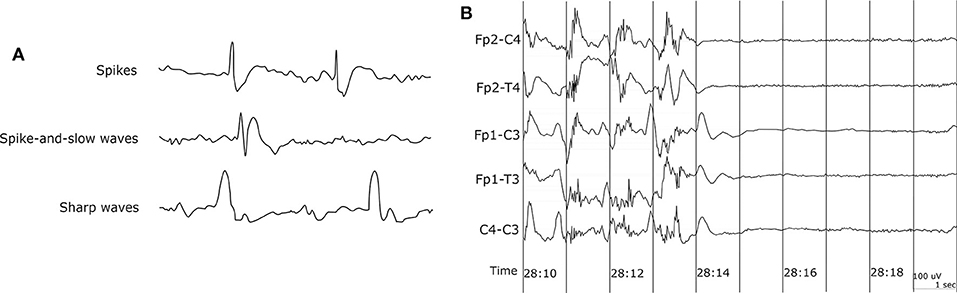
Figure 2. EEG waveform. (A) EEG waveform with paroxysmal abnormality. (B) Sudden death in epilepsy recorded in ambulatory EEG (42).
The EEG recordings of patients with epileptic seizures show two categories of abnormal activity. Interictal has the abnormal signals recorded between epileptic seizures, and ictal is the activity recorded during an epileptic seizure (6). We focused on epileptic seizure detection and considered interictal and ictal EEG signals except postictal state to detect abnormal EEG signals. The EEG signature of an inter-ictal activity is occasional transient waveforms, while that of an ictal activity is composed of a continuous discharge of polymorphic waveforms of variable amplitude and frequency (11).
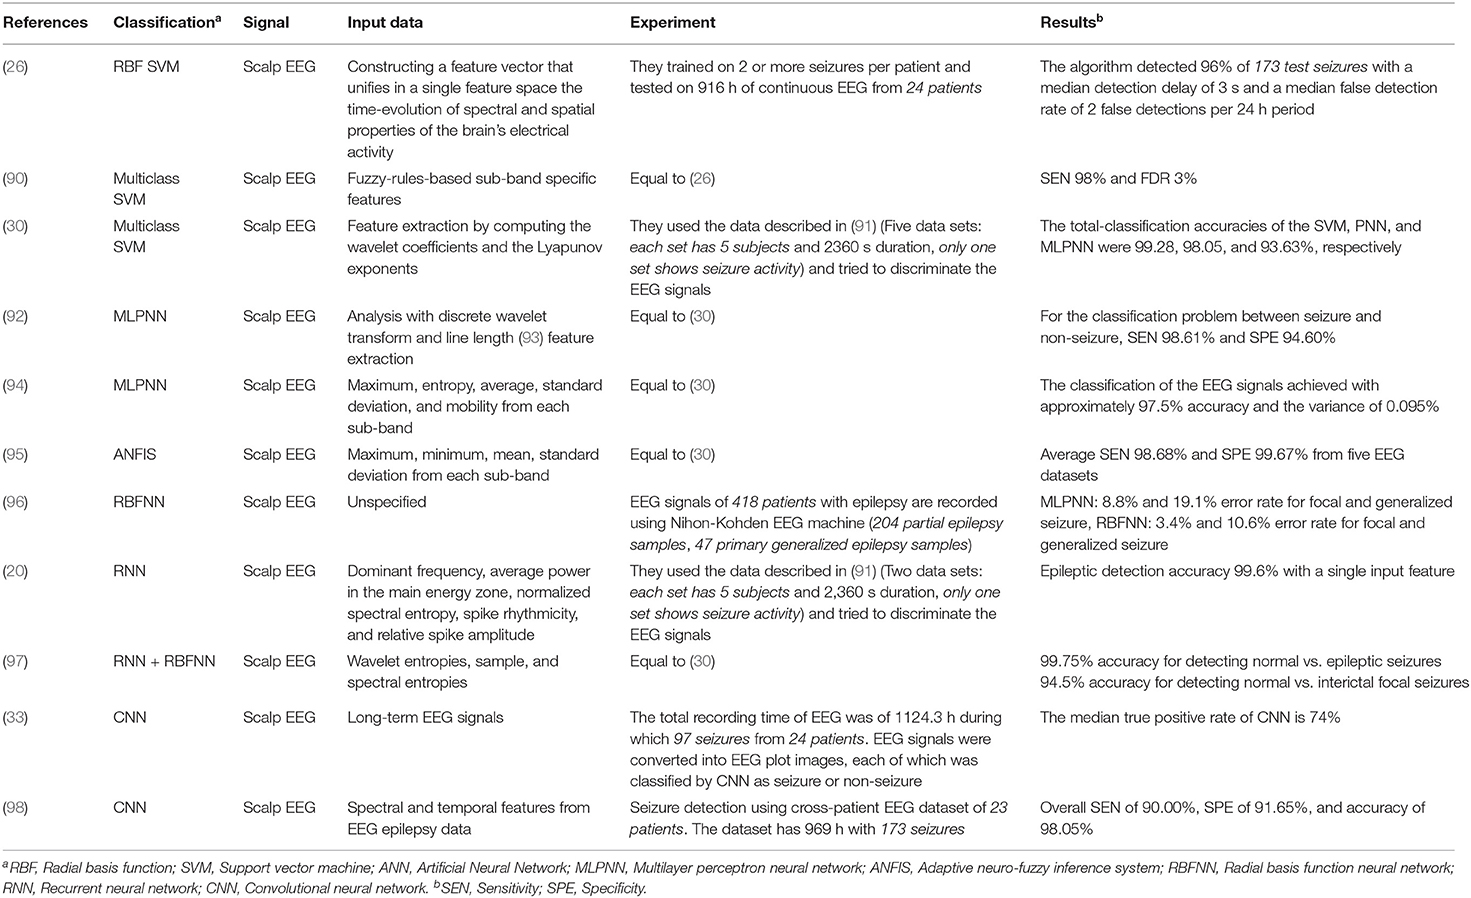
Many studies have been carried out for seizure detection using scalp EEG. Among them, we have selected and summarized some studies from past to recent which clearly explained the seizure detection procedure, as shown in Table 1. Attaching EEG electrodes on all parts of the scalp is reasonable because there are many types of seizures, and the initial location which was generated the abnormal EEG signal is different. However, it causes mobility impairment, increases the cost of the measuring device, and is inappropriate for patients who need continuous seizure monitoring.
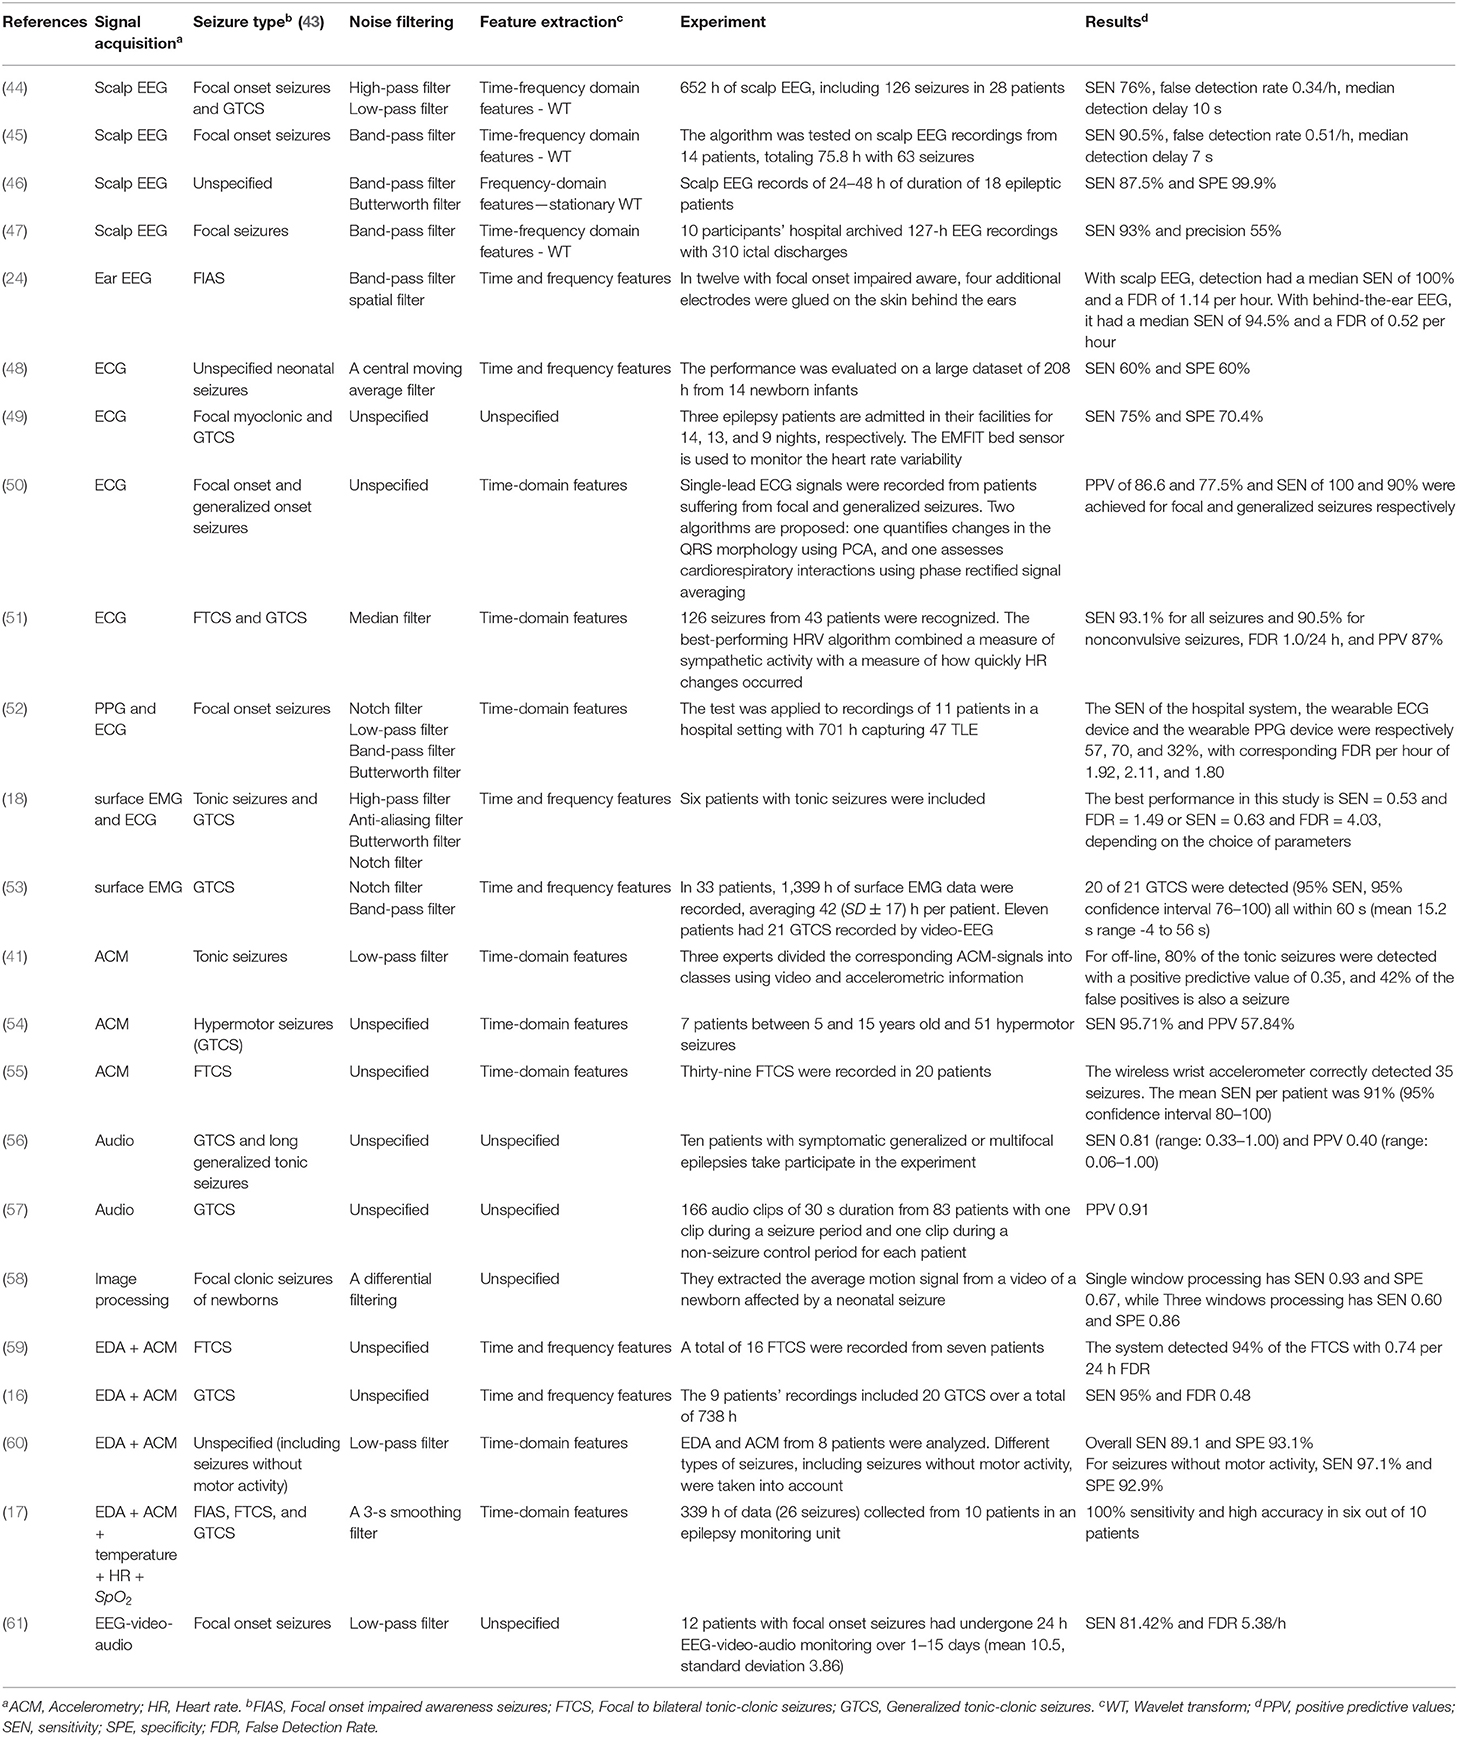
Table 1. Seizure detection depending on the signal types.
Capturing EEG signals around the ear is a promising finding which can minimize the obtrusiveness of conventional EEG methods. The evoked responses from the ear-EEG are typically 10–20 dB lower in amplitude than those of traditional scalp EEG recordings while maintaining a similar signal-to-noise ratio (SNR) (62). Mikkelsen et al. (63) compared 32 conventional scalp electrodes with 12 ear electrodes. The measured signal from the ear electrodes reflects the same cortical activity as that from nearby scalp electrodes. Bleichner et al. (63) also worked for the comparison between a traditional EEG cap setup and their around-the-ear electrode array (cEEGrid). They have shown that their system can capture meaningful EEG signals such as eye-closing alpha wave, sleep spindles, and epileptic spike-wave. Gu et al. (24) utilized the cross-head and unilateral channels from the behind-the-ear EEG. Temporal waveform and frequency content during seizures from behind-the-ear EEG visually resembled those from scalp EEG. Especially, this paper provides the coherence between the behind-the-ear EEG channel and the best match-up scalp EEG channel on 12 patients like Figure 3. McLean et al. (42) reported the sudden death in epilepsy recorded in ambulatory EEG. In Figure 2B, the seizure activity abruptly terminated, and the EEG became a flat line. The EEG variation graph of Figure 2B shows that these EEG channels may have significant patterns for detecting a seizure. Also, the EOG from LT-LC and RT-RC have similar morphology to that from Fp1-F7 and Fp2-F8, respectively.
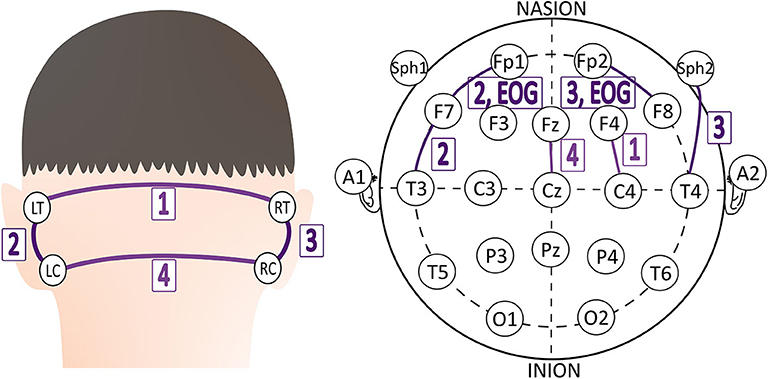
Figure 3. The best match-up scalp EEG channel of each behind-the-ear EEG channel on 12 patients (24).
2.1.2. ECG, EMG, Motion, Audio, and Video-Based Approach
EEG-based measurement usually implies that the sensors need to be attached to a human head for seizure defections. Also, EEG monitoring is prone to errors in interpreting complex signals of EEG and is mainly used to detect seizures from temporal lobe epilepsies (2, 64). Therefore, researchers have developed seizure detection devices with various other methods. Among the relatively recent studies, we tried to select papers, which use other signals more actively than EEG and follow the clear seizure detection procedure, as shown in Table 1. For example, contactless sensing devices such as mattress sensor [Emfit2, MP53], carry-on devices such as smartwatches or wrist devices [Cogan (65), Embrace (59), Inspyre4], smart textiles (Neuronaute5), and temporary tattoos (4) can be used to detect epilepsy. We found that ECG, EMG, motion, and audio/video recording approaches have been used to monitor epilepsy.
Electrocardiography (ECG) monitoring measures the electrical properties of the heart and detects heart rate (HR) and heart rate variability (HRV). Most of the generalized tonic-clonic seizures (GTCS) cause an increase in HR (66). Such events subsequently increase the risk of sudden unexpected death in epilepsy (SUDEP) (42). HRV is also useful to distinguish focal seizures with physical exercise (51). The most common pattern of HRV associated with focal onset impaired awareness seizures is an initial steep acceleration at the onset of the seizure (67). The HRV in temporal lobe seizures is different from that in psychogenic non-epileptic seizures (68). ECG can be used to detect a seizure. However, the accuracy and ability to detect a seizure early are still very limited.
Electromyography (EMG) monitoring measures electrical activity in response to a nerve's stimulation of the muscle. Motion is detected using accelerometers measuring the accelerations of objects in motion along reference axes (69). Both signals could be useful to detect generalized onset motor seizures.
For Audio/video recording, Arends et al. (56) evaluated the performance of audio-based detection of primary seizures (tonic-clonic and long generalized tonic). They adapted the sound threshold by training during the first week. Recognizable sounds over the threshold occurred in 23 of the 45 significant seizures. This result signifies the use of only audio recording has definite limitations. Ntonfo et al. (58) proposed the image processing approach to detect the focal clonic seizures of newborns, which are related to the periodic movements of parts of the body. They extracted an average luminance signal representative of the body movements from a video of a newborn. Single window processing has high sensitivity (, where TP: True Positive, FN: False Negative) and low specificity, (, where TN: True Negative, FP: False Positive), while multiple interlaced window processing has low sensitivity and high specificity. It is necessary to apply the advanced window protocol to improve performance.
2.1.3. Multimodality Sensing Approach
The multimodality sensing approach may improve sensitivity and lower false-positive alarms by combining the profits of each sensor, like sensing EMG signals for tonic seizure detection (12). We have chosen a number of multimodality sensing studies for the purpose of dealing more with studies that use other signals more actively than EEG, as shown in Table 1. Electrodermal activity (EDA) refers to the variation of the electrical properties of the skin in response to sweat secretion (70). EDA is mainly used with other sensors to detect seizures, especially with ACM (59).
Cogan et al. (65) detected epileptic seizures using wrist-worn bio-sensors, which detect heart rate (HR), arterial oxygenation (SpO2), ACM, EDA, and temperature. They observed the seizure pattern of HR ↑⇒ SpO2 ↓⇒EDA ↑. Using EEG and non-EEG signals together could be more appropriate to employ the seizure detection system precisely and extensively. Pauri et al. (61) applied EEG-video-audio monitoring to 12 patients with refractory focal seizures using 15-channel EEGs (video-cassettes). Greene et al. (71) combined EEG monitoring with ECG monitoring simultaneously for the robust detection of neonatal seizures.
2.2. Processing the Collected Signals
To collect signals, we can use wet electrodes or dry electrodes. Although the use of dry electrodes is suitable for continuous signal collection, we still need to rely on the conductive paste and gripping force of the earpieces to address the gap between the electrodes and the user's skin (72). Therefore, wet electrodes are used to maintain signal quality. And gold-plated copper electrodes are proper material due to the resistance to skin oil and sweat and rare skin allergy (73). Signal processing is necessary to get the clear biosignal waveform in the most significant frequency range (1–35 Hz) without signal distortion. Raw signal is influenced by noises from power-line and other equipment, and the signal is a mixture of several biological signals, including EEG, EOG, and EMG signals. Thus, we need to use filters.
2.2.1. Basic Filters
Typical four types of the basic filter have been used to get the clear biosignal: a low-pass, high-pass, band-pass, and notch (= band-stop) filter. In the United States, the notch filter is set at 60 Hz6 because the 60 Hz power-line frequency noise from wires, light fluorescent, and other equipment can contaminate biosignal records. The high-pass filter can remove the low-frequency artifacts noise due to poor contact state of electrodes or the sweat of the patient under the electrodes. Furthermore, the median filter can reduce noise and high-frequency oscillations in signal data (74). However, these filters do not preserve all designated frequencies and cannot extract the specific biosignal among the overlapped biosignals spectrum (75). For example, EOG signals by eye movements or blinks propagate to the scalp electrodes creating noises in the recorded EEG signals.
2.2.2. Spatial Filters
The spatial filter technique, such as Independent Components Analysis (ICA), is a promising solution to solve the challenge of overlapped artifacts in EEG recording. Jung et al. (76) applied the spatial filters derived by ICA, which can separate and remove ocular artifacts from the recorded EEG signals. ICA technique, however, requires the use of multiple EEG electrodes to provide spatial information with the captured signals. In other words, ICA can decompose the independent components only when the number of data channels is more than that of signal sources (77). Also, ICA does not work when the training data set is too small (76).
The regression-based technique is a proposed solution to overcome the limitation of ICA. We can apply the regression approach to any number of EEG channels. Regression-based noise filtering has two phases. First, the calibration phase determines the transfer coefficients between other biosignal channels and EEG channels. Second, the correction phase estimates the noise component in the EEG recording (78). Due to this procedure, it is challenging to apply this filter in real-time. The coefficients should be controlled in the normal range. Once the coefficient is out of the range, it is not trivial for the calibration phase to turn them over to the normal range.
The wavelet-based technique is another denoising method that has been proposed for EEG signals. The wavelet-based technique compares each wavelet coefficient to a predetermined threshold and sets it to zero if its magnitude is less than the threshold (78). This technique can work in real-time and does not require the prior data of the artifacts (79). However, choosing the threshold level is a complicated process.
Lastly, if EEG recordings have multi-channel, they give blurred images of brain activity due to the volume conduction (80). In this situation, spatial filters can improve the SNR using the common spatial pattern (CSP) algorithm. The CSP extracts new time series whose variances are optimal for the discrimination of two populations of EEG based on the simultaneous diagonalization of two covariance matrices (81). Several related works have demonstrated the performance of spatial filters for multi-channel EEG (80, 81).
2.2.3. Adaptive Filters
Adaptive filter adapts the coefficients of the filter to generate a signal similar to the noise (75). A linear adaptive filter is made up of a primary signal (= corrupted signal) d(n), a secondary signal (= reference signal) x(n), an adjustable filter H(z), an output from the adjustable filter y(n), and an error e(n) in Figure 4 (82). The adaptive filter usually adjusts the coefficients of filter to minimize the squared error between d(n) and y(n) (83). Correa et al. (84) arranged a cascade of three adaptive filters to remove multiple artifacts and got the EEG signal from EEG + artifacts (EOG, ECG, and power-line frequencies). However, the linear adaptive filter cannot deal with non-linear signals.
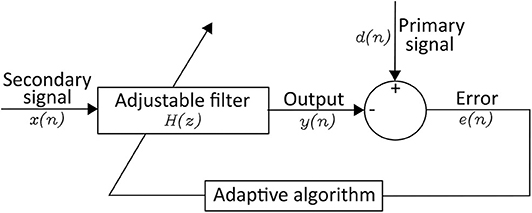
Figure 4. Structure of an Linear Adaptive Filter.
Researchers have developed a neural network (NN) and fuzzy network (FN) to control non-linear signals. NN is made up of an input layer, hidden layer, and output layer, and users do not know the hidden layers. Fuzzy logic analyzes analog data as logical variables having continuous values between 0 and 1 (85). Each method has the following limitation. The structure of NN is challenging to decide, and the learning efficiency of FN is lower than that of NN (86). Combining them as a fuzzy neural network (FNN) is one solution to complement each drawback. However, FNN requires the training data in advance for the backpropagation, making the real-time application difficult (87).
3. Classifying and Detecting Epileptic Seizure
Seizure classification mainly categorizes the input data into one of two groups: seizure and non-seizure. Under specific requirements, the group of seizures can break down into sub-categories depending on the location of the source and symptoms. Those are considered as multiclass classification. Feature-based approaches, including feature extraction and conventional machine learning techniques, have been widely adopted to identify epileptic seizures (7). For each specific data set, the studies listed in Table 2 imposes different classifier configurations and features. Although we tried to cover recent studies in Table 2, we also introduced some previously published papers to represent typical classification methods or data that were used well in the past. After the recent success of Deep Learning, many researchers start applying Deep Learning for medical problems, especially epileptic seizure detection/classification (33).
3.1. Feature-Based Design
In this protocol, the number and type of features have a significant impact on seizure detection performance. There are several feature extraction methods, including time-domain features, frequency-domain features, time and frequency features (discretely), and time-frequency domain features (simultaneously).
3.1.1. Feature Extraction
3.1.1.1. Time-domain analysis
Time-domain analysis works for the stationary signals, but biosignals are non-stationary. One method to quantify a non-stationary time series is to consider it as a large number of stationary segments (99). There are 12 key features in three categories: (1) mean and standard deviation for a time series with symmetric distribution; (2) median, mode, range, first quartile, and third quartile to measure the locations of a time series; (3) maximum, minimum, variation, skewness, kurtosis to pull out the shape characteristics of a time series (99). Besides, existing works have used slope sign change, Willison amplitude (100), Lyapunov exponents (13), and Hjorth parameters (19) to extract features from EEG signals.
3.1.1.2. Frequency-domain analysis
There are three basic techniques for frequency-domain analysis: Fast Fourier transform (FFT), Eigenvector, and Autoregressive (101). FFT decomposes a function (signal) of time into a frequency component fast by rearranging the input elements in a bit-reversed order and building the decimation in time (102). Fourier transform is only suitable when we are interested in what frequency components exist, not times occurring the frequency components (23). However, the time that a specific frequency component happens is essential to analyze biosignals. To solve this problem, a short-time Fourier transform (STFT) uses the idea that some part of a non-stationary signal at any given interval of time is a stationary signal. Johnson et al. (103) extracted relative power spectral density (PSD) value for each 1 Hz bin from EEG 1–40 Hz to check the state of drowsiness.
Eigenvectors are employed to calculate the signal's frequency and power from artifact dominated measurements (101). These methods are based on an eigen decomposition of the correlation matrix of the noise-corrupted signal and produce high-resolution frequency spectra even when the SNR is low (14). There are three eigenvector methods with higher resolution (Pisarenko, MUSIC, and Minimum-Norm) (104). The Pisarenko algorithm is particularly useful for estimating a spectrum containing sharp peaks at the expected frequencies (105). The MUSIC method eliminates the effects of spurious zeros by using the averaged spectra of all of the eigenvectors corresponding to the noise subspace (106). The Minimum-Norm method puts false zeros inside the unit circle and calculates the desired noise subspace vector from the eigenvectors (107).
Autoregressive methods estimate the PSD of the EEG signal using a parametric approach. These methods solve the spectral leakage problem and yield better frequency resolution (101). Yule-Walker method may lead to incorrect parameter estimates in the case of nearly periodic signals (108). As an alternative, Burg's method first estimates the reflection coefficients, and then the parameter estimates are determined using the Levinson-Durbin algorithm (108).
3.1.1.3. Time and frequency features
Using both time- and frequency-domain features can improve seizure classification performance. Srinivasan et al. (20) used three frequency-domain features (dominant frequency, average power in the primary energy zone, and normalized spectral entropy) and two time-domain features (spike rhythmicity and relative spike amplitude). Iscan et al. (109) combined time and frequency features to distinguish between seizure and healthy EEG segments. They got time-domain features using the cross-correlation method and frequency-domain features calculating the PSD.
3.1.1.4. Time-frequency domain analysis
Time-frequency domain analysis studies a signal in both the time and frequency-domains simultaneously. Time-frequency distribution (TFD) and wavelet transform analysis (WT) are the principal techniques of time-frequency domain analysis.
The basic idea of TFD is to devise a joint distribution of time and frequency that describes the energy density or intensity of a signal simultaneously in time and frequency (110). In this distribution, we can calculate the fraction of energy in a specific frequency and time range, and the distribution of frequency at a particular time. It is done by constructing a joint time-frequency function with the desired attributes and then obtaining the signal that produces the distribution (110). Boashash et al. (111) performed TFD feature extraction on multi-channel recordings for seizure detection in newborn EEG signals. They selected the optimal subset of TFD features using the wrapper method with sequential forward feature selection.
WT is an alternative to STFT. STFT gives information about the spectral components at any given interval of time, but not at a specific time instant (23). It causes a problem of resolution. WT gives a variable resolution using the characteristics that high frequencies are better resolved in time-domain, and low frequencies are in frequency-domain (23). WT can capture very minute details, sudden changes, and similarities in the EEG signals (22). It is more effective than other methods because biosignals are non-stationary (112). WT transforms a small wave (a mother wavelet) as a pattern and expresses an arbitrary waveform on the scale of magnification and reduction. WT classified into continuous wavelet transform (CWT) and discrete wavelet transform (DWT). The CWT Y(j, k) is defined by the following equation for any fixed-function Ψj, k(t) in Equation (1). The mother wavelet (Ψj, k(t)) is shifted by a small interval of j in the x-axis, and correlation coefficients are computed. This procedure is repeated for various scaling factors k (dilations) in the y-axis (22).
CWT is computed by changing the scale of the analysis window, shifting the window in time, multiplying by the signal, and integrating overall times (23). However, the CWT has disadvantages such as severe redundancy of coefficients, difficulty in managing infinite wavelets, and lack of analytical methods that can easily calculate for most functions. The DWT solves these disadvantages by scaling and moving discretely, not continuously. The DWT employs two sets of functions called scaling functions and wavelet functions. These functions are related to the low-pass filter [g(n), the mirror vision] and high-pass filter [h(n), the discrete mother wavelet], respectively (113). In the sub-band decomposition of DWT, each stage consists of two digital filters and two downsamplers by 2. The first stage receives a signal x(n) and provides the detail D1 and the approximation A1 (114). The first approximation is further decomposed continuously. Many related works have used WT to extract features (115).
3.1.1.5. Integrating sensing signals from multiple channels
Shoeb et al. (116) extracted four features (m = 4) representing waveform morphology on each of 21 channels (n = 21). Then they assembled these features into a feature vector by concatenating them orderly called the early integration (EI) architecture. They also studied the performance of a patient-specific detector with an alternative architecture called the late integration (LI) architecture. In this structure, the m features of each channel assembled into a distinct feature vector and are assigned to the individual class (seizure or non-seizure). LI allows for the independent classification of activity on each channel, whereas EI summarizes interrelations between channels.
3.1.1.6. Lesson learned
Recording EEG signals is crucial because almost all seizures start from the brain. However, EEG measurement requires attaching many electrodes on the scalp with mobility impairment and making continuous measurement difficult. Therefore, we look forward to developing the devices which measure EEG signals without causing discomfort. Recording EEG signals around the ear is an emerging method to record EEG signals on the scalp. We confirmed some possibilities by comparing the similarity between EEG signal measurements around the ear and those on the scalp from many related works. Furthermore, we can get various biosignals as well as EEG around the ear (117).
The future seizure detection system is necessary to improve the signal processing procedure using spatial and adaptive filters. Basic filters do not entirely remove noise and not preserve all designated frequencies and cannot extract the specific biosignal among the overlapped biosignals spectrum (75). As we saw in Figure 3, EEG recordings have multi-channels even around the ear. Spatial filters can improve the SNR among several channels and surrounding noises using the CSP algorithm. Adaptive filters reflect the previous signal error through the self-developed adaptive algorithm. Linear or non-linear signals are controlled depending on the adaptive algorithm.
Recent papers have applied WT to the seizure detection system to analyze the processed signals. Time-domain analysis and frequency-domain analysis are easy to use and give clearly defined features. However, they may not catch the minute features for seizure because biosignals are non-stationary. Even though there are alternatives like making a large number of stationary segments from any given interval of time, they still have a problem of resolution. Meanwhile, WT can capture very minute details, sudden changes, and similarities in the EEG signals (22). WT classified into CWT and DWT. CWT has disadvantages about the redundancy of coefficients, difficulty in managing infinite wavelets, and lack of analytical methods. DWT is usually used to solve these problems. Daubechies wavelet is the most commonly used wavelet for DWT, and the interested reader for the wavelet-based EEG processing can refer to (22) for more details.
3.1.2. Feature Classification Algorithms
3.1.2.1. Support vector machine (SVM)
SVM is a linear classifier that uses a hyperplane (25) to separate the data space. The mathematical expression of a hyperplane is the general form of a linear equation in multi-dimensional space.
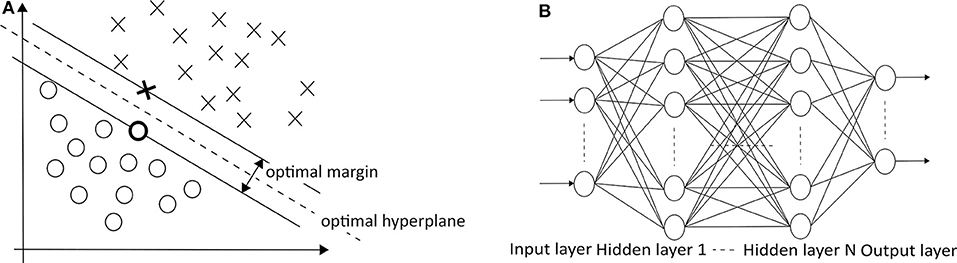
which must have at least one ai other than zero. Given a dataset, there could be many hyperplanes that separate the data. SVM maximizes the distance between the nearest points from each group toward the hyperplane, as described in Figure 5A. This distance is called a margin. Conventional linear SVM has a limitation due to the non-linear changes of biosignals. A non-linear SVM classifier using an RBF kernel is potentially a proper approach because the seizure and non-seizure classes are not linearly separable. This approach detected 96% of 173 test seizures in a median detection delay of 3 s (26). When the categories of seizure are divided into more than two groups (e.g., focal seizure, generalized seizure, healthy), the binary classification is not sufficient to distinguish data. In this case, the SVM method for dealing with multiclass is applied to handle the problem.
The development of multiclass SVM follows two approaches. One vs. rest approach is a method of binarizing the i-th class and the remaining M−1 classes. This process is repeated in the same operation for the other classes. A total of M hyperplanes are created. On the other hand, one vs. one approach is to select two of the M classes to create a hyperplane, then select the other two class combinations and repeat the same operation. A total of M(M−1)/2 hyperplanes are created. The one vs. rest approach has an imbalance in the size of the two sets, unlike the one vs. one approach. However, the one vs. rest approach is mainly used because the total number of hyperplanes increases linearly with the number of classes. Many related works have used multiclass SVM to classify seizure states (29, 30).
3.1.2.2. Multilayer perceptron neural network (MLPNN)
In MLPNNs, each neuron in the hidden layer sums its input signals after multiplying them by each link weights and computes its output as an activation function of the sum, as shown in Figure 5B (113). The activation function can be the rectified linear unit (ReLU), hyperbolic tangent, and so on. Guo et al. (92) used Bayesian regularization back-propagation to train MLPNN, which updates the weights and biases depending on Levenberg-Marquardt optimization. It minimizes a combination of squared errors and weights and then determines the correct combination to produce a network that generalizes well. Their network structure has one input layer with five neurons, one hidden layer with 10 neurons, and one output layer with one neuron (0—the normal/non-seizure EEG, 1—the seizure EEG). Naghsh and Aghashahi imported the feature vectors into an MLPNN system to classify the signal into three states of normal (healthy), a seizure-free interval (interictal), and a full seizure interval (ictal) (94).
3.1.2.3. Adaptive neuro-fuzzy inference system (ANFIS)
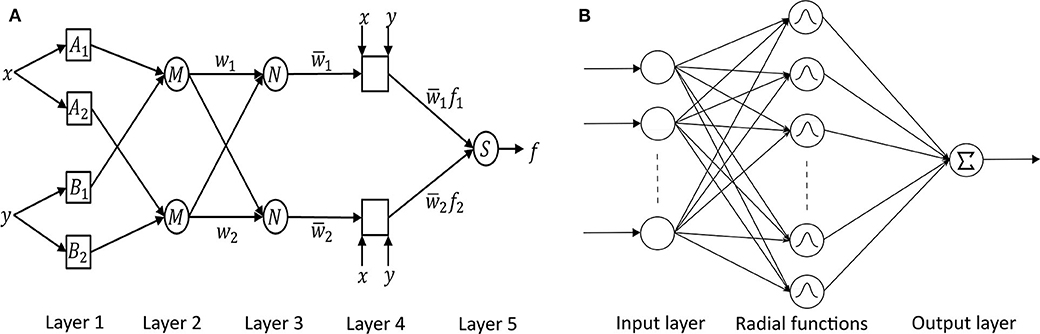
Neuro-fuzzy systems utilize the mathematical properties of ANNs in tuning rule-based fuzzy systems to approximate the way humans process information (95). Especially, ANFIS (118) has shown significant results in modeling non-linear functions. A type-3 ANFIS has five layers like Figure 6A. A circle and square indicate a fixed and adaptive node, respectively. In layer 1, the input values pass through the selected fuzzy membership function (μAi and μBi, i = 1, 2). This function could be a bell-shaped with a maximum equal to 1. Premise parameters {ai, bi, ci} in the function change during the training process. In layer 2, each simple multiplier multiplies the output values of layer 1 [wi = μAi(x)μBi(y), i = 1, 2]. In layer 3, each normalization function produces . In layer 4, the output values of layer 3 go into the Takagi and Sugeno's first-order function (120). Consequent parameters {pi, qi, ri} in the function are determined during the training process. Lastly, one single node computes the overall output as the summation of all incoming signals (). Güler and Übeyli executed a detailed classification between set A (healthy volunteer, eyes open), set B (healthy volunteer, eyes closed), set C (seizure-free intervals of five parents from hippocampal formation of opposite hemisphere), set D (seizure-free intervals of five patients from epileptogenic zone), and set E (epileptic seizure segments) using ANFIS and got the classification accuracy 98.68% (95).
3.1.2.4. Radial basis function neural network (RBFNN)
RBFNN is feed-forward like MLPNN but has only one hidden layer with a non-linear radial basis function (RBF) in Figure 6B (119). RBF is a real-valued function whose value depends only on the distance from the origin. RBFNN has the advantages of a simple topological structure, its locally tuned neurons, and fast learning compared to MLPNN. Aslan et al. (96) compared MLPNN with RBFNN. In the case of MLPNN, 18 out of 204 focal seizure samples were classified as a generalized seizure (8.8% error rate for focal seizure), and 9 out of 47 generalized seizure samples were classified as a focal seizure (19.1% error rate for generalized seizure). RBFNN, on the other hand, showed 3.4% and 10.6% error rate for focal and generalized seizures, respectively. However, RBFNN requires to set correct initial states. Therefore, many seizure classification papers have focused on MLPNN.
3.2. Non-feature Based Design
According to the symptoms of seizures, various types of signal patterns appear, and it is difficult to understand all of them with specific features. Thus, no existing hand-crafted features appear universally applicable so far (33). Deep learning methods can analyze the EEG signal and learn related characteristics automatically in a supervised learning framework (121). Although there are existing works that use the classification methods described as feature-based (20, 98), we summarize these techniques in terms of non-feature based design.
3.2.1. Convolutional Neural Network (CNN)
CNN takes the raw image data and calculates the convolution by iterating over the input data according to the filter size specified to extract the feature of the data. The shape of output data changes depending on filter size, stride, padding, max-pooling size, and so on. The classifier can perform supervised learning by matching the output data and answer classes. CNN, with its high recognition performance in medical images (122), can be as good as an epileptologist in classifying seizures by analyzing EEG plot images as being observed by Emami et al. (33). In their work, they applied CNN to long-term EEG that included epileptic seizure states. In particular, EEG data were divided into short segments based on a given time window (ranging from 0.5–10 s) and converted into EEG plot images (224 × 224 pixels), each of which was classified by CNN as seizure or non-seizure. They used VGG-16 (123) because small size convolution filters (3 × 3) are capable of detecting small EEG waves. VGG-16 is also computationally efficient and can handle non-stationary objectives. This work is meaningful because the study is the first comprehensive attempt to evaluate EEG as plot images. However, the median true positive rate of CNN 74% is still low, so we cannot use this classifier for real patients.
3.2.2. Recurrent Neural Network (RNN)
In RNN, in which a network's output state depends on an arbitrary number of previous inputs like Figure 7A. However, RNN has not been widely used in applications due to the lack of an efficient and universal training method (124). Other attempts have been made to overcome these limitations. Srinivasan et al. (20) used a special type of RNN as Elman network (EN) to detect epileptic seizures. An EN has the additional set called “context layer” as shown in Figure 7B. The hidden layer is connected to these context units. Kumar et al. (97) incorporated recurrent EN and RBFNN to detect epileptic seizures with the wavelet entropy features. They showed 99.75 and 94.5% accuracy for detecting normal vs. epileptic seizures and interictal focal seizures, respectively.
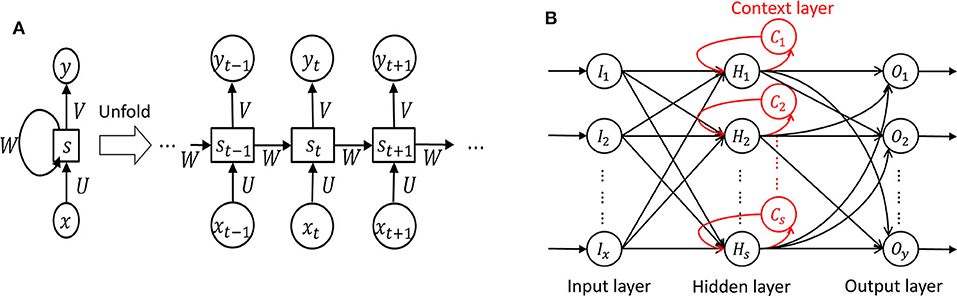
Figure 7. Recurrent neural network (124). (A) Unfolded basic. (B) Elman network.
3.3. Seizure Quantification
Biosignal quantification is necessary to make the correlations between biosignals and actual seizures more accurate (125). Adeli et al. (126) utilized the correlation dimension (CD, representing system complexity) and the largest Lyapunov exponent (LLE, representing system chaoticity) to quantify the nonlinear dynamics of the original EEGs. They analyzed three groups: group H (healthy subjects), group E (epileptic subjects during a seizure-free interval), and group S (epileptic subjects during the seizure). For the CD values from the band-limited EEGs (0–60 Hz), group S (5.3) differs from the other two groups H (6.9) and E (6.7). For the LLE values, group H (0.089), group E (0.041), and group S (0.070) differ from each other. CD and LLE have shown the possibility of being used for classification. However, to the best of our knowledge, there is no concrete explanation between the biosignal and the severity of symptoms.
4. Experimental Non-invasive Anti-seizure Treatments
We have discussed the physiological signals related to seizure as well as how to use these signals to monitor and detect seizures. The next logical step is to build a system to reduce the impact of seizure. In this section, we discuss different non-invasive brain stimulation methods that can potentially be used for seizure therapy. While we try to describe the detailed specifications, working principles, advantages, and disadvantages of different brain stimulation techniques, we leave the discussions on how to design a proper seizure therapy for future works. In particular, we discuss in detail recent non-invasive brain stimulation efforts on Transcranial Magnetic Stimulation (TMS), Transcranial Direct Current Stimulation (tDCS) (10), and Transcranial Focused Ultrasound Stimulation (tFUS) (40, 127). Since Vagus Nerve Stimulation (VNS) overlaps tDCS in terms of electrical stimulation methods and was previously introduced primarily as invasive stimulation, it was not included in the larger category. However, recently, invasive VNS therapy for drug-resistant epilepsy patients received FDA approval7. VNS is also a promising seizure therapy method.
4.1. Transcranial Magnetic Stimulation
Transcranial Magnetic Stimulation (TMS) uses the principle of electromagnetic induction to focus induced current in the brain, as shown in Figure 8A (37). Strong electric currents, circulating within a coil resting on the scalp, generate short and intense magnetic fields. These magnetic fields penetrate human tissue painlessly and induce electric currents that can depolarize neurons or their axons in the brain (38). TMS techniques include single-pulse TMS (spTMS), paired-pulse TMS (ppTMS), and repetitive TMS (rTMS), as shown in Figure 9 (131). In general, single- and paired-pulse TMS are used to verify brain functions, and rTMS induces changes in brain activity that can last beyond the stimulation period (132). While spTMS and ppTMS were reported to induce unexpected seizures during multiple experiments (133), rTMS is currently a better and safer approach for seizure therapy.
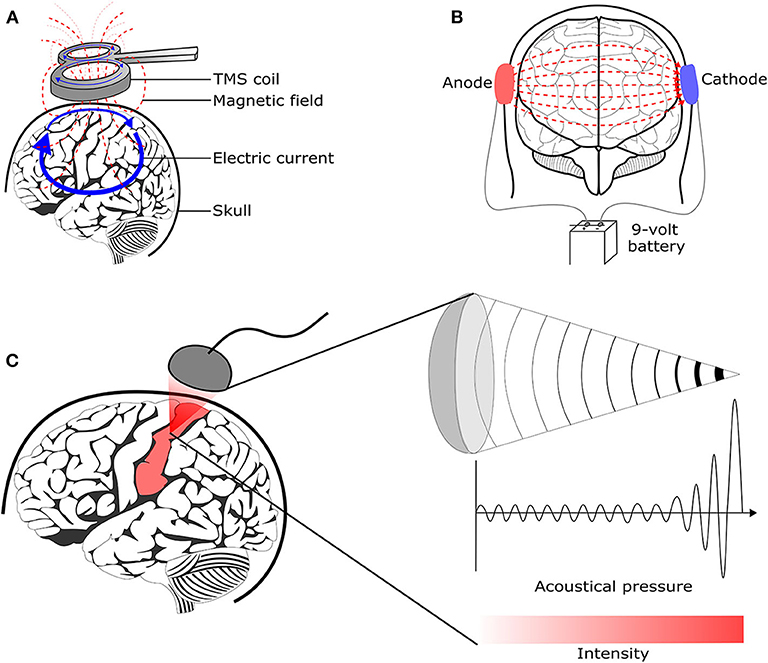
Figure 8. Brain stimulation methods to reduce the seizure symptoms. (A) Transcranial magnetic stimulation (128) (B) Transcranial direct current stimulation (129) (C) Transcranial focused ultrasound stimulation (130).
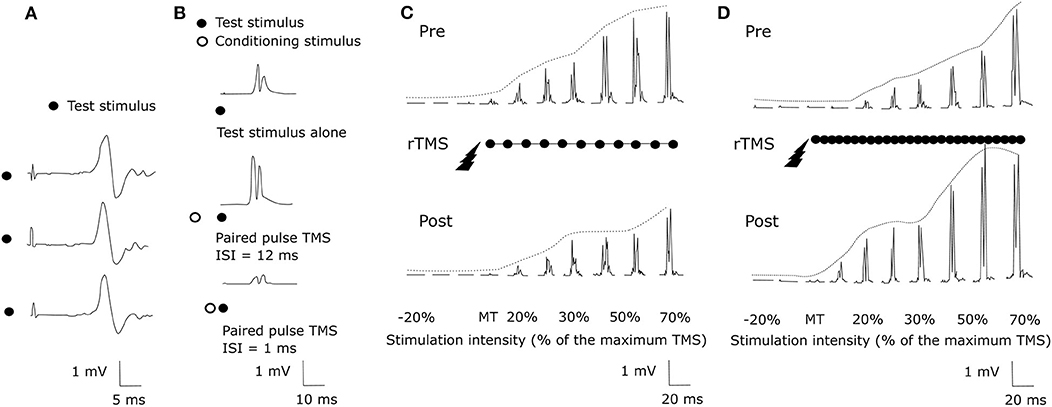
Figure 9. TMS methods (131). (A) spTMS (B) ppTMS (C) low frequency rTMS (D) high frequency rTMS.
rTMS stimulates a single scalp site repeatedly and modulates cortical excitability. Figures 9C,D show examples tested before and after an rTMS regime. It consists of a long pattern of low (1 Hz) or high (20 Hz) frequency rTMS delivered to the left hemisphere's primary motor cortex during 28 min (131, 134). rTMS has greater effects than single-pulse TMS but also has the potential to cause seizures (38). The FDA cleared an rTMS device as a treatment to alleviate symptoms of mildly treatment-resistant depression8. It shows the possibility of rTMS as a treatment for relieving various symptoms.
The effect of rTMS depends on the stimulation frequency, intensity, number of trains, inter-train interval, and number of sessions (135). We exclude the stimulus location element because it is a factor that varies depending on the symptom. The number of pulses per second of rTMS trains typically ranges between 1 and 50 Hz. One hertz paradigms are commonly applied continuously for several minutes, while higher frequency paradigms are applied in a patterned fashion like Figure 10 (136). Low-frequency rTMS produces a transient reduction in cortical excitability. High-frequency rTMS produces a local increase in cortical excitability and increases in MEP size (137). Specifically, this transient reduction effect of Low-frequency rTMS occurs in the motor cortex (138) and in the occipital cortex (139). High-frequency rTMS can improve cognitive processing to the dorsolateral prefrontal cortex (140). To compare low and high-frequency rTMS, Speer et al. (141) showed that 1-Hz rTMS was associated only with decreases in absolute regional cerebral blood flow (rCBF), while twenty-Hertz rTMS over the left prefrontal cortex was associated only with increases in rCBF.
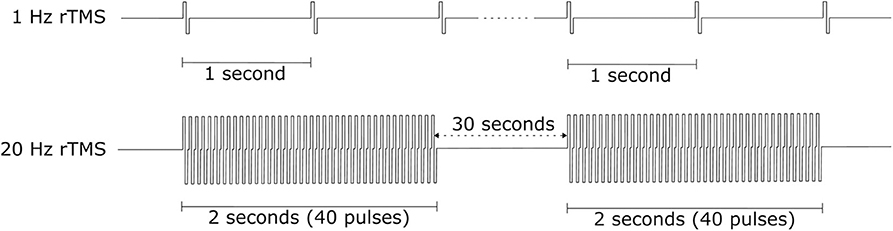
Figure 10. rTMS protocol example.
The stimulation intensity is usually expressed as a percentage of MT. The MT is usually determined before each session by applying the TMS coil over the primary motor cortex (135). Pulse trains are the typical form to use rTMS. If TMS stimulates the brain continuously, it can increase the possibility of generating a seizure (142) and cause heating of the electrodes. Flitman et al. (143) reported the occurrence of focal to bilateral tonic-clonic seizure in one subject after three consecutive stimulated trials with 20% above MT and pulse train lasted 750 ms at 15 Hz. Dobek et al. (144) also found 25 reports of rTMS-induced seizures in their review. Therefore, we should follow the safety guidelines for rTMS (145). Based on the international workshop on the safety of rTMS in 1996, Wassermann et al. (146) introduced the guideline for the use of rTMS: at least 5 s intervals between 20 Hz trains with intensities of up to 1.1x the MEP threshold. A longer interval is necessary for the case of higher frequencies and intensities. Bae et al. investigated the risk of seizures associated with rTMS in patients with epilepsy and reported that only 4 of 280 patients experienced seizures during or after rTMS (147).
In animal studies, low-frequency rTMS (1,000 pulses at 0.5 Hz) decreased susceptibility to pentylenetetrazol-induced seizures in rats (148). Rotenberg et al. (149) suppressed seizures in rats injected with the kainic acid using EEG-guided 0.5 and 0.75 Hz rTMS, but 0.25 Hz rTMS was not effective. In human studies, 0.3 Hz low-frequency rTMS decreased interictal EEG epileptiform abnormalities in one-third of drug-resistant epilepsy patients but was not better than a placebo for seizure reduction (150). Instead, Cincotta et al. (151) suggested that 0.3 Hz rTMS produces a relatively long-lasting enhancement of the inhibitory mechanisms responsible for the cortical silent period. Low-frequency rTMS decreased the number of seizures in patients with focal neocortical epilepsy (35) and refractory epilepsy (152).
4.2. Transcranial Direct Current Stimulation
tDCS is one of transcranial electrical stimulation (tES) methods and applies low-amplitude direct currents via scalp electrodes and penetrate the skull to enter the brain, as shown in Figure 8B (37). The principal difference between tDCS and other tES techniques is the waveform to the brain, like Figure 11. tDCS is the only class of neuromodulation technique that delivers a sustained direct current (DC) like Figure 11A (39). Transcranial alternating current stimulation (tACS) has a variety of stimulation with different frequencies (1–45 Hz), like Figure 11B (153). tACS enables the study of causal links between brain rhythms and specific aspects of behavior. Transcranial random noise stimulation (tRNS) follows a white-noise band-limited waveform (0.1–640 Hz) like Figure 11C (154). tRNS focuses on the link between behavior and frequency-specific noise inherent in neural processing (127). tACS and tRNS are usually used to identify or compare frequency-specific characteristics. They are not actively used as therapeutic methods to obtain actual effects compared to tDCS. Besides, tDCS is easier to use, cheaper, and more tolerable than TMS. However, tDCS is still an experimental form of brain stimulation and is not an FDA-approved treatment9. tDCS does not induce neuronal action potentials because static fields do not yield the rapid depolarization required to produce action potentials in neural membranes (155). Thus, it is a pure neuromodulatory intervention. tDCS could modulate cortical excitation and cortical inhibition by anodal polarity and cathodal polarity, respectively. By varying the current intensity and duration, the strength and duration of the after-effects could be controlled.
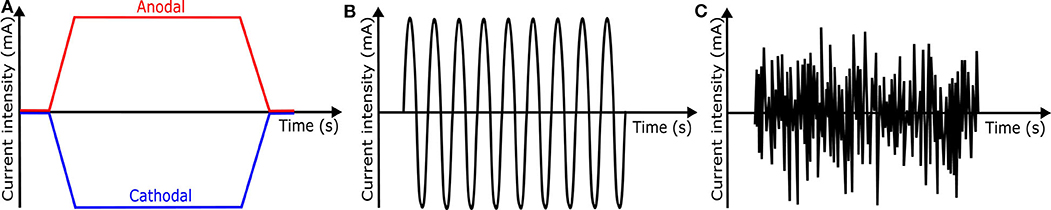
Figure 11. Waveforms of different tES techniques. (A) tDCS waveform (B) tACS waveform (C) tRNS waveform.
4.2.1. Factors
The effect of tDCS depends on current density, stimulation duration, the orientation of the electric field (the electrodes' positions and polarity), electrode configuration (material and size), the patient, deep of the target, and intensity of the current (156, 157). Long-lasting stimulation largely influenced the durability of after-effects to humans (158). tDCS protocols should specify electrode position and current direction because these elements cause different stimulation results. The electrodes for tDCS are usually a pair of electrodes covered by sponges filled with a contact medium such as NaCl solution or conductive cream (155). For the electrode size, although large electrodes expand the area of the excitability modification, small electrodes are better to increase tDCS focality (155).
4.2.2. Case Studies
Cathodal tDCS leads to a reduction of cortical excitability by decreasing the neuronal firing rate and inducing long-term depression (LTD) of neuronal excitability (159). In animal studies, cathodal tDCS at 100 μA for 60 min resulted in a duration of more than 2 h with an increasing threshold of focal onset seizure activity, while anodal tDCS had no significant effect on TLS in the rat (160). In human studies, cathodal tDCS may be effective to reduce seizures' frequency as shown in Table 3. Most tDCS related works applied 1–2 mA cathodal tDCS for 20–60 min. Yook et al. (174) placed a tDCS cathode at the midpoint of P4 and T4, where the 11-year-old female seizure patient showed the abnormal EEG wave. After 2 mA cathodal tDCS for 20 min, the number of seizure occurrence and the duration of each seizure episode were reduced.
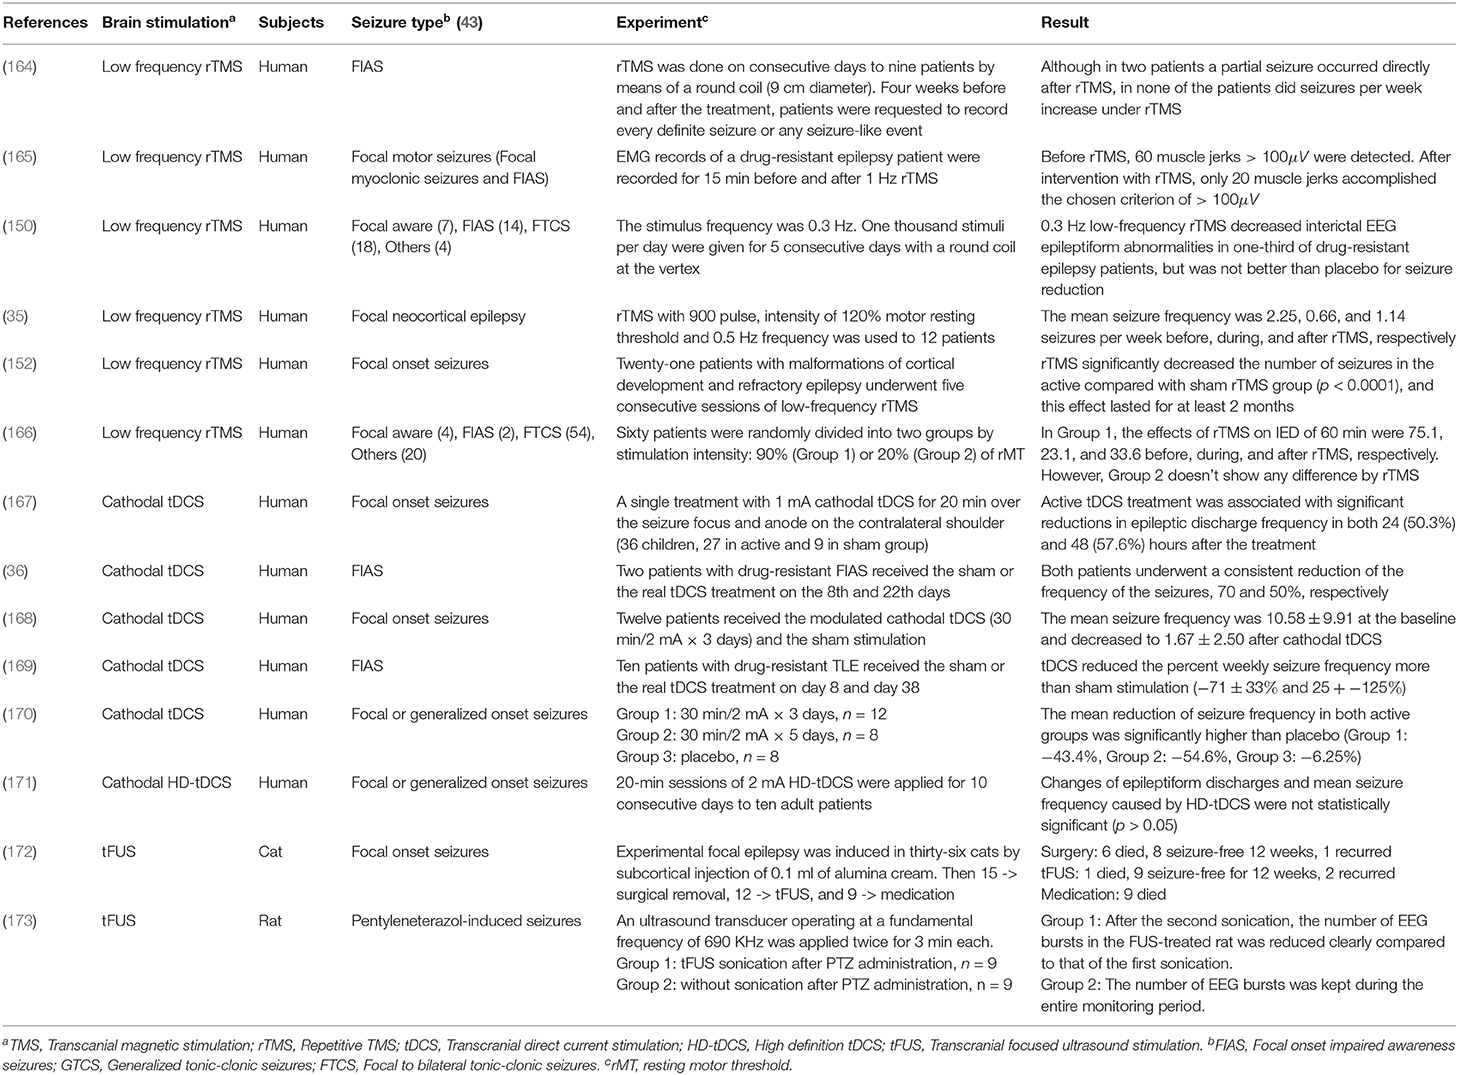
Table 3. Experimental non-invasive neuromodulation treatments for epilepsy [Reviews for readers who want to know more about neuromodulation treatments: (161–163)].
4.2.3. Safety
Several metrics, including current density, duration, and the charge, should be controlled carefully to prevent serious adverse effects. Bikson et al. (175) investigated the related papers for the safety of tDCS and offered the criterion of tDCS protocol: current density (6.3−13 A/m2) from the animal models, and others (≤ 40 min, ≤ 4 mA, ≤ 7.2 Coulombs) from the human trials. Under this condition, there were no reports of severe side effects across over 33, 200 sessions and 1,000 subjects (175).
4.2.4. Deep Brain Stimulation of tDCS
tDCS can only directly stimulate in cortical regions. To overcome this limitation, Grossman et al. (176) suggested a new protocol called temporal interference non-invasive brain stimulation (TI-NIBS). TI delivers multiple electric fields to the brain at frequencies which are too high to recruit neural firing. These multiple electric fields differ by a frequency within the dynamic range of neural firing. They applied TI-NIBS to a living mouse brain and demonstrated the effects of TI-NIBS by stimulating neurons in subcortical structures (176). While the current experiment has not yet been applied to humans, we believe this is one of the most potential approaches for seizure therapy in the future due to its capability of providing high spatial and temporal resolution. In addition, since the stimulation is only effective at the locations where all the beams are constructive, the beams may not harm the brain cells that are not located in the targeted areas.
4.3. Transcranial Focused Ultrasound Stimulation
tFUS is emerging as a method to improve the relatively low degree of spatial locality offered by TMS and tDCS (127). It is important because a low degree of spatial locality leads to modulating neuronal activity not only in the target but also in surrounding circuits. tFUS uses acoustic energy to stimulate the brain like Figure 8C. tFUS can both excite and suppress brain neuronal activity and has millimeter spatial resolutions (177). In 1988, Colemann and Lizzi developed the Sonocare CST-100, which is the first high intensity focused ultrasound and received the FDA pre-market approval10. The device was designed for the treatment of glaucoma.
4.3.1. Factors
There are some factors to control the effect of tFUS: acoustic frequencies, intensities, and modes of transmission (178). First, Ultrasound (US) has a frequency above 20 kHz. Most medical US frequency range is between 1 and 15 MHz, and therapeutic US application operates around 1 MHz or less (179). Second, therapeutic US can be divided into low power (<0.5 Wcm−2) or high power (>100 Wcm−2) depending on the acoustic intensity (178). Low power intensity US is used in physiotherapy, non-thermal actions, and so on, whereas high power intensity US is used in lithotripsy and the thermal ablation of tissue (180). The therapeutic US usually has low power intensity. Lower energy US increased the action potential, while higher energy US reduced the action potential due to the ultrasonic thermal effects. Third, the US has two modes of transmission: continuous wave (CW) and pulsed wave (PW) (178). CW stimuli are more effective than PW stimuli in eliciting responses (181). Therapeutic US is usually delivered as CW or long pulse exposures (180).
4.3.2. Current Progress
In animal studies, Manlapaz et al. (172) reported ultrasonic irradiation relieved the seizures of cats. They compared fifteen cats treated by surgical removal of the epileptogenic focus with twelve cats treated by ultrasonic irradiation. The ultrasonic approach showed less postoperative complications than those of surgery. Min et al. (173) injected pentylenetetrazol to rats to induce acute epilepsy and applied tFUS to the rat's brain twice for 3 min. Epileptic EEG signals of the rats decreased visibly after tFUS compared to the other group that did not receive any tFUS. In human studies, to the best of our knowledge, there are no existing works to handle the relationship between seizure and tFUS. Instead, we look at studies that relate the human brain to tFUS. Legon et al. (40) evaluated if tFUS is capable of modulating brain activity in the human primary somatosensory cortex. From the experiment, tFUS remarkably reduced the amplitude of somatosensory evoked potential. Lee et al. (182) reported tFUS of the primary visual cortex. The tFUS induced activation both from the sonicated brain area and from the visual or cognitive network regions. However, tFUS beam might potentially harm brain cells when it passes through them.
4.3.3. Safety
It is difficult to establish tFUS protocol for safety now because there is no enough medical data about tFUS. Although Legon et al. (183) applied low power tFUS to 120 participants who did not report any neurological impairment and reported that none of the participants experienced serious adverse effects, it does not prove the safety of tFUS. This is because ultrasound at high intensities can cause irreversible tissue damage (40). The safety protocol could be established from a variety of tFUS related experiments. US studies are necessary to be conducted on primate brains such as monkeys having a skull with similar thickness and size to that of humans (184).
5. Potential Research Directions
We have discussed state-of-the-arts sensing and stimulation technologies that are suitable for seizure monitoring and therapy. In this section, we present potential research directions that require more attention to building a robust, wearable, safe, sensing, and stimulation systems.
5.1. Robust and Wearable Seizure Detection System
5.1.1. Monitoring Seizures From the Brain With High Resolution
Current technologies only allow us to monitor the whole brain. However, we envision a more robust sensing technology that could sense precisely where the seizure signal occurs on the human brain. The future sensor can be implemented as an array of electrodes to form a beam-forming receiver to capture only the brain area of interest. It will improve the performance of the sensing system by efficiently removing the interference signals from many non-related brain areas. TI-NIBS (176) design can be considered as the closest reference.
5.1.2. Improving Seizure Quantification
Most existing seizure detection systems have only focused on differentiating between seizure and non-seizure. Therefore, we could not find a concrete explanation between the biosignal and the severity of symptoms from the related works. The biggest problem is that there are no clear criteria for quantifying seizures, and it is difficult to obtain the ground truth data. Once reasonable standards are established, and researchers' consent is received, the seizure quantification will be applied to the seizure detection system quickly.
5.1.3. Making Seizure Monitoring System Become Wearable
We predict the core location of recording EEG signals will be around the ear. The reason is that the device around the ear can still acquire clear EEG signals and does not restrict the user's mobility. Dry electrodes could be applied to the ear-cover part (185) of the device to improve usability. Different biosignals, including EOG, EMG, and EDA, also could be detected with EEG signals around the ear. A headband with EEG electrodes is also used to detect seizures from the frontal lobe or other locations which could not be detected by seizure detection devices around the ear. The wearable devices can deliver biosignals to a smartphone through communication technology. The application for seizure detection on the smartphone will extract features and classify seizure types.
5.2. Safe, Accurate, and Reliable Seizure Stimulation
5.2.1. High Spacial Resolution Stimulation
The stimulation device needs to localize the target area of the brain and stimulate it accurately. Existing TMS and tDCS have a low degree of spatial locality. We introduced several approaches to solve this problem. Hesed coil design of TMS attaches several strips on the specific part of the head intensively with wires that induce stimulation in the desired direction (186). TI-NIBS, as an alternative of tDCS, delivers multiple electric fields to the brain at frequencies that are too high to recruit neural firing (176). In addition, new tDCS algorithms allow a better focal treatment using multi-target electrodes and smaller electrodes in High-Definition tDCS (HD-tDCS) (187). These approaches are likely to advance to deep brain stimulation and require additional studies because they are in the proposal stage.
5.2.2. Safe and Reliable Stimulation Device
Safety is the most crucial aspect of designing the stimulation system. A practical system should prioritize the safety aspect, for example, long term and short term side effects. Unlike TMS achieving some degree of safety, tDCS and tFUS are necessary to establish the safety protocol. Antal et al. (188) introduce detail information about the safety of tDCS, including long stimulation duration, montages with (multiple) small electrodes, and limiting the maximum current. Although there are a lot of works for tDCS, tDCS still only happens in the lab environment and is not an FDA-approved treatment solutions9. Rather, as another electrical stimulation approach, non-invasive VNS therapy for drug-resistant epilepsy patients received FDA approval7. In the near future, we believe the establishment of a tDCS safety protocol for humans by integrating its new experiment with existing work. Meanwhile, there are a few related works about tFUS. Many tests for tFUS are necessary before establishing a safety protocol.
5.2.3. Making Seizure Therapy System Become Wearable
We believe tDCS could be integrated with the seizure detection system, especially around the ear. tDCS applies low-amplitude direct currents via two scalp electrodes like Figure 8B. Each scalp electrode could be connected to the surrounding area of the left ear and right ear, respectively. When designing a circuit, we need to consider the difference between the battery used for the existing seizure detection device and that used for tDCS. Unless a new design is available, it seems difficult to create a wearable device that incorporates TMS or tFUS and a seizure detection device. The fact that both brain stimulation methods are applied with a small gap between the brain and the device makes it difficult to make a wearable device.
5.3. An Integrated Sensing and Stimulation System
Even when the seizure monitoring and stimulation systems are reliable, there are many challenges remaining in integrating these two components to produce a reliable integrated system in a wearable form.
6. Conclusion
. In this paper, we systematically categorized recent efforts on building seizure monitoring, detection, and therapy systems. We explained the overall systems and components that can be used to monitor the reliable physiological signals of seizures. We presented different techniques for extracting physiological seizure signals from the noises. Then, we discussed in detail recent effort on classifying/detecting seizure events using machine learning and deep learning. Next, we presented different seizure therapy techniques, including TMS, tDCS, and tFUS. Last but not least, we discussed potential future research directions on building a wearable seizure detection and therapy system based on our experience in building comprehensive health solutions.
Author Contributions
TK surveyed and wrote all parts of the manuscript. TK and PN discussed and wrote Lesson Learned and section 6. TK, PN, NP, NB, HT, SH, and TV revised the manuscript.
Conflict of Interest
The authors declare that the research was conducted in the absence of any commercial or financial relationships that could be construed as a potential conflict of interest.
Footnotes
1. ^https://www.epilepsysociety.org.uk/epileptic-seizures#.XsfrI2hKiHs
2. ^https://www.safetysystemsdistribution.co.uk/emfit-tonic-clonic-seizure-monitor-basic/
3. ^https://medpage-ltd.com/epileptic-tonic-clonic-seizure-alarm-MP5
4. ^https://smart-monitor.com/about-smartwatch-inspyre-by-smart-monitor/
5. ^https://www.bioserenity.com
6. ^https://www.iec.ch/worldplugs/list_bylocation.htm
7. ^https://www.mobihealthnews.com/content/fda-approves-sentiva-nerve-stimulation-device-epilepsy-therapy
8. ^https://www.fisherwallace.com/
9. ^https://www.hopkinsmedicine.org
10. ^https://www.fusfoundation.org/the-technology/timeline-of-focused-ultrasound
References
1. Fisher RS, Boas WVE, Blume W, Elger C, Genton P, Lee P, et al. Epileptic seizures and epilepsy: definitions proposed by the International League Against Epilepsy (ILAE) and the International Bureau for Epilepsy (IBE). Epilepsia. (2005) 46:470–2. doi: 10.1111/j.0013-9580.2005.66104.x
2. NINDS. The Epilepsies and Seizures: Hope through Research. Department of Health & Human Services, NIH, National Institute of Health (2015).
3. Mormann F, Andrzejak RG, Elger CE, Lehnertz K. Seizure prediction: the long and winding road. Brain. (2006) 130:314–33. doi: 10.1093/brain/awl241
4. Van de Vel A, Cuppens K, Bonroy B, Milosevic M, Jansen K, Van Huffel S, et al. Non-EEG seizure detection systems and potential SUDEP prevention: state of the art: review and update. Seizure. (2016) 41:141–53. doi: 10.1016/j.seizure.2016.07.012
5. Song Y. A review of developments of EEG-based automatic medical support systems for epilepsy diagnosis and seizure detection. J Biomed Sci Eng. (2011) 4:788. doi: 10.4236/jbise.2011.412097
6. Tzallas AT, Tsipouras MG, Tsalikakis DG, Karvounis EC, Astrakas L, Konitsiotis S, et al. Automated epileptic seizure detection methods: a review study. In: Epilepsy-Histological, Electroencephalographic and Psychological Aspects. Ioannia: InTech (2012). p. 75–98.
7. Ramgopal S, Thome-Souza S, Jackson M, Kadish NE, Fernández IS, Klehm J. Seizure detection, seizure prediction, and closed-loop warning systems in epilepsy. Epilepsy Behav. (2014) 37:291–307. doi: 10.1016/j.yebeh.2014.06.023
8. Gadhoumi K, Lina JM, Mormann F, Gotman J. Seizure prediction for therapeutic devices: a review. J Neurosci Methods. (2016) 260:270–82. doi: 10.1016/j.jneumeth.2015.06.010
9. Theodore WH, Fisher RS. Brain stimulation for epilepsy. Lancet Neurol. (2004) 3:111–8. doi: 10.1016/S1474-4422(03)00664-1
10. Nitsche MA, Paulus W. Noninvasive brain stimulation protocols in the treatment of epilepsy: current state and perspectives. Neurotherapeutics. (2009) 6:244–50. doi: 10.1016/j.nurt.2009.01.003
11. McGrogan N. Neural Network Detection of Epileptic Seizures in the Electroencephalogra. Department of Engineering Science Probationary Research Transfer Report, Oxford University (1999).
12. Leijten FS, Consortium DT, van Andel J, Ungureanu C, Arends J, Tan F, et al. Multimodal seizure detection: a review. Epilepsia. (2018) 59:42–7. doi: 10.1111/epi.14047
13. Übeyli ED. Lyapunov exponents/probabilistic neural networks for analysis of EEG signals. Expert Syst Appl. (2010) 37:985–92. doi: 10.1016/j.eswa.2009.05.078
14. Übeyli ED. Analysis of EEG signals by implementing eigenvector methods/recurrent neural networks. Digital Signal Process. (2009) 19:134–43. doi: 10.1016/j.dsp.2008.07.007
15. Baumgartner C, Koren JP. Seizure detection using scalp-EEG. Epilepsia. (2018) 59:14–22. doi: 10.1111/epi.14052
16. Regalia G, Onorati F, Migliorini M, Picard R. An improved wrist-worn convulsive seizure detector based on accelerometry and electrodermal activity sensors. In: American Epilepsy Society Annual Meeting. (2015).
17. Cogan D, Birjandtalab J, Nourani M, Harvey J, Nagaraddi V. Multi-biosignal analysis for epileptic seizure monitoring. Int J Neural Syst. (2017) 27:1650031. doi: 10.1142/S0129065716500313
18. Larsen SN, Conradsen I, Beniczky S, Sorensen HB. Detection of tonic epileptic seizures based on surface electromyography. In: Engineering in Medicine Biology Society (EMBC), 36th Annual International Conference of the IEEE. Chicago, IL: IEEE (2014). p. 942–5. doi: 10.1109/EMBC.2014.6943747
19. Vidaurre C, Krämer N, Blankertz B, Schlögl A. Time domain parameters as a feature for EEG-based brain-computer interfaces. Neural Netw. (2009) 22:1313–9. doi: 10.1016/j.neunet.2009.07.020
20. Srinivasan V, Eswaran C, Sriraam N. Artificial neural network based epileptic detection using time-domain and frequency-domain features. J Med Syst. (2005) 29:647–60. doi: 10.1007/s10916-005-6133-1
21. Hassanpour H, Mesbah M, Boashash B. Time-frequency feature extraction of newborn EEG seizure using SVD-based techniques. EURASIP J Appl Signal Process. (2004) 2004:2544–54. doi: 10.1155/S1110865704406167
22. Faust O, Acharya UR, Adeli H, Adeli A. Wavelet-based EEG processing for computer-aided seizure detection and epilepsy diagnosis. Seizure. (2015) 26:56–64. doi: 10.1016/j.seizure.2015.01.012
24. Gu Y, Cleeren E, Dan J, Claes K, Van Paesschen W, Van Huffel S, et al. Comparison between scalp EEG and behind-the-ear EEG for development of a wearable seizure detection system for patients with focal epilepsy. Sensors. (2018) 18:29. doi: 10.3390/s18010029
25. Cortes C, Vapnik V. Support-vector networks. Mach Learn. (1995) 20:273–7. doi: 10.1007/BF00994018
26. Shoeb AH, Guttag JV. Application of machine learning to epileptic seizure detection. In: Proceedings of the 27th International Conference on Machine Learning (ICML-10). Haifa (2010). p. 975–82.
27. Tzimourta K, Tzallas A, Giannakeas N, Astrakas L, Tsalikakis D, Tsipouras M. Epileptic seizures classification based on long-term EEG signal wavelet analysis. In: Maglaveras N, Chouvarda I, de Carvalho P, editors. Precision Medicine Powered by pHealth and Connected Health. Thessaloniki: Springer (2018). p. 165–9. doi: 10.1007/978-981-10-7419-6_28
28. Subasi A, Kevric J, Canbaz MA. Epileptic seizure detection using hybrid machine learning methods. Neural Comput. Appl. (2019) 31:317–25. doi: 10.1007/s00521-017-3003-y
29. Übeyli ED. Analysis of EEG signals by combining eigenvector methods and multiclass support vector machines. Comput. Biol. Med. (2008) 38:14–22. doi: 10.1016/j.compbiomed.2007.06.002
30. Guler I, Ubeyli ED. Multiclass support vector machines for EEG-signals classification. IEEE Trans Inform Technol Biomed. (2007) 11:117–26. doi: 10.1109/TITB.2006.879600
31. Teixeira CA, Direito B, Bandarabadi M, Le Van Quyen M, Valderrama M, Schelter B, et al. Epileptic seizure predictors based on computational intelligence techniques: a comparative study with 278 patients. Comput Methods Programs Biomed. (2014) 114:324–36. doi: 10.1016/j.cmpb.2014.02.007
32. Direito B, Teixeira CA, Sales F, Castelo-Branco M, Dourado A. A realistic seizure prediction study based on multiclass SVM. Int J Neural Syst. (2017) 27:1750006. doi: 10.1142/S012906571750006X
33. Emami A, Kunii N, Matsuo T, Shinozaki T, Kawai K, Takahashi H. Seizure detection by convolutional neural network-based analysis of scalp electroencephalography plot images. Neuroimage Clin. (2019) 22:101684. doi: 10.1016/j.nicl.2019.101684
34. Orhan U, Hekim M, Ozer M. EEG signals classification using the K-means clustering and a multilayer perceptron neural network model. Expert Syst. Appl. (2011) 38:13475–81. doi: 10.1016/j.eswa.2011.04.149
35. Santiago-Rodríguez E, Cárdenas-Morales L, Harmony T, Fernández-Bouzas A, Porras-Kattz E, Hernández A. Repetitive transcranial magnetic stimulation decreases the number of seizures in patients with focal neocortical epilepsy. Seizure. (2008) 17:677–83. doi: 10.1016/j.seizure.2008.04.005
36. Assenza G, Campana C, Formica D, Schena E, Taffoni F, Di Pino G, et al. Efficacy of cathodal transcranial direct current stimulation in drug-resistant epilepsy: a proof of principle. In: Engineering in Medicine and Biology Society (EMBC). 2014 36th Annual International Conference of the IEEE. Chicago, IL: IEEE (2014). p. 530–3. doi: 10.1109/EMBC.2014.6943645
37. Wagner T, Valero-Cabre A, Pascual-Leone A. Noninvasive human brain stimulation. Annu Rev Biomed Eng. (2007) 9:527–65. doi: 10.1146/annurev.bioeng.9.061206.133100
38. Hallett M. Transcranial magnetic stimulation and the human brain. Nature. (2000) 406:147–50. doi: 10.1038/35018000
39. Gebodh N, Esmaeilpour Z, Adair D, Schestattsky P, Fregni F, Bikson M. Transcranial direct current stimulation among technologies for low-intensity transcranial electrical stimulation: classification, history, and terminology. In: Knotkova H, Nitsche MA, Bikson M,Woods AJ, editors. Practical Guide to Transcranial Direct Current Stimulation. Cham: Springer. (2019). p. 3–43. doi: 10.1007/978-3-319-95948-1_1
40. Legon W, Sato TF, Opitz A, Mueller J, Barbour A, Williams A, et al. Transcranial focused ultrasound modulates the activity of primary somatosensory cortex in humans. Nat Neurosci. (2014) 17:322. doi: 10.1038/nn.3620
41. Nijsen TM, Aarts RM, Arends JB, Cluitmans PJ. Automated detection of tonic seizures using 3-D accelerometry. In: International Federation for Medical and Biological Engineering. Antwerp: Springer (2009) p. 188–91. doi: 10.1007/978-3-540-89208-3_47
42. McLean B, Wimalaratna S. Sudden death in epilepsy recorded in ambulatory EEG. J Neurol Neurosurg Psychiatry. (2007) 78:1395–7. doi: 10.1136/jnnp.2006.088492
43. Fisher RS, Cross JH, French JA, Higurashi N, Hirsch E, Jansen FE, et al. Operational classification of seizure types by the International League Against Epilepsy: Position Paper of the ILAE Commission for Classification and Terminology. Epilepsia. (2017) 58:522–30. doi: 10.1111/epi.13670
44. Saab M, Gotman J. A system to detect the onset of epileptic seizures in scalp EEG. Clin Neurophysiol. (2005) 116:427–42. doi: 10.1016/j.clinph.2004.08.004
45. Zandi AS, Javidan M, Dumont GA, Tafreshi R. Automated real-time epileptic seizure detection in scalp EEG recordings using an algorithm based on wavelet packet transform. IEEE Trans Biomed Eng. (2010) 57:1639–51. doi: 10.1109/TBME.2010.2046417
46. Orosco L, Correa AG, Diez P, Laciar E. Patient non-specific algorithm for seizures detection in scalp EEG. Comput Biol Med. (2016) 71:128–34. doi: 10.1016/j.compbiomed.2016.02.016
47. Wang Y, Long X, van Dijk H, Aarts RM, Wang L, Arends JB. False alarms reduction in non-convulsive status epilepticus detection via continuous EEG analysis. Physiol Meas. (2020) doi: 10.1088/1361-6579/ab8cb3
48. Doyle O, Temko A, Marnane W, Lightbody G, Boylan G. Heart rate based automatic seizure detection in the newborn. Med Eng Phys. (2010) 32:829–39. doi: 10.1016/j.medengphy.2010.05.010
49. Massé F, Bussel MV, Serteyn A, Arends J, Penders J. Miniaturized wireless ECG monitor for real-time detection of epileptic seizures. ACM Trans Embed Comput Syst. (2013) 12:102. doi: 10.1145/2485984.2485990
50. Varon C, Jansen K, Lagae L, Van Huffel S. Can ECG monitoring identify seizures? J Electrocardiol. (2015) 48:1069–74. doi: 10.1016/j.jelectrocard.2015.08.020
51. Jeppesen J, Fuglsang-Frederiksen A, Johansen P, Christensen J, Wüstenhagen S, Tankisi H, et al. Seizure detection based on heart rate variability using a wearable electrocardiography device. Epilepsia. (2019) 60:2105–13. doi: 10.1111/epi.16343
52. Vandecasteele K, De Cooman T, Gu Y, Cleeren E, Claes K, Paesschen WV, et al. Automated epileptic seizure detection based on wearable ECG and PPG in a hospital environment. Sensors. (2017) 17:2338. doi: 10.3390/s17102338
53. Szabó CÁ, Morgan LC, Karkar KM, Leary LD, Lie OV, Girouard M, et al. Electromyography-based seizure detector: Preliminary results comparing a generalized tonic-clonic seizure detection algorithm to video-EEG recordings. Epilepsia. (2015) 56:1432–7. doi: 10.1111/epi.13083
54. Van de Vel A, Cuppens K, Bonroy B, Milosevic M, Van Huffel S, Vanrumste B, et al. Long-term home monitoring of hypermotor seizures by patient-worn accelerometers. Epilepsy Behav. (2013) 26:118–25. doi: 10.1016/j.yebeh.2012.10.006
55. Beniczky S, Polster T, Kjaer TW, Hjalgrim H. Detection of generalized tonic-clonic seizures by a wireless wrist accelerometer: a prospective, multicenter study. Epilepsia. (2013) 54:e58–61. doi: 10.1111/epi.12120
56. Arends JB, van Dorp J, van Hoek D, Kramer N, van Mierlo P, van der Vorst D, et al. Diagnostic accuracy of audio-based seizure detection in patients with severe epilepsy and an intellectual disability. Epilepsy Behav. (2016) 62:180–5. doi: 10.1016/j.yebeh.2016.06.008
57. Shum J, Fogarty A, Dugan P, Holmes MG, Leeman-Markowski BA, Liu AA, et al. Sounds of seizures. Seizure. (2020) 78:86–90. doi: 10.1016/j.seizure.2020.03.008
58. Ntonfo GMK, Ferrari G, Raheli R, Pisani F. Low-complexity image processing for real-time detection of neonatal clonic seizures. IEEE Trans Inform Technol Biomed. (2012) 16:375–82. doi: 10.1109/TITB.2012.2186586
59. Poh MZ, Loddenkemper T, Reinsberger C, Swenson NC, Goyal S, Sabtala MC, et al. Convulsive seizure detection using a wrist-worn electrodermal activity and accelerometry biosensor. Epilepsia. (2012) 53:e93–7. doi: 10.1111/j.1528-1167.2012.03444.x
60. Heldberg BE, Kautz T, Leutheuser H, Hopfengärtner R, Kasper BS, Eskofier BM. Using wearable sensors for semiology-independent seizure detection-towards ambulatory monitoring of epilepsy. In: Engineering in Medicine Biology Society (EMBC), 37th Annual International Conference of the IEEE. Milan: IEEE (2015). p. 5593–6. doi: 10.1109/EMBC.2015.7319660
61. Pauri F, Pierelli F, Chatrian GE, Erdly WW. Long-term EEG-video-audio monitoring: computer detection of focal EEG seizure patterns. Electroencephalogr Clin Neurophysiol. (1992) 82:1–9. doi: 10.1016/0013-4694(92)90175-H
62. Kidmose P, Looney D, Mandic DP. Auditory evoked responses from Ear-EEG recordings. In: Engineering in Medicine and Biology Society (EMBC). 2012 Annual International Conference of the IEEE. San Diego, CA: IEEE (2012). p. 586–9. doi: 10.1109/EMBC.2012.6345999
63. Mikkelsen KB, Kappel SL, Mandic DP, Kidmose P. EEG recorded from the ear: characterizing the ear-EEG method. Front Neurosci. (2015) 9:438. doi: 10.3389/fnins.2015.00438
64. Panayiotopoulos CP. Epileptic Syndromes and their Treatment. Neonatal Seizures. 2nd ed. London: Springer (2007). p. 185–206.
65. Cogan D, Nourani M, Harvey J, Nagaraddi V. Epileptic seizure detection using wristworn biosensors. In: Engineering in Medicine Biology Society (EMBC), 37th Annual International Conference of the IEEE. IEEE (2015). p. 5086–9. doi: 10.1109/EMBC.2015.7319535
66. Blumhardt L, Smith P, Owen L. Electrocardiographic accompaniments of temporal lobe epileptic seizures. Lancet. (1986) 327:1051–56. doi: 10.1016/S0140-6736(86)91328-0
67. Smith P, Howell S, Owen L, Blumhardt L. Profiles of instant heart rate during partial seizures. Electroencephalogr Clin Neurophysiol. (1989) 72:207–17. doi: 10.1016/0013-4694(89)90245-9
68. Ponnusamy A, Marques JL, Reuber M. Comparison of heart rate variability parameters during complex partial seizures and psychogenic nonepileptic seizures. Epilepsia. (2012) 53:1314–21. doi: 10.1111/j.1528-1167.2012.03518.x
69. Yang CC, Hsu YL. A review of accelerometry-based wearable motion detectors for physical activity monitoring. Sensors. (2010) 10:7772–88. doi: 10.3390/s100807772
70. Benedek M, Kaernbach C. A continuous measure of phasic electrodermal activity. J Neurosci Methods. (2010) 190:80–91. doi: 10.1016/j.jneumeth.2010.04.028
71. Greene BR, Boylan GB, Reilly RB, de Chazal P, Connolly S. Combination of EEG and ECG for improved automatic neonatal seizure detection. Clin Neurophysiol. (2007) 118:1348–59. doi: 10.1016/j.clinph.2007.02.015
72. Pham N, Dinh T, Raghebi Z, Kim T, Bui N, Nguyen P, et al. WAKE: a behind-the-ear wearable system for microsleep detection. In: Proceedings of the 18th Annual International Conference on Mobile Systems, Applications, and Services. Toronto, ON: ACM (2020) doi: 10.1145/3386901.3389032
73. Rapson W. Skin contact with gold and gold alloys. Contact Dermatitis. (1985) 13:56–65. doi: 10.1111/j.1600-0536.1985.tb02505.x
74. Meier R, Dittrich H, Schulze-Bonhage A, Aertsen A. Detecting epileptic seizures in long-term human EEG: a new approach to automatic online and real-time detection and classification of polymorphic seizure patterns. J Clin Neurophysiol. (2008) 25:119–31. doi: 10.1097/WNP.0b013e3181775993
75. Reddy AG, Narava S. Artifact removal from EEG signals. Int J Comput Appl. (2013) 77:17–19. doi: 10.5120/13543-1175
76. Jung TP, Makeig S, Westerfield M, Townsend J, Courchesne E, Sejnowski TJ, et al. Removal of eye activity artifacts from visual event-related potentials in normal and clinical subjects. Clin Neurophysiol. (2000) 111:1745–58. doi: 10.1016/S1388-2457(00)00386-2
77. Makeig S, Jung TP, Ghahremani D, Sejnowski TJ. Independent Component Analysis of Simulated ERP Data. Institute for Neural Computation, University of California. Technical report INC-9606. (1996).
78. Jafarifarmand A, Badamchizadeh MA. Artifacts removal in EEG signal using a new neural network enhanced adaptive filter. Neurocomputing. (2013) 103:222–31. doi: 10.1016/j.neucom.2012.09.024
79. Zikov T, Bibian S, Dumont GA, Huzmezan M, Ries C. A wavelet based de-noising technique for ocular artifact correction of the electroencephalogram. In: Engineering in Medicine and Biology. Vol. 1. Houston, TX: IEEE (2002). p. 98–105.
80. Blankertz B, Tomioka R, Lemm S, Kawanabe M, Muller KR. Optimizing spatial filters for robust EEG single-trial analysis. IEEE Signal Process Mag. (2008) 25:41–56. doi: 10.1109/MSP.2008.4408441
81. Ramoser H, Muller-Gerking J, Pfurtscheller G. Optimal spatial filtering of single trial EEG during imagined hand movement. IEEE Trans Rehabil Eng. (2000) 8:441–6. doi: 10.1109/86.895946
83. Widrow B, Stearns S. Adaptive Signal Processing. Englewood Cliffs, NJ: Prentice-Hall, Inc. (1985).
84. Correa AG, Laciar E, Patiño H, Valentinuzzi M. Artifact removal from EEG signals using adaptive filters in cascade. J Phys. (2007) 90:012081. doi: 10.1088/1742-6596/90/1/012081
85. Pedrycz W. Fuzzy Control and Fuzzy Systems. 2nd ed. Taunton, UK: Research Studies Press Ltd. (1993).
86. Chen CH, Lin CJ, Lin CT. A functional-link-based neurofuzzy network for nonlinear system control. IEEE Trans Fuzzy Syst. Taunton (2008) 16:1362–78. doi: 10.1109/TFUZZ.2008.924334
87. Er MJ, Li Z. Adaptive noise cancellation using online self-enhanced fuzzy filters with applications to multimedia processing. In: Intelligent Multimedia Processing with Soft Computing. Springer (2005) p. 389–414. doi: 10.1007/3-540-32367-8_18
88. Daoud H, Bayoumi MA. Efficient epileptic seizure prediction based on deep learning. IEEE Trans Biomed Circ Syst. (2019) 13:804–13. doi: 10.1109/TBCAS.2019.2929053
89. Craik A, He Y, Contreras-Vidal JL. Deep learning for electroencephalogram (EEG) classification tasks: a review. J Neural Eng. (2019) 16:031001. doi: 10.1088/1741-2552/ab0ab5
90. Ramakrishnan S, Murugavel AM. Epileptic seizure detection using fuzzy-rules-based sub-band specific features and layered multi-class SVM. Pattern Anal Appl. (2019) 22:1161–76. doi: 10.1007/s10044-018-0691-6
91. Andrzejak RG, Lehnertz K, Mormann F, Rieke C, David P, Elger CE. Indications of nonlinear deterministic and finite-dimensional structures in time series of brain electrical activity: dependence on recording region and brain state. Phys Rev E. (2001) 64:061907. doi: 10.1103/PhysRevE.64.061907
92. Guo L, Rivero D, Dorado J, Rabunal JR, Pazos A. Automatic epileptic seizure detection in EEGs based on line length feature and artificial neural networks. J Neurosci Methods. (2010) 191:101–9. doi: 10.1016/j.jneumeth.2010.05.020
93. Esteller R, Echauz J, Tcheng T. Comparison of line length feature before and after brain electrical stimulation in epileptic patients. In: The 26th Annual International Conference of the IEEE Engineering in Medicine and Biology Society. San Francisco, CA: IEEE (2004). p. 4710–3.
94. Naghsh-Nilchi AR, Aghashahi M. Epilepsy seizure detection using eigen-system spectral estimation and Multiple Layer Perceptron neural network. Biomed Signal Process Control. (2010) 5:147–57. doi: 10.1016/j.bspc.2010.01.004
95. Güler I, Übeyli ED. Adaptive neuro-fuzzy inference system for classification of EEG signals using wavelet coefficients. J Neurosci Methods. (2005) 148:113–21. doi: 10.1016/j.jneumeth.2005.04.013
96. Aslan K, Bozdemir H, Şahin C, Oğulata SN, Erol R. A radial basis function neural network model for classification of epilepsy using EEG signals. J Med Syst. (2008) 32:403–8. doi: 10.1007/s10916-008-9145-9
97. Kumar SP, Sriraam N, Benakop P, Jinaga B. Entropies based detection of epileptic seizures with artificial neural network classifiers. Expert Syst Appl. (2010) 37:3284–91. doi: 10.1016/j.eswa.2009.09.051
98. Hossain MS, Amin SU, Alsulaiman M, Muhammad G. Applying deep learning for epilepsy seizure detection and brain mapping visualization. ACM Trans Multimedia Comput Commun Appl. (2019) 15:10. doi: 10.1145/3241056
99. Diykh M, Li Y, Wen P. EEG sleep stages classification based on time domain features and structural graph similarity. IEEE Trans Neural Syst Rehabil Eng. (2016) 24:1159–68. doi: 10.1109/TNSRE.2016.2552539
100. Khorshidtalab A, Salami M, Hamedi M. Robust classification of motor imagery EEG signals using statistical time-domain features. Physiol Meas. (2013) 34:1563. doi: 10.1088/0967-3334/34/11/1563
101. Al-Fahoum AS, Al-Fraihat AA. Methods of EEG signal features extraction using linear analysis in frequency and time-frequency domains. ISRN Neurosci. (2014) 2014:7. doi: 10.1155/2014/730218
102. Weisstein EW. “Fourier Transform.” From MathWorld–A Wolfram Web Resource. Available online at: https://mathworld.wolfram.com/FourierTransform.html
103. Johnson RR, Popovic DP, Olmstead RE, Stikic M, Levendowski DJ, Berka C. Drowsiness/alertness algorithm development and validation using synchronized EEG and cognitive performance to individualize a generalized model. Biol Psychol. (2011) 87:241–250. doi: 10.1016/j.biopsycho.2011.03.003
104. Akay M, Semmlow JL, Welkowitz W, Bauer MD, Kostis JB. Noninvasive detection of coronary stenoses before and after angioplasty using eigenvector methods. IEEE Biomed Eng. (1990) 37:1095–104. doi: 10.1109/10.61035
105. Pisarenko VF. The retrieval of harmonics from a covariance function. Geophys J Int. (1973) 33:347–66. doi: 10.1111/j.1365-246X.1973.tb03424.x
106. Schmidt R. Multiple emitter location and signal parameter estimation. IEEE Trans Antennas Propagat. (1986) 34:276–80. doi: 10.1109/TAP.1986.1143830
107. Kumaresan R, Tufts DW. Estimating the angles of arrival of multiple plane waves. IEEE Trans Aerospace Electron Syst. (1983) AES-19:134–9. doi: 10.1109/TAES.1983.309427
108. De Hoon M, Van der Hagen T, Schoonewelle H, Van Dam H. Why Yule-Walker should not be used for autoregressive modelling. Ann Nuclear Energy. (1996) 23:1219–28. doi: 10.1016/0306-4549(95)00126-3
109. Iscan Z, Dokur Z, Demiralp T. Classification of electroencephalogram signals with combined time and frequency features. Expert Syst Appl. (2011) 38:10499–505. doi: 10.1016/j.eswa.2011.02.110
110. Cohen L. Time-frequency distributions-a review. Proc IEEE. (1989) 77:941–81. doi: 10.1109/5.30749
111. Boashash B, Ouelha S. Automatic signal abnormality detection using time-frequency features and machine learning: a newborn EEG seizure case study. Knowl Based Syst. (2016) 106:38–50. doi: 10.1016/j.knosys.2016.05.027
112. Rosso OA, Blanco S, Yordanova J, Kolev V, Figliola A, Schürmann M, et al. Wavelet entropy: a new tool for analysis of short duration brain electrical signals. J Neurosci Methods. (2001) 105:65–75. doi: 10.1016/S0165-0270(00)00356-3
113. Subasi A. EEG signal classification using wavelet feature extraction and a mixture of expert model. Expert Syst Appl. (2007) 32:1084–93. doi: 10.1016/j.eswa.2006.02.005
114. Subasi A. Epileptic seizure detection using dynamic wavelet network. Expert Syst Appl. (2005) 29:343–55. doi: 10.1016/j.eswa.2005.04.007
115. Acharya UR, Sree SV, Ang PCA, Yanti R, Suri JS. Application of non-linear and wavelet based features for the automated identification of epileptic EEG signals. Neural Syst. (2012) 22:1250002. doi: 10.1142/S0129065712500025
116. Greene B, Marnane W, Lightbody G, Reilly R, Boylan G. Classifier models and architectures for EEG-based neonatal seizure detection. Physiol Meas. (2008) 29:1157. doi: 10.1088/0967-3334/29/10/002
117. Nguyen P, Bui N, Nguyen A, Truong H, Suresh A, Whitlock M, et al. Tyth-typing on your teeth: tongue-teeth localization for human-computer interface. In: Proceedings of the 16th Annual International Conference on Mobile Systems, Applications, and Services. Munich: ACM (2018). p. 269–82. doi: 10.1145/3210240.3210322
118. Jang JS. ANFIS: adaptive-network-based fuzzy inference system. IEEE Trans Syst Man Cybernet. (1993) 23:665–85. doi: 10.1109/21.256541
119. Moody J, Darken CJ. Fast learning in networks of locally-tuned processing units. Neural Comput. (1989) 1:281–94. doi: 10.1162/neco.1989.1.2.281
120. Takagi T, Sugeno M. Derivation of fuzzy control rules from human operator's control actions. IFAC Proc Vol. (1983) 16:55–60. doi: 10.1016/S1474-6670(17)62005-6
121. LeCun Y, Bengio Y, Hinton G. Deep learning. Nature. (2015) 521:436–44. doi: 10.1038/nature14539
122. Litjens G, Kooi T, Bejnordi BE, Setio AAA, Ciompi F, Ghafoorian M, et al. A survey on deep learning in medical image analysis. Med Image Anal. (2017) 42:60–88. doi: 10.1016/j.media.2017.07.005
123. Simonyan K, Zisserman A. Very deep convolutional networks for large-scale image recognition. arXiv preprint arXiv:14091556 (2014).
124. Petrosian A, Prokhorov D, Homan R, Dasheiff R, Wunsch D II. Recurrent neural network based prediction of epileptic seizures in intra-and extracranial EEG. Neurocomputing. (2000) 30:201–18. doi: 10.1016/S0925-2312(99)00126-5
125. Gotman J, Gloor P. Automatic recognition and quantification of interictal epileptic activity in the human scalp EEG. Electroencephalogr Clin Neurophysiol. (1976) 41:513–29. doi: 10.1016/0013-4694(76)90063-8
126. Adeli H, Ghosh-Dastidar S, Dadmehr N. A wavelet-chaos methodology for analysis of EEGs and EEG subbands to detect seizure and epilepsy. IEEE Trans Biomed Eng. (2007) 54:205–11. doi: 10.1109/TBME.2006.886855
127. Polania R, Nitsche MA, Ruff CC. Studying and modifying brain function with non-invasive brain stimulation. Nat Neurosci. (2018) 21: 174–87. doi: 10.1038/s41593-017-0054-4
128. Ridding MC, Rothwell JC. Is there a future for therapeutic use of transcranial magnetic stimulation? Nat Rev Neurosci. (2007) 8:559. doi: 10.1038/nrn2169
129. Higgins ES, George MS. Brain Stimulation Therapies for Clinicians. Sullivan's Island, SC: American Psychiatric Publication (2019).
130. Kim J, Lee S. Development of a wearable robotic positioning system for noninvasive transcranial focused ultrasound stimulation. IEEE/ASME Trans Mechatron. (2016) 21:2284–93. doi: 10.1109/TMECH.2016.2580500
131. Valero-Cabré A, Amengual JL, Stengel C, Pascual-Leone A, Coubard OA. Transcranial magnetic stimulation in basic and clinical neuroscience: a comprehensive review of fundamental principles and novel insights. Neurosci Biobehav Rev. (2017) 83:381–404. doi: 10.1016/j.neubiorev.2017.10.006
132. Klomjai W, Katz R, Lackmy-Vallée A. Basic principles of transcranial magnetic stimulation (TMS) and repetitive TMS (rTMS). Ann Phys Rehabil Med. (2015) 58:208–13. doi: 10.1016/j.rehab.2015.05.005
133. Schrader LM, Stern JM, Koski L, Nuwer MR, Engel J Jr. Seizure incidence during single-and paired-pulse transcranial magnetic stimulation in individuals with epilepsy. Clin Neurophysiol. (2004) 115:2728–37. doi: 10.1016/j.clinph.2004.06.018
134. Gangitano M, Valero-Cabré A, Tormos JM, Mottaghy FM, Romero JR, Pascual-Leone Á. Modulation of input-output curves by low and high frequency repetitive transcranial magnetic stimulation of the motor cortex. Clin Neurophysiol. (2002) 113:1249–57. doi: 10.1016/S1388-2457(02)00109-8
135. Spronk D, Arns M, Fitzgerald PB. Repetitive transcranial magnetic stimulation in depression: protocols, mechanisms, and new developments. In: Neurofeedback and Neuromodulation Techniques and Applications. Academic Press (2011). p. 257–91. doi: 10.1016/B978-0-12-382235-2.00010-X
136. Oberman L. Repetitive transcranial magnetic stimulation (rTMS) protocols. In: Rotenberg A, Horvath JC, Pascual-Leone A, editors. Transcranial Magnetic Stimulation. New York, NY: Springer (2014). p. 129–39. doi: 10.1007/978-1-4939-0879-0_7
137. Chen R, Seitz RJ. Changing cortical excitability with low-frequency magnetic stimulation. Neurology. (2001) 57:379–80. doi: 10.1212/WNL.57.3.379
138. Plewnia C, Lotze M, Gerloff C. Disinhibition of the contralateral motor cortex by low-frequency rTMS. Neuroreport. (2003) 14:609–12. doi: 10.1097/00001756-200303240-00017
139. Thut G, Theoret H, Pfennig A, Ives J, Kampmann F, Northoff G, et al. Differential effects of low-frequency rTMS at the occipital pole on visual-induced alpha desynchronization and visual-evoked potentials. Neuroimage. (2003) 18:334–47. doi: 10.1016/S1053-8119(02)00048-4
140. Rollnik JD, Huber TJ, Mogk H, Siggelkow S, Kropp S, Dengler R, et al. High frequency repetitive transcranial magnetic stimulation (rTMS) of the dorsolateral prefrontal cortex in schizophrenic patients. Neuroreport. (2000) 11:4013–5. doi: 10.1097/00001756-200012180-00022
141. Speer AM, Kimbrell TA, Wassermann EM, Repella JD, Willis MW, Herscovitch P, et al. Opposite effects of high and low frequency rTMS on regional brain activity in depressed patients. Biol Psychiatry. (2000) 48:1133–41. doi: 10.1016/S0006-3223(00)01065-9
142. Hallett M. Transcranial magnetic stimulation: a primer. Neuron. (2007) 55:187–99. doi: 10.1016/j.neuron.2007.06.026
143. Flitman S, Grafman J, Wassermann E, Cooper V, O'grady J, Pascual-Leone A, et al. Linguistic processing during repetitive transcranial magnetic stimulation. Neurology. (1998) 50:175–81. doi: 10.1212/WNL.50.1.175
144. Dobek CE, Blumberger DM, Downar J, Daskalakis ZJ, Vila-Rodriguez F. Risk of seizures in transcranial magnetic stimulation: a clinical review to inform consent process focused on bupropion. Neuropsychiatr Dis Treat. (2015) 11:2975. doi: 10.2147/NDT.S91126
145. Rossi S, Hallett M, Rossini PM, Pascual-Leone A Safety of TMS Consensus Group. Safety, ethical considerations, and application guidelines for the use of transcranial magnetic stimulation in clinical practice and research. Clin Neurophysiol. (2009) 120:2008–39. doi: 10.1016/j.clinph.2009.08.016
146. Wassermann EM. Risk and safety of repetitive transcranial magnetic stimulation: report and suggested guidelines from the International Workshop on the Safety of Repetitive Transcranial Magnetic Stimulation, June 5-7, 1996. Electroencephalogr Clin Neurophysiol Evoked Potent Sec. (1998) 108:1–16. doi: 10.1016/S0168-5597(97)00096-8
147. Bae EH, Schrader LM, Machii K, Alonso-Alonso M, Riviello JJ Jr, Pascual-Leone A, et al. Safety and tolerability of repetitive transcranial magnetic stimulation in patients with epilepsy: a review of the literature. Epilepsy Behav. (2007) 10:521–8. doi: 10.1016/j.yebeh.2007.03.004
148. Akamatsu N, Fueta Y, Endo Y, Matsunaga K, Uozumi T, Tsuji S. Decreased susceptibility to pentylenetetrazol-induced seizures after low-frequency transcranial magnetic stimulation in rats. Neurosci Lett. (2001) 310:153–6. doi: 10.1016/S0304-3940(01)02116-4
149. Rotenberg A, Muller P, Birnbaum D, Harrington M, Riviello JJ, et al. Seizure suppression by EEG-guided repetitive transcranial magnetic stimulation in the rat. Clin Neurophysiol. (2008) 119:2697–702. doi: 10.1016/j.clinph.2008.09.003
150. Cantello R, Rossi S, Varrasi C, Ulivelli M, Civardi C, Bartalini S, et al. Slow repetitive TMS for drug-resistant epilepsy: clinical and EEG findings of a placebo-controlled trial. Epilepsia. (2007) 48:366–74. doi: 10.1111/j.1528-1167.2006.00938.x
151. Cincotta M, Borgheresi A, Gambetti C, Balestrieri F, Rossi L, Zaccara G, Pascual-Leone A, et al. Suprathreshold 0.3 Hz repetitive TMS prolongs the cortical silent period: potential implications for therapeutic trials in epilepsy. Clin Neurophysiol. (2003) 114:1827–33. doi: 10.1016/S1388-2457(03)00181-0
152. Fregni F, Otachi PT, Do Valle A, Boggio PS, Thut G, Rigonatti SP, et al. A randomized clinical trial of repetitive transcranial magnetic stimulation in patients with refractory epilepsy. Ann Neurol. (2006) 60:447–55. doi: 10.1002/ana.20950
153. Herrmann CS, Rach S, Neuling T, Strüber D. Transcranial alternating current stimulation: a review of the underlying mechanisms and modulation of cognitive processes. Front Hum Neurosci. (2013) 7:279. doi: 10.3389/fnhum.2013.00279
154. Reato D, Salvador R, Bikson M, Opitz A, Dmochowski J, Miranda PC. Principles of transcranial direct current stimulation (tDCS): introduction to the biophysics of tDCS. In: Knotkova H, Nitsche MA, Bikson M, Woods AJ, editors. Practical Guide to Transcranial Direct Current Stimulation. Cham: Springer (2019). p. 45–80. doi: 10.1007/978-3-319-95948-1_2
155. Nitsche MA, Cohen LG, Wassermann EM, Priori A, Lang N, Antal A, et al. Transcranial direct current stimulation: state of the art (2008). Brain Stimul. (2008) 1:206–23. doi: 10.1016/j.brs.2008.06.004
156. Nitsche MA, Paulus W. Excitability changes induced in the human motor cortex by weak transcranial direct current stimulation. J Physiol. (2000) 527:633–9. doi: 10.1111/j.1469-7793.2000.t01-1-00633.x
157. Peterchev AV, Wagner TA, Miranda PC, Nitsche MA, Paulus W, Lisanby SH, et al. Fundamentals of transcranial electric and magnetic stimulation dose: definition, selection, and reporting practices. Brain Stimul. (2012) 5:435–53. doi: 10.1016/j.brs.2011.10.001
158. Nitsche MA, Paulus W. Sustained excitability elevations induced by transcranial DC motor cortex stimulation in humans. Neurology. (2001) 57:1899–901. doi: 10.1212/WNL.57.10.1899
159. Palm U, Segmiller FM, Epple AN, Freisleder FJ, Koutsouleris N, Schulte-Körne G, et al. Transcranial direct current stimulation in children and adolescents: a comprehensive review. J Neural Trans. (2016) 123:1219–34. doi: 10.1007/s00702-016-1572-z
160. Liebetanz D, Klinker F, Hering D, Koch R, Nitsche MA, Potschka H, et al. Anticonvulsant effects of transcranial direct-current stimulation (tDCS) in the rat cortical ramp model of focal epilepsy. Epilepsia. (2006) 47:1216–24. doi: 10.1111/j.1528-1167.2006.00539.x
161. Schulze-Bonhage A. Brain stimulation as a neuromodulatory epilepsy therapy. Seizure. (2017) 44:169–75. doi: 10.1016/j.seizure.2016.10.026
162. Larkin M, Meyer RM, Szuflita NS, Severson MA, Levine ZT. Post-traumatic, drug-resistant epilepsy and review of seizure control outcomes from blinded, randomized controlled trials of brain stimulation treatments for drug-resistant epilepsy. Cureus. (2016) 8:16. doi: 10.7759/cureus.744
163. Li MC, Cook MJ. Deep brain stimulation for drug-resistant epilepsy. Epilepsia. (2018) 59:273–90. doi: 10.1111/epi.13964
164. Tergau F, Naumann U, Paulus W, Steinhoff BJ. Low-frequency repetitive transcranial magnetic stimulation improves intractable epilepsy. Lancet. (1999) 353:2209. doi: 10.1016/S0140-6736(99)01301-X
165. Rossi S, Ulivelli M, Bartalini S, Galli R, Passero S, Battistini N, et al. Reduction of cortical myoclonus-related epileptic activity following slow-frequency rTMS. A case study. Neuroreport. (2004) 15:293–96. doi: 10.1097/00001756-200402090-00016
166. Sun W, Mao W, Meng X, Wang D, Qiao L, Tao W, et al. Low-frequency repetitive transcranial magnetic stimulation for the treatment of refractory partial epilepsy: a controlled clinical study. Epilepsia. (2012) 53:1782–9. doi: 10.1111/j.1528-1167.2012.03626.x
167. Auvichayapat N, Rotenberg A, Gersner R, Ngodklang S, Tiamkao S, Tassaneeyakul W, et al. Transcranial direct current stimulation for treatment of refractory childhood focal epilepsy. Brain Stimul. (2013) 6:696–700. doi: 10.1016/j.brs.2013.01.009
168. Tekturk P, Erdogan ET, Kurt A, Vanli-yavuz EN, Ekizoglu E, Kocagoncu E, et al. The effect of transcranial direct current stimulation on seizure frequency of patients with mesial temporal lobe epilepsy with hippocampal sclerosis. Clin Neurol Neurosurg. (2016) 149:27–32. doi: 10.1016/j.clineuro.2016.07.014
169. Assenza G, Campana C, Assenza F, Pellegrino G, Di Pino G, Fabrizio E, et al. Cathodal transcranial direct current stimulation reduces seizure frequency in adults with drug-resistant temporal lobe epilepsy: a sham controlled study. Brain Stimul Basic Transl Clin Res Neuromodul. (2017) 10:333–5. doi: 10.1016/j.brs.2016.12.005
170. San-Juan D, López DAE, Gregorio RV, Trenado C, Gonzalez-Aragon MF, Morales-Quezada L, et al. Transcranial direct current stimulation in mesial temporal lobe epilepsy and hippocampal sclerosis. Brain Stimul. (2017) 10:28–35. doi: 10.1016/j.brs.2016.08.013
171. Karvigh SA, Motamedi M, Arzani M, Roshan JHN. HD-tDCS in refractory lateral frontal lobe epilepsy patients. Seizure. (2017) 47:74–80. doi: 10.1016/j.seizure.2017.03.005
172. Manlapaz J, Åström K, Ballantine H Jr, Lele P. Effects of ultrasonic radiation in experimental focal epilepsy in the cat. Exp Neurol. (1964) 10:345–56. doi: 10.1016/0014-4886(64)90005-6
173. Min BK, Bystritsky A, Jung KI, Fischer K, Zhang Y, Maeng LS, et al. Focused ultrasound-mediated suppression of chemically-induced acute epileptic EEG activity. BMC Neurosci. (2011) 12:23. doi: 10.1186/1471-2202-12-23
174. Yook SW, Park SH, Seo JH, Kim SJ, Ko MH. Suppression of seizure by cathodal transcranial direct current stimulation in an epileptic patient-a case report. Ann Rehabil Med. (2011) 35:579–82. doi: 10.5535/arm.2011.35.4.579
175. Bikson M, Grossman P, Thomas C, Zannou AL, Jiang J, Adnan T, et al. Safety of transcranial direct current stimulation: evidence based update (2016). Brain Stimul. (2016) 9:641–61. doi: 10.1016/j.brs.2016.06.004
176. Grossman N, Bono D, Dedic N, Kodandaramaiah SB, Rudenko A, Suk HJ, et al. Noninvasive deep brain stimulation via temporally interfering electric fields. Cell. (2017) 169:1029–41. doi: 10.1016/j.cell.2017.05.024
177. Yang T, Chen J, Yan B, Zhou D. Transcranial ultrasound stimulation: a possible therapeutic approach to epilepsy. Med Hypotheses. (2011) 76:381–3. doi: 10.1016/j.mehy.2010.10.046
178. Tufail Y, Yoshihiro A, Pati S, Li MM, Tyler WJ. Ultrasonic neuromodulation by brain stimulation with transcranial ultrasound. Nat Protoc. (2011) 6:1453. doi: 10.1038/nprot.2011.371
179. O B̀rien WD Jr. Ultrasound-biophysics mechanisms. Biophys Mol Biol. (2007) 93:212–255. doi: 10.1016/j.pbiomolbio.2006.07.010
180. Ter Haar G. Therapeutic applications of ultrasound. Biophys Mol Biol. (2007) 93:111–29. doi: 10.1016/j.pbiomolbio.2006.07.005
181. King RL, Brown JR, Newsome WT, Pauly KB. Effective parameters for ultrasound-induced in vivo neurostimulation. Ultrasound Med Biol. (2013) 39:312–31. doi: 10.1016/j.ultrasmedbio.2012.09.009
182. Lee W, Kim HC, Jung Y, Chung YA, Song IU, Lee JH, et al. Transcranial focused ultrasound stimulation of human primary visual cortex. Sci Rep. (2016) 6:34026. doi: 10.1038/srep34026
183. Legon W, Bansal P, Ai L, Mueller JK, Meekins G, Gillick B. Safety of transcranial focused ultrasound for human neuromodulation. bioRxiv [Preprint]. (2018) 314856. doi: 10.1101/314856
184. Rezayat E, Toostani IG. A review on brain stimulation using low intensity focused ultrasound. Basic Clin Neurosci. (2016) 7:187. doi: 10.15412/J.BCN.03070303
185. Bleichner MG, Mirkovic B, Debener S. Identifying auditory attention with ear-EEG: cEEGrid versus high-density cap-EEG comparison. J Neural Eng. (2016) 13:066004. doi: 10.1088/1741-2560/13/6/066004
186. Roth Y, Zangen A, Hallett M. A coil design for transcranial magnetic stimulation of deep brain regions. J Clin Neurophysiol. (2002) 19:361–70. doi: 10.1097/00004691-200208000-00008
187. Edwards D, Cortes M, Datta A, Minhas P, Wassermann EM, Bikson M. Physiological and modeling evidence for focal transcranial electrical brain stimulation in humans: a basis for high-definition tDCS. Neuroimage. (2013) 74:266–75. doi: 10.1016/j.neuroimage.2013.01.042
Keywords: seizure detection, biosignal processing, biosignal classification, brain stimulation, EEG
Citation: Kim T, Nguyen P, Pham N, Bui N, Truong H, Ha S and Vu T (2020) Epileptic Seizure Detection and Experimental Treatment: A Review. Front. Neurol. 11:701. doi: 10.3389/fneur.2020.00701
Received: 11 February 2020; Accepted: 09 July 2020;
Published: 21 July 2020.
Edited by:
Fernando Cendes, Campinas State University, BrazilReviewed by:
Daniel San Juan Orta, Instituto Nacional de Neurología y Neurocirugía Manuel Velasco Suárez, MexicoXi Long, Eindhoven University of Technology, Netherlands
Copyright © 2020 Kim, Nguyen, Pham, Bui, Truong, Ha and Vu. This is an open-access article distributed under the terms of the Creative Commons Attribution License (CC BY). The use, distribution or reproduction in other forums is permitted, provided the original author(s) and the copyright owner(s) are credited and that the original publication in this journal is cited, in accordance with accepted academic practice. No use, distribution or reproduction is permitted which does not comply with these terms.
*Correspondence: Tam Vu, dGFtLnZ1QGNvbG9yYWRvLmVkdQ==; dGFtLnZ1QGNzLm94LmFjLnVr