 Bingliang Zeng
 Jian Zhou1†
 Hua Zhang
- 1Department of Radiology, Jiangxi Provincial People's Hospital Affiliated to Nanchang University, Nanchang, China
- 2Department of Imaging, The Third Affiliated Hospital of Nanchang University, Nanchang, China
- 3Department of Imaging, The First Hospital of Nanchang, Nanchang, China
- 4Department of Radiology, Nanfeng County People's Hospital, Fuzhou, China
- 5Radiology Department, Jinxian County People's Hospital, Nanchang, China
Objective: To investigate regional brain activity alteration in healthy subjects in a sleep deprivation (SD) status relative to a rested wakefulness status using a percent amplitude of fluctuation (PerAF) method.
Methods: A total of 20 healthy participants (12 males, 8 females; age, 22.25 ± 1.12 years) were recruited. All participants underwent attention tests and resting-state functional MRI scans during rested wakefulness before SD and after 36 h SD, respectively. The PerAF method was applied to identify SD-related regional brain activity alteration. A ROC curve was conducted to evaluate the ability of the PerAF method in distinguishing different sleep statuses. The relationships between SD-induced brain alterations and attention deficits were determined by Pearson correlation analysis.
Results: SD resulted in a 2.23% decrease in accuracy rate and an 8.82% increase in reaction time. SD was associated with increased PerAF differences in the bilateral visual cortex and bilateral sensorimotor cortex, and was associated with decreased PerAF differences in bilateral dorsolateral prefrontal cortex and bilateral cerebellum posterior lobe. These SD-induced brain alterations exhibited a high discriminatory power of extremely high AUC values (0.993–1) in distinguishing the two statuses. The accuracy rate positively correlated with the bilateral cerebellum posterior lobe, and bilateral dorsolateral prefrontal cortex, and negatively correlated with the bilateral sensorimotor cortex.
Conclusions: Acute SD could lead to an ~8% attention deficit, which was associated with regional brain activity deficits. The PerAF method might work as a potential sensitivity biomarker for identifying different sleep statuses.
Introduction
Sleep has been increasingly shown to have far more impact on human health than it was previously recognized; however, sleep has been rarely studied by neuroimaging (1). Sleep deprivation (SD) is associated with maladaptive changes in emotion, cognition, immunity (1–9), and even expression of certain genes (10, 11). Although SD has been frequently used to explore behavioral and functional consequences caused by sleeploss (12, 13), the underlying neurobiological mechanisms of SD remain largely unknown.
During the last decade, modern brain neuroimaging techniques have been extensively used to encourage scholars to investigate the potential pernicious effects on cognitive function and regional brain areas caused by SD (4, 5, 14–18). Resting-state functional MRI (rs-fMRI) has been considered as an applicable and accepted method to address the regional brain activity deficits associated with SD. Regional homogeneity, amplitude of low-frequency fluctuations (ALFF), and fractional ALFF (fALFF) are three important methods of rs-fMRI to address regional brain alterations (5, 19–21), however, these methods could be easily influenced by physiological high-frequency respiratory and cardiac noise. A new method, namely percent amplitude of fluctuation (PerAF), has the best reliability relative to the regional homogeneity, ALFF, and degree centrality (22–24). Therefore, the proposed new method of PerAF may allow us to increase sensitivity and decrease bias when addressing the regional brain activity alternations associated with SD. However, SD has not currently been studied.
Sleep is associated with the gene transcription involved in synthesis and the maintenance of cell membrane lipids and myelin in the brain (25–27) which are particularly susceptible to insufficient sleep (27, 28). Chronic insufficient sleep and chronic stress were found to be associated with several structural changes in the brain (29, 30). Therefore, we hypothesized that SD was associated with widespread functional brain alternations, and these changes could be identified by the proposed PerAF method. To test this hypothesis, the present study utilized PerAF to identify these regional brain alternations in healthy university subjects following 36 h SD relative to a normal sleep status, which may yield insight into the neurobiological mechanisms underlying SD.
Materials and Methods
Subjects
A total of 20 healthy university subjects (12 males, 8 females; age, 22.25 ± 1.12 years; education, 12.8 ± 1.01 years) were recruited. All participants met the following criteria as in a previous study (1): good sleeping habits; had not used any stimulants, hypnotic medication, and psychoactive medication for at least the last 3 months; score of Pittsburgh sleep quality index lower than five, score of Hamilton Depression Rating Scale lower than seven, and score of Hamilton Anxiety Rating Scale lower than seven. The exclusion criteria met the following criteria: any history of pathological brain findings and head trauma; any foreign implants and inborn or acquired diseases; BMI >32 and BMI <19.8; any psychiatric or neurological disorders, substance dependency; and any history of sleep complaints.
The 36 h SD procedure was the same as in previous studies (1, 16), which started at 8:00 p.m. in the evening and ended at 8:00 a.m. on the third day. Our team took turns monitoring the subjects for quality control. All university subjects were required to stay awake and not allowed to sleep during the entire time of the SD procedure. All subjects were not allowed to leave the testing room and were provided with food and water during the SD procedure. All food and/or beverages did not contain caffeine, taurine, or other psychoactive substances that could influence anxiety. This study was approved by the ethical committee of our hospital. All participants were told the purpose, methods, and potential risks, and were asked to complete written informed consent.
Attention Network Test (ANT)
All university subjects were required to conduct an attention network test (ANT) at 8:00 p.m. on the first day and at 8:00 a.m. on the third day before the MRI scans (1, 5, 31, 32). The description of the ANT was the same as in a previous study (1). The ANT comprised of three cue conditions (no cue, center cue, spatial cue) and two arrows (congruent and incongruent) in the center. Participants gave their responses by identifying the congruent or incongruent direction of central arrows. The accuracy rate and reaction time were recorded by calculating the corrected recognition and response times, respectively.
MRI
All subjects underwent MRI scans twice, one following normal sleep and the other following 36 h SD. We used a 3.0-Tesla MR scanner (Prisma, Siemens, Germany) to finish the resting-state fMRI session. Firstly, a total of 176 slices of high-resolution anatomical volumes (repetition time = 1,900 ms, field of view= 256 × 256 mm, echo time = 2.26 ms, thickness = 0.5 mm, gap = 1 mm, flip angle = 110, and acquisition matrix = 256 × 256) with sagittal orientation were acquired. Next, a total of 240 functional volumes (repetition time = 2,000 ms, acquisition matrix = 64 × 64, echo time = 30 ms, gap = 0.7 mm, thickness = 3.5 mm, flip angle = 90°, FOV = 224 × 224 mm) were collected.
Data Analysis
Data pre-processing was performed by the RESTplus V1.2 (http://www.restfmri.net) toolbox. Firstly, the first ten functional volumes were removed. Next, other steps including form transformation, slice timing, head motion correction, spatial normalization to Montreal Neurological Institute (MNI) space and re-sampled at a resolution of 3 × 3 × 3 mm3, smooth (full-width Gaussian kernel = 6 × 6 × 6 mm) and linear detrend and filter (0.01–0.08 Hz) (21). Participants with more than 1.5 mm maximum translation and/or more than 1.5° degree of motion rotations in any directions were removed. Friston's 24 head motion parameters were used as covariates to regress out the effects of head motion (33–36). Linear regression was used to remove the covariates of global mean signal, white matter, head-motion, and cerebrospinal fluid signal. The PerAF method is the percentage of resting-state frequency domain of the blood oxygen level-dependent signal relative to the mean signal intensity of one given time series. After these steps of data pre-processing, the PerAF method was calculated, thus generating PerAF, mPerAF, and the z-transformation of zPerAF.
Statistical Analysis
Two pair t-tests were used to calculate the ANT differences between SD status and normal sleep status by IBM SPSS 21.0. A threshold of p < 0.05 was considered as significant.
Firstly, one sample t-tests were applied to calculate the within-group differences in brain areas for sleep deprivation status and normal sleep status, separately [false discovery rate (FDR) correction, voxel-wise p < 0.001, and cluster-level p < 0.001]. Next, a two-pair t-test was applied to calculate between-group differences of PerAF in brain alterations [gaussian random field (GRF) correction, voxel-wise p < 0.001 and cluster-level p < 0.001, cluster voxel volumes ≥ 7,101 mm3]. A receiver operating characteristic (ROC) curve was frequently applied to test if neuroimaging methods might serve as potential neurobiological indicators to differentiate the two different groups (5, 16, 19, 20, 37). Here, the ROC was applied to identify the ability of the proposed PerAF method in distinguishing SD status from normal sleep status. The relationships between SD-induced brain alterations and attention deficits were determined by Pearson correlation analysis. A threshold of p < 0.05 was considered as significant.
Results
Sample Characteristics
Compared with normal sleep, acute SD showed a 2.23% poorer accuracy rate (normal sleep status, accuracy rate = 98.32 ± 1.54%; SD status, accuracy rate = 96.13 ± 2.93%; t = −2.961; p = 0.005), and an 8.82% slower reaction time (normal sleep status, reaction time = 540.5 ± 58.09 ms; SD status, reaction time = 588.16 ± 70.84 ms; t = 2.327; p = 0.025).
PerAF Differences
Within-group differences for the SD status (Figure 1A) and the normal sleep status (Figure 1B) are shown in Figure 1 (p < 0.001, FDR corrected). The within-group statistical maps showed that the covered locations of the PerAF differences in brain areas during SD status (Figure 1A) were smaller than that of during normal sleep status (Figure 1B). The between-group statistical maps showed that compared with normal sleep status, SD status showed increased PerAF differences in the bilateral visual cortex (BA 17, 18) and bilateral sensorimotor cortex (BA 3, 4), and decreased PerAF differences in the bilateral dorsolateral prefrontal cortex (BA 9) and bilateral cerebellum posterior lobe (Table 1, Figures 2A,B).
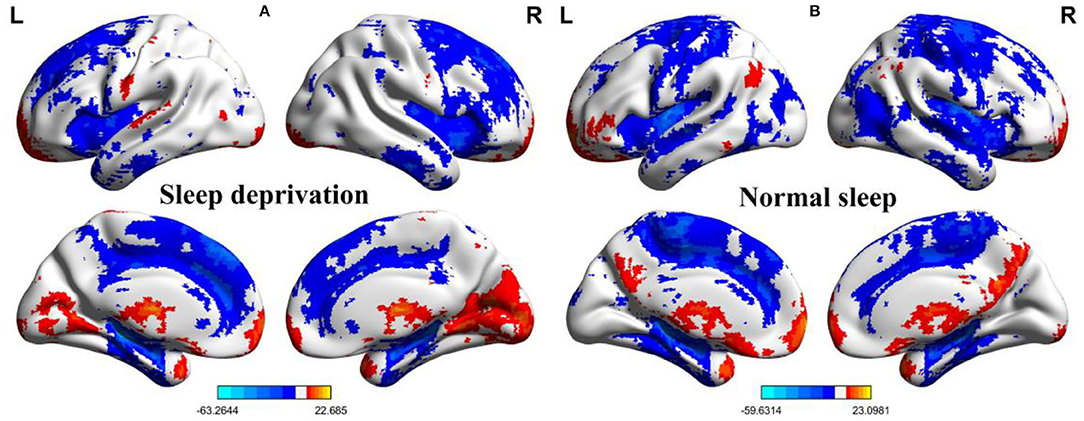
Figure 1. One sample t-test differences of SD status and normal sleep status in PerAF maps. (A) One sample results for sleep deprivation group; (B) One sample results for normal sleep group. SD, sleep deprivation; R, right; L, left; PerAF, percent amplitude of fluctuation.
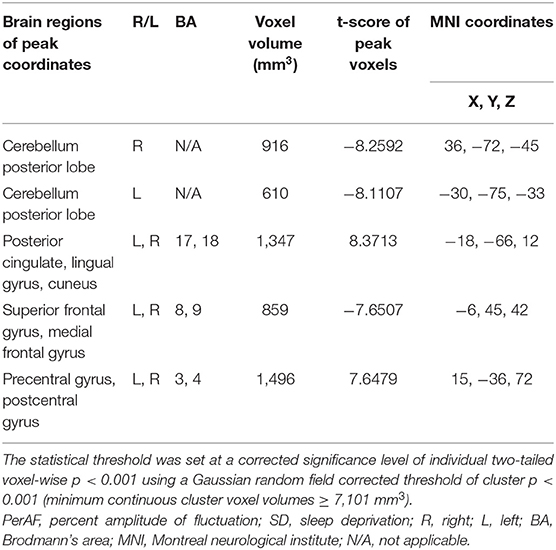
Table 1. The PerAF differences between SD status and normal sleep status.
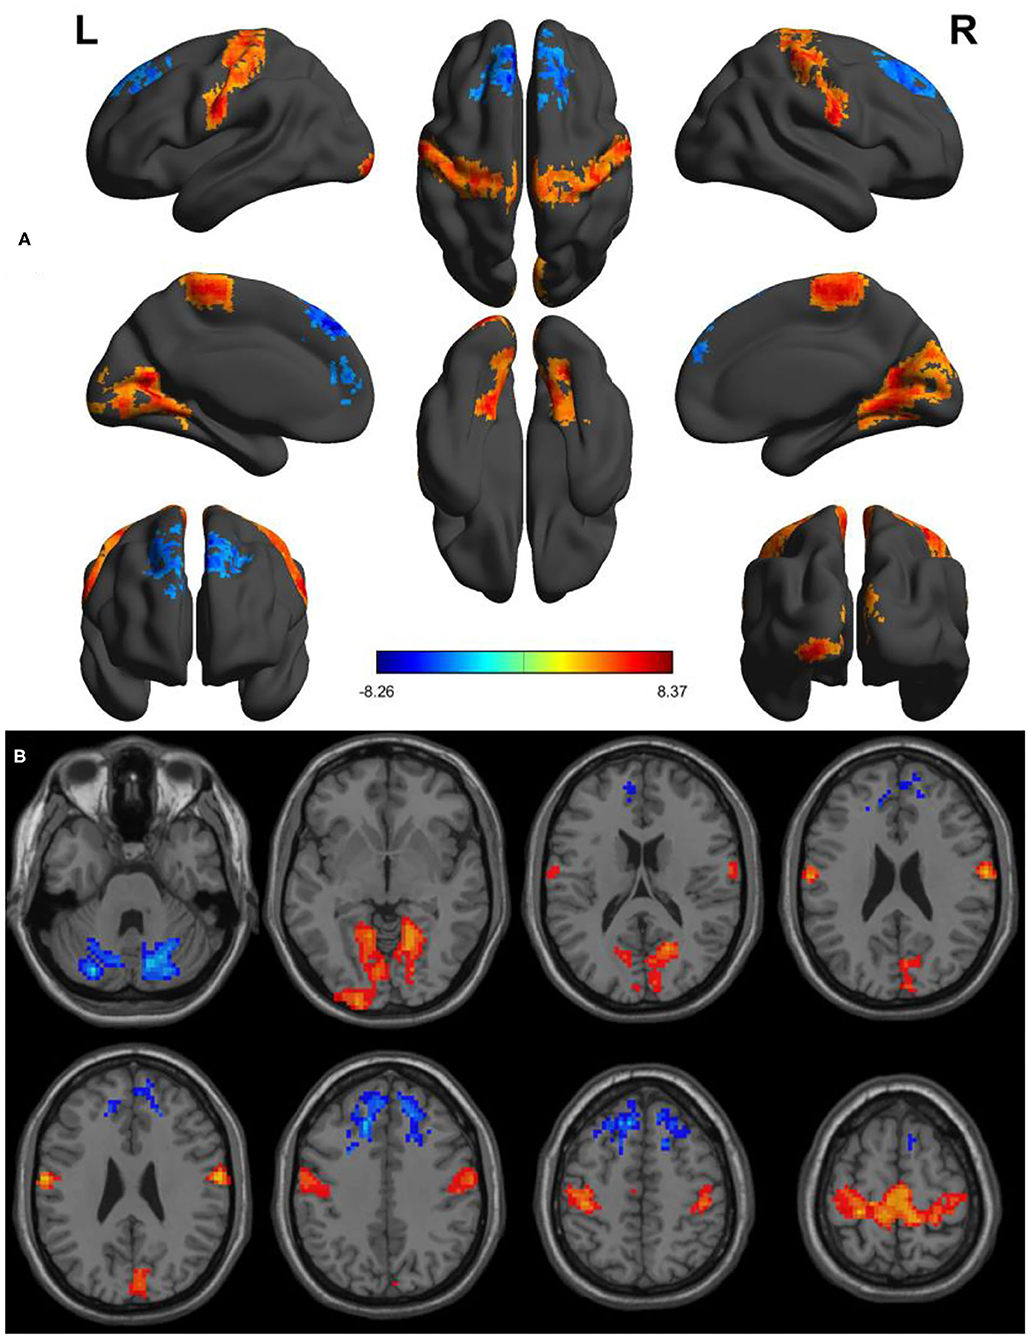
Figure 2. Altered PerAF between SD status and normal sleep status. (A) A comprehensive view; (B) Axial view. Red color, increased PerAF areas; Blue color, decreased PerAF areas. R, right; L, left; PerAF, percent amplitude of fluctuation; SD, sleep deprivation.
ROC Curve
Since these SD-induced brain alterations exhibited differences between the SD status and normal sleep status they might serve as potential neurobiological indicators to differentiate the two different sleep statuses, we extracted the mean PerAF values of these areas for ROC curve analysis (Figure 3). Our data indicated that these areas revealed an extremely high discriminatory power with a high AUC value of 0.986 ± 0.01 (0.993–1), and further diagnostic analysis also showed a high degree of sensitivity (97 ± 2.74%, 95–100%) and specificity (93 ± 5.7%, 85–100%) (Table 2, Figures 4A,B).
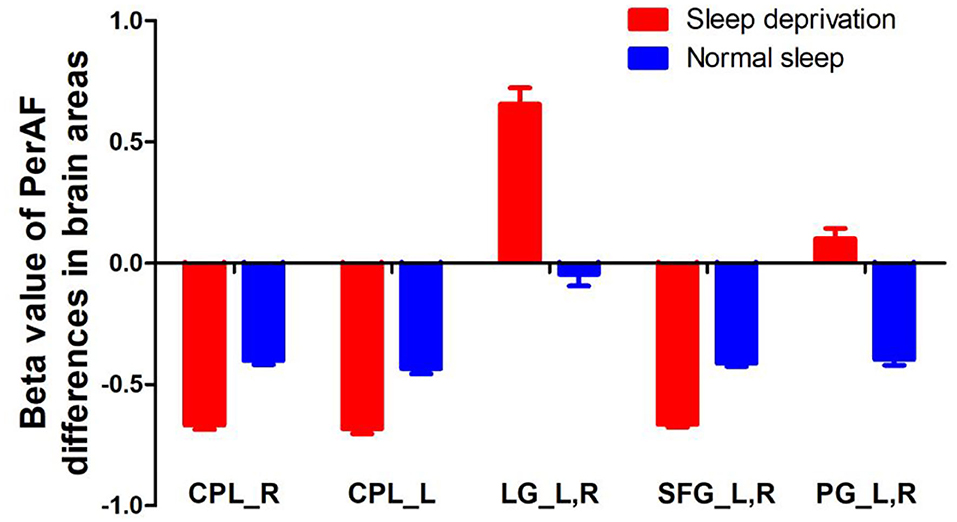
Figure 3. PerAF value of between-group differences in regional brain areas. PerAF, percent amplitude of fluctuation; R, right; L, left; CPL, cerebellum posterior lobe; LG, lingual gyrus; SFG, superior frontal gyrus; PG, postcentral gyrus.
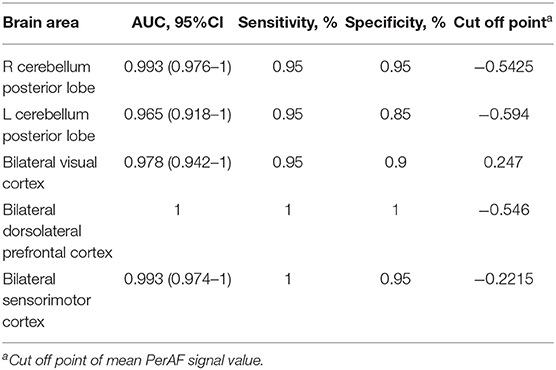
Table 2. ROC curve for PerAF differences in brain areas between SD status and normal sleep status.
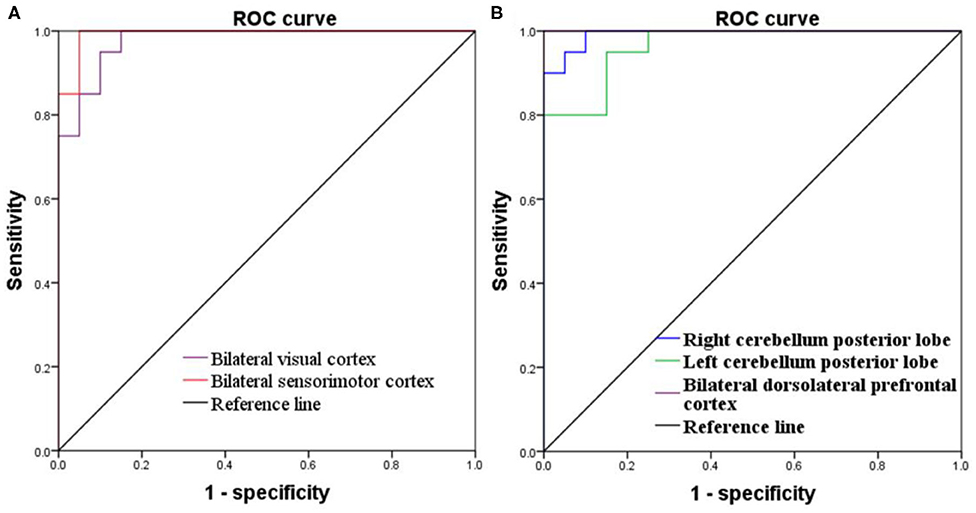
Figure 4. ROC curve of PerAF differences in brain areas. (A) Increased PerAF areas; (B) Decreased PerAF areas. ROC, receiver operating characteristic; PerAF, percent amplitude of fluctuation.
Pearson Correlation Analysis
During the SD status, several correlation analyses between the ANT differences and the SD-induced brain alterations that exhibited differences between the SD status and normal sleep status were reported (Figures 5A–D). The accuracy rate of the ANT positively correlated with the bilateral cerebellum posterior lobe (Right, r = 0.47, p = 0.036, Figure 5A; Left, r = 0.579, p = 0.007, Figure 5B) and the bilateral dorsolateral prefrontal cortex (r = 0.779, p < 0.001, Figure 5C), respectively. Furthermore, the accuracy rate of the ANT negatively correlated with the bilateral sensorimotor cortex (r = −0.494, p = 0.027, Figure 5D).
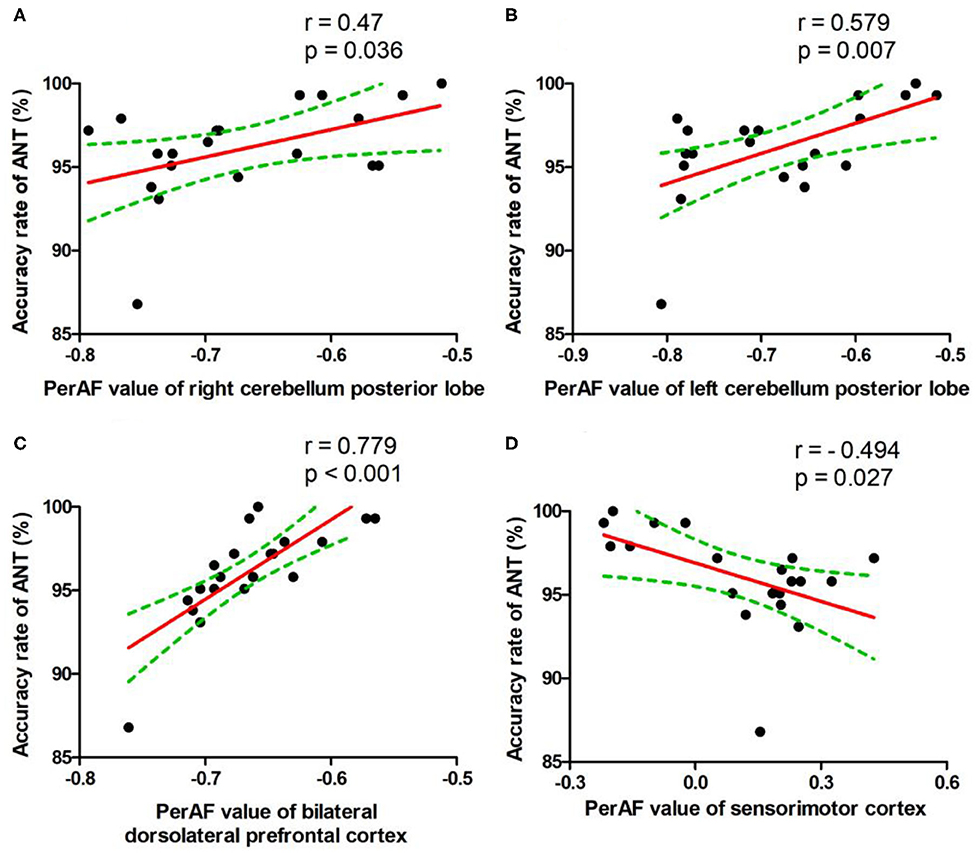
Figure 5. Pearson's correlation. Correlations were found between accuracy rate of ANT and bilateral cerebellum posterior lobe (Right, A; Left, B), bilateral dorsolateral prefrontal cortex (C), or bilateral sensorimotor cortex (D). PerAF, percent amplitude of fluctuation; ANT, attention network test.
Discussion
The present study is the first to apply the proposed PerAF method to identify SD-induced brain alterations in healthy university subjects following a total of 36 h of SD, and their relationships with the ANT. The present study reported three main findings: (a) the status transformation from normal sleep to 36 h SD in healthy subjects resulted in a 2.23% decrease in accuracy rate and an 8.82% increase in reaction time in attention; (b) SD was associated with increased PerAF differences in the bilateral visual cortex and bilateral sensorimotor cortex, and decreased PerAF differences in the bilateral dorsolateral prefrontal cortex and bilateral cerebellum posterior lobe; (c) these SD-induced brain areas exhibited an extremely high discriminatory power with extremely high AUC values (0.993–1) in distinguishing the two sleep statuses, which indicated that the PerAF method might be a potential neuroimaging indicator to differentiate different sleep statuses; (d) the accuracy rate positively correlated with the bilateral cerebellum posterior lobe and bilateral dorsolateral prefrontal cortex, and negatively correlated with the bilateral sensorimotor cortex.
Previous neuroimaging studies have shown higher regional spontaneous neural activity and short-range functional connectivity in the visual cortex in chronic insomnia patients and healthy individuals after sleep deprivation (4, 16, 18, 19, 38–41). The hyper-responses of the visual cortex has been considered as a core factor leading to the inability to initiate or maintain sleep in chronic insomnia patients (19, 39, 40, 42–46). Increased regional brain activity and functional connectivity, such as voxel-mirrored homotopic connectivity and short/long-range functional connectivity, and decreased gray matter volumes in the somatosensory cortex in chronic insomnia patients and in healthy individuals after SD status have been reported (1, 16, 37, 41). These regional brain alterations had several correlations with attention and spatial working memory deficits after the SD session (1). PET studies found that SD increased the metabolic rate of glucose in the visual and somatosensory cortex, and the metabolic rate was higher after a longer duration of SD than that of a shorter duration of SD (47, 48). Our data supported these findings. In our study, SD increased PerAF differences in the two cortexes, and these areas negatively correlated with the accuracy rate of the ANT. In this framework, we speculated that increased PerAF in these regions might be compensatory responses to the cognitive deficits. These findings support the excessive hyperarousal theory of insomnia (45).
The cerebellum posterior lobe is associated with language, cognition, and emotion, and also with the regulation of planning, initiating, and coordinating movement (4, 19, 49–51). Previous studies have shown that the cerebellum was associated with several neurologic and psychiatric diseases, including obstructive sleep apnea (52), depression (53), primary insomnia (19, 39), mood disorders (54), and sleep deprivation (4, 16, 41) and was correlated with the accuracy rate of ANT (16). Our study showed consistent findings with decreased PerAF in the cerebellum and dorsolateral prefrontal cortex, and the two areas showed positive correlations with the accuracy rate of ANT. In this framework, the decreased regional brain activity in the cerebellum and dorsolateral prefrontal cortex may suggest that the brain needs to recruit more advanced cognitive function-related brain areas to offset the attention deficits during SD, due to a continuing declined activity in these two areas during insufficient sleep status (16).
Conclusions
In summary, the proposed method of PerAF might be a potential sensitivity neuroimaging indicator to differentiate different sleep statuses. Acute SD could lead to an ~8% attention deficit, which was associated with the increased PerAF differences in the visual cortex and sensorimotor cortex, and the decreased PerAF differences in the dorsolateral attention cortex and cerebellum. These findings could expand our knowledge of the pathophysiological mechanism of insufficient sleep and related diseases, and could provide guidance for healthcare professionals to reduce the mistakes caused by lack of sleep. However, there are several limitations that should be addressed. Firstly, the effect of differences in gender was not considered (4, 19). Secondly, the small sample sizes limited the comparisons. Thirdly, the caloric intake and sleep at baseline were not considered.
Data Availability Statement
The raw data supporting the conclusions of this article will be made available by the authors, without undue reservation.
Ethics Statement
The studies involving human participants were reviewed and approved by Jiangxi Provincial People's Hospital Affiliated to Nanchang University. The patients/participants provided their written informed consent to participate in this study.
Author Contributions
BZ, ZiL, and HZ conceived and designed the whole experiment. BZ, JZ, ZoL, and PY took responsibility for the integrity of the data, the accuracy of the data analysis, and statistical data analysis. BZ wrote the main manuscript text, and under took the critical interpretation of the data. All authors contributed to the final version of the paper and have read, as well as, approved the final manuscript.
Conflict of Interest
The authors declare that the research was conducted in the absence of any commercial or financial relationships that could be construed as a potential conflict of interest.
References
1. Dai XJ, Jiang J, Zhang Z, Nie X, Liu B-X, Pei L, et al. Plasticity and susceptibility of brain morphometry alterations to insufficient sleep. Front Psychiatry. (2018) 9:266. doi: 10.3389/fpsyt.2018.00266
2. Gottesmann C. Noradrenaline involvement in basic and higher integrated REM sleep processes. Prog Neurobiol. (2008) 85:237–72. doi: 10.1016/j.pneurobio.2008.04.002
3. Silva RH, Abílio VC, Takatsu AL, Kameda SR, Grassl C, Chehin AB, et al. Role of hippocampal oxidative stress in memory deficits induced by sleep deprivation in mice. Neuropharmacology. (2004) 46:895–903. doi: 10.1016/j.neuropharm.2003.11.032
4. Dai XJ, Gong HH, Wang YX, Zhou FQ, Min YJ, Zhao F, et al. Gender differences in brain regional homogeneity of healthy subjects after normal sleep and after sleep deprivation: a resting-state fMRI study. Sleep Med. (2012) 13:720–7. doi: 10.1016/j.sleep.2011.09.019
5. Dai XJ, Liu CL, Zhou RL, Gong HH, Wu B, Gao L, et al. Long-term total sleep deprivation decreases the default spontaneous activity and connectivity pattern in healthy male subjects: a resting-state fMRI study. Neuropsychiatr Dis Treat. (2015) 11:761–72. doi: 10.2147/NDT.S78335
6. Edwards RR, Quartana PJ, Allen RP, Greenbaum S, Earley CJ, Smith MT. Alterations in pain responses in treated and untreated patients with restless legs syndrome: associations with sleep disruption. Sleep Med. (2011) 12:603–9. doi: 10.1016/j.sleep.2010.09.018
7. Ohayon MM, Smolensky MH, Roth T. Consequences of shiftworking on sleep duration, sleepiness, and sleep attacks. Chronobiol Int. (2010) 27:575–89. doi: 10.3109/07420521003749956
8. Tsigos C, Chrousos GP. Hypothalamic-pituitary-adrenal axis, neuroendocrine factors and stress. J Psychosom Res. (2002) 53:865–71. doi: 10.1016/S0022-3999(02)00429-4
9. Walker MP, Stickgold R. Sleep, memory, and plasticity. Annu Rev Psychol. (2006) 57:139–66. doi: 10.1146/annurev.psych.56.091103.070307
10. Naidoo N, Giang W, Galante RJ, Pack AI. Sleep deprivation induces the unfolded protein response in mouse cerebral cortex. J Neurochem. (2005) 92:1150–7. doi: 10.1111/j.1471-4159.2004.02952.x
11. Koban M, Swinson KL. Chronic REM-sleep deprivation of rats elevates metabolic rate and increases UCP1 gene expression in brown adipose tissue. Am J Physiol Endocrinol Metab. (2005) 289:E68–74. doi: 10.1152/ajpendo.00543.2004
12. Alhola P, Polo-Kantola P. Sleep deprivation: impact on cognitive performance. Neuropsychiatr Dis Treat. (2007) 3:553–67.
13. Krause AJ, Simon EB, Mander BA, Greer SM, Saletin JM, Goldstein-Piekarski AN, et al. The sleep-deprived human brain. Nat Rev Neurosci. (2017) 18:404–18. doi: 10.1038/nrn.2017.55
14. Plante DT, Trksak GH, Jensen JE, Penetar DM, Ravichandran C, Riedner BA, et al. Gray matter-specific changes in brain bioenergetics after acute sleep deprivation: a 31P magnetic resonance spectroscopy study at 4 Tesla. Sleep. (2014) 37:1919–27. doi: 10.5665/sleep.4242
15. Rocklage M, Williams V, Pacheco J, Schnyer DM. White matter differences predict cognitive vulnerability to sleep deprivation. Sleep. (2009) 32:1100–3. doi: 10.1093/sleep/32.8.1100
16. Chen L, Qi X, Zheng J. Altered regional cortical brain activity in healthy subjects after sleep deprivation: a functional magnetic resonance imaging study. Front Neurol. (2018) 9:588. doi: 10.3389/fneur.2018.00588
17. Wang L, Chen Y, Yao Y, Pan Y, Sun Y. Sleep deprivation disturbed regional brain activity in healthy subjects: evidence from a functional magnetic resonance-imaging study. Neuropsychiatr Dis Treat. (2016) 12:801–7. doi: 10.2147/NDT.S99644
18. Gao L, Bai L, Zhang Y, Dai XJ, Netra R, Min Y, et al. Frequency-dependent changes of local resting oscillations in sleep-deprived brain. PLoS ONE. (2015) 10:e0120323. doi: 10.1371/journal.pone.0120323
19. Dai XJ, Nie X, Liu X, Pei L, Jiang J, Peng DC, et al. Gender differences in regional brain activity in patients with chronic primary insomnia: evidence from a resting-state fMRI study. J Clin Sleep Med. (2016) 12:363–74. doi: 10.5664/jcsm.5586
20. Li HJ, Dai XJ, Gong HH, Nie X, Zhang W, Peng DC. Aberrant spontaneous low-frequency brain activity in male patients with severe obstructive sleep apnea revealed by resting-state functional MRI. Neuropsychiatr Dis Treat. (2015) 11:207–14. doi: 10.2147/NDT.S73730
21. Chen LC, Li X, Shen L. Self-limited focal epilepsy decreased regional brain activity in sensorimotor areas. Acta Neurol Scand. (2020) 142:13350–74. doi: 10.1111/ane.13350
22. Zhao N, Yuan LX, Jia XZ, Zhou XF, Deng XP, He HJ, et al. Intra- and inter-scanner reliability of voxel-wise whole-brain analytic metrics for resting state fMRI. Front Neuroinform. (2018) 12:54. doi: 10.3389/fninf.2018.00054
23. Jia XZ, Sun JW, Ji GJ, Liao W, Lv YT, Wang J, et al. Percent amplitude of fluctuation: a simple measure for resting-state fMRI signal at single voxel level. PLoS ONE. (2020) 15:e0227021. doi: 10.1371/journal.pone.0227021
24. Song XW, Dong ZY, Long XY, Li SF, Zuo XN, Zhu CZ, et al. RESTplus: an improved toolkit for resting-state functional magnetic resonance imaging data processing. Sci Bull. (2019) 64:953–4. doi: 10.1016/j.scib.2019.05.008
25. Mongrain V, Hernandez SA, Pradervand S, Dorsaz S, Curie T, Hagiwara G, et al. Separating the contribution of glucocorticoids and wakefulness to the molecular and electrophysiological correlates of sleep homeostasis. Sleep. (2010) 33:1147–57. doi: 10.1093/sleep/33.9.1147
26. Cirelli C, Gutierrez CM, Tononi G. Extensive and divergent effects of sleep and wakefulness on brain gene expression. Neuron. (2004) 41:35–43. doi: 10.1016/S0896-6273(03)00814-6
27. Bellesi M, Pfister-Genskow M, Maret S, Keles S, Tononi G, Cirelli C. Effects of sleep and wake on oligodendrocytes and their precursors. J Neurosci. (2013) 33:14288–300. doi: 10.1523/JNEUROSCI.5102-12.2013
28. Hinard V, Mikhail C, Pradervand S, Curie T, Houtkooper RH, Auwerx J, et al. Key electrophysiological, molecular, and metabolic signatures of sleep and wakefulness revealed in primary cortical cultures. J Neurosci. (2012) 32:12506–17. doi: 10.1523/JNEUROSCI.2306-12.2012
29. Schoenfeld TJ, McCausland HC, Morris HD, Padmanaban V, Cameron HA. Stress and loss of adult neurogenesis differentially reduce hippocampal volume. Biol Psychiatry. (2017) 82:914–23. doi: 10.1016/j.biopsych.2017.05.013
30. Bellesi M, de Vivo L, Chini M, Gilli F, Tononi G, Cirelli C. Sleep loss promotes astrocytic phagocytosis and microglial activation in mouse cerebral cortex. J Neurosci. (2017) 37:5263–73. doi: 10.1523/JNEUROSCI.3981-16.2017
31. Fan J, McCandliss BD, Fossella J, Flombaum JI, Posner MI. The activation of attentional networks. Neuroimage. (2005) 26:471–9. doi: 10.1016/j.neuroimage.2005.02.004
32. Fan J, McCandliss BD, Sommer T, Raz A, Posner MI. Testing the efficiency and independence of attentional networks. J Cogn Neurosci. (2002) 14:340–7. doi: 10.1162/089892902317361886
33. Satterthwaite TD, Elliott MA, Gerraty RT, Ruparel K, Loughead J, Calkins ME, et al. An improved framework for confound regression and filtering for control of motion artifact in the preprocessing of resting-state functional connectivity data. Neuroimage. (2013) 64:240–56. doi: 10.1016/j.neuroimage.2012.08.052
34. Yan CG, Cheung B, Kelly C, Colcombe S, Craddock RC, Di Martino A, et al. A comprehensive assessment of regional variation in the impact of head micromovements on functional connectomics. Neuroimage. (2013) 76:183–201. doi: 10.1016/j.neuroimage.2013.03.004
35. Van Dijk KR, Sabuncu MR, Buckner RL. The influence of head motion on intrinsic functional connectivity MRI. Neuroimage. (2012) 59:431–8. doi: 10.1016/j.neuroimage.2011.07.044
36. Power JD, Barnes KA, Snyder AZ, Schlaggar BL, Petersen SE. Spurious but systematic correlations in functional connectivity MRI networks arise from subject motion. Neuroimage. (2012) 59:2142–54. doi: 10.1016/j.neuroimage.2011.10.018
37. Dai XJ, Liu BX, Ai S, Nie X, Xu Q, Hu J, et al. Altered inter-hemispheric communication of default-mode and visual networks underlie etiology of primary insomnia : altered inter-hemispheric communication underlie etiology of insomnia. Brain Imaging Behav. (2019) 14:1430–44. doi: 10.1007/s11682-019-00064-0
38. Nie X, Shao Y, Liu SY, Li HJ, Wan AL, Nie S, et al. Functional connectivity of paired default mode network subregions in primary insomnia. Neuropsychiatr Dis Treat. (2015) 11:3085–93. doi: 10.2147/NDT.S95224
39. Dai XJ, Peng DC, Gong HH, Wan AL, Nie X, Li HJ, et al. Altered intrinsic regional brain spontaneous activity and subjective sleep quality in patients with chronic primary insomnia: a resting-state fMRI study. Neuropsychiatr Dis Treat. (2014) 10:2163–75. doi: 10.2147/NDT.S69681
40. Dai XJ, Wang N, Ai SZ, Gong L, Tao W, Fan J, et al. Decreased modulation of segregated SEEKING and selective attention systems in chronic insomnia. Brain Imaging Behav. (2020). doi: 10.1007/s11682-020-00271-0. [Epub ahead of print].
41. Kong D, Liu R, Song L, Zheng J, Zhang J, Chen W. Altered long- and short-range functional connectivity density in healthy subjects after sleep deprivations. Front Neurol. (2018) 9:546. doi: 10.3389/fneur.2018.00546
42. Nofzinger EA, Buysse DJ, Germain A, Price JC, Miewald JM, Kupfer DJ. Functional neuroimaging evidence for hyperarousal in insomnia. Am J Psychiatry. (2004) 161:2126–8. doi: 10.1176/appi.ajp.161.11.2126
43. Harvey AG. A cognitive model of insomnia. Behav Res Ther. (2002) 40:869–93. doi: 10.1016/S0005-7967(01)00061-4
44. Merica H, Blois R, Gaillard JM. Spectral characteristics of sleep EEG in chronic insomnia. Eur J Neurosci. (1998) 10:1826–34. doi: 10.1046/j.1460-9568.1998.00189.x
45. Perlis ML, Merica H, Smith MT, Giles DE. Beta EEG activity and insomnia. Sleep Med Rev. (2001) 5:363–74. doi: 10.1053/smrv.2001.0151
46. O'Byrne JN, Berman Rosa M, Gouin JP, Dang-Vu TT. Neuroimaging findings in primary insomnia. Pathol Biol. (2014) 62:262–9. doi: 10.1016/j.patbio.2014.05.013
47. Wu JC, Gillin JC, Buchsbaum MS, Hershey T, Hazlett E, Sicotte N, et al. The effect of sleep deprivation on cerebral glucose metabolic rate in normal humans assessed with positron emission tomography. Sleep. (1991) 14:155–62.
48. Thomas M, Sing H, Belenky G, Holcomb H, Mayberg H, Dannals R, et al. Neural basis of alertness and cognitive performance impairments during sleepiness. I. Effects of 24 h of sleep deprivation on waking human regional brain activity. J Sleep Res. (2000) 9:335–52. doi: 10.1046/j.1365-2869.2000.00225.x
49. Parvizi J, Anderson SW, Martin CO, Damasio H, Damasio AR. Pathological laughter and crying: a link to the cerebellum. Brain. (2001) 124(Pt 9):1708–19. doi: 10.1093/brain/124.9.1708
50. Yoo SS, Teh EK, Blinder RA, Jolesz FA. Modulation of cerebellar activities by acupuncture stimulation: evidence from fMRI study. Neuroimage. (2004) 22:932–40. doi: 10.1016/j.neuroimage.2004.02.017
51. Desmond J, Marvel C. Cognition: cerebellum role. Encycl Neurosci. (2009) 2:1079–85. doi: 10.1016/B978-008045046-9.00411-3
52. Peng DC, Dai XJ, Gong HH, Li HJ, Nie X, Zhang W. Altered intrinsic regional brain activity in male patients with severe obstructive sleep apnea: a resting-state functional magnetic resonance imaging study. Neuropsychiatr Dis Treat. (2014) 10:1819–26. doi: 10.2147/NDT.S67805
53. Liu Z, Xu C, Xu Y, Wang Y, Zhao B, Lv Y, et al. Decreased regional homogeneity in insula and cerebellum: a resting-state fMRI study in patients with major depression and subjects at high risk for major depression. Psychiat Res Neuroim. (2010) 182:211–5. doi: 10.1016/j.pscychresns.2010.03.004
Keywords: sleep deprivation, percent amplitude of fluctuation, receiver operating characteristic, attention network test, visual cortex, cognitive deficit
Citation: Zeng B, Zhou J, Li Z, Zhang H, Li Z and Yu P (2021) Altered Percent Amplitude of Fluctuation in Healthy Subjects After 36 h Sleep Deprivation. Front. Neurol. 11:565025. doi: 10.3389/fneur.2020.565025
Received: 23 May 2020; Accepted: 26 August 2020;
Published: 15 January 2021.
Edited by:
Yongjun Wang, Shenzhen KangNing Hospital, ChinaReviewed by:
Jiyong Zheng, Huai'an First People's Hospital, ChinaCamilla L. Patti, Federal University of São Paulo, Brazil
Copyright © 2021 Zeng, Zhou, Li, Zhang, Li and Yu. This is an open-access article distributed under the terms of the Creative Commons Attribution License (CC BY). The use, distribution or reproduction in other forums is permitted, provided the original author(s) and the copyright owner(s) are credited and that the original publication in this journal is cited, in accordance with accepted academic practice. No use, distribution or reproduction is permitted which does not comply with these terms.
*Correspondence: Zicong Li, bGVlaGFuZGxlQGFsaXl1bi5jb20=; Hua Zhang, NjIzNDc5NTIwQHFxLmNvbQ==
†These authors have contributed equally to this work