 Hai-Bin Xu
 Yu-Fei Sun
 Na Luo
 Jia-Qi Wang
 Guo-Can Chang
 Lin Tao
 Ben-Qiang Yang
 Hui-Sheng Chen
- 1Department of Neurology, General Hospital of Northern Theater Command, ShenYang, China
- 2Department of Radiology, General Hospital of Northern Theater Command, ShenYang, China
Background and purpose: Previous studies have demonstrated that Net Water Uptake (NWU) is associated with the development of malignant edema (ME). The current study aimed to investigate whether NWU calculated in standardized and blindly outlined regions of the middle cerebral artery can predict the development of ME.
Methods: We retrospectively included 119 patients suffering from large hemispheric infarction within onset of 24 h. The region of the middle cerebral artery territory was blindly outlined in a standard manner to calculate NWU. Patients were divided into two groups according to the occurrence of ME, which is defined as space-occupying infarct requiring decompressive craniotomy or death due to cerebral hernia in 7 days from onset. The clinical characteristics were analyzed, and the receiver operating characteristic curve (ROC curve) was used to assess the predictive ability of NWU and other factors for ME.
Results: Multivariable analysis showed that NWU was an independent predictor of ME (OR 1.168, 95% CI 1.041–1.310). According to the ROC curve, NWU≥8.127% identified ME with good predictive power (AUC 0.734, sensitivity 0.656, specificity 0.862).
Conclusions: NWU calculated in standardized and blindly outlined regions of the middle cerebral artery territory is also a good predictor for the development of ME in patients with large hemispheric infarction.
Introduction
Stroke has become a leading cause of mortality and disability worldwide, and it brings huge economic costs and family burdens (1). Acute ischemic stroke accounts for about 80% of all types of stroke (2). Large hemispheric infarction (LHI) is defined as affecting the majority of or complete middle cerebral artery (MCA) territory with or without anterior cerebral artery and posterior cerebral artery involvement (3). It is a disastrous subtype of acute ischemic stroke, which may lead to life-threatening swelling (4). Furthermore, LHI patients with malignant edema (ME) develop a mortality rate of nearly 40 ~ 80% under standard treatment, while mortality of those without ME is nearly 5 ~ 25% (3, 5, 6). It has been demonstrated by previous studies that timely decompressive craniotomy may reduce the mortality of LHI patients with ME (7, 8). Thus, early identification of LHI patients at risk for ME should be anticipated (3, 9).
There have been several studies exploring valid predictors of ME in LHI patients, such as the National Institutes of Health Stroke Scale (NIHSS), presence of hyperdense artery sign, a higher level of blood glucose, decreased level of consciousness, early infarct signs, intracranial cerebrospinal fluid volume, fluid balance variations, collateral circulation (10–17).
Interestingly, in 2018, Broocks' team found that Net Water Uptake (NWU) on baseline Computed Tomography (CT) was an important predictor of ME in LHI patients (9). Since then, accumulating evidence demonstrates that NWU can be used as an important qualified biomarker of edema in ischemic stroke. For example, NWU was used to estimate final infarction volumes (18), which serves as an indicator of “tissue clock” instead of the real “time clock” (19), and predicted the effect of recanalization (20) and early bleeding risk after endovascular treatment, especially with low ASPECTS (21). However, the measurement of NWU in previous studies mainly depends on CT perfusion (CTP) (9, 18–21). However, not all stroke centers have access to CTP in clinical practice. In this study, we aimed to investigate, whether NWU calculated in standardized and blindly outlined regions of the MCA territory is a reliable predictor of ME in patients with LHI.
Methods
Population
The medical records and images of consecutive patients with LHI at Northern Theater General Hospital between October 9, 2017, and July 13, 2020, were reviewed retrospectively. This retrospective study was approved by an institutional review board and informed consent was waived. Patients were screened based on the following inclusion criteria: (1) acute ischemic stroke involving the anterior circulation with non-enhanced CT (NECT) with or without computed tomography angiography (CTA) at admission within 24 h from symptom onset; (2) follow-up NECT or diffusion weighted imaging (DWI) available within 24–48 h from symptom onset; and (3) MCA infarction occupying >1/2 MCA territory confirmed by follow-up CT or DWI; (4) NIHSS >3 at admission. Patients were excluded based on the following exclusion criteria: (1) presence of intracranial or subarachnoid hemorrhage at admission; (2) presence of symptomatic intracranial hemorrhage (SICH) (22) in follow-up CT; (3) preexisting stroke with mRS ≥2; (4) images not qualified enough for measurement due to artifacts; and (5) patients undergoing mechanical thrombectomy (considering the effect on the development of ME). The enrolled patients were separated into the ME group and the non-ME group depending on the presence or absence of ME. According to a previous study (9), ME was defined as a space-occupying infarct requiring decompressive craniotomy or death resulting from cerebral hernia in 7 days from symptom onset.
The following characteristics of patients were recorded at baseline: gender, age, NIHSS, intravenous thrombolysis or not, previous medical history such as atrial fibrillation, hypertension, diabetes, and ischemic stroke, systolic and diastolic blood pressure, blood glucose, the time from onset to the first image.
Image Acquisition and Analysis
CT scanner (General Electric, Boston, United States of America) was used in this study. The tube settings for NECT were 120 kV and 300 mA per rotation. Slices were reconstructed with a thickness of 5 mm.
All NECT images were outlined and calculated by one experienced neuroradiologist (BQ Yang) and neurologist (HS Chen), separately. The territory of MCA at basal ganglia level was blindly outlined in a standard manner at the infarct side according to clinical evidence. As shown in Figure 1, the extension line of the anterior horn of the lateral ventricle was set as the anterior boundary, and the extension line of the posterior horn of the lateral ventricle as the posterior one, while the outer edge of the brain cortex was set as the outer boundary, and inter edge of the caput nuclei caudate and posterior limb of the internal capsule as the inter boundary. Then, the mean density of the outlined MCA territory was measured and recorded as Dischemic, while the mean density of a mirrored region at the contralateral side was measured and recorded as Dnormal using commercially available software (Analyze 14.0, Biomedical Imaging Resource, Mayo Clinic, Rochester, MN). Both density measurements were sampled between 20 and 80 Hounsfield units to avoid intracranial calcifications and cerebral fluid and were eventually used to calculate NWU according to the method reported in a previous study (9).
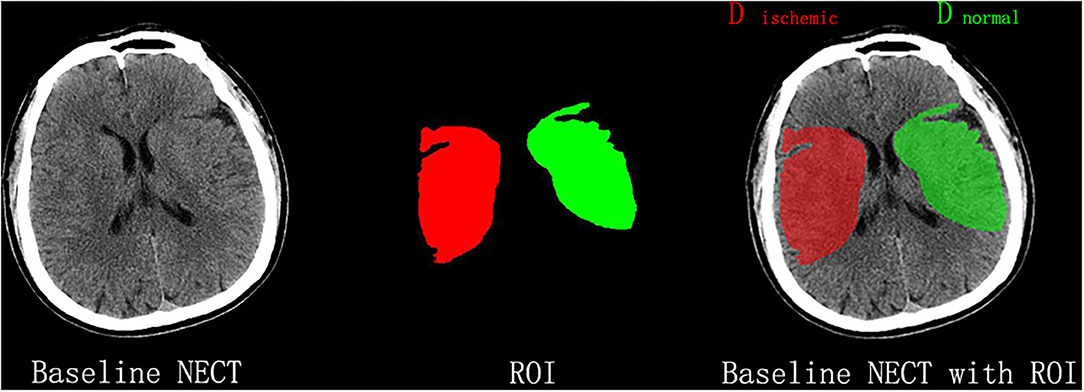
Figure 1. Measurement of NWU on admission nonenhanced computed tomography (NECT). According to the clinical manifestations, the infarct lesion occurred in the right middle cerebral artery territory, which was blindly outlined. The mean density of the territory (Dischemic) and a mirrored contralateral region of interest (Dnormal) was then measured to calculate NWU.
Statistical Analysis
Scatterplot was carried out using the open source statistical software RStudio Version 1.3.1093 (Rstudio PBC, Boston, MA), and visualization with the R package ggplot2 (23). Other statistical analyses were performed using SPSS 22.0 for Windows (IBM Corp, Armonk, NY). Quantitative variables were described as mean ± standard deviation (SD), or median and interquartile range (if not normally distributed) while counting data were presented as n (%). To compare the data between the two groups, we used a t-test or Mann–Whitney U-test (not normally distributed) for quantitative data, and a Chi-square test for counting data. Multivariable logistic regression analysis was used to identify the independent factors associated with ME. The odds ratio (OR) and 95% confidence interval (CI) were also calculated. A P-value of < 0.05 in two tails was considered to be significant. Receiver operating characteristic (ROC) curves and area under curve (AUC) were calculated, respectively, to assess the ability of the factors in identifying patients with ME.
The whole cohort was separated into six groups according to time windows (the time from onset to first image), that is 0–3 h, 3–6 h, 6–9 h, 9–12 h, 12–15 h, 15–24 h. ROC curves were used to assess the predictive ability of NWU in each time window in identifying ME. In addition, a scatterplot was used to show the possible relationship between NWU and the time from onset to first image. Two models reported in a previous study (9) were used to investigate if NWU is more likely to be linear-related with the time from onset to first image in 24 h. One model is NWU= b* time, stating that NWU is linear-related with the time from onset to first image. The other is NWU= b* log (time+1), representing a non-linear relation. Thus, NWU/time and NWU/log (time+1) were also tested together with absolute NWU as predictors of ME (9).
Results
We continuously screened 322 patients from our stroke registry database. We excluded 203 patients due to different reasons including incomplete clinical data, infarction occupying <1/2 MCA territory, mechanical thrombectomy, symptomatic intracranial hemorrhage in follow-up CT (Figure 2). Finally, 119 patients were recruited for the analysis including the non-ME group (n = 87) and ME group (n = 32). As shown in Table 1, NIHSS at admission, the time from onset to first image, NWU in ME group were higher than those in the non-ME group (P < 0.05), while there is no significant difference in other characteristics between two groups.
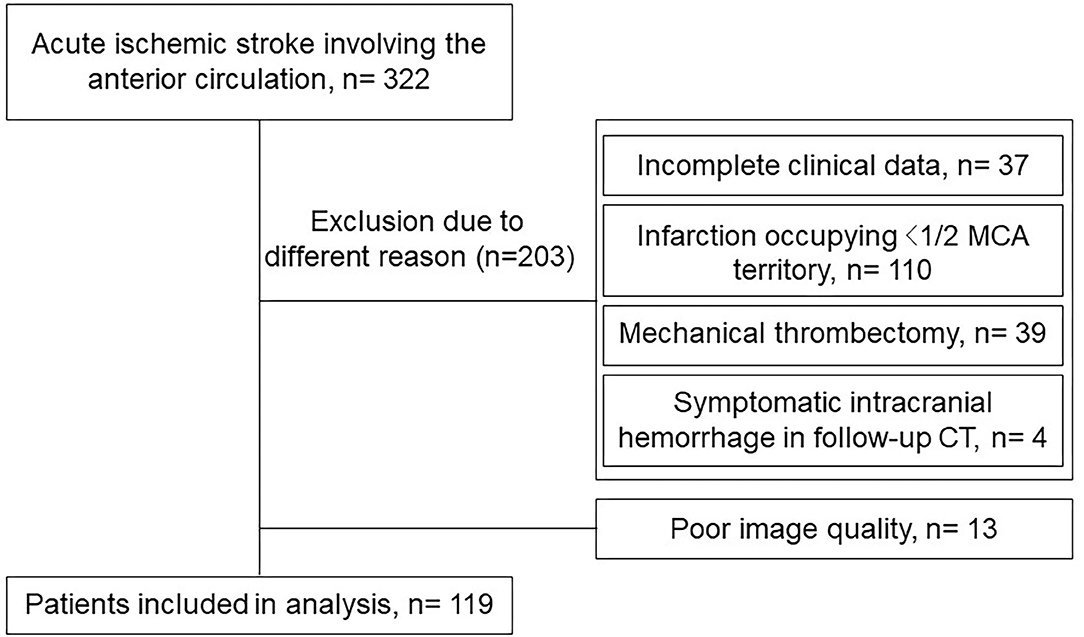
Figure 2. Flow chart with application of inclusion and exclusion criteria.
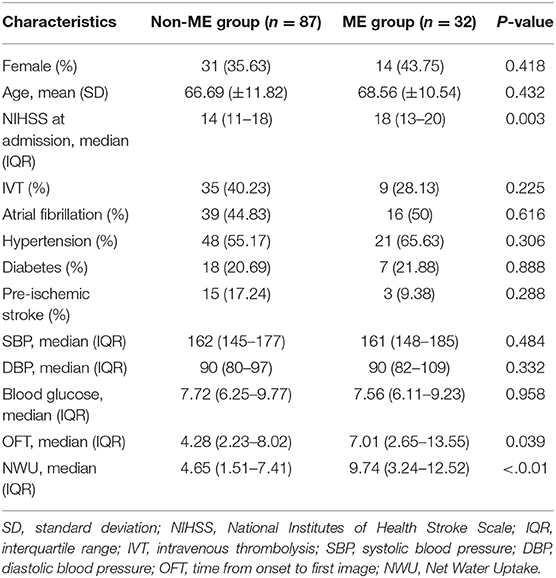
Table 1. Comparison of baseline characteristics between non-ME and ME groups.
The multivariable logistic regression analysis showed that NWU (OR: 1.168, 95% CI: 1.041–1.310) and NIHSS (OR: 1.121, 95% CI: 1.006–1.250) were significantly associated with ME, but not the time from onset to first image and tPA thrombolysis (Table 2).
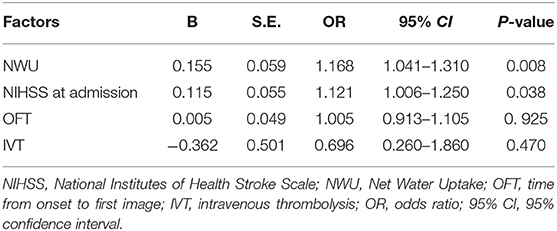
Table 2. Multivariable logistic regression analysis of NWU, NIHSS at admission, the time from onset to first image, and IVT.
ROC curves and AUC were also calculated to assess the prediction power of the factors mentioned above in identifying patients with ME. As shown in Figure 3; Table 3, NWU showed better performance at predicting the occurrence of ME with a higher AUC (0.734) than that of NIHSS at admission. The cutoff value, sensitivity, and specificity were exhibited in Table 3.
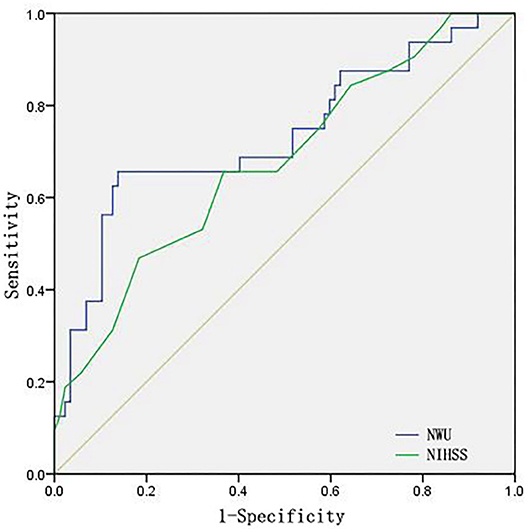
Figure 3. ROC curves of NWU and NIHSS at admission.
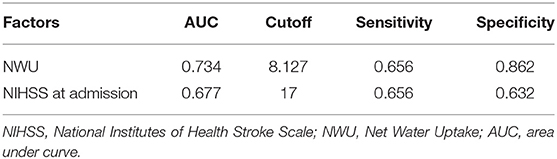
Table 3. Predictive values of AUC.
To investigate the possible association of the time from onset to first image with the prediction ability of NWU, the patients were further divided into six groups according to time windows. As shown in Table 4, NWU in the time window of 3–6 h showed a poor predictive value (AUC: 0.500).
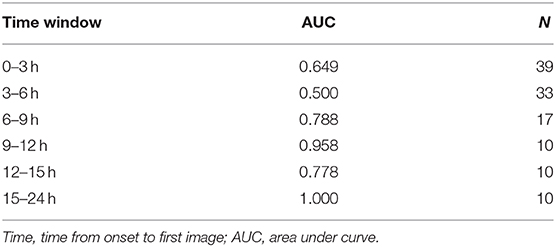
Table 4. AUC of NWU in different time windows.
Similar to the results of AUC, when the time from onset to first image was settled at the period from 3 to 6 h, the fitting line of the ME group and the non-ME group was too close to discriminate (Figure 4), suggesting that there may exist the time window of NWU predicting the occurrence of ME.
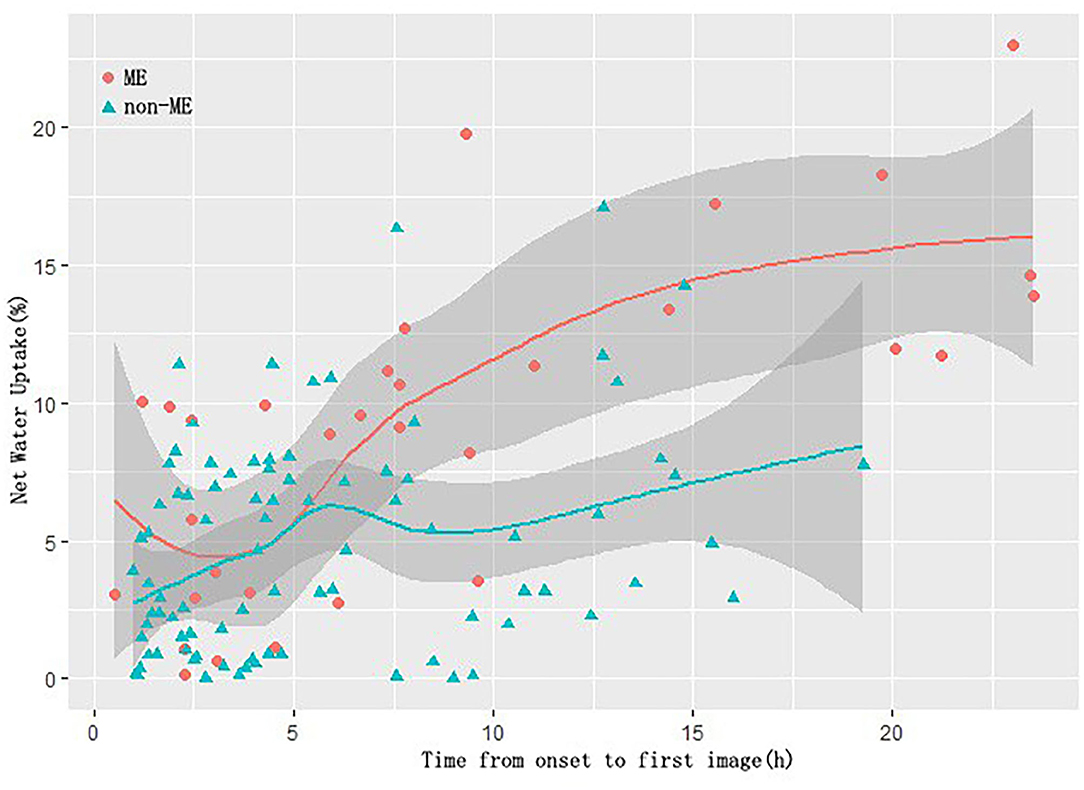
Figure 4. Scatterplot of NWU vs. the time from onset to first image.
Absolute NWU, NWU/time, and NWU/log (time+1) were also assessed through ROC curves and used to identify patients at risk of ME. As shown in Figure 5, NWU and NWU/log (time+1) exhibited better predictive power than NWU/time (NWU: 0.734, NWU/log (time+1): 0.676, NWU/time was 0.575).
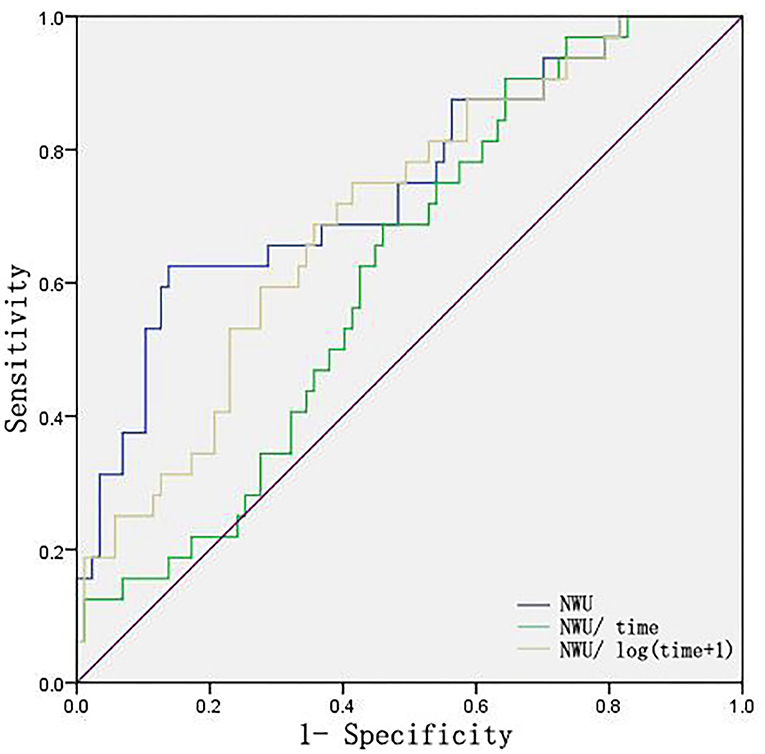
Figure 5. ROC curves of NWU, NWU/time, NWU/log (time+1). Time indicates the time from onset to first image.
Discussion
Recent studies have shown that NWU is an important surrogate marker for the development of ME (9, 18, 19), but NWU calculation depended on CTP, which was used to detect the infarction area. The current study is the first attempt to calculate NWU based on the standardized and blindly outlined regions of MCA. The results showed that NWU calculated with this method also exhibited a good predictive value (AUC: 0.734) in identifying ME, although the predictive power was not as strong as that in a previous study (AUC: 0.93) (9).
The current method is not as accurate as the previous method (9) in defining the region of interest (ROI), because the ROI outlined in this standard manner did not represent the actual infarct lesion. For infarct lesions less than the whole MCA territory, the Dischemic value measured in this standard manner should be higher than that from the actual infarct lesion. This may explain a lower NWU and cutoff value than those in the previous study (9). Although the predictive power in this study is not as strong as that in a previous study (9), the current study still provided a feasible method to identify the risk of ME at an early phase of stroke, especially in the primary stroke centers without CTP technique.
It is interesting to note that the current study suggested that there may exist a “time window” for using NWU to predict the development of ME, which has never been reported before. As shown by the AUC of NWU in different time windows (Table 4) and the scatterplot of NWU vs. the time from onset to first image (Figure 4), when time from onset to first image was within the period from 3 to 6 h, NWU did not perform well in discriminating ME. This phenomenon is very interesting and deserves to be determined in a future prospective study with a larger sample.
Considering the possible effect of the time from onset to first image on NWU, we further compared the prediction power of absolute NWU, NWU/time, and NWU/log (time+1) in the present study. The results showed that NWU and NWU/log (time+1) exhibited greater predictive power than NWU/time. This suggests that the dynamic change of NWU is not in a simple linear relationship with time within 24 h from symptom onset, which is consistent with the view of Pongpat Vorasayan's study (24). However, Broocks' team reported no significant difference among absolute NWU, NWU/time, NWU/log (time+1) in classifying ME within 6 h from symptom onset (9). The discrepancy may be due to the difference in the time from onset to first image (within 6 vs. 24 h) and in the NWU calculation methods (definite infarct lesion vs. blindly outlined MCA territory).
As we know, treatment options such as endovascular treatment and tPA thrombolysis may affect the development of edema (25, 26). To avoid the bias effect of endovascular treatment, patients with mechanical thrombectomy were excluded from this study. Given that the patients with tPA were enrolled in the present study, we further performed multivariable logistic regression analysis by adjusting tPA thrombolysis as a variable to exclude the potential effect of tPA. The results found that tPA thrombolysis did not affect the outcome in the current study.
There are limitations in this study. First, this is a single-center, retrospective study with a small sample size, which makes selection bias hard to avoid. The current method needs to be tested by a multi-center, prospective study with a larger sample size. Second, some data of paramount importance were missed, such as collateral status, infarct volume, dehydration indicators, and long-term follow-up of patients. Third, unbalanced baseline characteristics between two groups may impact the development of ME. To minimize the impact of unbalanced baseline characteristics, multivariable analysis was performed. Fourth, this standardized and blindly outlined method still requires manual operation. A software that can automatically measure NWU or even combine it with other factors related to ME could be meaningful.
Conclusions
NWU calculated in standardized and blindly outlined regions of the MCA territory showed a good prediction power for the development of ME in patients with LHI. The easy method may provide a practical tool to distinguish patients at risk of ME in primary stroke centers with less or no CTP examination, and warrant further testing in the future.
Data Availability Statement
The original contributions presented in the study are included in the article/supplementary material, further inquiries can be directed to the corresponding author/s.
Ethics Statement
The studies involving human participants were reviewed and approved by the Ethics Committee of General Hospital of Northern Theater Command. Written informed consent for participation was not required for this study in accordance with the national legislation and the institutional requirements.
Author Contributions
H-BX retrospectively enrolled patients and wrote the paper. Y-FS, NL, J-QW, and G-CC acquired data. H-BX and LT made the figures. B-QY and H-SC analyzed imaging data. H-SC designed the study and critically revised the manuscript. All authors approved the content of the manuscript.
Funding
This work was supported by the Science and Technology Project of Liao Ning Province (2018225023, 2019JH2/10300027).
Conflict of Interest
The authors declare that the research was conducted in the absence of any commercial or financial relationships that could be construed as a potential conflict of interest.
References
1. GBD 2016 Stroke Collaborators. Global, regional, and national burden of stroke, 1990-2016: a systematic analysis for the Global Burden of Disease Study 2016. Lancet Neurol. (2019) 18:439–58. doi: 10.1016/S1474-4422(19)30034-1
2. Fedin AI, Badalyan KR. [Review of clinical guidelines for the treatment and prevention of ischemic stroke]. Zh Nevrol Psikhiatr Im S S Korsakova. (2019) 119:95–100. doi: 10.17116/jnevro201911908295
3. Liebeskind DS, Jüttler E, Shapovalov Y, Yegin A, Landen J, Jauch EC. Cerebral edema associated with large hemispheric infarction. Stroke. (2019) 50:2619–25. doi: 10.1161/STROKEAHA.118.024766
4. King ZA, Sheth KN, Kimberly WT, Simard JM. Profile of intravenous glyburide for the prevention of cerebral edema following large hemispheric infarction: evidence to date. Drug Des Devel Ther. (2018) 12:2539–52. doi: 10.2147/DDDT.S150043
5. Dohmen C, Bosche B, Graf R, Staub F, Kracht L, Sobesky J, et al. Prediction of malignant course in MCA infarction by PET and microdialysis. Stroke. (2003) 34:2152–8. doi: 10.1161/01.STR.0000083624.74929.32
6. Thomalla G, Hartmann F, Juettler E, Singer OC, Lehnhardt FG, Köhrmann M, et al. Prediction of malignant middle cerebral artery infarction by magnetic resonance imaging within 6 hours of symptom onset: a prospective multicenter observational study. Ann Neurol. (2010) 68:435–45. doi: 10.1002/ana.22125
7. Pallesen LP, Barlinn K, Puetz V. Role of decompressive craniectomy in ischemic stroke. Front Neurol. (2018) 9:1119. doi: 10.3389/fneur.2018.01119
8. Li YP, Hou MZ, Lu GY, Ciccone N, Wang XD, Dong L, et al. Neurologic functional outcomes of decompressive hemicraniectomy versus conventional treatment for malignant middle cerebral artery infarction: a systematic review and meta-analysis. World Neurosurg. (2017) 99:709–25.e3. doi: 10.1016/j.wneu.2016.12.069
9. Broocks G, Flottmann F, Scheibel A, Aigner A, Faizy TD, Hanning U, et al. Quantitative lesion water uptake in acute stroke computed tomography is a predictor of malignant infarction. Stroke. (2018) 49:1906–12. doi: 10.1161/STROKEAHA.118.020507
10. Broocks G, Kemmling A, Aberle J, Kniep H, Bechstein M, Flottmann F, et al. Elevated blood glucose is associated with aggravated brain edema in acute stroke. J Neurol. (2020) 267:440–8. doi: 10.1007/s00415-019-09601-9
11. Thorén M, Azevedo E, Dawson J, Egido JA, Falcou A, Ford GA, et al. Predictors for cerebral edema in acute ischemic stroke treated with intravenous thrombolysis. Stroke. (2017) 48:2464–71. doi: 10.1161/STROKEAHA.117.018223
12. Strbian D, Meretoja A, Putaala J, Kaste M, Tatlisumak T, Helsinki Stroke Thrombolysis Registry Group. Cerebral edema in acute ischemic stroke patients treated with intravenous thrombolysis. Int J Stroke. (2013) 8:529–34. doi: 10.1111/j.1747-4949.2012.00781.x
13. Jo K, Bajgur SS, Kim H, Choi HA, Huh PW, Lee K. A simple prediction score system for malignant brain edema progression in large hemispheric infarction. PLoS ONE. (2017) 12:e0171425. doi: 10.1371/journal.pone.0171425
14. Kauw F, Bennink E, de Jong H, Kappelle LJ, Horsch AD, Velthuis BK, et al. Intracranial cerebrospinal fluid volume as a predictor of malignant middle cerebral artery infarction. Stroke. (2019) 50. doi: 10.1161/STROKEAHA.119.026853
15. Pelz JO, Fischer MM, Bungert-Kahl P, Lindner D, Fricke C, Michalski D. Fluid balance variations during the early phase of large hemispheric stroke are associated with patients' functional outcome. Front Neurol. (2019) 10:720. doi: 10.3389/fneur.2019.00720
16. Broocks G, Kemmling A, Meyer L, Nawabi J, Schön G, Fiehler J, et al. Computed tomography angiography collateral profile is directly linked to early edema progression rate in acute ischemic stroke. Stroke. (2019) 50:3424–30. doi: 10.1161/STROKEAHA.119.027062
17. Berkhemer OA, Jansen IG, Beumer D, Fransen PS, van den Berg LA, Yoo AJ, et al. Collateral status on baseline computed tomographic angiography and intra-arterial treatment effect in patients with proximal anterior circulation stroke. Stroke. (2016) 47:768–76. doi: 10.1161/STROKEAHA.115.011788
18. Broocks G, Faizy TD, Flottmann F, Schön G, Langner S, Fiehler J, et al. Subacute infarct volume with edema correction in computed tomography is equivalent to final infarct volume after ischemic stroke: improving the comparability of infarct imaging endpoints in clinical trials. Invest Radiol. (2018) 53:472–6. doi: 10.1097/RLI.0000000000000475
19. Nawabi J, Flottmann F, Kemmling A, Kniep H, Leischner H, Sporns P, et al. Elevated early lesion water uptake in acute stroke predicts poor outcome despite successful recanalization - when “tissue clock” and “time clock” are desynchronized. Int J Stroke. (2019). doi: 10.1177/1747493019884522
20. Broocks G, Flottmann F, Hanning U, Schön G, Sporns P, Minnerup J, et al. Impact of endovascular recanalization on quantitative lesion water uptake in ischemic anterior circulation strokes. J Cereb Blood Flow Metab. (2020) 40:437–45. doi: 10.1177/0271678X18823601
21. Nawabi J, Kniep H, Schön G, Flottmann F, Leischner H, Kabiri R, et al. Hemorrhage after endovascular recanalization in acute stroke: lesion extent, collaterals and degree of ischemic water uptake mediate tissue vulnerability. Front Neurol. (2019) 10:569. doi: 10.3389/fneur.2019.00569
22. Hacke W, Kaste M, Bluhmki E, Brozman M, Dávalos A, Guidetti D, et al. Thrombolysis with alteplase 3 to 4.5 hours after acute ischemic stroke. N Engl J Med. (2008) 359:1317–29. doi: 10.1056/NEJMoa0804656
23. Wickham H. Ggplot2: Elegant Graphics for Data Analysis. New York, NY: Springer-Verlag (2009). doi: 10.1007/978-0-387-98141-3
24. Vorasayan P, Bevers MB, Beslow LA, Sze G, Molyneaux BJ, Hinson HE, et al. Intravenous glibenclamide reduces lesional water uptake in large hemispheric infarction. Stroke. (2019) 50:3021–27. doi: 10.1161/STROKEAHA.119.026036
25. Broocks G, Hanning U, Flottmann F, Schönfeld M, Faizy TD, Sporns P, et al. Clinical benefit of thrombectomy in stroke patients with low ASPECTS is mediated by oedema reduction. Brain. (2019) 142:1399–407. doi: 10.1093/brain/awz057
Keywords: net water uptake, large hemispheric infarction, malignant edema, area under curve, prediction power
Citation: Xu H-B, Sun Y-F, Luo N, Wang J-Q, Chang G-C, Tao L, Yang B-Q and Chen H-S (2021) Net Water Uptake Calculated in Standardized and Blindly Outlined Regions of the Middle Cerebral Artery Territory Predicts the Development of Malignant Edema in Patients With Acute Large Hemispheric Infarction. Front. Neurol. 12:645590. doi: 10.3389/fneur.2021.645590
Received: 23 December 2020; Accepted: 16 February 2021;
Published: 12 March 2021.
Edited by:
Gabriel Broocks, Universität Hamburg, GermanyReviewed by:
Tobias Djamsched Faizy, University Medical Center Hamburg-Eppendorf, GermanyNoel Van Horn, University Medical Center Hamburg-Eppendorf, Germany
Copyright © 2021 Xu, Sun, Luo, Wang, Chang, Tao, Yang and Chen. This is an open-access article distributed under the terms of the Creative Commons Attribution License (CC BY). The use, distribution or reproduction in other forums is permitted, provided the original author(s) and the copyright owner(s) are credited and that the original publication in this journal is cited, in accordance with accepted academic practice. No use, distribution or reproduction is permitted which does not comply with these terms.
*Correspondence: Hui-Sheng Chen, Y2hzemhAYWxpeXVuLmNvbQ==