 Rosa Cortese
 Antonio Giorgio
 Gianmarco Severa
 Nicola De Stefano
- Department of Medicine, Surgery and Neuroscience, University of Siena, Siena, Italy
Several MRI measures have been developed in the last couple of decades, providing a number of imaging biomarkers that can capture the complexity of the pathological processes occurring in multiple sclerosis (MS) brains. Such measures have provided more specific information on the heterogeneous pathologic substrate of MS-related tissue damage, being able to detect, and quantify the evolution of structural changes both within and outside focal lesions. In clinical practise, MRI is increasingly used in the MS field to help to assess patients during follow-up, guide treatment decisions and, importantly, predict the disease course. Moreover, the process of identifying new effective therapies for MS patients has been supported by the use of serial MRI examinations in order to sensitively detect the sub-clinical effects of disease-modifying treatments at an earlier stage than is possible using measures based on clinical disease activity. However, despite this has been largely demonstrated in the relapsing forms of MS, a poor understanding of the underlying pathologic mechanisms leading to either progression or tissue repair in MS as well as the lack of sensitive outcome measures for the progressive phases of the disease and repair therapies makes the development of effective treatments a big challenge. Finally, the role of MRI biomarkers in the monitoring of disease activity and the assessment of treatment response in other inflammatory demyelinating diseases of the central nervous system, such as neuromyelitis optica spectrum disorder (NMOSD) and myelin oligodendrocyte antibody disease (MOGAD) is still marginal, and advanced MRI studies have shown conflicting results. Against this background, this review focused on recently developed MRI measures, which were sensitive to pathological changes, and that could best contribute in the future to provide prognostic information and monitor patients with MS and other inflammatory demyelinating diseases, in particular, NMOSD and MOGAD.
Introduction
Magnetic resonance imaging has become a key investigation in different scenarios of multiple sclerosis (MS), including diagnosis, monitoring of disease course, and assessment of treatment response (1). Identifying prognostic markers is critical for the management of MS patients at all disease stages. Some valuable MRI measures of focal pathology (e.g., lesion number, volume, and distribution) are already available for predicting MS outcome, and a number of additional measures of neurodegeneration and functional organisation (e.g., brain and cervical cord atrophy, functional MRI abnormalities) had been proposed as reliable prognostic markers in MS, although their use in clinical practise is still challenging (2, 3). Moreover, recent developments in imaging acquisition protocols and post-processing contributed to a better understanding of pathological processes occurring in the central nervous system (CNS) diseases, thus providing new imaging biomarkers which may be useful to rule out other inflammatory demyelinating diseases that can mimic MS.
The aim of this review was to describe the prognostic role of conventional and non-conventional advanced MRI measures, with a particular focus on recently developed techniques, in patients with MS and other inflammatory demyelinating diseases of the CNS. Because of the overlapping clinical and MRI findings with MS, special attention would be devoted to neuromyelitis optica spectrum disorder (NMOSD) and myelin oligodendrocyte glycoprotein (MOG) antibody-associated disease (MOGAD).
Neuromyelitis optica spectrum disorder is an autoimmune astrocytopathy of the CNS with secondary demyelination, which can be associated with a specific auto-antibody against the antigen aquaporin-4 (AQP4) in 50–90% of cases (4). MOGAD is an autoimmune disease of the CNS characterised by the presence of serological antibodies against MOG, a CNS-specific protein located in the outer layers of the myelin sheath (5). MOGAD is a relatively new clinical entity (6) whose clinical phenotype, disease course, and response to treatment are currently being defined. Several clinical and MRI features overlap across the three diseases (6, 7).
In this review, we gave an overview on the prognostic role of MRI, moving from conventional and established MRI techniques to more recently developed measures, which although not yet considered established prognostic markers in MS, could provide additional information about diseases pathogenesis. Finally, we considered novel MRI developments, including the advent of ultra-high field scanners, and suggested future areas of research. For this purpose, this review included scientific literature of the last 10 years from PubMed using the following search terms: multiple sclerosis, neuromyelitis optica spectrum disorder, myelin antibody glycoprotein associated disease, magnetic resonance imaging, prognosis, and pathogenesis.
Prognostic MRI Measures of Conventional MRI in MS, NMOSD, and MOGAD
Several MRI measures obtained using conventional MRI sequences have been suggested as prognostic markers in patients with MS. Their ability to predict disease course was consistently found to be higher than that of clinical measures (8). Evidence suggests that white matter lesions (WML), brain, and spinal cord atrophy can help to predict clinical outcomes and monitor treatment response, and several studies over the last years have advanced the field. In this section, we will present the recent impact of these advances on the management of MS, NMOSD, and MOGAD (Table 1, Figure 1).
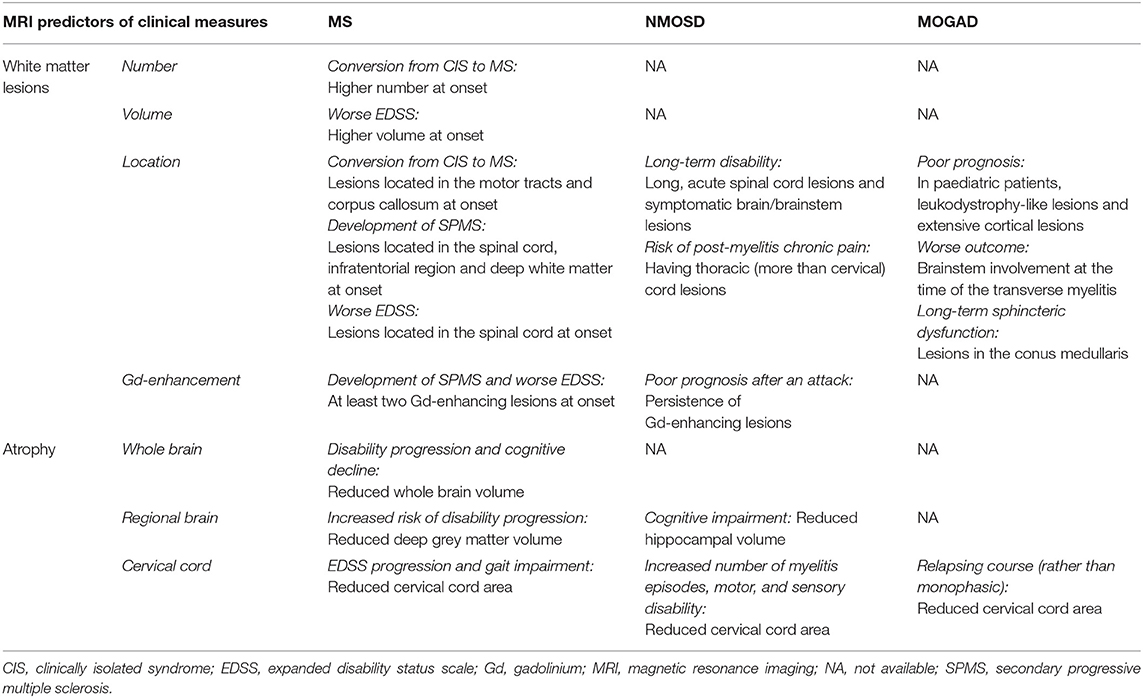
Table 1. Conventional MRI measures with an established prognostic role on clinical disability in multiple sclerosis (MS), neuromyelitis optica spectrum disorder (NMOSD), and myelin oligodendrocyte antibody disease (MOGAD).
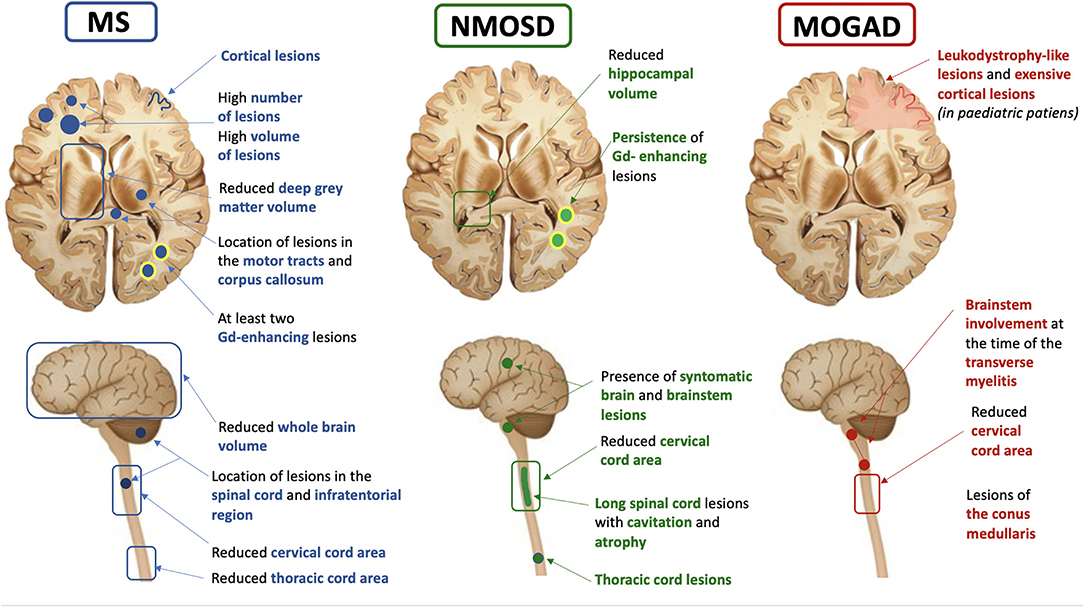
Figure 1. Summary of the most common, clinically available MRI prognostic features in multiple sclerosis (MS), neuromyelitis optica spectrum disorder (NMOSD), and myelin oligodendrocyte antibody disease (MOGAD).
Lesions
White matter lesions count and volume are the most used MRI biomarkers for quantifying the inflammatory activity in MS and represent the primary and secondary efficacy outcomes in many MS clinical trials (9). In patients with the clinically isolated syndrome (CIS), a higher number of T2 lesions at baseline was associated with an increased risk of conversion to clinically-defined MS and T2-lesion volume was able to predict Expanded Disability Status Scale (EDSS) scores at up to 20 years (8, 10). Lesions along specific brain WM tracts involved in motor function and near the corpus callosum were found to be associated with a higher risk of clinical conversion to MS at 1 year (11). In MS patients with at least 1 year of unilateral motor progression and more than five CNS demyelinating lesions, the motor deficit may be attributable to a single critical (i.e., prominent by size and accompanied by focal atrophy) corticospinal tract lesion. This finding supports the role of spinal cord lesions as major contributors to MS clinical motor progression rather than symmetric diffuse brain white matter injury (12).
Recent evidence suggests that lesion topography and gadolinium (Gd)-enhancing lesions are independent predictors of long-term outcomes in patients with CIS. In a cohort of patients with relapse-onset MS, spinal cord lesions, combined with inflammatory activity on MRI at baseline, were found to predict long-term disease outcomes. The presence of spinal cord lesions and at least two Gd-enhancing lesions in CIS patients was associated with a 45% risk of developing secondary progressive (SP) MS after 15 years and with a worse EDSS (13). However, the strongest early predictors, within 5 years of disease onset, of developing secondary progressive multiple sclerosis (SPMS) after 30 years were the presence of infratentorial lesions at baseline and deep WM lesions at 1 year (14).
In MS, especially in the progressive phases, some pre-existing T2 lesions may show chronic activity, which can be associated with clinical progression (15). Histopathologically, these lesions exhibit expansion at the border, revealed by the presence of a rim of iron-containing cells and reflecting tissue loss in the absence of an ongoing acute inflammation (16). A higher number of rim-positive lesions was associated with clinical relapses in relapsing-remitting (RR) MS and patients with at least 4 rim-positive lesions reached motor and cognitive disability at a younger age (17), thus, suggesting that iron rim might represent a risk factor for MS patients.
Recent MRI studies using deformation-based techniques (i.e., Jacobian maps), allowed us to identify in MS those WMLs with a constant and concentric volume increase and defined them as slowly expanding lesions (SELs). SELs represents a promising marker for chronic active lesions, as they can be detected on routinely acquired MRI scans, and may predict clinical progression (18). Chronic lesion activity, as demonstrated by increasing T1-hypointensity within existing lesions, was the strongest predictor of disability progression rather than brain volume loss or the rate of accumulation of new T1 or T2 lesions in a large, prospective imaging study on over 500 patients with primary progressive multiple sclerosis (PPMS) acquired during the ORATORIO trial (18).
In patients with NMOSD, several MRI features, including spinal cord T1-hypointensity, cavitation, or atrophy, were associated with a higher risk of poor recovery, refractory pain, and permanent disability, and lesions in the upper cervical region extending to the brainstem carried a risk of respiratory failure (19). In a recent multicentre study, the presence of longer acute spinal cord lesions and symptomatic brain/brainstem lesions were found as the primary contributors to long-term disability in NMOSD, independently from other factors, such as race and centre (20). Moreover, the presence of thoracic cord lesions in NMOSD patients was associated with a higher risk of post-myelitis chronic pain than the presence of cervical lesions, independently of the number of myelitis relapses, lesion length, and lesion burden (21).
The persistence of Gd-enhancing lesions, due to the breakdown of the blood-brain barrier, turned out to be an important predictor of poor prognosis after an NMOSD attack, a finding which can guide treatment options and suggests an adequate short-term follow-up (22).
In a large French cohort of adult patients with MOGAD, those presenting with an abnormal brain MRI had a higher disability at onset than those with a normal brain MRI (23). In addition, in a longitudinal English cohort of adult patients with MOGAD who experienced at least one transverse myelitis episode, the length of the spinal cord lesions was associated with disease severity at onset while the involvement of the brainstem at the time of the transverse myelitis was predicted a worse outcome, and the presence of conus lesions was associated with long-term sphincteric dysfunction (24). In a recent Spanish study on paediatric MOGAD patients, ADEM-like relapses progressing to leukodystrophy-like features, and extensive cortical encephalitis evolving to atrophy were indicative of poor prognosis.
Atrophy
In addition to lesions visible on conventional MRI sequences, inflammatory demyelinating diseases may lead to neurodegeneration and consequent brain and spinal cord atrophy, which are more related to disability progression. MRI is also sensitive to the detection of brain tissue loss, and this may be qualitatively assessed in the form of macroscopic brain volume contraction, ventricular enlargement, and widening of the cerebral sulci.
MRI techniques able to assess the whole brain and grey matter (GM) atrophy are now widely accessible using automated analysis methods, and recommendations to improve their measurement and interpretation have been suggested (25–27). Furthermore, new approaches assessing longitudinal changes of spinal cord volume with more precise segmentation-based methods (28, 29) and allowing calculation of spinal cord atrophy from brain MRI volumetric images have been developed, thereby reducing scanning time (30).
Brain atrophy is an important feature of MS pathology, mainly reflecting neuroaxonal loss within lesions and normal-appearing tissue (31). It has been observed since the earliest stages of MS and baseline measurements were found to correlate with long-term disability progression (10, 31). Currently, brain atrophy is the most commonly used imaging biomarker for quantifying neurodegeneration in MS clinical trials, alone or in combination with the absence of new T2 or Gd-enhancing T1 lesions (32). Similarly to whole-brain atrophy, GM atrophy is an important prognostic factor in MS, occurring with a similar pattern across all phenotypes and being faster in deep GM followed by cortical lobes of the brain (33). A reduced deep GM volume at baseline was associated with an increased risk of disability progression over time. While relapse onset MS (CIS, RRMS, and SPMS) firstly developed atrophy in cortical GM (posterior cingulate and precuneus), thalamus atrophy seems to appear early in PPMS (33). The thalamus is a central hub connected with several brain regions and its damage is associated with a variety of clinical manifestations in MS, including fatigue, movement disorders, pain, and cognitive impairment (34, 35). Thalamic volume declines consistently during the disease course and is one of the most important predictors of cognitive impairment in MS (36). The recent evidence of slower thalamic volume loss in several recent randomised, placebo-controlled trials, supports the incorporation of thalamic MRI endpoints in future clinical trials (37). Using source-based morphometry, a recent multicentre MAGNIMS study showed that baseline normalised GM volume and cerebellar GM atrophy independently predicted clinical worsening in all MS phenotypes (38).
In addition to baseline measures, the rate of brain volume loss at both whole and regional levels have been correlated with subsequent disability in MS (39), although these changes should not be confounded by the short-term “pseudoatrophy” that may occur after initiation of some disease-modifying treatments (DMTs) (40). Global brain and GM atrophy changes were mild in a unique group of patients with long-standing (i.e., at least 30 years) disease and no or minimal disability, thus supporting the relevant role of GM atrophy in characterising MS patients who may have favourable long-term disease evolution (41).
The so-called “brain-predicted age” (brain-PAD) paradigm has been proposed as a potential prognostic biomarker in MS, to capture the earliest progressive processes from MRI data (T1-weighted images) using machine learning analysis. Indeed, brain-PAD was independently associated with higher disability, younger age at diagnosis, and longer disease duration, irrespective of disease phenotype (42).
In recent years, a number of studies have proposed spinal cord atrophy as a strong predictor of clinical outcomes in MS. Cervical cord area and volume are differently affected in MS phenotypes, with the greatest changes in patients with primary progressive (PP) MS and higher atrophy rates than those detected in the brain (43). In PPMS, for each 1% annual increase of atrophy, it was found a 28% risk of EDSS progression, independently of brain volume loss (43). Some studies highlighted in MS the presence of damage to specific locations, such as cervical cord GM (44). In RRMS, the cross-sectional area of the spinal cord GM was a strong predictor of EDSS score, and a cut-off value of 11.1 mm2 was found to be able to differentiate patients with progressive MS (below the threshold) from those with relapsing MS (above the threshold) (45). The inclusion of thoracic cord measurements improved the correlation between cord atrophy and most clinical progression measures and allowed for better subgrouping of spinal cord phenotypes (46).
Differences in atrophy patterns seem to exist between MS and NMOSD. Indeed, while MS patients showed more whole brain and thalamic atrophy than NMOSD and healthy controls, NMOSD patients showed more spinal cord atrophy and milder brain atrophy, especially in the WM, than healthy controls, thus supporting the presence of different underlying pathogenic mechanisms (47). Therefore, spinal cord atrophy has become a hallmark of NMOSD, being associated with the number of myelitis episodes and lesion length. Spinal cord atrophy on MRI was topographically associated with lesions and correlated with motor and sensory disability (48) unlike MS, where atrophy is only partially related to the presence of focal lesions (49). In NMOSD, progression of spinal cord atrophy was associated with disability worsening and for this reason, it was suggested as a potential biomarker for clinical trials (47).
Different patterns of brainstem atrophy were also observed in the two diseases, with the midbrain being most severely affected followed by pons in MS whereas only the medulla oblongata was affected in NMOSD (50). GM atrophy is another disease-related feature that has been assessed in NMOSD. Indeed, Calabrese and colleagues found in NMOSD patients some mild thinning in the post-, precentral gyri, and calcarine sulcus, which was nonetheless significantly larger than in MS (51). Duan et al. also found GM volume reduction in several regions of the frontotemporal cortex, right inferior lobules, and right insula but it was only significant without correction for multiple comparisons (52). Similarly, a study using voxel-based morphometry found a significant reduction of GM volume in NMOSD patients when compared with healthy subjects, especially in the visual and motor areas as well as in the regions involved in language and executive functions (53). In a study aimed to assess clinical and structural MRI markers for predicting cognitive impairment, hippocampal volume resulted from the main MRI predictor of cognition in NMOSD (54).
Recently, distinct structural brain alterations were identified in MOGAD. Indeed, they included atrophy in the fronto-orbital cortex, temporal gyrus, and deep GM, with hippocampal atrophy correlating with clinical and cognitive disability (55). A significant volume loss in the deep GM structures in MOGAD was found, which correlated with persistent brain lesions (56). When considering the three diseases together, the greatest level of atrophy in the cervical and thoracic cord, particularly in the cord GM, was found in patients with AQP4-NMOSD. In MOGAD patients, volumetric cord measures were lower in those with a relapsing course, even in the case of relapses not involving the spinal cord (57).
Prognostic MRI Measures of Advanced MRI Techniques in MS, NMOSD, and MOGAD
Important pathological abnormalities occur in MS beyond MRI-visible focal lesions and atrophy. These include neuroaxonal dysfunction and loss, microglial activation, and astrogliosis (58). A number of non-conventional MRI measures have shown sensitivity toward such pathological findings and might provide new prognostic biomarkers in inflammatory demyelinating diseases. Although currently, these novel MRI measures are not well-established as prognostic markers in MS, the application of advanced structural, functional and metabolic imaging techniques to such diseases helped to yield important pathogenetic insights. This is particularly true in NMOSD and MOGAD where, although longitudinal studies of advanced MRI are lacking, some measures have shown clinical relevance in cross-sectional studies. Therefore, in this section, we will report recently developed and promising MRI techniques, which have helped to detect different components of disease pathogenesis in vivo, even when their prognostic role was not yet demonstrated (Table 2).
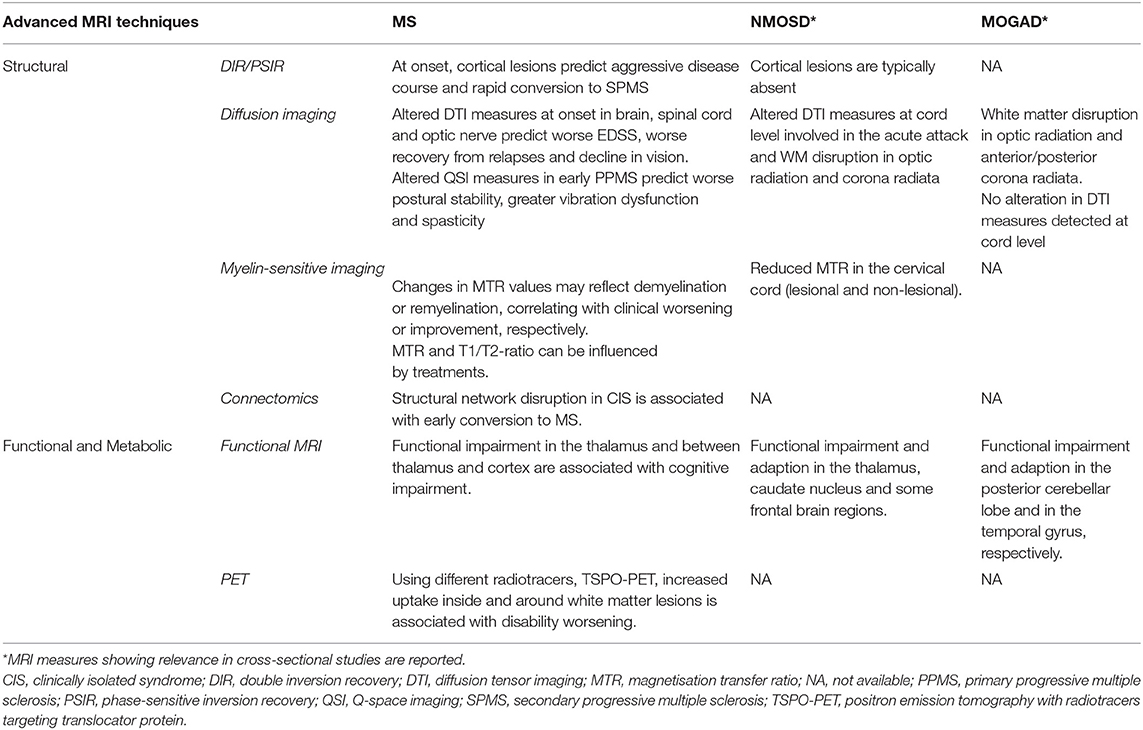
Table 2. Advanced MRI measures reflecting different pathogenic mechanisms with a potential prognostic role on clinical disability in multiple sclerosis (MS), neuromyelitis optica spectrum disorder (NMOSD), and myelin oligodendrocyte antibody disease (MOGAD).
Advanced MRI Techniques Assessing Structural Changes
Over the past decade, the relevance of cortical GM pathology in MS has become increasingly recognised. Cortical lesions (CLs) detected at “clinical” field strengths using specific MRI sequences (i.e., double inversion recovery [DIR] or phase-sensitive inversion recovery [PSIR]) is an early and frequent phenomenon in MS and correlate with a disability, cognitive impairment, and a higher risk of transition to the secondary progressive phase (59). Patients with at least seven CLs at disease onset showed an aggressive disease course and a rapid conversion to SPMS while none of the patients without CLs at onset entered the SP phase (59). However, the current detection of CLs in vivo is incomplete, capturing only 10–15% of cortical demyelination, even at ultra-high field (UHF) MRI (60). An important aspect to be considered is that most of the lesions detected on MRI are cortico-subcortical or intra-cortical while the most abundant subpial lesions remain largely unrecognised. Cortical lesions are typically absent in AQP4-NMOSD (51), while a cortical involvement in MOGAD has been initially described in the context of ADEM (61). Then, a newly recognised phenotype of benign, unilateral cerebral cortical encephalitis has been recognised (62).
Despite the exact underlying mechanisms are not completely understood, studies on the post-mortem MS brain tissue support the idea that meningeal inflammation and the consequent cortical microglia activation lead to progressive cortical demyelination and neurodegeneration (63, 64). Recently, using high-resolution 3D post-Gd T2-FLAIR images, it was possible to non-invasively detect cortically-based leptomeningeal infiltrates (LME), which in MS were associated with older age, longer disease duration, higher EDSS, greater whole brain, and cortical atrophy (65). However, meningeal enhancement cannot be considered a specific feature of MS since it can also be found in inflammatory, immune-mediated, and infectious vasculitis.
A growing body of work has investigated the role of iron in MS pathogenesis and evolution. The paramagnetic rim is due to the presence of iron-laden activated microglia at the lesion edge and can be easily seen on 7T phase images. Using high-resolution susceptibility-based imaging, nearly all 7T paramagnetic rims can also be seen at 3T, suggesting the possibility of implementing them as an outcome measure in MS MRI-based clinical trials (66).
Moreover, quantitative MRI techniques allow iron quantification in vivo. Using quantitative susceptibility mapping (QSM) deep grey matter iron was found to be associated with the secondary progressive course in (MS), independently of tissue atrophy (67). In particular, an increased thalamic iron content, as detected at 7T MRI, was found in patients with MS when compared with healthy controls, which was associated with higher disability scores (68). Several longitudinal studies using advanced MRI techniques showed diffuse injury in the MS normal-appearing brain and spinal cord from the symptoms onset to the progressive stages of the disease (69, 70). Diffusion imaging techniques have been extensively used in MS to assess neuroaxonal integrity in both lesional and non-lesional tissue and along specific WM tracts (71, 72). These techniques include diffusion tensor imaging (DTI) and new models of diffusion. DTI metrics can predict disability progression (73) and cognitive decline (74). In relapsing-onset MS, altered DTI measures in the normal-appearing white matter (NAWM) of the callosum were able to predict disability progression over 4 years (73). Moreover, in patients with CIS and early MS, reduction in fractional anisotropy (FA), a marker of microstructural integrity, in the cerebellum and the cerebral peduncles correlated with EDSS at 2 years (75). Thalamic DTI changes were found to be predictors of disability score deterioration in MS patients followed up for 15 months (76), and they can be used to predict cognitive impairment at 5-years of follow-up (74). In the case of acute spinal cord relapses, higher FA and lower diffusivity in the direction perpendicular to the main fibre direction [i.e., radial diffusivity (RD)] predicted better functional recovery from the relapse (77).
Moreover, increased optic nerve RD was associated with a decline in vision after optic neuritis (ON) and correlated with clinical disability in patients with spinal cord lesions (78).
New diffusion imaging models have been developed in the last years and showed interesting results in MS. An increase over time in the RD of the cervical cord of early PPMS was detected using Q-space imaging (QSI), an advanced model-free diffusion imaging technique with higher sensitivity for neuroaxonal alterations than standard DTI. In the same study, higher RD of the cervical cord predicted worse disability at 3 years, thus suggesting ongoing neurodegeneration in the cord independently of lesions (79). Neurite orientation dispersion and density imaging (NODDI) is a multi-compartment model that enables the estimation of more specific indices, such as neurite density, orientation, and a free-water [cerebrospinal fluid (CSF)-like] component (80). NODDI has shown in MS higher specificity and sensitivity to neurodegeneration compared with traditional DTI measurements. A recent study showed that patients with RRMS had lower neurite density index (NDI), suggestive of neurodegeneration, in the brain NAWM and spinal cord WM than healthy controls. In patients, a lower NDI in the spinal cord WM was associated with higher disability (81). If NODDI can be used to predict disease outcome is still unknown, as no longitudinal studies have been performed thus far.
Myelin-sensitive MRI measures are crucial to investigate MS pathology. In a combined MRI-pathology study, magnetisation transfer ratio (MTR) showed a strong association with myelin content, especially in WM and cortical GM lesions (82). In MS acute lesions, an initial decrease was followed by an increase in MTR, thus reflecting a demyelination process followed by partial remyelination. These changes are correlated with clinical improvement and can be influenced by specific therapies (83, 84).
MTR values in NAWM and GM of MS showed a gradient of abnormalities depending on the distance from the surface of the brain (85). These gradients occur early, worsen with time (86), and may improve after immunotherapy (87), suggesting a remyelination ability of some treatments. However, although sensitive to myelin, magnetisation transfer imaging can be influenced by axonal density and oedema, which may reduce its specificity (88).
Recently, the ratio between conventional T1-weighted (T1w) and T2-weighted (T2w) sequences (i.e., T1/T2-ratio) has been proposed as a reliable measure to evaluate myelin integrity as well as dendrite density (89), which would be easily implementable in clinical practise. A significant T1/T2-ratio increase in NAWM and GM has been demonstrated in RRMS patients during the first 2 years of treatment with disease-modifying drugs (90). Other techniques, such as myelin water fraction and T2 relaxometry in the brain and cervical spinal cord correlated in MS with a physical disability at follow-up (91–93) but their role as MS prognostic measures needs to be further clarified.
In the last decade, approaches of network-based connectomics MRI have been developed to explore the relationships between changes in functional or structural networks and clinical measures (94). For example, in a cross-sectional study, measures of structural network disruption explained scores of EDSS and symbol digit modality test (SDMT), a proxy for information processing speed, above measures of tissue atrophy and WM lesions in different MS clinical phenotypes (95). A longitudinal assessment of specific brain networks (e.g., structural covariance networks) further confirmed their relevance in MS, as their alterations in CIS were associated with early conversion to MS (96).
The application of advanced imaging in NMOSD and MOGAD is emerging, but with many controversies and lack of studies assessing changes in these new measures over time, therefore limiting clinical application in the near future.
Several studies have investigated the presence of diffuse and “occult” damage within the NAWM of patients with NMOSD by applying different MRI techniques. Proton MR spectroscopic imaging (MRSI) showed normal N-acetylaspartic acid (NAA), creatine and choline levels within the NAWM, arguing against occult neuroaxonal damage, inflammation, and gliosis (97). By contrast, a recent study using magnetisation transfer imaging showed in NMOSD an abnormal NAWM, with decreased myelin signal than healthy controls (98).
DTI, which is sensitive to microstructural alterations, has been performed in NMOSD and showed contrasting data. On the one hand, no DTI abnormalities were reported in different brain regions, except for the visual and motor WM pathways where a selective trans-synaptic axonal degeneration may occur secondary to destructive lesions in the optic nerves and spinal cord, respectively (99, 100). On the other hand, other studies have reported a decrease in FA within the NAWM of patients with NMOSD (52, 101). Such DTI abnormalities were, however, rather mild and not as severe as in patients with MS. Specifically, axonal damage and diffusion abnormalities along WM association fibres were more severe in patients with MS than in those with NMOSD (102). Using a multiparametric approach, diffuse WM damage throughout brain concentric bands was demonstrated in NMOSD, as reflected by reduced T1/T2 ratio and increased mean diffusivity, indicating astrocyte damage (48).
Some imaging and histopathological studies in NMOSD showed abnormalities and neuronal loss in cortical GM (103). Less is known about deep GM changes in NMOSD, particularly the involvement of the thalamus is controversial. An attack-related volume reduction of specific thalamic nuclei was demonstrated in NMOSD patients with and without a history of ON, which correlated with the number of clinical episodes, retinal damage, and visual function, thus indicating an anterograde degeneration in the afferent visual pathway (104).
In a MOGAD patient, longitudinal clinical and MRI follow-up showed progressive neurologic deterioration without any relapse associated with progressive WM changes, thus suggesting a possible tissue loss over time. Using diffusion imaging, WM disruption in the optic radiation and corona radiata was identified in both MOGAD and AQP4-Ab positive NMOSD, although milder in the former condition (55).
Results from studies applying advanced MRI techniques to the spinal cord in NMOSD are also controversial. When using DTI analysis for the assessment of cervical spinal cord damage in NMOSD, abnormal DTI-derived metrics (especially FA) in the cervical cord of patients with NMOSD (even in the absence of hyperintensities on T2-weighted imaging) were found (105). Moreover, Klawiter et al. demonstrated higher RD within damaged (as assessed on T2-weighted imaging) WM tracts in NMOSD vs. MS, consistent with the more destructive nature of the former condition (106).
Patients with AQP4-antibody disease showed a significant reduction in the cervical cord MTR, FA, and increased mean diffusivity, and the damage was localised to areas of the cord involved in the acute attack. By contrast, MOGAD patients did not show significant differences compared with healthy subjects in any MRI modality (57).
Advanced MRI Techniques Assessing Functional Changes
Functional MRI is a powerful tool for studying cortical functional reorganisation and brain plasticity. Studies have assessed functional connectivity (FC) abnormalities within the various brain networks in patients with MS, with the aim of identifying trajectories of changes over the disease course and thus increasing the understanding of MS pathology (107). Resting-state functional MRI (fMRI) has identified a number of FC alterations in patients with MS (108). A decreased FC between thalamus and cortical regions and an increased intra- and inter-thalamic FC were demonstrated as the substrate for early cognitive impairment in patients with MS, independently from thalamic volume loss (54). Specific patterns of increased static thalamic connectivity with the sensorimotor network have been recently identified, which were related to disability in MS (109). In patients with paediatric-onset MS with no or minimal disability, FC was reduced in selective brain networks, probably reflecting the exhaustion over time of functional reserve (110).
Cognitive impairment has been demonstrated in NMOSD patients, as a result of functional alterations within specific neuronal circuits (47). Preliminary studies in NMOSD patients demonstrated a reduced FC in the default mode network (DMN) as well as an increased FC in the thalamus, caudate nucleus, and some frontal regions (47). Recently, the cortical functional reorganisation was shown in NMOSD patients at the level of cognitive networks with an overall adaptive role. Exhaustion of compensatory mechanisms is heralded by an FC reduction in the left frontoparietal working memory network (111).
Severe functional impairment in the visual areas and increased FC in the temporal gyrus were also detected in MOGAD (55), which indicates the presence of functional plasticity trying to compensate for the structural damage, as previously demonstrated in MS and NMOSD (112).
Optical Coherence Tomography
Neurodegenerative changes along the visual pathway are common in both MS (113) and NMOSD (114). Optical coherence tomography (OCT) is an emerging imaging technique that enables the measurement of the neural retina, whose layer thinning reflects an axonal loss.
Cross-sectional studies of OCT have shown that peripapillary global retinal nerve fibre layer (RNFL) and inner retinal layer thicknesses are reduced in MS and correlate with clinical disability and MRI-derived brain volume measures (115). These findings have been confirmed by longitudinal studies showing that RNFL is predictive of a clinical outcome (poor visual recovery) (116) and they also correlate with imaging measures of MS disease activity and severity (117). In addition, OCT also allows measurement of the ganglion cell and inner plexiform layer (GCIPL) complex, whose atrophy appears to mirror MRI-derived whole-brain atrophy measures, particularly GM atrophy, especially in progressive MS (118).
OCT has been extensively used in MS and NMOSD to detect levels of axonal damage after an episode of ON as well as to help to differentiate the two diseases (119). Retinal axonal loss in NMOSD is more severe than in MS and is most commonly related to ON attacks. Although signs of subclinical axonal loss exist in the non-affected eyes of patients with NMOSD, a clear neurodegeneration pattern has been detected in non-ON eyes in MS patients, as a result of primary retinal neurodegeneration or retrograde trans-neuronal degeneration due to lesions along with the optic radiations. The inter-eye peripheral RNFL difference between eyes with or without ON may be useful in differentiating NMOSD from MS (120). In MOGAD, subclinical ON may occur and this may be associated with a significant reduction in the RNFL thickness. Despite equally significant damage to the optic nerve, patients with anti-MOG antibodies have relatively preserved low contrast visual acuity (121).
Positron Emission Tomography
Other neuroimaging modalities such as positron emission tomography (PET) have the potential to improve our understanding of the mechanisms of progression in MS, thus providing important prognostic information. PET is a non-invasive molecular imaging technique enabling the in-vivo detection of the molecular processes involved in neuroinflammation and neurodegeneration (122). In a 4-year follow-up study, increased radioligand uptake in the perilesional NAWM predicted disability progression independent of relapse activity in MS, using mitochondrial 18-kDa translocator protein (TSPO)-PET, a marker of inflammation linked to microglial and macrophage activation in neurodegenerative and neuroinflammatory diseases such as MS (123). Using a new generation TSPO tracer (F-DPA-714 translocator protein), a novel approach to generate individual maps of WM innate immune cell activation was developed. Strong activation of the innate immune system inside WML and in the NAWM correlated with a more severe trajectory of disability worsening in all MS phenotypes (124). However, to date, the use of different radiotracers, varying patient populations, local scanning protocols, and various analysis methods, led to the heterogeneity of PET research, which currently limits the comparison across different studies and reproducibility. Addressing these issues would enable a multicenter approach and help progress PET imaging from the field of research to a clinically relevant imaging biomarker in MS.
Future Perspectives
Ultra-High Field MRI
More recently, UHF MRI (i.e., seven Tesla and above) has gained more interest in clinical imaging. Indeed, a number of studies have shown the benefits from the application of this powerful tool not only for research purposes but also in clinical settings to facilitate a correct diagnosis, prognosis and improve patient management. For example, using UHF MRI, it has been demonstrated that the rate of CL accumulation was higher in patients with RRMS who developed SPMS than in those who remained RRMS (3.6 lesions/year vs. 1.1 lesions/year, respectively), independently from the accumulation of WMLs (125). In MS, the use of 7T MRI showed a significantly higher number of focal MS lesions located in areas defined as NAWM on magnetisation-prepared rapid acquisition gradient-echo (MPRAGE) when compared with standard clinical 3T FLAIR (126). These abnormalities might have contributed to the pathological findings described below in the NAWM of MS. Also, exploiting the increased spatial resolution and enhanced contrast, UHF MRI can improve the detection and morphological characterisation of GM lesions (63). In addition, it improves the visualisation of the central vein sign (CVS) and the peripheral paramagnetic rim on susceptibility-weighted imaging (SWI) (127, 128). Imaging remyelination in MS lesions remains an unmet need. A straightforward approach to evaluate mechanisms of tissue repair and remyelination in chronic MS lesions has been recently proposed. Interestingly, the combination of a qualitative classification of lesions on MP2RAGE T1 maps with susceptibility-based 7T MRI seems to classify chronic lesions according to myelin content and to identify patients with a high risk for worse outcomes (129).
The use of UHF MRI may also help understand disease mechanisms. Indeed, in patients with NMOSD, a 7T MRI study on the periventricular venous density did not report alterations in the venous visibility on highly resolving T2*-weighted images, arguing against a widespread hypometabolism in NMOSD (130). Quantitative T1 relaxometry at 7 T was applied to assess structural alterations or damage in normal-appearing lesion-free periependymal regions of patients with NMOSD. In this study, a normal T1-relaxation time was found, which argues against a severe diffuse or “occult” brain damage even in AQP4-rich brain regions, thus supporting the findings from studies at 3T (131).
Unmet Needs
Although MRI has gained an important role in the prognosis and better understanding of inflammatory demyelinating diseases, further research is warranted, particularly on MOGAD, for several reasons.
First, a significant unmet need of the research on MS is the discovery of mechanisms leading to disability worsening and disease progression. Beyond the development of novel imaging methods, the integration of multimodal data may facilitate the discovery of neuroprotective agents. For example, the rate of neurodegeneration may be assessed by integrating MRI with blood and CSF markers of neurodegeneration (e.g., neurofilament [NFL] levels) and ophthalmological imaging (i.e., OCT). Serum and CSF NFL light- and heavy-chain proteins have recently been proposed as reliable biomarkers of neuroaxonal damage in MS due to the correlation with MRI biomarkers of disability progression, such as brain and spinal cord atrophy (132). Nonetheless, the performance of NFL as a biomarker of neurodegeneration or neuroprotective treatment response in the progressive forms of MS is still uncertain and requires further research (133).
Second, although quantitative MRI techniques are technically challenging at the level of the spinal cord, they are able to provide valuable information on microstructural tissue damage. Multi-parametric imaging models are very important for the future, in order to look at the underlying driver of structural abnormalities. Indeed, sodium-MRI is a promising new metabolic imaging technique able to provide information on energy failure in vivo, and a protocol to detect sodium concentration in the cervical cord of MS patients has been recently developed, showing correlation with diffusion metrics (134). It would be interesting to combine structural and metabolic imaging measures in order to understand the mechanisms of damage and repair. This would be particularly useful in MOGAD, where a longitudinal study in a cohort of patients recruited soon after clinical onset would help understand the role of metabolic changes and myelin repair in contributing to the complete disappearance of lesions on conventional MRI.
Third, alongside neurodegeneration, remyelination is a possible mechanism of tissue repair as it may contribute to the shrinking of lesions in MS. Future longitudinal studies may assess whether a reduction in lesion size or lesion disappearance can be seen in MS and can be used as an outcome measure for repair treatments. Lesions may evolve differently in the two Ab-mediated disease diseases, and a complete resolution of T2 lesions occurs more frequently in MOGAD than AQP4-NMOSD and MS (135). Studying the evolution of lesions after an attack in the three CNS demyelinating diseases may guide treatment strategies, predict the disease course, and help to plan future clinical trials. Using imaging modalities sensitive to myelin changes (i.e., MTR, T1/T2 ratio), changes in myelin content of disappearing/shrinking lesions might be assessed in layers progressively further from the lesion core and inform about differential pathological mechanisms underlying MS and the two Ab-mediated diseases.
Moreover, when considering NMOSD, some previous studies did not separately analyse results by antibody type, therefore possibly including MOGAD patients which can also fulfil criteria for seronegative NMOSD. The distinction between AQP4 seropositive and seronegative NMOSD is further emphasised by recent prospective randomised clinical trials which included both groups but had an effect only on seropositive patients (136, 137). Thus, more homogeneous studies focusing on AQP4-seropositive cases are needed.
Finally, the role of new MRI biomarkers in the clinical management of inflammatory demyelinating diseases still needs to be established and the high cost of UHF MRI scanners makes it unlikely this type of imaging to be routinely and widely used in clinical practise in the near future.
Conclusion
Conventional and non-conventional advanced MRI measures play an important prognostic role in inflammatory demyelinating diseases. The growing application of advanced imaging in MS, NMOSD, and MOGAD could improve the identification and validation of new pathological hallmarks in large clinical studies, leading to the development of novel diagnostic and therapeutic strategies.
Author Contributions
RC designed the project and wrote the manuscript. AG designed the project and revised the manuscript. GS revised the manuscript. ND designed the project, supervised the project, and revised the manuscript. All authors contributed to the article and approved the submitted version.
Conflict of Interest
The authors declare that the research was conducted in the absence of any commercial or financial relationships that could be construed as a potential conflict of interest.
Publisher's Note
All claims expressed in this article are solely those of the authors and do not necessarily represent those of their affiliated organizations, or those of the publisher, the editors and the reviewers. Any product that may be evaluated in this article, or claim that may be made by its manufacturer, is not guaranteed or endorsed by the publisher.
References
1. Thompson J, Baranzini SE, Geurts J, Hemmer B, Ciccarelli O. Multiple sclerosis. Lancet. (2018) 391:1622–36. doi: 10.1016/S0140-6736(18)30481-1
2. Wattjes MP, Rovira À, Miller D, Yousry TA, Sormani MP, de Stefano N, et al. Evidence-based guidelines: MAGNIMS consensus guidelines on the use of MRI in multiple sclerosis - establishing disease prognosis and monitoring patients. Nat Rev Neurol. (2015) 11:597–606. doi: 10.1038/nrneurol.2015.157
3. Sastre-Garriga J, Pareto D, Battaglini M, Rocca Ma, Ciccarelli O, Enzinger C, et al. MAGNIMS consensus recommendations on the use of brain and spinal cord atrophy measures in clinical practice. Nat Rev Neurol. (2020) 16:171–82. doi: 10.1038/s41582-020-0314-x
4. Marignier R, Vukusic S, Confavreux C, Giraudon P, Honnorat J. Anti-aquaporin-4 antibodies in Devic-s neuromyelitis optica: therapeutic implications. Therap Adv Neurol Disord. (2010) 3:311–21. doi: 10.1177/1756285610382478
5. Brunner, Lassmann H, V Waehneldt T, Matthieu JM, Linington C. Differential ultrastructural localization of myelin basic protein, myelin/oligodendroglial glycoprotein, and 2',3'-cyclic nucleotide 3'-phosphodiesterase in the CNS of adult rats. J Neurochem. (1989) 52:296–304. doi: 10.1111/j.1471-4159.1989.tb10930.x
6. Juryńczyk M, Tackley G, Kong Y. Brain lesion distribution criteria distinguish MS from AQP4-antibody NMOSD and MOG-antibody disease. J Neurol Neurosurg Psychiatry. (2017) 88:132–6. doi: 10.1136/jnnp-2016-314005
7. Jarius S, Ruprecht K, Kleiter I, Borisow N, Asgari N, Pitarokoili K, et al. MOG-IgG in NMO and related disorders: a multicenter study of 50 patients. Part 1: frequency, syndrome specificity, influence of disease activity, long-term course, association with AQP4-IgG, and origin. J Neuroinflammation. (2016) 13:279. doi: 10.1186/s12974-016-0717-1
8. Tintore M, Rovira À, Río J, Otero-Romero S, Arrambide G, Tur C, et al. Defining high, medium and low impact prognostic factors for developing multiple sclerosis. Brain. (2015) 138:1863–74. doi: 10.1093/brain/awv105
9. Tur C, Moccia M, Barkhof F, Chataway J, Sastre-Garriga J, Thompson AJ, et al. Assessing treatment outcomes in multiple sclerosis trials and in the clinical setting. Nat Rev Neurol. (2018) 14:75–93. doi: 10.1038/nrneurol.2017.171
10. Popescu V, Agosta F, Hulst HE, Sluimer IC, Knol DL, Sormani MP, et al. Brain atrophy and lesion load predict long term disability in multiple sclerosis. J Neurol Neurosurg Psychiatry. (2013) 84:1082–91. doi: 10.1136/jnnp-2012-304094
11. Giorgio A, Battaglini M, Rocca MA, De Leucio A, Absinta M, van Schijndel R, et al. Location of brain lesions predicts conversion of clinically isolated syndromes to multiple sclerosis. Neurology. (2013) 80:234–41. doi: 10.1212/WNL.0b013e31827debeb
12. Sechi E, Keegan BM, Kaufmann TJ, Kantarci OH, Weinshenker BG, Flanagan EP. Unilateral motor progression in MS. Neurology. (2019) 93:e628–34. doi: 10.1212/WNL.0000000000007944
13. Brownlee WJ, Altmann DR, Prados F, Miszkiel KA, Eshaghi A, Gandini Wheeler-Kingshott CAM, et al. Early imaging predictors of long-term outcomes in relapse-onset multiple sclerosis. Brain. (2019) 142:2276–87. doi: 10.1093/brain/awz156
14. Chung KK, Altmann D, Barkhof F, Miszkiel K, Brex PA, O'Riordan J, et al. A 30-year clinical and magnetic resonance imaging observational study of multiple sclerosis and clinically isolated syndromes. Ann Neurol. (2020) 87:63–74. doi: 10.1002/ana.25637
15. Calvi, Haider L, Prados F, Tur C, Chard D, Barkhof F. In vivo imaging of chronic active lesions in multiple sclerosis. Mult Scler J. (2020) 135245852095858. doi: 10.1177/1352458520958589. [Epub ahead of print].
16. Absinta M, Sati P, Reich DS. Advanced MRI and staging of multiple sclerosis lesions. Nat Rev Neurol. (2016) 12:358–68. doi: 10.1038/nrneurol.2016.59
17. Absinta M, Sati P, Masuzzo F, Nair G, Sethi V, Kolb H, et al. Association of chronic active multiple sclerosis lesions with disability in vivo. JAMA Neurol. (2019) 76:1474–83. doi: 10.1001/jamaneurol.2019.2399
18. Elliott C, Belachew S, Wolinsky JS, Hauser SL, Kappos L, Barkhof F, et al. Chronic white matter lesion activity predicts clinical progression in primary progressive multiple sclerosis. Brain. (2019) 142:2787–99. doi: 10.1093/brain/awz212
19. Kim HJ, Paul F, Lana-Peixoto MA, Tenembaum S, Asgari N, Palace J, et al. MRI characteristics of neuromyelitis optica spectrum disorder: an international update. Neurology. (2015) 84:1165–73. doi: 10.1212/WNL.0000000000001367
20. Mealy MA, Mossburg SE, Kim S-H, Messina S, Borisow N, Lopez-Gonzalez R, et al. Long-term disability in neuromyelitis optica spectrum disorder with a history of myelitis is associated with age at onset, delay in diagnosis/preventive treatment, MRI lesion length and presence of symptomatic brain lesions. Mult Scler Relat Disord. (2019) 28:64–8. doi: 10.1016/j.msard.2018.12.011
21. Tackley G, Vecchio D, Hamid S. Chronic neuropathic pain severity is determined by lesion level in aquaporin 4-antibody-positive myelitis. J Neurol Neurosurg Psychiatry. (2017) 88:165–9. doi: 10.1136/jnnp-2016-314991
22. Xu Y, Ren Y, Li X, Xu W, Wang X, Duan Y, et al. Persistently gadolinium enhancing lesion is predictor of poor prognosis in NMOSD attack: a clinical trial. Neurotherapeutics. (2021) 18:868–77. doi: 10.1007/s13311-020-00973-9
23. Cobo-Calvo A, Ruiz A, Maillart E, Audoin B, Zephir H, Bourre B, et al. Clinical spectrum and prognostic value of CNS MOG autoimmunity in adults: the MOGADOR study. Neurology. (2018) 90:e1858–69. doi: 10.1212/WNL.0000000000005560
24. Mariano R, Messina S, Kumar K, Kuker W, Leite MI, Palace J. Comparison of clinical outcomes of transverse myelitis among adults with myelin oligodendrocyte glycoprotein antibody vs aquaporin-4 antibody disease. JAMA Netw Open. (2019) 2:e1912732. doi: 10.1001/jamanetworkopen.2019.12732
25. Amiri H, de Sitter A, Bendfeldt K, Battaglini M, Gandini Wheeler-Kingshott CAM, Calabrese M, et al. Urgent challenges in quantification and interpretation of brain grey matter atrophy in individual MS patients using MRI. NeuroImage Clin. (2018) 19:466–75. doi: 10.1016/j.nicl.2018.04.023
26. Storelli L, Rocca MA, Pagani E, Van Hecke W, Horsfield MA, De Stefano N, et al. Measurement of whole-brain and gray matter atrophy in multiple sclerosis: assessment with MR imaging. Radiology. (2018) 288:554–64. doi: 10.1148/radiol.2018172468
27. Battaglini M, Gentile G, Luchetti L, Giorgio A, Vrenken H, Barkhof F, et al. Lifespan normative data on rates of brain volume changes. Neurobiol Aging. (2019) 81:30–7. doi: 10.1016/j.neurobiolaging.2019.05.010
28. Moccia M, Prados F, Filippi M, Rocca MA, Valsasina P, Brownlee WJ, et al. Longitudinal spinal cord atrophy in multiple sclerosis using the generalized boundary shift integral. Ann Neurol. (2019) 86:704–13. doi: 10.1002/ana.25571
29. Prados F, Moccia M, Johnson A, Yiannakas M, Grussu F, Cardoso MJ, et al. Generalised boundary shift integral for longitudinal assessment of spinal cord atrophy. Neuroimage. (2020) 209:116489. doi: 10.1016/j.neuroimage.2019.116489
30. Lukas C, Knol DL, Sombekke MH, Bellenberg B, Hahn HK, Popescu V, et al. Cervical spinal cord volume loss is related to clinical disability progression in multiple sclerosis. J Neurol Neurosurg Psychiatry. (2015) 86:410–8. doi: 10.1136/jnnp-2014-308021
31. Rocca MA, Sormani MP, Rovaris M, Caputo D, Ghezzi A, Montanari E, et al. Long-term disability progression in primary progressive multiple sclerosis: a 15-year study. Brain. (2017) 140:2814–9. doi: 10.1093/brain/awx250
32. Sormani MP, Arnold DL, De Stefano N. “Treatment effect on brain atrophy correlates with treatment effect on disability in multiple sclerosis. Ann Neurol. (2014) 75:43–9. doi: 10.1002/ana.24018
33. Eshaghi A, Prados F, Brownlee WJ, Altmann DR, Tur C, Cardoso MJ, et al. Deep gray matter volume loss drives disability worsening in multiple sclerosis. Ann Neurol. (2018) 83:210–22. doi: 10.1002/ana.25145
34. Geurts JJ, Barkhof F. Grey matter pathology in multiple sclerosis. Lancet Neurol. (2008) 7:841–51. doi: 10.1016/S1474-4422(08)70191-1
35. Capone F, Collorone S, Cortese R, Di Lazzaro V, Moccia M. Fatigue in multiple sclerosis: the role of thalamus. Mult Scler. (2020) 26:6–16. doi: 10.1177/1352458519851247
36. Azevedo CJ, Overton E, Khadka S, Buckley J, Liu S, Sampat M, et al. Early CNS neurodegeneration in radiologically isolated syndrome. Neurol Neuroimmunol Neuroinflammation. (2015) 2:e102. doi: 10.1212/NXI.0000000000000102
37. Ontaneda D, Raza PC, Mahajan KR, Arnold DL, Dwyer MJ, Gauthier SA, et al. Deep grey matter injury in multiple sclerosis: a NAIMS consensus statement. Brain. (2021) 144:1974–84. doi: 10.1093/brain/awab132
38. Rocca MA, Valsasina P, Meani A, Gobbi C, Zecca C, Rovira A, et al. Association of gray matter atrophy patterns with clinical phenotype and progression in multiple sclerosis. Neurology. (2021) 96:e1561–73. doi: 10.1212/WNL.0000000000011494
39. Schoonheim MM, Hulst HE, Brandt RB, Strik M, Wink AM, Uitdehaag BM, et al. Thalamus structure and function determine severity of cognitive impairment in multiple sclerosis. Neurology. (2015) 84:776–83. doi: 10.1212/WNL.0000000000001285
40. De Stefano N, Giorgio A, Gentile G, Stromillo ML, Cortese R, Gasperini C, et al. Dynamics of pseudo-atrophy in RRMS reveals predominant gray matter compartmentalization. Ann Clin Transl Neurol. (2021) 8:1073–85. doi: 10.1002/acn3.51302
41. Cortese R, Battaglini M, Parodi F, Stromillo ML, Portaccio E, Razzolini L, et al. Mild gray matter atrophy in patients with long-standing multiple sclerosis and favorable clinical course. Mult Scler. (2021) 13524585211019650. doi: 10.1177/13524585211019650. [Epub ahead of print].
42. Cole JH, Raffel J, Friede T, Eshaghi A, Brownlee WJ, Chard D, et al. Longitudinal assessment of multiple sclerosis with the brain-age paradigm. Ann Neurol. (2020) 88:93–105. doi: 10.1002/ana.25746
43. Tsagkas C, Magon S, Gaetano L, Pezold S, Naegelin Y, Amann M, et al. Preferential spinal cord volume loss in primary progressive multiple sclerosis. Mult Scler. (2018) 25:947–57. doi: 10.1177/1352458518775006
44. Rocca MA, Valsasina P, Meani A, Gobbi C, Zecca C, Rovira À, et al. Clinically relevant cranio-caudal patterns of cervical cord atrophy evolution in MS. Neurology. (2019) 93:E1852–66. doi: 10.1212/WNL.0000000000008466
45. Bonacchi R, Pagani E, Meani A, Cacciaguerra L, Preziosa P, De Meo E, et al. Clinical relevance of multiparametric MRI assessment of cervical cord damage in multiple sclerosis. Radiology. (2020) 296:605–15. doi: 10.1148/radiol.2020200430
46. Mina Y, Azodi S, Dubuche T, Andrada F, Osuorah I, Ohayon J, et al. Cervical and thoracic cord atrophy in multiple sclerosis phenotypes: quantification and correlation with clinical disability. NeuroImage Clin. (2021) 30:102680. doi: 10.1016/j.nicl.2021.102680
47. Liu Y, Duan Y, Huang J, Ren Z, Liu Z, Dong H, et al. Different patterns of longitudinal brain and spinal cord changes and their associations with disability progression in NMO and MS. Eur Radiol. (2018) 28:96–103. doi: 10.1007/s00330-017-4921-x
48. Cacciaguerra L, Rocca MA, Storelli L, Radaelli M, Filippi M. Mapping white matter damage distribution in neuromyelitis optica spectrum disorders with a multimodal MRI approach. Mult Scler. (2020) 27:841–54. doi: 10.1177/1352458520941493
49. Valsasina P, Aboulwafa M, Preziosa P, Messina R, Falini A, Comi G, et al. Cervical cord T1-weighted hypointense lesions at MR imaging in multiple sclerosis: relationship to cord atrophy and disability. Radiology. (2018) 288:234–44. doi: 10.1148/radiol.2018172311
50. Lee CY, Mak HK, Chiu PW, Chang HC, Barkhof F, Chan KH. Differential brainstem atrophy patterns in multiple sclerosis and neuromyelitis optica spectrum disorders. J Magn Reson Imaging. (2018) 47:1601–9. doi: 10.1002/jmri.25866
51. Calabrese M, Oh MS, Favaretto A, Rinaldi F, Poretto V, Alessio S, et al. No MRI evidence of cortical lesions in neuromyelitis optica. Neurology. (2012) 79:1671–6. doi: 10.1212/WNL.0b013e31826e9a96
52. Duan Y, Liu Y, Liang P, Jia X, Yu C, Qin W, et al. Comparison of grey matter atrophy between patients with neuromyelitis optica and multiple sclerosis: a voxel-based morphometry study. Eur J Radiol. (2012) 81:e110-4. doi: 10.1016/j.ejrad.2011.01.065
53. Green AJ, Cree BAC. Distinctive retinal nerve fibre layer vascular changes in neuromyelitis optica following optic neuritis. J Neurol Neurosurg Psychiatry. (2009) 80:1002–5. doi: 10.1136/jnnp.2008.166207
54. Liu Y, Wang J, Daams M, Weiler F, Hahn HK, Duan Y, et al. Differential patterns of spinal cord and brain atrophy in NMO and MS. Neurology. (2015) 84:1465–72. doi: 10.1212/WNL.0000000000001441
55. Zhuo Z, Duan Y, Tian D, Wang X, Gao C, Ding J, et al. Brain structural and functional alterations in MOG antibody disease. Mult Scler. (2020) 27:1350–63. doi: 10.1177/1352458520964415
56. Messina S, Mariano R, Roca-Fernandez A, Cavey A, Jurynczyk M, Leite MI, et al. Contrasting the brain imaging features of MOG-antibody disease, with AQP4-antibody NMOSD and multiple sclerosis. Mult Scler. (2021). doi: 10.1177/13524585211018987. [Epub ahead of print].
57. Mariano R, Messina S, Roca-Fernandez A, Leite MI, Kong Y, Palace J. Quantitative spinal cord MRI in MOG-antibody disease, neuromyelitis optica and multiple sclerosis. Brain. (2020) 144:198–212. doi: 10.1093/brain/awaa347
58. Lassmann H. Pathogenic mechanisms associated with different clinical courses of multiple sclerosis. Front Immunol. (2019) 9:3116. doi: 10.3389/fimmu.2018.03116
59. Scalfari A, Romualdi C, Nicholas RS, Mattoscio M, Magliozzi R, Morra A, et al. The cortical damage, early relapses, and onset of the progressive phase in multiple sclerosis. Neurology. (2018) 90:e2099–106. doi: 10.1212/WNL.0000000000005685
60. Hametner S, Dal Bianco A, Trattnig S, Lassmann H. Iron related changes in MS lesions and their validity to characterize MS lesion types and dynamics with Ultra-high field magnetic resonance imaging. Brain Pathol. (2018) 28:743–9. doi: 10.1111/bpa.12643
61. Hacohen Y, Ciccarelli O, Hemingway C. Abnormal white matter development in children with multiple sclerosis and monophasic acquired demyelination. Brain. (2017) 140:1172–4. doi: 10.1093/brain/awx075
62. Ogawa R, Nakashima I, Takahashi T, Kaneko K, Akaishi T, Takai Y, et al. MOG antibody–positive, benign, unilateral, cerebral cortical encephalitis with epilepsy. Neurol Neuroimmunol Neuroinflammation. (2017) 4:322. doi: 10.1212/NXI.0000000000000322
63. Kilsdonk ID, Jonkman LE, Klaver R, van Veluw SJ, Zwanenburg JJ, Kuijer JP, et al. Increased cortical grey matter lesion detection in multiple sclerosis with 7 T MRI: a post-mortem verification study. Brain. (2016) 139:1472–81. doi: 10.1093/brain/aww037
64. Haider H, Zrzavy T, Hametner S, Höftberger R, Bagnato F, Grabner G, et al. The topograpy of demyelination and neurodegeneration in the multiple sclerosis brain. Brain. (2016) 139:807–15. doi: 10.1093/brain/awv398
65. Absinta M, Vuolo L, Rao A, Nair G, Sati P, Cortese IC, et al. Gadolinium-based MRI characterization of leptomeningeal inflammation in multiple sclerosis. Neurology. (2015) 85:18–28. doi: 10.1212/WNL.0000000000001587
66. Absinta M, Sati P, Fechner A, Schindler MK, Nair G, Reich DS. Identification of chronic active multiple sclerosis lesions on 3T MRI. Am J Neuroradiol. (2018) 39:1233–8. doi: 10.3174/ajnr.A5660
67. Zivadinov R, Tavazzi E, Bergsland N, Hagemeier J, Lin F, Dwyer MG, et al. Brain iron at quantitative MRI is associated with disability in multiple sclerosis. Radiology. (2018) 289:487–96. doi: 10.1148/radiol.2018180136
68. Rudko DA, Solovey I, Gati JS, Kremenchutzky M, Menon RS. Multiple sclerosis: improved identification of disease-relevant changes in gray and white matter by using susceptibility-based MR imaging. Radiology. (2014) 272:851–64. doi: 10.1148/radiol.14132475
69. Cortese R, Collorone S, Ciccarelli O, Toosy AT. Advances in brain imaging in multiple sclerosis. Ther Adv Neurol Disord. (2019) 12:175628641985972. doi: 10.1177/1756286419859722
70. Moccia M, Ruggieri S, Ianniello A, Toosy A, Pozzilli C, Ciccarelli O. Advances in spinal cord imaging in multiple sclerosis. Ther Adv Neurol Disord. (2019) 12:1756286419840593. doi: 10.1177/1756286419840593
71. Bodini B, Cercignani M, Khaleeli Z, Miller DH, Ron M, Penny S, et al. Corpus callosum damage predicts disability progression and cognitive dysfunction in primary-progressive MS after five years. Hum Brain Mapp. (2013) 34:1163–72. doi: 10.1002/hbm.21499
72. Wan H, He H, Zhang F, Sha Y, Tian G. Diffusion-weighted imaging helps differentiate multiple sclerosis and neuromyelitis optica-related acute optic neuritis. J Magn Reson Imaging. (2017) 45:1780–5. doi: 10.1002/jmri.25528
73. Kolasa M, Hakulinen U, Brander A, Hagman S, Dastidar P, Elovaara I, et al. Diffusion tensor imaging and disability progression in multiple sclerosis: a 4-year follow-up study. Brain Behav. (2019) 9:e01194. doi: 10.1002/brb3.1194
74. Eijlers AJC, van Geest Q, Dekker I, Steenwijk MD, Meijer KA, Hulst HE, et al. Predicting cognitive decline in multiple sclerosis: a 5-year follow-up study. Brain. (2018) 141:2605–18. doi: 10.1093/brain/awy202
75. Schneider R, Genç E, Ahlborn C, Gold R, Lukas C, Bellenberg B. Temporal dynamics of diffusion metrics in early multiple sclerosis and clinically isolated syndrome: a 2-year follow-up tract-based spatial statistics study. Front Neurol. (2018) 10:1165. doi: 10.3389/fneur.2019.01165
76. Mesaros S, Rocca MA, Pagani E, Sormani MP, Petrolini M, Comi G, et al. Thalamic damage predicts the evolution of primary-progressive multiple sclerosis at 5 years. AJNR Am J Neuroradiol. (2011) 32:1016–0. doi: 10.3174/ajnr.A2430
77. Théaudin M, Saliou G, Ducot B, Deiva K, Denier C, Adams D, et al. Short-term evolution of spinal cord damage in multiple sclerosis: a diffusion tensor MRI study. Neuroradiology. (2012) 54:1171–8. doi: 10.1007/s00234-012-1057-1
78. Naismith RT, Xu J, Tutlam NT, Trinkaus K, Cross AH, Song SK. Radial diffusivity in remote optic neuritis discriminates visual outcomes. Neurology. (2010) 74:1702–10. doi: 10.1212/WNL.0b013e3181e0434d
79. Cortese R, Tur C, Prados F, Schneider T, Kanber B, Moccia M, et al. Ongoing microstructural changes in the cervical cord underpin disability progression in early primary progressive multiple sclerosis. Mult Scler. (2021) 27:28–38. doi: 10.1177/1352458519900971
80. Zhang H, Schneider T, Wheeler-Kingshott CA, Alexander DC. NODDI: practical in vivo neurite orientation dispersion and density imaging of the human brain. Neuroimage. (2012) 61:1000–16. doi: 10.1016/j.neuroimage.2012.03.072
81. Collorone S, Cawley N, Grussu F, Prados F, Tona F, Calvi A, et al. Reduced neurite density in the brain and cervical spinal cord in relapsing–remitting multiple sclerosis: a NODDI study. Mult Scler. (2019) 26:1647–57. doi: 10.1177/1352458519885107
82. Moccia M, van de Pavert S, Eshaghi A, Haider L, Pichat J, Yiannakas M, et al. Pathologic correlates of the magnetization transfer ratio in multiple sclerosis. Neurology. (2020) 95:e2965–76. doi: 10.1212/WNL.0000000000010909
83. Brown RA, Narayanan S, Stikov N, Cook S, Cadavid D, Wolansky L, et al. MTR recovery in brain lesions in the BECOME study of glatiramer acetate vs interferon β-1b. Neurology. (2016) 87:905–11. doi: 10.1212/WNL.0000000000003043
84. Oh J, Ontaneda D, Azevedo C, Klawiter EC, Absinta M, Arnold DL, et al. Imaging outcome measures of neuroprotection and repair in MS: a consensus statement from NAIMS. Neurology. (2019) 92:519–33. doi: 10.1212/WNL.0000000000007099
85. Pardini M, Sudre CH, Prados F, Yaldizli Ö, Sethi V, Muhlert N, et al. Relationship of grey and white matter abnormalities with distance from the surface of the brain in multiple sclerosis. J Neurol Neurosurg Psychiatry. (2016) 87:1212–7. doi: 10.1136/jnnp-2016-313979
86. Brown JW, Pardini M, Brownlee WJ, Fernando K, Samson RS, Prados Carrasco F, et al. An abnormal periventricular magnetization transfer ratio gradient occurs early in multiple sclerosis. Brain. (2017) 140:387–98. doi: 10.1093/brain/aww296
87. Brown JWL, Prados Carrasco F, Eshaghi A, Sudre CH, Button T, Pardini M, et al. Periventricular magnetisation transfer ratio abnormalities in multiple sclerosis improve after alemtuzumab. Mult Scler. (2020) 26:1093–101. doi: 10.1177/1352458519852093
88. Warntjes M, Engström M, Tisell A, Lundberg P. Modeling the presence of myelin and edema in the brain based on multi-parametric quantitative MRI. Front Neurol. (2016) 7:16. doi: 10.3389/fneur.2016.00016
89. Preziosa P, Bouman PM, Kiljan S, Steenwijk MD, Meani A, Pouwels PJ, et al. Neurite density explains cortical T1-weighted/T2-weighted ratio in multiple sclerosis. J Neurol Neurosurg Psychiatry. (2021) 92:790–2. doi: 10.1136/jnnp-2020-324391
90. Preziosa P, Rocca MA, Riccitelli GC, Moiola L, Storelli L, Rodegher M, et al. Effects of fingolimod and natalizumab on brain T1-/T2-weighted and magnetization transfer ratios: a 2-year study. Neurotherapeutics. (2021) 18:878–88. doi: 10.1007/s13311-020-00997-1
91. Laule C, Yung A, Pavolva V, Bohnet B, Kozlowski P, Hashimoto SA, et al. High-resolution myelin water imaging in post-mortem multiple sclerosis spinal cord: a case report. Mult Scler. (2016) 22:1485–9. doi: 10.1177/1352458515624559
92. Vargas WS, Monohan E, Pandya S, Raj A, Vartanian T, Nguyen TD, et al. Measuring longitudinal myelin water fraction in new multiple sclerosis lesions. NeuroImage Clin. (2015) 9:369–75. doi: 10.1016/j.nicl.2015.09.003
93. Hagiwara A, Warntjes M, Hori M, Andica C, Nakazawa M, Kumamaru KK, et al. SyMRI of the brain: rapid quantification of relaxation rates and proton density, with synthetic MRI, automatic brain segmentation, and myelin measurement. Invest Radiol. (2017) 52:647–57. doi: 10.1097/RLI.0000000000000365
94. Chard DT, Alahmadi AAS, Audoin B, Charalambous T, Enzinger C, Hulst HE, et al. Mind the gap: from neurons to networks to outcomes in multiple sclerosis. Nat Rev Neurol. (2021) 17:173–84. doi: 10.1038/s41582-020-00439-8
95. Charalambous T, Tur C, Prados F, Kanber B, Chard DT, Ourselin S, et al. Structural network disruption markers explain disability in multiple sclerosis. J Neurol Neurosurg Psychiatry. (2019) 90:219–26. doi: 10.1136/jnnp-2018-318440
96. Tur C, Eshaghi A, Altmann DR, Jenkins TM, Prados F, Grussu F, et al. Structural cortical network reorganization associated with early conversion to multiple sclerosis. Sci Rep. (2018) 8:1–15. doi: 10.1038/s41598-018-29017-1
97. Aboul-Enein F, Krššák M, Höftberger R, Prayer D, Kristoferitsch W. Diffuse white matter damage is absent in neuromyelitis optica. Am J Neuroradiol. (2010) 31:76–9. doi: 10.3174/ajnr.A1791
98. Chou IJ, Tanasescu R, Mougin OE, Gowland PA, Tench CR, Whitehouse WP, et al. Reduced Myelin Signal in normal-appearing White Matter in neuromyelitis optica Measured by 7T Magnetic Resonance Imaging. Sci Rep. (2019) 9:14378. doi: 10.1038/s41598-019-50928-0
99. Pache F, Zimmermann H, Finke C, Lacheta A, Papazoglou S, Kuchling J, et al. Brain parenchymal damage in neuromyelitis optica spectrum disorder – a multimodal MRI study. Eur Radiol. (2016) 26:4413–22. doi: 10.1007/s00330-016-4282-x
100. Kuchling J, Backner Y, Oertel FC, Raz N, Bellmann-Strobl J, Ruprecht K, et al. Comparison of probabilistic tractography and tract-based spatial statistics for assessing optic radiation damage in patients with autoimmune inflammatory disorders of the central nervous system. NeuroImage Clin. (2018) 19:538–50. doi: 10.1016/j.nicl.2018.05.004
101. Kimura MCG, Doring TM, Rueda FC, Tukamoto G, Gasparetto EL. In vivo assessment of white matter damage in neuromyelitis optica: a diffusion tensor and diffusion kurtosis MR imaging study. J Neurol Sci. (2014) 345:172–5. doi: 10.1016/j.jns.2014.07.035
102. Raschke F, Wesemann T, Wahl H, Appold S, Krause M, Linn J, et al. Diffusion tensor imaging of normal-appearing white matter in patients with neuromyelitis optica spectrum disorder and multiple sclerosis. Eur J Neurol. (2017) 24:966–73. doi: 10.1111/ene.13321
103. Kawachi I, Lassmann H. Neurodegeneration in multiple sclerosis and neuromyelitis optica. J Neurol Neurosurg Psychiatry. (2017) 88:137–45. doi: 10.1136/jnnp-2016-313300
104. Papadopoulou A, Oertel FC, Gaetano L, Kuchling J, Zimmermann H, Chien C, et al. Attack-related damage of thalamic nuclei in neuromyelitis optica spectrum disorders. J Neurol Neurosurg Psychiatry. (2019) 1156–64. doi: 10.1136/jnnp-2018-320249. [Epub ahead of print].
105. Qian W, Chan Q, Mak H, Zhang Z, Anthony MP, Yau KK, et al. Quantitative assessment of the cervical spinal cord damage in neuromyelitis optica using diffusion tensor imaging at 3 Tesla. J Magn Reson Imaging. (2011) 33:1312–20. doi: 10.1002/jmri.22575
106. Klawiter EC, Xu J, Naismith RT, Benzinger TL, Shimony JS, Lancia S, et al. Increased radial diffusivity in spinal cord lesions in neuromyelitis optica compared with multiple sclerosis. Mult Scler J. (2012) 18:1259–68. doi: 10.1177/1352458512436593
107. Rocca MA, Valsasina P, Leavitt VM, Rodegher M, Radaelli M, Riccitelli GC, et al. Functional network connectivity abnormalities in multiple sclerosis: correlations with disability and cognitive impairment. Mult Scler J. (2018) 24:459–71. doi: 10.1177/1352458517699875
108. Stefancin P, Govindarajan ST, Krupp L, Charvet L, Duong TQ. Resting-state functional connectivity networks associated with fatigue in multiple sclerosis with early age onset. Mult Scler Relat Disord. (2019) 31:101–5. doi: 10.1016/j.msard.2019.03.020
109. Schoonheim MM, Pinter D, Prouskas SE, Broeders TA, Pirpamer L, Khalil M, et al. Disability in multiple sclerosis is related to thalamic connectivity and cortical network atrophy. Mult Scler. (2021) doi: 10.1177/13524585211008743. [Epub ahead of print].
110. Giorgio A, Zhang J, Stromillo ML, Rossi F, Battaglini M, Nichelli L, et al. Pronounced structural and functional damage in early adult pediatric-onset multiple sclerosis with no or minimal clinical disability. Front Neurol. (2017) 8:608. doi: 10.3389/fneur.2017.00608
111. Savoldi F, Rocca MA, Valsasina P, Riccitelli GC, Mesaros S, Drulovic J, et al. Functional brain connectivity abnormalities and cognitive deficits in neuromyelitis optica spectrum disorder. Mult Scler J. (2020) 26:795–805. doi: 10.1177/1352458519845109
112. Cai H, Zhu J, Zhang N, Wang Q, Zhang C, Yang C, et al. Subregional structural and connectivity damage in the visual cortex in neuromyelitis optica. Sci Rep. (2017) 7:41914. doi: 10.1038/srep41914
113. Klistorner A, Garrick R, Barnett MH, Graham SL, Arvind H, Sriram P, et al. Axonal loss in non-optic neuritis eyes of patients with multiple sclerosis linked to delayed visual evoked potential. Neurology. (2013) 80:242–5. doi: 10.1212/WNL.0b013e31827deb39
114. Oertel FC, Kuchling J, Zimmermann H, Chien C, Schmidt F, Knier B, et al. Microstructural visual system changes in AQP4-antibody-seropositive NMOSD. Neurol Neuroimmunol Neuroinflammation. (2017) 4:e334. doi: 10.1212/NXI.0000000000000334
115. Saidha S, Syc SB, Ibrahim MA, Eckstein C, Warner CV, Farrell SK, et al. Primary retinal pathology in multiple sclerosis as detected by optical coherence tomography. Brain. (2011) 134:518–33. doi: 10.1093/brain/awq346
116. Petzold A, Balcer LJ, Calabresi PA, Costello F, Frohman TC, Frohman EM, et al. Optical coherence tomography in multiple sclerosis: a systematic review and meta-analysis. Lancet Neurol. (2010) 9:921–32. doi: 10.1016/S1474-4422(10)70168-X
117. Balcer LJ, Miller DH, Reingold SC, Cohen JA. Vision and vision-related outcome measures in multiple sclerosis. Brain. (2015) 138:11–27. doi: 10.1093/brain/awu335
118. Saidha S, Al-Louzi O, Ratchford JN, Bhargava P, Oh J, Newsome SD, et al. Optical coherence tomography reflects brain atrophy in multiple sclerosis: a four-year study. Ann Neurol. (2015) 78:801–13. doi: 10.1002/ana.24487
119. Naismith RT, Xu J, Tutlam NT, Lancia S, Trinkaus K, Song SK, et al. Diffusion tensor imaging in acute optic neuropathies: predictor of clinical outcomes. Arch Neurol. (2012) 69:65. doi: 10.1001/archneurol.2011.243
120. Peng A, Kinoshita M, Lai W, Tan A, Qiu X, Zhang L, et al. Retinal nerve fiber layer thickness in optic neuritis with MOG antibodies: a systematic review and meta-analysis. J Neuroimmunol. (2018) 325:69–73. doi: 10.1016/j.jneuroim.2018.09.011
121. Narayan RN, McCreary M, Conger D, Wang C, Greenberg BM. Unique characteristics of optical coherence tomography (OCT) results and visual acuity testing in myelin oligodendrocyte glycoprotein (MOG) antibody positive pediatric patients. Mult Scler Relat Disord. (2019) 28:86–90. doi: 10.1016/j.msard.2018.11.026
122. Freeman L, Garcia-Lorenzo D, Bottin L, Leroy C, Louapre C, Bodini B, et al. The neuronal component of gray matter damage in multiple sclerosis: a [11C]flumazenil positron emission tomography study. Ann Neurol. (2015) 78:554–67. doi: 10.1002/ana.24468
123. Sucksdorff M, Matilainen M, Tuisku J, Polvinen E, Vuorimaa A, Rokka J, et al. Brain TSPO-PET predicts later disease progression independent of relapses in multiple sclerosis. Brain. (2020) 143:3318–30. doi: 10.1093/brain/awaa275
124. Bodini B, Poirion E, Tonietto M, Benoit C, Palladino R, Maillart E, et al. Individual Mapping of Innate Immune cell activation is a candidate marker of patient-specific trajectories of worsening disability in multiple sclerosis. J Nucl Med. (2020) 61:1043–9. doi: 10.2967/jnumed.119.231340
125. Treaba CA, Granberg TE, Sormani MP, Herranz E, Ouellette RA, Louapre C, et al. Longitudinal characterization of cortical lesion development and evolution in multiple sclerosis with 7.0-T MRI. Radiology. (2019) 291:740–9. doi: 10.1148/radiol.2019181719
126. de Graaf WL, Kilsdonk ID, Lopez-Soriano A, Zwanenburg JJ, Visser F, Polman CH, et al. Clinical application of multi-contrast 7-T MR imaging in multiple sclerosis: increased lesion detection compared to 3 T confined to grey matter. Eur Radiol. (2013) 23:528–40. doi: 10.1007/s00330-012-2619-7
127. Sati P, Oh J, Constable RT, Evangelou N, Guttmann CR, Henry RG, et al. The central vein sign and its clinical evaluation for the diagnosis of multiple sclerosis: a consensus statement from the North American Imaging in Multiple Sclerosis Cooperative. Nat Publ Gr. (2016) doi: 10.1038/nrneurol.2016.166
128. Tallantyre EC, Dixon JE, Donaldson I, Owens T, Morgan PS, Morris PG, et al. Ultra-high-field imaging distinguishes MS lesions from asymptomatic white matter lesions. Neurology. (2011) 76:534–9. doi: 10.1212/WNL.0b013e31820b7630
129. Kolb H, Absinta M, Beck ES, Ha SK, Song Y, Norato G, et al. 7T MRI Differentiates Remyelinated from Demyelinated Multiple Sclerosis Lesions. Ann Neurol. (2021) 90:612–26. doi: 10.1002/ana.26194
130. Schumacher S, Pache F, Bellmann-Strobl J, Behrens J, Dusek P, Harms L, et al. Neuromyelitis optica does not impact periventricular venous density versus healthy controls: a 7.0 Tesla MRI clinical study. Magn Reson Mater Physics Biol Med. (2016) 29:12. doi: 10.1007/s10334-016-0554-3
131. Pasquier B, Borisow N, Rasche L, Bellmann-Strobl J, Ruprecht K, Niendorf T, et al. Quantitative 7T MRI does not detect occult brain damage in neuromyelitis optica from the neurologic clinic and policlinic (B. Neurol Neuroimmunol Neuroinflamm. (2019) 6:541. doi: 10.1212/NXI.0000000000000541
132. Barro C, Benkert P, Disanto G, Tsagkas C, Amann M, Naegelin Y, et al. Serum neurofilament as a predictor of disease worsening and brain and spinal cord atrophy in multiple sclerosis. Brain. (2018) 141:2382–91. doi: 10.1093/brain/awy154
133. Williams T, Zetterberg H, Chataway J. Neurofilaments in progressive multiple sclerosis: a systematic review. J Neurol. (2020) 268:3212–22. doi: 10.1007/s00415-020-09917-x
134. Solanky BS, Prados F, Tur C, Yiannakas MC, Kanber B, Cawley N, et al. Sodium in the relapsing–remitting multiple sclerosis spinal cord: increased concentrations and associations with microstructural tissue anisotropy. J Magn Reson Imaging. (2020) 46:1247–62. doi: 10.1002/jmri.27201
135. Sechi E, Krecke KN, Messina SA, Buciuc M, Pittock SJ, Chen JJ, et al. Comparison of MRI lesion evolution in different central nervous system demyelinating disorders. Neurology. (2021) 7:e1097–109. doi: 10.1212/WNL.0000000000012467
136. Pittock SJ, Berthele A, Fujihara K, Kim HJ, Levy M, Palace J, et al. Eculizumab in aquaporin-4-positive neuromyelitis optica spectrum disorder. N Engl J Med. (2019) 381:614–25. doi: 10.1056/NEJMoa1900866
Keywords: MRI, multiple sclerosis, prognosis, neuromyelitis optica spectrum disorder, myelin oligodendrocyte antibody disease
Citation: Cortese R, Giorgio A, Severa G and De Stefano N (2021) MRI Prognostic Factors in Multiple Sclerosis, Neuromyelitis Optica Spectrum Disorder, and Myelin Oligodendrocyte Antibody Disease. Front. Neurol. 12:679881. doi: 10.3389/fneur.2021.679881
Received: 12 March 2021; Accepted: 08 October 2021;
Published: 18 November 2021.
Edited by:
Francesco Patti, University of Catania, ItalyReviewed by:
Eleonora Tavazzi, Buffalo Neuroimaging Analysis Center, United StatesEoin Flanagan, Mayo Clinic, United States
Copyright © 2021 Cortese, Giorgio, Severa and De Stefano. This is an open-access article distributed under the terms of the Creative Commons Attribution License (CC BY). The use, distribution or reproduction in other forums is permitted, provided the original author(s) and the copyright owner(s) are credited and that the original publication in this journal is cited, in accordance with accepted academic practice. No use, distribution or reproduction is permitted which does not comply with these terms.
*Correspondence: Nicola De Stefano, ZGVzdGVmYW5vQHVuaXNpLml0