 Karina D. Rysenkova1,2*†
 Konstantin E. Troyanovskiy2
 Polina S. Klimovich1,2
 Taisiya R. Bulyakova2
 Ekaterina M. Shelomentseva2
 Anna A. Shmakova1,2
 Daria Yu. Tanygina2
 Olga I. Ivashkina3,4,5
 Konstantin V. Anokhin3,4
 Maxim N. Karagyaur2
 Maria I. Zvereva6
 Kseniya A. Rubina2
 Vsevolod A. Tkachuk1,2
 Ekaterina V. Semina1,2*†
- 1Institute of Experimental Cardiology, National Medical Research Centre of Cardiology named after academician E.I. Chazov, Moscow, Russia
- 2Faculty of Medicine, Lomonosov Moscow State University, Moscow, Russia
- 3Institute for Advanced Brain Studies, Lomonosov Moscow State University, Moscow, Russia
- 4Laboratory of Neurobiology of Memory, P.K. Anokhin Research Institute of Normal Physiology, Moscow, Russia
- 5Laboratory of Neuroscience, National Research Center “Kurchatov Institute”, Moscow, Russia
- 6Department of Chemistry, Lomonosov Moscow State University, Moscow, Russia
Urokinase receptor (uPAR) is a glycosylphosphatidylinositol (GPI)-anchored receptor of urokinase (uPA), which is involved in brain development, nerve regeneration, wound healing and tissue remodeling. We have recently shown that Plaur, which encodes uPAR, is an early response gene in murine brain. Assumingly, diverse functions of Plaur might be attributed to hypothetical, unidentified microRNAs encoded within introns of the Plaur gene. Using a bioinformatic approach we identified novel small RNAs within the Plaur gene and named them Plaur-miR1-3p and Plaur-miR1-5p. We confirmed Plaur-dependent expression of Plaur-miR1-3p and Plaur-miR1-5p in the mouse brain and mouse neuroblastoma Neuro2a cells. Utilizing an in silico MR-microT algorithm in DianaTools we selected two target genes – Mef2d and Emx2 with the highest binding scores to small RNAs selected from identified Plaur-Pre-miR1. Furthermore, sequencing of mouse brain samples for Plaur-miR1-5p target genes revealed two more genes—Nrip3 and Snrnp200. The expression of Emx2, Mef2d, and Snrnp200 in the mouse brain and Mef2d and Snrnp200 in Neuro2a cells correlated with expression of Plaur and small RNAs—Plaur-miR1-3p and Plaur-miR1-5p. Finally, we demonstrated elevated MEF2D protein expression in the mouse brain after Plaur induction and displayed activating effects of Plaur-miR1-5p on Mef2d expression in Neuro2a cells using Luciferase reporter assay. In conclusion, we have identified Plaur-miR1-3p and Plaur-miR1-5p as novel small RNAs encoded in the Plaur gene. This finding expands the current understanding of Plaur function in brain development and functioning.
Introduction
Urokinase receptor (uPAR, also known as CD87, U-PAR and UPAR; encoded by the gene Plaur) is a multifaceted protein with numerous physiological and pathological effects. Since uPAR is anchored to the plasma membrane via glycosylphosphatidylinositol (GPI)-moiety, it can move laterally within the membrane leaflet, forming the uPAR interactome. The final outcome and cellular effects of uPAR-mediated interactions depend on the sum of signals coming from the transmembrane partners and receptors engaged in uPAR interactome (Eden et al., 2011). Urokinase (uPA) binding to uPAR activates the uPA/uPAR complex at the leading edge of migrating cell promoting their migration via extracellular matrix remodeling. These changes contribute to various physiological processes—morphogenesis, tissue regeneration and nerve fiber growth (Parfenova et al., 2009; Tkachuk et al., 2009; Semina et al., 2016; Klimovich et al., 2020; Yepes et al., 2021), as well as to pathophysiological processes—fibrosis, tumor growth and metastasis (Mahmood et al., 2018; Tkachuk et al., 2019).
uPAR overexpression stimulates radial neuronal migration to the outer layers of differentiating cortex (Shmakova et al., 2021), whereas uPAR knockout reduces migration of parvalbumin-expressing GABA interneurons into cerebral cortex (Powell et al., 2003). Recent papers have shown that mutations and polymorphisms in the Plaur gene or uPAR ligand SRPX2 affect the formation of brain structures and induce severe developmental pathologies in humans (speech deficiency, mental weakness and autism spectrum disorders) (Bruneau and Szepetowski, 2011). Using a model of acute generalized seizures in mice, we revealed that Plaur operates as an immediate early gene, and is rapidly induced by neuronal activity in different brain regions independently of de novo protein synthesis (Shmakova et al., 2020). This rapid and universal response confirms an important role of uPAR in neuronal response to excitation and/or damage.
We have previously demonstrated that CRISPR/Cas9-mediated targeting of the Plaur gene inhibits Neuro2a neuroblastoma cell proliferation, leading to downregulation of full-length Ntrk3 messenger RNA (mRNA), which encodes tropomyosin receptor kinase C (TrkC), a receptor that is involved in p38/Akt signaling pathway (Rysenkova et al., 2018). However, the reported effect of Plaur knockout on Ntrk3 mRNA expression may not be merely attributed to uPAR-dependent interactome function. It has been previously established that gene expression and mRNA functioning can be regulated by so-called non-coding RNAs that are not translated into a protein. Being a part of this group, microRNAs (miRNAs) represent a highly conserved fraction of short RNA (18–27 nt) endogenously produced in many organisms. A complex secondary structure of miRNA precursor (pri-miRNA) is subsequently processed into a more mature form of pre-miRNA with a hairpin structure, which is further transformed into a mature form located at the 5′ or 3′ end of the loop (Broughton et al., 2016). According to the canonical pathway, mature miRNAs complementarily interact with their target transcripts in mammalian cells, leading to mRNA degradation or translation inhibition (Broughton et al., 2016).
Originally identified in the cytoplasm, miRNAs have now been found in all cellular compartments, where their functions are not limited to target mRNA degradation. Indeed, there is evidence indicating that miRNAs could either suppress or activate gene expression by engaging with target gene promoters in the nucleus (Broughton et al., 2016). Currently, over 2,600 human miRNAs have been registered in the miRBase database,1 which correspond to 2,500 mouse miRNAs owing to their high conservatism (Ørom et al., 2008; Place et al., 2008). The miRBase database (see text footnote 1 Release 22.1: October, 2018) comprises about 2,654 mature human miRNAs in contrast to only 1,978 mature mouse miRNAs [GRCm38]).
The Plaur gene consists of seven exons and six introns. Prior to our study, no miRNAs have been reported in the Plaur gene sequence. The total Plaur gene size is 16,000 bp, while the mature mRNA (merely exons) is composed of only 1,000 nt (Kjaergaard et al., 2008), suggesting that non-coding RNAs, including miRNAs, could be encoded in this gene. We conducted a bioinformatic search and analyzed the miRNAs that are encoded in the Plaur gene. We identified novel small RNAs and named them Plaur-miR1-3p and Plaur-miR1-5p. Using wild-type uPAR-expressing Neuro2a cells, CRISPR-edited uPAR-deficient Neuro2a cells and in vivo model of endogenous induction of Plaur expression in the brain, we confirmed the existence of these new small RNAs, Plaur-miR1-3p and Plaur-miR1-5p. In silico analysis of target genes allowed us to identify its possible functions, namely determination of the cell fate and a crucial role in neuronal apoptosis in the developing central nervous system. We confirmed Plaur-dependent expression of Plaur-miR1-3p and Plaur-miR1-5p in the mouse brain and mouse neuroblastoma Neuro2a cells. Utilizing an in silico MR-microT algorithm in DianaTools we selected two target genes—Emx2 and Mef2d—with the highest binding score. Moreover, sequencing of the mouse brain samples for Plaur-miR1-5p target genes revealed two more targets—Nrip3 and Snrnp200. The expression of Emx2, Mef2d and Snrnp200 in the mouse brain and Mef2d and Snrnp200 in Neuro2a cells correlated with expression of the Plaur gene and small RNAs—Plaur-miR1-3p and Plaur-miR1-5p. Finally, in the mouse brain we demonstrated an elevated expression of MEF2D protein after Plaur induction and confirmed Plaur-miR1-5p-mediated activation of Mef2d gene expression in Neuro2a cells. In conclusion, we identified novel small RNAs - Plaur-miR1-3p and Plaur-miR1-5p—encoded in the mouse Plaur gene. The obtained results enable an increasingly deeper and more nuanced understanding of Plaur gene function in brain development and functioning.
Materials and Methods
Bioinformatic Prediction of miRNA in Plaur and Its Candidate Target Genes
To identify miRNA in the Plaur Mus musculus gene, we employed the following bioinformatic tools. Promoter 2.02 and ElemeNT3 computational tools were used to detect core promoter elements upon screening RNA polymerase III (Pol III) promoter regions (Sloutskin et al., 2015). Putative miRNA precursors were identified by using the miRNA Fold web service4 (Supplementary Figure 1; Tav et al., 2016). We selected one from the predicted stem-loop structures based on the stem-loop length, the free energy of the stem-loop formation and consensus motifs enhancing Drosha processing: a basal UG motif, a flanking CNNC motif, a mismatched GHG motif and an apical UGU/GUG motif (Lee and Shin, 2018). Stem-loop structures were visualized by implementing Quickfold (Supplementary Figure 2).5 In the selected stem-loops, Drosha cleavage sites were predicted by using MatureBayes (Gkirtzou et al., 2010) and putative mature miRNAs were identified (Supplementary Figure 3).
To identify the putative targets and binding sites of predicted miRNA, we employed a web-based target prediction algorithm, namely MR-microT in DianaTools (Supplementary Figure 4A; Reczko et al., 2012; Paraskevopoulou et al., 2013).6 The sequences of predicted miRNAs were used as an input. The mouse genome (Mus musculus, Ensembl v84) was used as a database for target mRNA prediction (Supplementary Figure 4B). We selected several predicted target mRNAs (Supplementary Tables 1, 2) for further verification. To verify the identified targets, small RNA sequencing using the Plaur-miR1 primer was performed. The obtained sequences were mapped in the Mus musculus genome using the BLAST algorithm. Genes that appeared both in the BLAST search and MR-microT prediction were selected for quantitative real-time polymerase chain reaction (qPCR) verification. To assess the specificity of Plaur-miR1-5p and Plaur-mir1-3p to the target gene promoter regions and introns, we took NCBI gene sequences and aligned them against Plaur-miR1-5p and Plaur-mir1-3p via the M-Coffee sequence alignment tool on the T-COFFEE Multiple Sequence Alignment Server web service (Supplementary Figure 4C).
Cell Culture
Mouse Neuro2a neuroblastoma cells (ATCC® CCL-131™ University Boulevard Manassas, VA, United States) not exceeding 20 passages were cultured in complete medium—Dulbecco’s Modified Eagle’s Medium (DMEM) (#21969035), 10% fetal bovine serum (FBS, Gibco, #10270-106, United Kingdom), 1 × Minimum Essential Medium (MEM) Non-Essential Amino Acids Solution (#11140050) and 1 × antibiotic-antimycotic solution (#15240062; all from Gibco, Life Technologies, Bleiswijk, Netherlands)—at 37°C in an atmosphere with 5% CO2. Cells were plated at a concentration of 1 × 10⁵ cells/ml. Neuro2a cells with uPAR knockout were obtained by using the CRISPR/Cas9 (Neuro2a KO-Plaur cells) genome editing tool as described previously (Rysenkova et al., 2018).
Animal and Tissue Samples
We had previously shown that Plaur gene expression is induced in various brain structures (Shmakova et al., 2020) in a model of pentylenetetrazole (PTZ)-induced seizures in mice. Here we used miRNA and mRNA isolated from previously obtained brain samples. A detailed description of methodology, animal facility and enabling documentation has been previously published (Shmakova et al., 2020). To assess the endogenous level of Plaur-miR1 induction and expression of its target genes, we selected brain regions with the most significant Plaur mRNA induction 3 h after PTZ (Sigma-Aldrich, cat. # P6500, Saint Louis, MO, United States) administration. Thus, posterior cortex (Plaur induction was 8.7 times higher than control) was enrolled to assess the level of Plaur-mir1-5p and Plaur-mir1-3p and the striatum (Plaur induction was 16 times higher than control)—for the target gene analysis (for further information, see Figure 2 in Shmakova et al., 2020).
Construction of the pBl-U6-Plaur-Pre-miR1 Vector for Overexpression of Plaur-Pre-miR1 in Neuro2a Cells
To clone Plaur-pre-miR1 (precursor of mature Plaur-miR1), we used a vector for mouse Plaur-pre-miR1 expression originally based on the pBl-U6-CMV-RFP (pBlueScriptII vector from Agilent Santa Clara, CA, United States) plasmid and encoding red fluorescent protein (RFP) for detection (Supplementary Figure 5). Mouse Plaur-pre-miR1 was amplified from Neuro2a genomic DNA using primers listed in Supplementary Table 1. For amplification, we used Phusion High-Fidelity PCR Master Mix (#F531L, Thermo Fisher Scientific, Vilnius, Lithuania) according to the manufacturer’s protocol. The program for template denaturation, primer annealing and primer extension was 40 cycles of 94°C for 15 s, 70°C for 15 s and 72°C for 25 s, respectively. The product length was 280 base pairs (bp). The sequences were cloned into the pBl-U6-CMV-RFP plasmid via BbsI (#R0539, New England Biolabs, Ipswich, MA, United States) restriction sites. The pBl-U6-Plaur-pre-miR1 plasmid sequence was verified using the seq u6 primer 5′-CCTATTTCCCATGATTCCTTCATATTTGC-3′ (Supplementary Figure 6; sequencing was performed by Evrogen, Moscow, Russia).
The pBl-U6-Plaur-pre-miR1 vector was transfected in Neuro2a cells with Lipofectamine 2000 according to the manufacturer’s protocol. The Neuro2a cell transfection efficiency was evaluated basing on the RFP fluorescence analysis 24 h after transfection using Leica DMI 6000 B fluorescent microscope and LAS X software (Wetzlar, Germany). Over a period of 48 h, Neuro2a-Plaur-pre-miR1-transfected cells were lysed and a fraction of small RNAs (mirVana miRNA Isolation Kit AM1560, Ambicon, Carlsbad, CA, United States) and total RNA (Quick-RNA MicroPrep R1051, Invitrogen, Freiburg, Germany) was purified to assess the Plaur-miR1 and its target genes expression level.
Quantitative Real-Time Polymerase Chain Reaction of Plaur-miR1-5p and Plaur-miR1-3p
Short RNAs (< 200 nt small RNAs including pri-miRNAs, pre-miRNAs and mature miRNAs) were isolated from wild type Neuro2a cells, Plaur-deficient cells (Neuro2a KO-Plaur) (Rysenkova et al., 2018), Neuro2a cells overexpressing Plaur-pre-miR1 (three replicates per cell group), and from posterior cortex samples (three animals per group) 0 and 3 h after PTZ treatment according to the manufacturer’s protocol (mirVana miRNA Isolation Kit AM1560, Ambicon, Carlsbad, CA, United States). To generate complementary DNA (cDNA), 500 ng of small RNAs fraction and miScript II RT kit (#218160, Qiagen, Hilden, Germany) was used. PCR was carried out by using qPCR mix-HS SYBR (Evrogen) on a CFX96 real-time PCR device (Bio-Rad, Hercules, CA, United States). qPCR was employed to detect Plaur-miR1-5p and Plaur-miR1-3p from Plaur-pre-miR1. Primers for Plaur-miR1 were designed with NCBI Primer-blast7 and the IDT Oligo Analyzer tool (eu.idtdna.com/pages/tools/oligoanalyzer). For reverse primers, we used the commercially available 10 × miScript universal primer from the miScript SYBR® Green PCR Kit (#218073, Qiagen, Hilden, Germany). All primers are listed in Supplementary Table 1. The thermal cycling program for template denaturation, primer annealing and primer extension was 40 cycles of 94°C for 15 s, 57°C for 15 s and 72°C for 20 s, respectively. The relative transcript level of Plaur-miR1-5p was calculated using the 2–ΔΔCt method with Snord95 as a reference; normalization was carried out by taking the average level of each transcript in the control as a unit. The PCR products of Plaur-miR1-5p obtained from Neuro2a cells and posterior cortex were cloned into 40 TA plasmids and subjected to Sanger sequencing (performed by Evrogen).
Quantitative Real-Time Polymerase Chain Reaction of Target Genes mRNA for Plaur-miR1-5p and Plaur-miR1-3p
Total RNA was extracted from wild type Neuro2a cells, Plaur-deficient cells (Neuro2a-KO uPAR) and Neuro2a cells overexpressing Plaur-pre-miR1 (three replicates per each group) (Supplementary Figure 7A) as well as from the striatum of control mice (treated with saline) and mice 0.5, 1, 3, 6, 24, and 72 h after PTZ treatment (4–5 animals per group). The Quick-RNA MicroPrep kit with TRIzol (#R1051, Invitrogen, Carlsbad, CA, United States) was used according to the manufacturer’s protocol. The isolated RNA was treated with RNase-free DNAase I (Fermentas, Rockford, IL, United States) and then run on an agarose gel for quality control (Supplementary Figure 7E). To generate cDNA, 1μg of total RNA and the MMLV RT kit (Evrogen) were used. PCR was carried out using qPCR mix-HS SYBR (Evrogen) and the CFX96 Touch Real-Time PCR Detection System (Bio-Rad). qPCR was used to detect the expression of Plaur-miR1-5p target genes. Primers were designed using NCBI Primer-blast (see text footnote 8) and the IDT Oligo Analyzer tool.8 All primers are listed in Supplementary Table 1; the Plaur mRNA primers are specific to exon 4. The thermal cycling program for template denaturation, primer annealing and primer extension was 40 cycles of 94°C for 10 s, 60°C for 30 s, and 72°C for 15 s, respectively. The relative transcript level of mRNA was calculated using the 2–ΔΔCt method with Actb (encodes β-actin) as a reference. The reactions were performed in instrumental triplicates; the results represent the mean of biological triplicates (unless otherwise stated) ± standard error of the mean (SEM).
Western Blot
Brain tissue samples was homogenized and lysed in an ice-cold RIPA lysis buffer as previously described (Shmakova et al., 2020). Proteins (45 μg) were resolved in 10% SDS-PAGE gels and transferred to PVDF membrane (GE Healthcare) in the transfer buffer (25 mM Tris, 192 mM glycine, 0.1% SDS and 20% methanol). Non-specific binding was blocked by 5% non-fat dried milk in phosphate buffered saline (PBS, Sigma-Aldrich), containing 0.1% Tween-20 at + 4°C overnight. Proteins were probed with the following primary antibodies in 1:1,000 dilution: rabbit anti-SNRNP200 (Sigma, HPA029321), rabbit anti-MEF2D (Cell signaling, 25621), rabbit anti-EMX2 (Abcam, ab94713), rabbit anti-β-actin (Cell signaling, 4970S, control of protein load) for 2h at room temperature. Membranes were washed with PBS containing 0.1% Tween-20 and incubated with appropriate peroxidase-conjugated secondary antibodies in 1:10,000 dilution for 1.5h at room temperature, followed by washing in PBS containing 0.1% Tween-20. Proteins were visualized using SuperSignal West Dura Chemiluminescent Substrate (Thermo Fisher Scientific) and ChemiDoc™ XRS + System (Bio-Rad) for Western blotting imaging and analysis. Densitometric analysis of blots at non-saturating exposures was performed using ImageJ. Values of SNRNP200, MEF2D, and EMX2 protein expression were normalized to β-actin. Original uncropped western blot images are presented in Supplementary Figure 10.
Luciferase Reporter Assay
DNA fragments encoding the predicted binding sites for Plaur-miR1-5p (3′UTR for Mef2d [positions 3376-3499 and 5140-5276 in NM_001310587.1], Emx2 [positions 2191-2281 in NM_010132.2] and CDS for Snrnp200 [positions 3037-3114 in NM_177214.5]) were amplified from murine cDNA (see Supplementary Table 1 for primers) using Phusion High-Fidelity PCR Master Mix (Thermo Fisher Scientific, # F531L) and inserted in pGL3-promoter vector (Promega, #U47298). HindIII and NcoI restriction sites were used for CDS sequences, while XbaI and RigI restriction sites were used for 3′-UTR. The sequence of the resulting vectors was confirmed using Sanger sequencing.
Neuro2a cells were seeded onto 96-well plate, cultured into a monolayer, and co-transfected with PGL3 plasmids encoding Mef2d 3′-UTR sequences, Emx2 3′-UTR sequence, Snrnp200 CDS sequence or empty pGL3 vector (control) with plasmid pBl-U6-Plaur-pre-miR1 or pBl-U6 vector. 48 h after transfection cells were analyzed using Luciferase Reporter Assay Kit (Promega, Fitchburg, WI, United States). Luminescence was evaluated using Victor™ X3 Multilabel Plate Reader (Perkin-Elmer Inc., United States), the luciferase signal was calculated in Relative luciferase activity units. Data were normalized by luciferase signal in Neuro2a cells co-transfected with empty pGL3 vector and pBl-U6-Plaur-pre-miR1 vector.
Statistical Analysis
We analyzed qPCR data with GraphPad Prism 8.01 (GraphPad Software Inc., San Diego, CA). For cells we analyzed qPCR data using an unpaired t-test, treating the wild type and experimental cells as two independent groups. For comparisons with more than two groups, we used analysis of variance (ANOVA) followed by Dunnett’s multiple comparisons test. Relative luciferase activity data were compared using two-way ANOVA followed by Šídák’s multiple comparisons test. The data are presented as the mean ± SEM. The level of significance was set at P < 0.05.
Results
Computational Prediction of a Novel miRNA in the Mus musculus Plaur Gene and Its Target Genes
We first hypothesized that small RNAs are encoded within Plaur as individual genes under specific Pol III promoters. Bioinformatic screening of Plaur employing ElemeNT (Sloutskin et al., 2015) and Promoter 2.0 failed to reveal any specific binding sites for Pol III. Hence, no predicted transcription start sites (TSS) for miRNA genes within Plaur that could give rise to miRNAs via the classical biogenesis pathway were identified. Since there is considerable evidence indicating that miRNAs can be located in the introns of protein-coding genes—called mirtrons (Dokanehiifard et al., 2015, 2017)—we next tested the hypothesis that Plaur can contain such structures. The sequences of predicted miRNAs are summarized in Table 1.
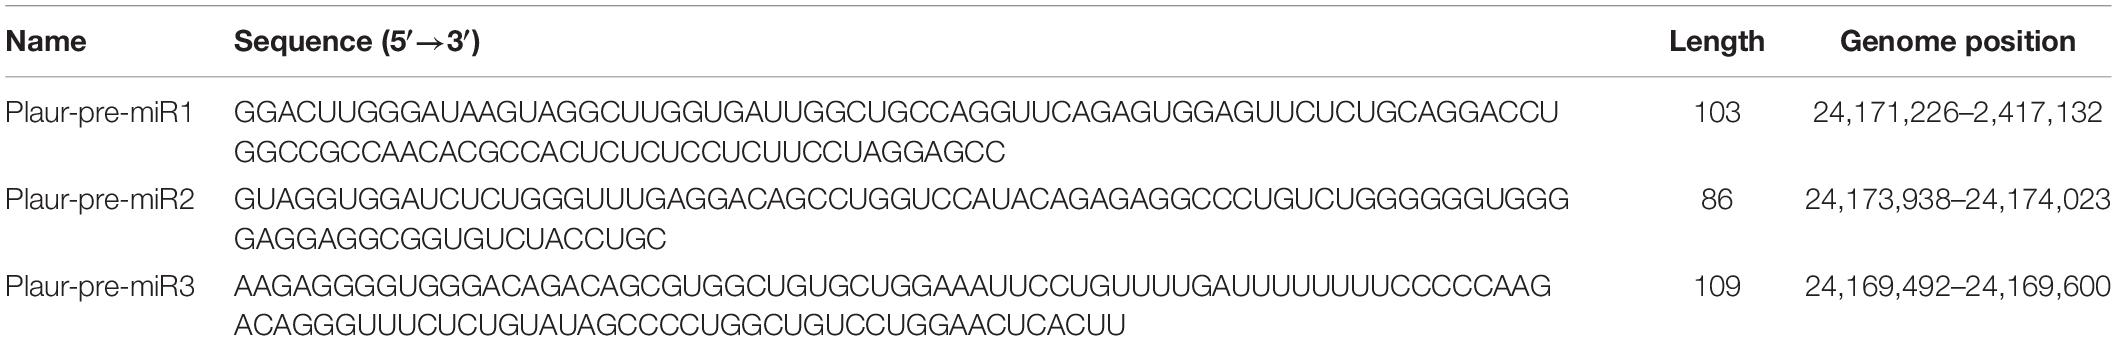
Table 1. Selected precursor miRNAs encoded in the Mus musculus Plaur gene.
We employed the miRNA Fold9 web-based prediction service to reveal miRNA precursors in Plaur (GRCm39, Gene ID: 18793). miRNA Fold predicted 256 stem-loop structures, which are potential miRNA precursors, located within Plaur. We filtered the most stable predicted stem-loops with free energy of formation ≤ −15 kJ/mol (Xue et al., 2005). Such structures occur infrequently, although they are frequently non-random because evolution should theoretically reject them. Among that putative pre-miRNA, three ones had a high probability to exist in vivo based on motifs enhancing Drosha processing: Plaur-pre-miR1 (located in intron 3), Plaur-pre-miR2 (located in intron 3) and Plaur-pre-miR3 (located in intron 6) (Figure 1 and Table 1).
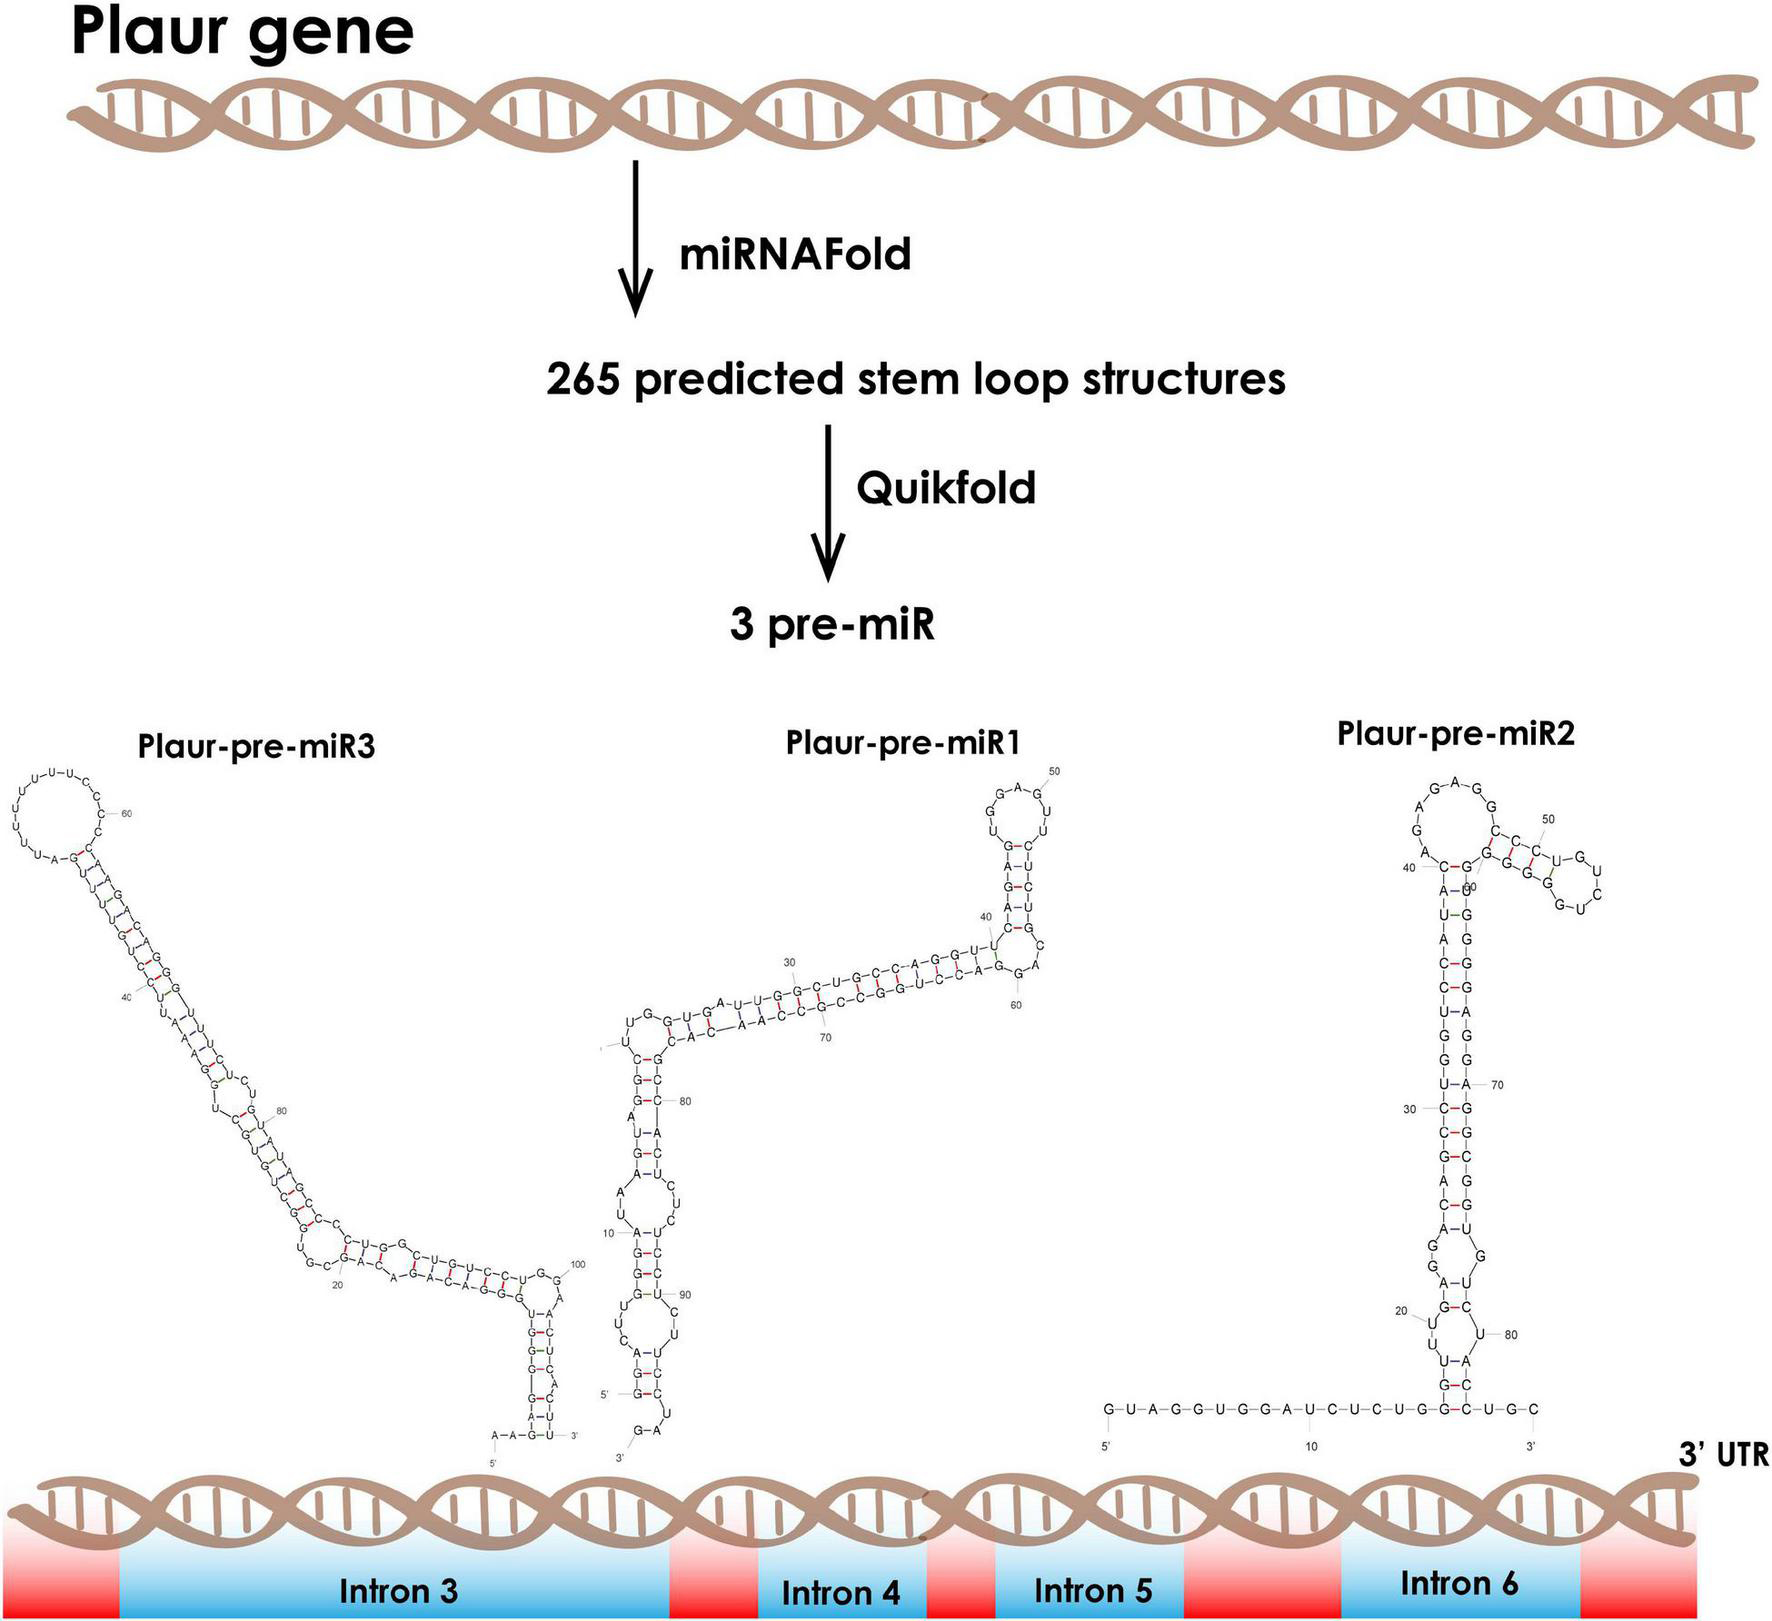
Figure 1. Computational prediction of novel small RNAs in the Mus musculus Plaur gene. We applied the miRNA Fold software to predict miRNA precursor hairpin structures located in Plaur. We then used the Quickfold service for subsequent visualization and analysis of 256 predicted stem-loops. We identified three stem-loop structures with high probability to be miRNAs according to the intronic localization, overall stability (≤ −15 kJ/mol) and consensus motifs that are critical for Drosha processing. Plaur-pre-miR1 and Plaur-pre-miR3 are located in intron 3 and Plaur-pre-miR2 is located in intron 6. Introns are highlighted in blue; exons are highlighted in red.
We focussed on Plaur-pre-miR1 since it contains three motifs that enhance Drosha processing (Lee and Shin, 2018), namely the 5′ GUG motif on the apical loop, an unpaired GHG in the downstream part of the stem and a UG motif in the base of the stem-loop structure. It is located upstream of exon 4 (Figure 2A), with free energy of formation −47.6 kJ/mol, indicating its high stability. Due to the presence of these consensus sequences critical for Drosha processing activity, we anticipated a high probability of Plaur-pre-miR1 being a substrate for Drosha processing (Figure 2B).
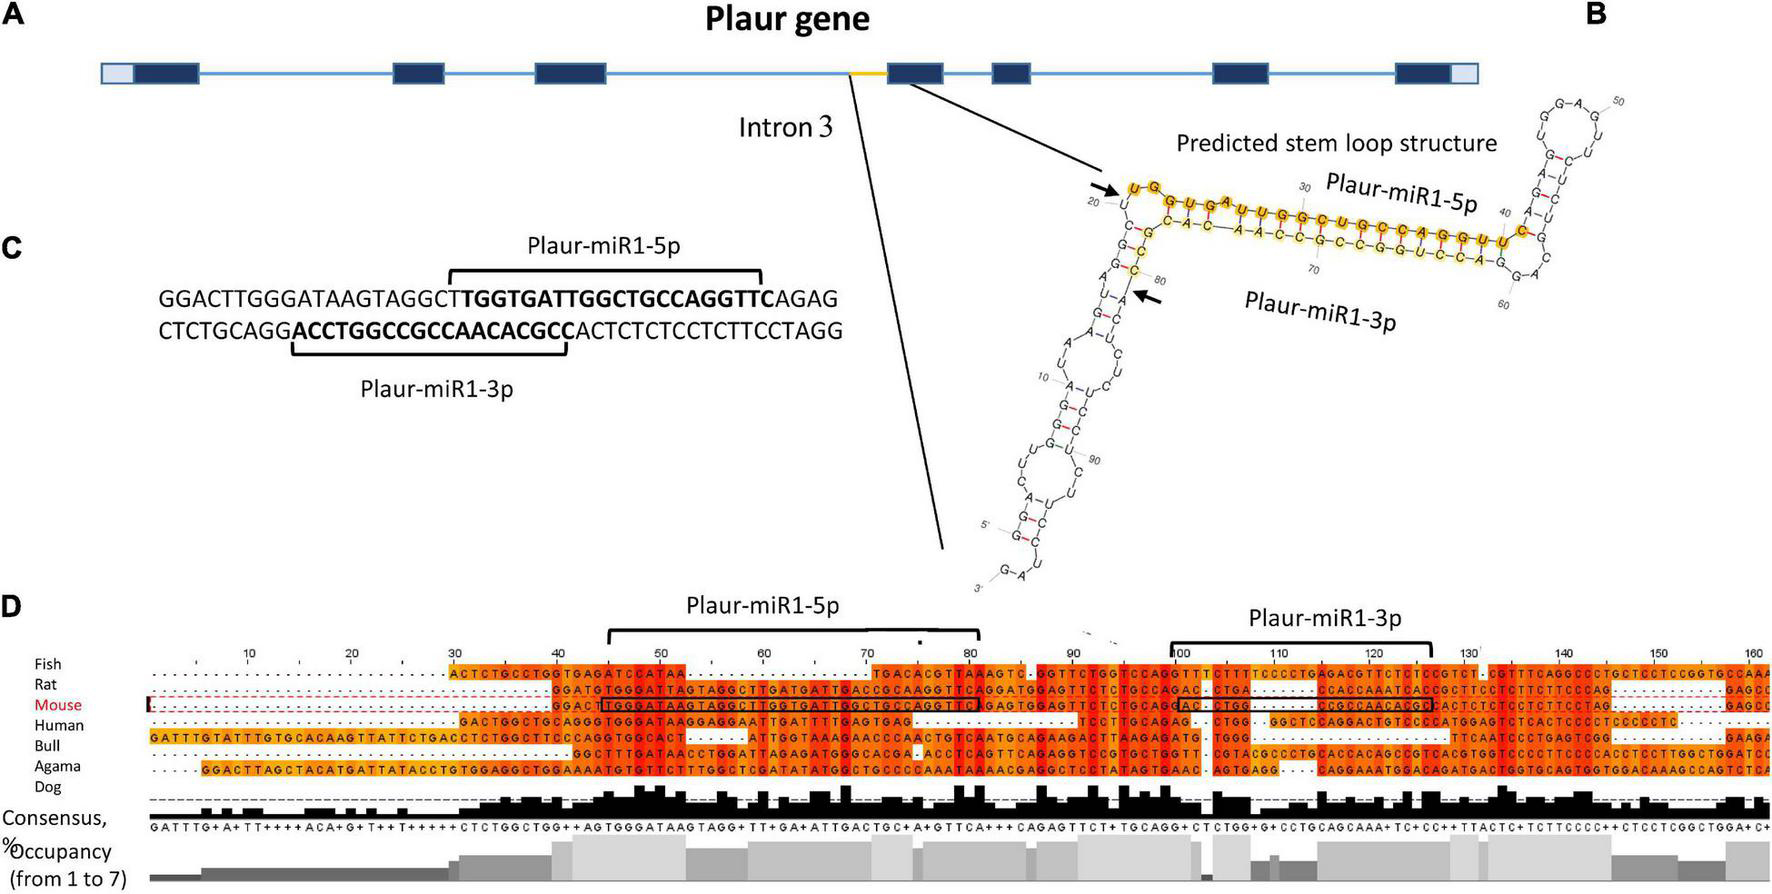
Figure 2. Identification of novel small RNAs Plaur-miR1: Plaur-miR1-3p and Plaur-miR1-5p in the Mus musculus Plaur gene. (A) Schematic overview of mouse Plaur gene, adapted from NCBI Genome browser. Untranslated regions are shown in gray. Exons and introns are indicated as blue rectangles and lines, respectively. (B) The predicted stem-loop structure of Plaur-miR1 from Plaur intron 3. Arrows indicate predicted sites of Drosha cleavage; mature miRNAs from the stem-loop, namely Plaur-miR1-5p and Plaur-miR1-3p, are highlighted in orange and yellow, respectively. (C) The duplex part of the stem-loop is indicated; sequences of mature Plaur-miR1-5p and Plaur-miR1-3p predicted by MatureBayes are shown in bold (predicted Drosha cutting). (D) The intronic region corresponding to the novel miRNA in the Plaur gene is highly conserved among vertebrates. Multiple sequence alignment with Clustal Omega (visualization Jalview 2.11.0) revealed consensus regions matched to mature Plaur-miR1-5p. Areas corresponding to the sequences of mature miRNAs are circled in frames; vertebrate species are indicated on the right. The consensus diagram shows the occurrence of one nucleotide in a given position; the occupancy diagram shows the number of nucleotides in a given position.
Hence, we conducted in silico Drosha cleavage of Plaur-pre-miR1 to locate the miRNA precursor within its sequence. We predicted Drosha cleavage sites as well as mature miRNA sequences using MatureBayes. According to the processing rules of the Drosha enzyme, the mature miRNA sequences located at the hairpin 5′ end (5p miRNAs) and predicted in silico corresponded to those predicted by the MatureBayes program (Supplementary Figure 3). However, the sequences located at the 3′ end (3p miRNAs) were mis-predicted by the MatureBayes program since they were located at the apical loop region therefore contradicting the Drosha-mediated processing mechanisms. Hence, we predicted 3p miRNA sequences following the Drosha processing rules: to protrude two nucleotides at the 3′ end of each mature miRNA (Figure 2C).
To verify Plaur-miR1-5p and Plaur-miR1-3p sequences predicted by MatureBayes and to confirm our predictions based on the Drosha processing pattern, we performed multiple sequence alignment of the Plaur region corresponding to Plaur-pre-miR1 in different vertebrate species: Bos taurus, Mus musculus, Canis lupus familiaris, Homo sapiens, Pogona vitticeps, and Poecilia latipinna (Figure 2D). Similar alignment results for Plaur-miR2 and Plaur-miR3 are presented in Supplementary Figure 8. The region corresponding to Plaur-miR1-5p showed maximum occupancy in possible miRNA seed sequence regions; together with a high consensus percentage (50–90%) the Plaur-miR1-5p sequence appeared to be conserved among all analyzed vertebrate species. There was also a TG sequence complementary to UG in RNA among all species in a highly homologous region with respect to the hairpin base. This is consistent with the literature on consensus sequences contributing to the Drosha/DGCR8 microprocessor complex function, located approximately 13 nt downstream the Drosha 5p cleavage site (Auyeung et al., 2013). In contrast, low occupancy and consensus ≤ 50% indicate that the Plaur-miR1-3p sequence was not conserved. Thereby, we assumed that Plaur-miR1-3p is a passenger strand and Plaur-miR1-5p is a novel guide strand. Although Plaur-miR1-5p showed similarity to mmu-miR-7672-3p in miRDataBase encoded within the gene PDE12 (Chr14:26390702-26390763 bp, GRCm39,—strand, according to Blast alignment), an identical miRNA for Plaur-miR1 has not yet been reported in miRbase. Overall, the high Plaur-miR1-5p sequence homology among the analyzed organisms suggests that it has been a subject to natural selection due a potentially important biological function. Assumingly, the 5p mature form performs a guiding function, while the 3p form degrades. In this regard, we have focused primarily on Plaur-miR1-5p and its targets.
Next, using the DianaTools (v84) web server, we performed computational prediction of Plaur-miR1-5p and Plaur-miR1-3p target genes. The following mature miRNA sequences were entered into the search bar: Plaur-miR1-5p 5′-UGGUGAUUGGCUGCCAGGUUC-3′ and Plaur-miR1-3p 5′-AGAACCUGGCCGCCAACA-3′. The search results are presented in Supplementary Table 2 for Plaur-miR1-5p and Supplementary Table 3 for Plaur-miR1-3p, as well as in primary screenshots of the web portal (Supplementary Figure 4B). Since miRNAs engage with various targets, 800 Plaur-miR1 targets were obtained, among which 50 targets had a binding score > 0.9 (set as the screening threshold).
We have previously shown that uPAR plays a role in neuronal cell differentiation and survival (Rysenkova et al., 2020). Moreover, we have found a correlation between high expression of uPAR and induction of neuronal migration to the outer layers of cerebral cortex, as well as Plaur function as an early response gene in the brain, a characteristic that possibly determines uPAR as a morphogen (Shmakova et al., 2021). Hence, we analyzed the possible targets obtained by DianaTools to study in further detail the role of Plaur-miR1-5p and Plaur-miR1-3p with a special focus on targets potentially involved in neuronal differentiation or surveillance, as well as the maturation of brain structures. Emx2 (empty helix homeobox 2) was the target for Plaur-miR1-5p with the highest score (0.998). Emx2 is a transcription factor that plays a pivotal role in the developing brain, determining cell fate in the embryonic central nervous system (Gulisano et al., 1996). For Plaur-miR1-3p, Mef2d (myocyte enhancement factor 2D) was a target with a highest score (0.989). Mef2d is a transcription activator that plays a key role in the regulation of neuronal apoptosis (Wang et al., 2009; Assali et al., 2019). Moreover, Mef2d also was a target for Plaur-miR1-5p with a score (0.485) as detected by DianaTools (Supplementary Figure 4C). Therefore, we analyzed Emx2 and Mef2d mRNA expression in Neuro2a control cells, Neuro2a KO-Plaur and Neuro2a-Plaur-miR1 cells (ectopic Plaur-miR1 expression) to assess the impact of Plaur-miR1-5p and Plaur-miR1-3p on their targets. Moreover, Plaur-miR1-5p and Plaur-miR1-3p have a recognition site in the Emx2 and Mef2d gene promoters (Figure 3A) and introns (Figure 3B and Supplementary Figure 4C), suggesting that Plaur-miR1 regulates the expression of these target genes at the nuclear level, including their expression induction. To examine the Plaur-miR1-5p specificity to the promoter region [600 nt upstream of the TSS, according to Ensembl genome browser]10 and target gene introns, we used intronic sequences from NCBI and aligned them with Plaur-miR1-5p and Plaur-miR1-3p via the M-Coffee tool of the T-COFFEE Multiple Sequence Alignment Server web service.

Figure 3. Alignment of Plaur-miR1-5p (A) and Plaur-miR1-3p (B) with promoter regions and introns of the predicted target genes Mef2d, Emx2, Snrnp200, and Nrip3 with the M-coffee web service T-COFFEE Multiple Sequence Alignment Server.
Detection of Plaur-miR1-5p and Plaur-miR1-3p in Mouse Neuro2a Cells and Mouse Brain
The obtained bioinformatic data on the existence of murine Plaur-miR1-5p and Plaur-miR1-3p was verified in Neuro2a cells and posterior cortex of C57BL/6J mice. Since the studied miRNAs are located in Plaur introns we used previously obtained Neuro2a cells with CRISPR/Cas9n-mediated Plaur knockout (Neuro2a KO-Plaur) (Rysenkova et al., 2018; Semina et al., 2020) as a negative control and wild type Neuro2a cells (Neuro2a WT) endogenously expressing Plaur for measuring the miRNA levels in Neuro2a cells.
Plaur-miR1-5p and Plaur-miR1-3p were detected in Neuro2a WT cells but not in Neuro2a KO-Plaur cells (Figure 4A). These findings suggest that these miRNAs are expressed in Neuro2a cells and their expression level is Plaur dependent. Moreover, transfection of Neuro2a cells with the pB1-miR plasmid to overexpress Plaur-miR1-5p and Plaur-miR1-3p increased the content of these miRNAs in Neuro2a cells (Neuro2a WT Plaur-miR1 cell in Figure 4A) and restored their expression in Neuro2a KO-Plaur cells (Neuro2a KO WT Plaur-miR1 cell in Figure 4A). Plaur mRNA expression was verified by qPCR (Figure 4B). The specificity of the observed effects (Figure 4A) was further confirmed by the lack of change in uPAR expression level in Neuro2a cells transfected with the pB1-miR plasmid for Plaur-miR1-5p and Plaur-miR1-3p overexpression (Neuro2a WT Plaur-miR1 and Neuro2a KO uPAR Plaur-miR1 cells in Figure 4B).
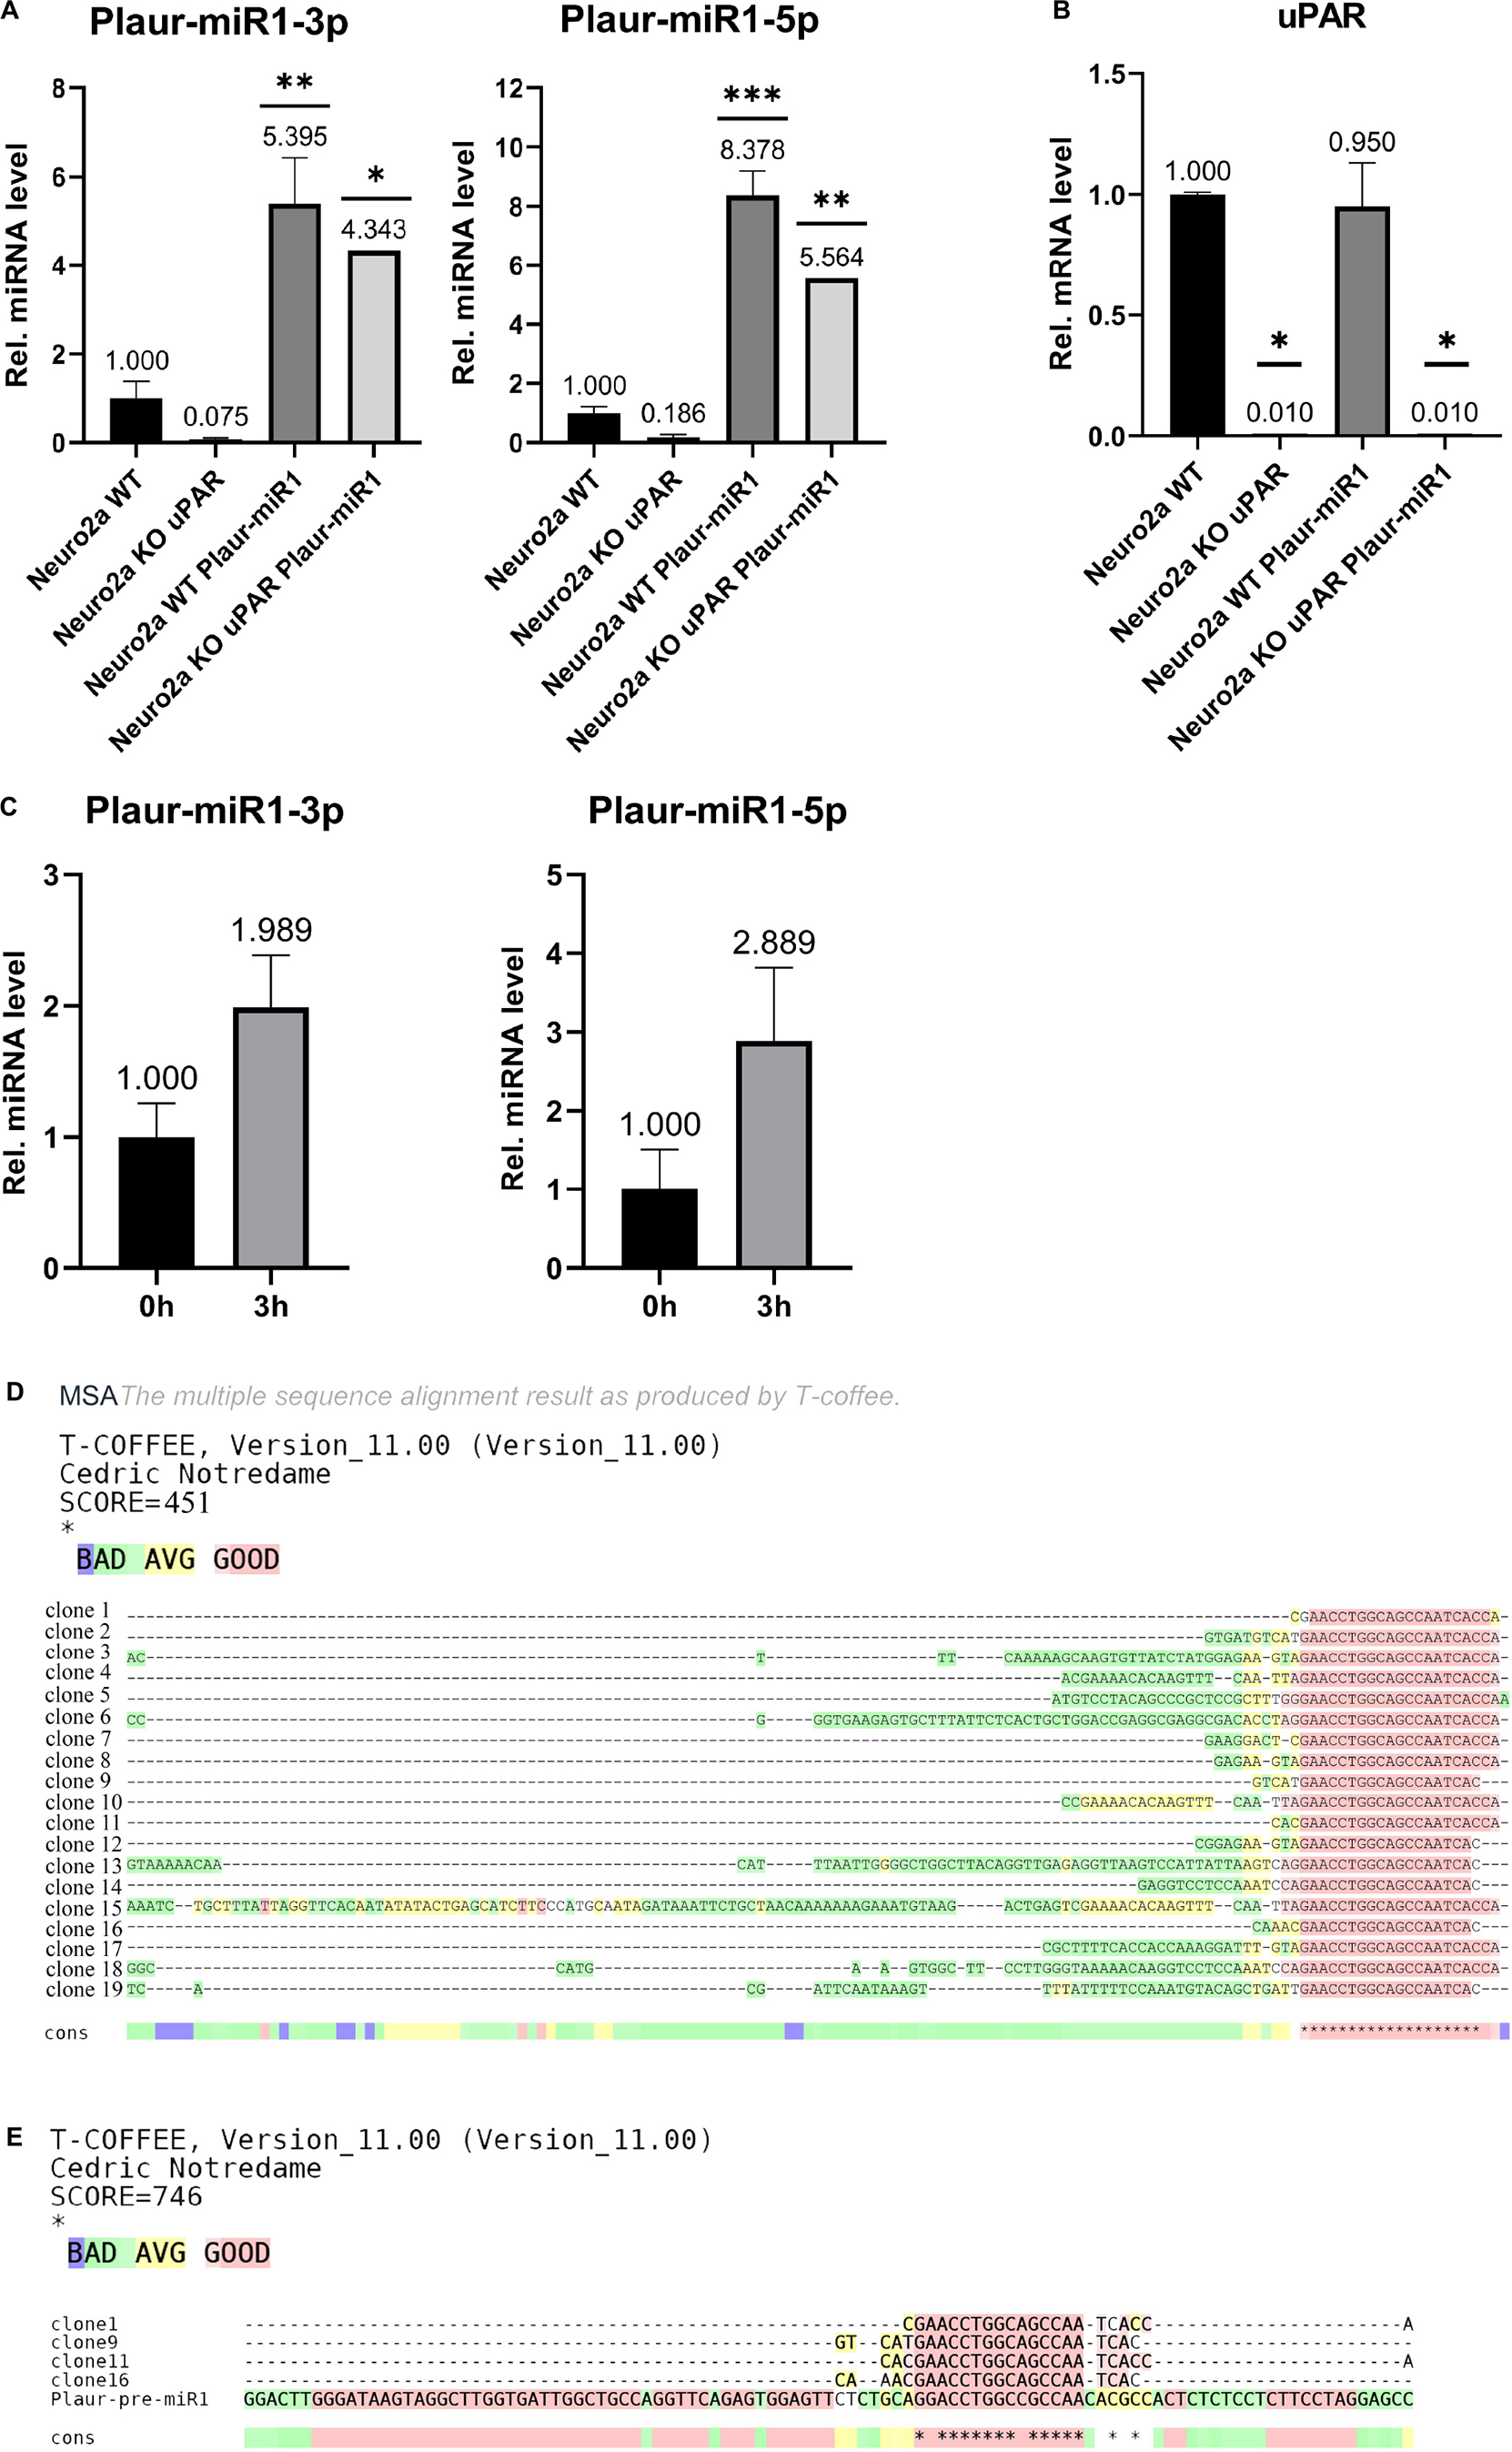
Figure 4. Analysis of Plaur-miR1-3p and Plaur-miR1-5p expression in Neuro2a cells and mouse posterior cortex. (A) qPCR of Plaur-miR1-3p and Plaur-miR1-5p expression in Neuro2a cells. The data are expressed as mean ± SEM (n = 3), normalized to Snord95 expression as a reference gene. (B) qPCR of Plaur expression in Neuro2a cells. The data are expressed as mean ± SEM (n = 3), normalized to Actb (encodes β-actin) expression as a reference gene. For (A,B), the columns are: Neuro2a WT—control Neuro2a cells; Neuro2a-KO-uPAR—uPAR-deficient Neuro2a cells; Neuro2a Plaur-miR1—Neuro2a cells with ectopic Plaur-pre-miR1 expression; Neuro2a-KO-uPAR Plaur-miR1—uPAR-deficient Neuro2a cells with ectopic Plaur-pre-miR1 expression. The data were analyzed by using analysis of variance followed by Dunnett’s multiple comparisons test using GraphPad Prism software. (C) qPCR of Plaur-miR1-5p and Plaur-miR1-3p in the posterior cortex 0 and 3 h after endogenous Plaur induction. The data are expressed as mean ± SEM (n = 4). The data were analyzed by using a one-sample t-test with GraphPad Prism software. Statistical significance in (A–C) is indicated by bars and asterisks as follows: *p < 0.05; **p < 0.01; ***p < 0.001. (D) Sequence results of 19 TA vector clones containing Plaur-miR1-5p sequences generated in (C). Four of 19 (20%) clones were 22–24 bp in length and could correspond to mature miRNA. In addition, 8 of 19 (40%) clones were 22–31 bp in length and could correspond to other RNA fragments isolated from posterior cortex small RNA fraction (Supplementary Figure 7D). (E) Clones 1, 9, 11, and 16 show the Plaur-miR1-5p sequence, demonstrated as alignment with Plaur-pre-miR1. The asterisks in (D,E) indicate that the aligned sequences match at that position.
Subsequently, we analyzed the Plaur-miR1-5p and Plaur-miR1-3p expression in the mouse brain (posterior cortex) in control conditions and 3 h after PTZ-induced Plaur expression (Shmakova et al., 2020). Surprisingly, we revealed not only Plaur-miR1-5p and Plaur-miR1-3p expression in the posterior cortex, but their expression was increased by 1.9 and 2.6 times, respectively, after PTZ treatment (Figure 4C).
qPCR using a small RNA matrix (< 200 nt) with primers for Plaur-miR1-5p yielded a single product with an approximate size of 50 nt (Supplementary Figure 9). To confirm the specificity of qPCR performed with Plaur-miR1-5p primers and to establish the nucleotide sequence of all PCR products in this reaction, we sequenced the qPCR product with the Plaur-miR1-5p primers using miRNA samples from posterior cerebral cortex. Sequencing of PCR products and their cloning into TA vector was carried out by Evrogen. The results of 19 vector clones of TA containing Plaur-miR1-5p sequences are shown in Figure 4D. Clones 1, 9, 11, and 16 demonstrate the sequence similarity in 15 out of 22 nucleotides to Plaur-miR1 (Figure 4E) and are 22–24 nt in length. All other sequences range in size from 31 to 134 nt suggesting that they may be related to other RNA fragments in small RNA fraction (< 200 nt).
The sequencing results revealed that only 20% (4 out of 19 clones) were the target products of Plaur-miR1-5p. Actually, an accurate detection of the relative Plaur-miR1-5p expression in posterior cortex may not be feasible at this stage and may be masked due to the presence of by-products. One of the possible reasons would be different levels of the Plaur and Plaur-miR1-5p induction (8.8-folds for Plaur, refer to Figure 2 in Shmakova et al. (2020); 2.9-folds for Plaur-miR1-5p (Figure 4C) in posterior cortex. Beyond that, the induction difference could stem from rapid degradation of Plaur-miR1-5p in the cytoplasm due to interaction with its targets (Agrawal et al., 2003).
Nevertheless, the qPCR product sequencing results allowed us to determine the possible targets for Plaur-miR1-5p using experimental approach. For that, we aligned the obtained sequencing products > 31 nt in length against Mus musculus genome GRCm39 using the BLAST algorithm. Two genes appeared in the BLAST search: Snrnp200 (U5 small nuclear ribonucleoprotein) and Nrip3 (nuclear receptor interacting protein 3). We then analyzed the mRNA expression levels of these genes by qPCR. Of note, both Snrnp200 and Nrip3 had rather low score values according to the prediction of targets in DianaTools: 0.48 and 0.38, respectively.
Evaluation of the Level of Predicted Target Genes of Plaur-miR1-3p and Plaur-miR1-5p
The established Plaur-dependent expression of Plaur-miR1-3p and Plaur-miR1-5p in the mouse brain prompted us to evaluate the expression of Plaur-miR1-3p and Plaur-miR1-5p target genes—Emx2 and Mef2d identified via DianaTools—as well as Snrnp200 and Nrip3, identified in qPCR products from posterior cortex samples. The target gene expression was assessed in the striatum, which, as we have previously reported, exhibited the highest increase in Plaur expression after PTZ treatment: 16 times compared with the control group, as presented in Figure 3 in the paper by Shmakova et al. (2020). Mouse striatum samples were enrolled for analysis at the baseline and 0.5, 1, 3, 6, 24, and 72 h after PTZ administration. We found a significantly increased expression of Mef2d, Emx2, and Snrnp200 mRNA (Figures 5A–C). Moreover, the induction dynamics was consistent with the Plaur expression dynamics after PTZ treatment, as shown in Figure 2 by Shmakova and co-authors (Shmakova et al., 2020). Meanwhile, the Mef2d and Snrnp200 expression remained elevated by more than 2-folds 72 h after PTZ treatment. Emx2 expression was elevated up to for 6 h after PTZ treatment, with a maximum increase of 2.97-folds after 3 h as compared with endogenous Plaur expression. Nrip3 expression remained unchanged at all the tested time points (Figure 5D).
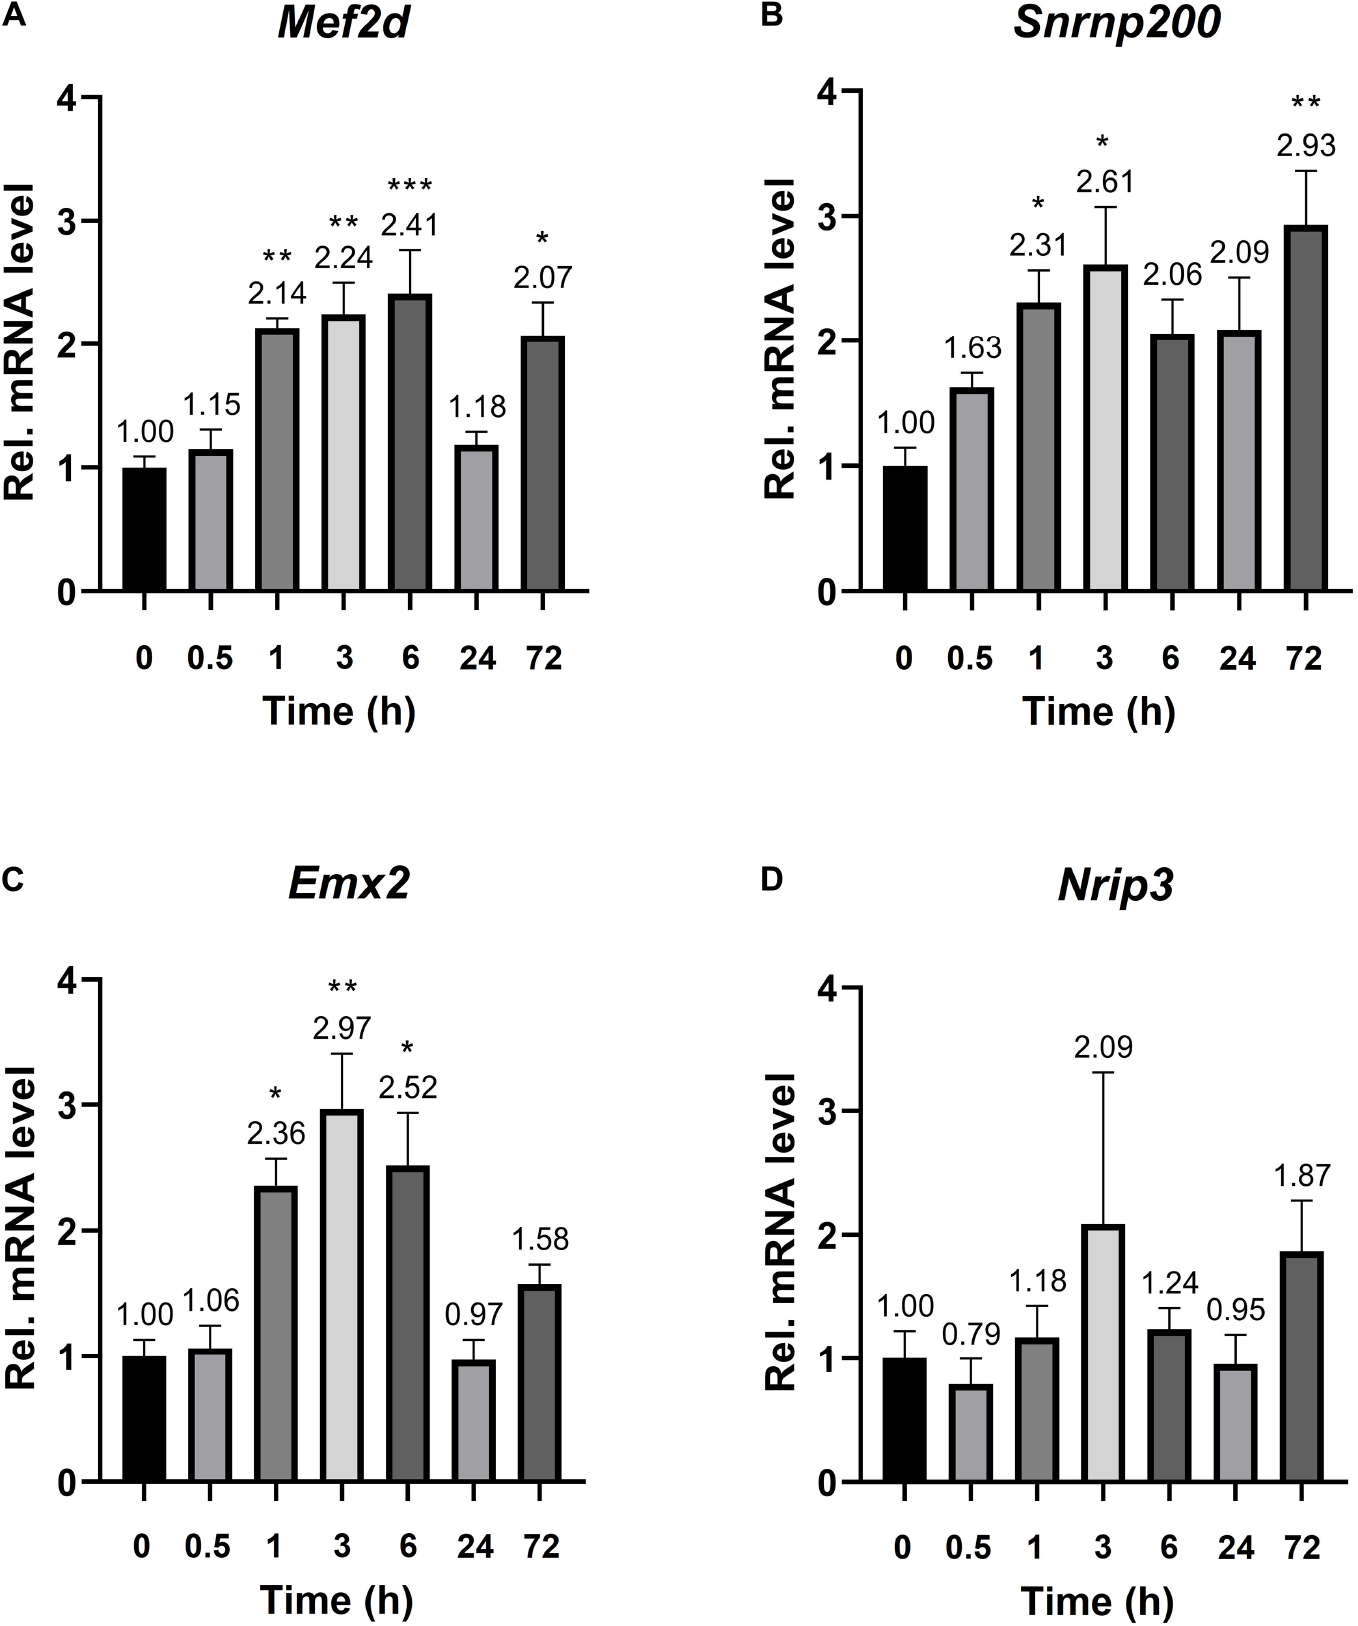
Figure 5. mRNA expression of the Plaur-miR1-3p and Plaur-miR1-5p target genes Mef2d, Snrnp200, Emx2, and Nrip3 in mouse striatum. qPCR analysis of (A) Mef2d, (B) Snrnp200, (C) Emx2 and (D) Nrip3 expression in the striatum of control mice (treated with saline, 0 h) and mice 0.5, 1, 3, 6, 24, and 72 h after endogenous Plaur induction. The data are presented as mean ± SEM (n = 4), normalized to Actb (encodes β-actin) expression as a reference gene. The data were analyzed by using analysis of variance followed by Dunnett’s multiple comparisons test with GraphPad Prism software. Statistical significance is indicated by bars and asterisks as follows: *p < 0.05; **p < 0.01; ***p < 0.001.
We also confirmed an increased expression of MEF2D protein in the mouse brain: MEF2D expression peaked 6h after PTZ administration (Figure 6A). The level of SNRNP200 and EMX2 proteins remained unchanged 3 and 6 h after PTZ administration (Figures 6B,C) suggesting that these genes may be subject to a different transcriptional and translational regulation, which requires further investigation.
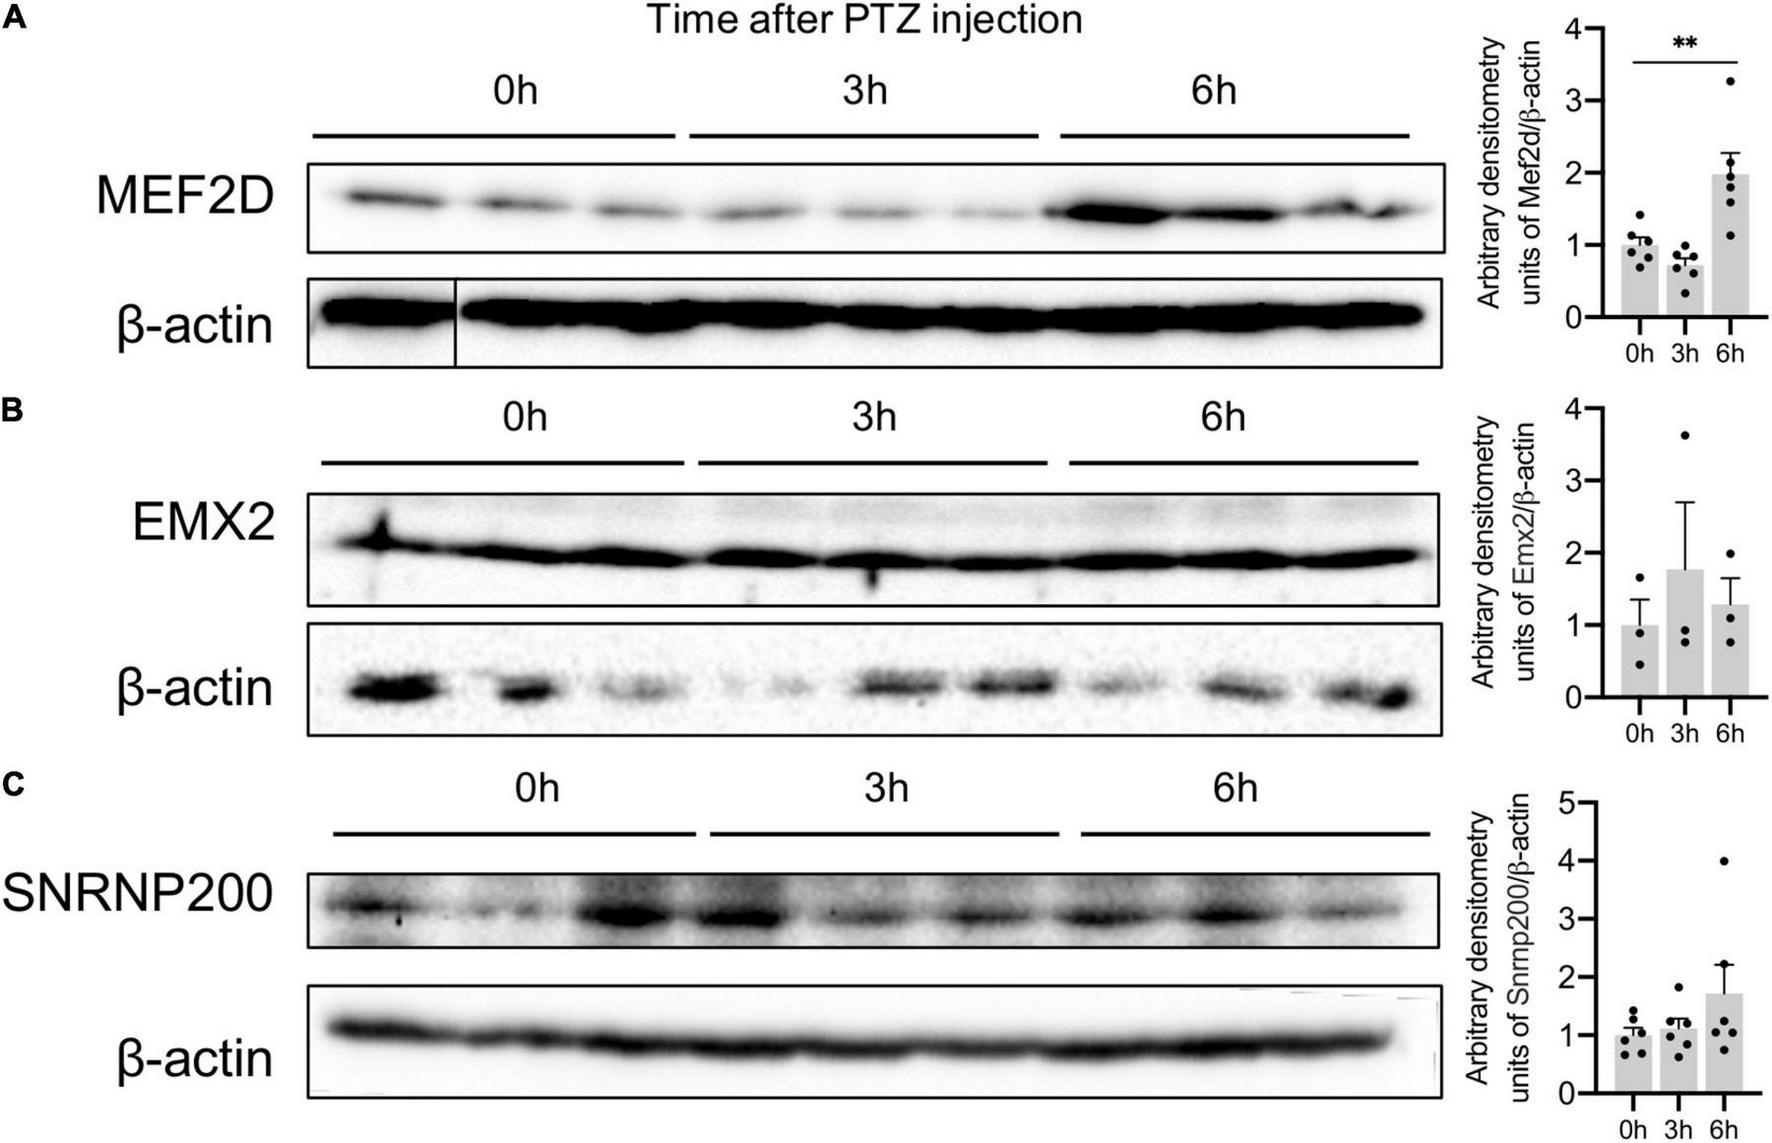
Figure 6. Protein expression of Plaur-miR1 (Plaur-miR1-3p and Plaur-miR1-5p) target genes Mef2d, Snrnp200, and Emx2 in mouse striatum. Western blot analysis of (A) MEF2D, (B) SNRNP200 and (C) EMX2 expression in striatum of control mice (treated with saline, 0 h) and of mice after 3 and 6 h induction of endogenous Plaur expression. Densitometric analyses and values of protein expression normalized to β-actin are presented as mean ± SEM (n = 3–6). The vertical line in (A) indicates where the WB lanes were cut and the lanes of the same immunoblot were placed together to allow for a direct comparison. The data were analyzed using analysis of variance followed by Dunnett’s multiple comparisons test with GraphPad Prism software. Statistical significance is indicated by bars and asterisks as follows: **p < 0.01.
To further expolore the relationship between the expression of Plaur-miR1 and its target genes, we analyzed Nrip3, Snrnp200, Emx2, and Mef2d mRNA expression in relation to Plaur and Plaur-pre-miR1 expression in Neuro2a cells using qPCR. Plaur knockout markedly reduced Mef2d and Snrnp200 expression compared with Neuro2a WT cells: 50-folds for Mef2d and 16.4-folds for Snrnp200 (Neuro2a KO cells in Figure 7). Emx2 and Nrip3 expression in the Neuro2a cell was below the detection level. Neuro2a control cells transfected with the pBl-U6-Plaur-pre-miR1 plasmid to overexpress Plaur-miR1-3p and Plaur-miR1-5p showed significantly increased Mef2d expression but not Snrnp200 (Neuro2a WT Plaur-miR1 cells in Figure 7). Moreover, the Plaur-miR1-3p and Plaur-miR1-5p expression restored Mef2d and Snrnp200 expression (in Neuro2a KO uPAR Plaur-miR1 cells in Figure 7), indicating that the expression of the Plaur-miR1-3p and Plaur-miR1-5p targets in Neuro2a cells is strongly dependent on the expression of Plaur and Plaur-miR1-3p and Plaur-miR1-5p transcribed from the Plaur gene. Thus, we have identified two small RNAs, Plaur-miR1-3p and Plaur-miR1-5p, encoded in intron 3 of the Plaur gene, as well as the Plaur-miR1-3p and Plaur-miR1-5p target genes—Emx2, Mef2d, and Snrnp200.
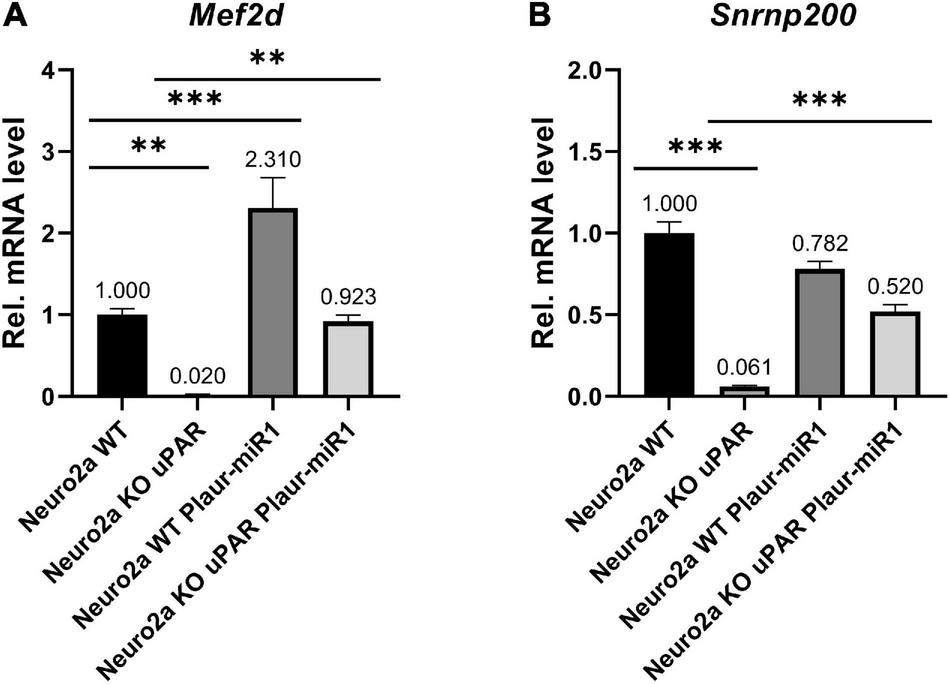
Figure 7. Plaur-miR1 (Plaur-miR1-3p and Plaur-miR1-5p) expression altered the expression of the predicted target genes Mef2d and Snrnp200 in Neuro2a cells. qPCR analysis of (A) Mef2d and (B) Snrnp200 in Neuro2a WT, Neuro2a KO uPAR, Neuro2a WT, and Neuro2a KO uPAR cells after pBl-U6-Plaur-pre-miR1 expression. The data presented as mean ± SEM (n = 3), normalized to Actb (encodes β-actin) expression as a reference gene. The data were analyzed by using analysis of variance followed by Dunnett’s multiple comparisons test with GraphPad Prism software. Statistical significance is indicated by bars and asterisks as follows: **p < 0.01; ***p < 0.001.
Direct Interaction of Putative Plaur-miR1-5p With Mef2d, Emx 3′-UTR and CDS of Snrp200
Since the sequencing of PCR products in cerebral cortex of murine brain (posterior cortex) with primers for Plaur-miR1-5p revealed Plaur-miR1-5p expression, we next addressed if there is a direct interaction between Plaur-miR1-5p and its target genes Mef2d, Snrnp200 and Emx2. Using DianaTools (v84) web server we predicted microRNA response elements (MRE) for the Mef2d and Emx2 genes in their 3′-UTRs and for the Snrnp200 gene in its CDS sequence (Supplementary Figure 11). We cloned 3′-UTR for Emx2, Mef2d and CDS for Snrnp200 into a pGL3-reporter vector downstream of Renilla luciferase ORF and co-transfected Neuro2A cells with these constructs and pBL-Plaur-pre-miR1 plasmid; pBl-control vector was used as a control (Figure 8). We found that co-transfection of PGL3 vector containing Mef2d 3′-UTR sequence (positions 3376-3499 in NM_001310587.1) with pBL-Plaur-pre-miR1 resulted in a significant ∼1.4-fold increase in luciferase activity (Figure 8, p = 0.0178) compared to co-transfection with pBl-control vector. Co-expression of pBL-Plaur-pre-miR1 plasmid with pGL3-reporter vectors containing 3′-UTR sequence of Mef2d outside the mentioned region (positions 5140-5276 in NM_001310587.1), 3′-UTR sequence of Emx2 (positions 2191-2281 in NM_010132.2) or CDS sequence of Snrnp200 (positions 3037-3114 in NM_177214.5) revealed no significant change in luciferase activity compared with pBl-control vector (Figure 8). These results confirmed that Plaur-miR1-5p can specifically increase the Mef2d expression through its 3′-UTR site.

Figure 8. Results of the luciferase reporter assay for the confirmation of specificity of Plaur-miR1-5p effect on its predicted targets. Neuro2a cells were co-transfected with pBl-U6-Plaur-pre-miR1 and pGL3 vector coding 3-UTR or CDS sequences. Empty vectors pBl-U6 and pGL3 were used as controls. Data were normalized by luciferase activity in Neuro2a cells co-transfected with pBl-U6-Plaur-pre-miR1 and pGL3 vectors. The data are presented as mean ± SEM (n = 3) and compared using two-way ANOVA followed by Šídák’s multiple comparisons test with GraphPad Prism software. Statistical significance is indicated by bars and asterisks as follows: *p < 0.05.
Discussion
uPAR is a multifunctional, GPI-anchored protein that regulates important processes such as gene expression, cell proliferation, adhesion, migration, invasion and development. Since uPAR lacks membrane and intracellular domains but is anchored to the outer plasma membrane leaflet, it is capable of lateral interactions with other receptors modulating their intracellular signaling pathways. More than 30 signaling proteins have been shown to interact directly with uPAR as lateral partners (Eden et al., 2011). The fact that uPAR interacts with G protein-coupled receptors, receptor tyrosine kinases and integrins implies that the actual number of components constituting the uPAR interactome is exceptionally high. Previous studies revealed cognitive disorders and defects in the development of GABAergic interneurons in uPAR null mice (Powell et al., 2003). uPAR overexpression markedly stimulated the radial neuronal migration to the outer layers of differentiating cortex (Shmakova et al., 2021), which implies uPAR participation in neocortex embryonic development.
Emerging evidence indicates that uPAR is involved in various physiological and pathological conditions in the nervous system, but the known molecular mechanisms of uPAR action do not explain the phenomena. For example, polymorphisms of Plaur and the uPAR ligand sushi repeat containing protein X-linked 2 (encoded by the SRPX2 gene) correlate with human diseases such as epilepsy, autism, multiple sclerosis, Alzheimer’s disease and brain tumors. In addition, we have recently demonstrated that Plaur is an early response gene in the mouse brain, which is activated upon PTZ treatment (Shmakova et al., 2020). These data change the conceptual landscape model of uPAR protein and Plaur gene functions and expand our knowledge on their role in health and disease. uPAR unexpectedly became a meaningful receptor in the central nervous system, which has opened new perspectives for understanding the embryonic development, normal functioning and pathological changes in the central nervous system. Recent studies have unveiled the myriad roles of miRNAs, highlighting the biological significance of these previously “overlooked” RNA species. In this regard, we hypothesized that previously unknown miRNAs located in the Plaur intronic sequences may determine numerous effects that cannot be otherwise explained by the function of uPAR protein. Indirect evidence supporting this hypothesis resides in the fact that Plaur knockout decreases the Ntrk3 mRNA expression (encodes TrkC) in mouse Neuro2a cells (Rysenkova et al., 2018).
We conducted a Drosha processing bioinformatic search and found hairpins previously unidentified in the Plaur gene structure. We named these pre-miRs Plaur-pre-miR1 (located in intron 3), Plaur-pre-miR2 (located in intron 3) and Plaur-pre-miR3 (located in intron 6) (Figure 1 and Table 1). We focussed on the first hairpin, Plaur-pre-miR1 and proved that the mature miRNAs Plaur-miR1-3p and Plaur-miR1-5p are expressed in Neuro2a cells and mouse brain. Further, we enrolled cells with complete Plaur knockout—which we had described previously (Rysenkova et al., 2018)—as well as the brain samples with endogenous Plaur induction (Shmakova et al., 2020), obtained as a result of PTZ treatment. The maximal Plaur induction was detected in these brain samples by 3 h after PTZ treatment. Here, we demonstrate that Plaur-miR1-3p and Plaur-miR1-5p expression is subjected to Plaur expression regulation: Plaur-miR1-3p and Plaur-miR1-5p expression is downregulated upon Plaur knockout, while Plaur overexpression results in elevated Plaur-miR1-3p and Plaur-miR1-5p expression. Figure 4 demonstrates that Plaur-miR1-5p expression was up to 1.6-folds higher than the expression of Plaur-miR1-3p, assumingly reflecting increased stability of Plaur-miR1-5p in Neuro2a cells (Figures 4A,B).
We used two approaches to identify potential Plaur-miR1 target genes. Based on the collected data, we selected two targets via DianaTools. For Plaur-miR1-5p, we enrolled Emx2, a transcription factor that plays an important role in the embryonic brain, to specify cell fates in the developing central nervous system (Bishop et al., 2002; Supplementary Table 2). For Plaur-miR1-3p, we selected Mef2d, a transcriptional activator that plays a critical role in neuronal apoptosis (Supplementary Table 3; Wang et al., 2009). In addition to the DianaTools predictive algorithm, we used an original approach for experimental tissue-specific detection of potential Plaur-miR1 target genes by analyzing the sequences obtained from sequencing PCR products of brain samples with primers for Plaur-miR1-5p (Figures 4C,D). We believe that this approach is more reliable than DianaTools. DianaTools is based on the algorithm, which allows target prediction with the highest score. However, this tool has disadvantages, specifically the lack of extensive experimentally validated miRNA–gene interaction datasets, forcing most available implementations to rely solely on in silico predicted interactions (Vlachos et al., 2015). As previously mentioned, even the most advanced miRNA target prediction algorithms exhibit high false-positive rates (Vlachos and Hatzigeorgiou, 2013). Our study is in agreement with this previously published data: among Plaur-miR1-5p targets found with the sequence assistant Snrnp200 (U5 small nuclear ribonucleoprotein) and Nrip3 (nuclear receptor interacting protein 3) had low scores (0.48 and 0.38, respectively), suggesting these targets would be dismissed when using DianaTools alone. Surprisingly, the expression dynamics analysis of the Plaur-miR1 targets in the mouse brain (striatum) after Plaur induction revealed a direct correlation between an increase in Plaur expression and elevated Mef2d, Emx2, and Snrnp200 gene expression (Figures 5A–C). The elevated MEF2D expression was verified at the protein level (Figure 6A). Nrip3 mRNA expression was not significantly changed (Figure 5D).
Therefore, continuing to elaborate on the hypothesis that in addition to the classical mechanism of miRNA action relying on the suppression of target genes and occurring when a miRNA binds to the 3′-untranslated region of the target gene, there exist an activating miRNA function implemented via miRNA interaction with 3′-UTR. Evidence supporting this concept has been published by Chu and co-authors in NAR (Chu et al., 2020). In addition, the underlying mechanism that involves miRNA binding proteins Argonaute 2 (AGO-2) and Fragile-X-metal retardation related protein 1 (FXR1) has been recently (April 2022) proposed by Jame-Chenarboo and co-authors (Faezeh Jame-Chenarboo, Hoi Hei Ng, Dawn Macdonald, Lara K. Mahal. (2022). miRNA upregulate protein and glycan expression via direct activation in proliferating cells. bioRxiv 2022.04.01.486772, preprint).11 Therefore, the accumulated data warrant further investigation into canonical and non-canonical miRNA action.
We verified the predicted Plaur-miR1-5p binding sites in the promoter region of the selected genes (Figure 3A), as well as in the intron region putatively located in the distal enhancer regions (Figure 3B; Broughton et al., 2016). Our hypothesis has been confirmed experimentally only for Mef2d and Snrnp200 in Neuro2a cells. Specifically, we altered the Plaur and Plaur-miR1 expression in these cells and established the expression dependence of the target genes on Plaur and Plaur-miR1 (Figure 7). Moreover, using Luciferase reporter assay we confirmed the direct activating function of Plaur-miR1 on the Mef2d expression via 3′-UTR interaction (Figure 8). Since Nrip3 and Emx2 expression was not detected in Neuro2a cells, the Plaur-miR1 effect on these genes was impossible to evaluate. These data suggest that the regulation of Plaur-miR1 target mRNAs occurs at the DNA level resulting in the alterations in mRNA expression. Herein, the identified targets play an important role in physiology of the nervous system in normal and pathological conditions. Emx2 is a transcription factor that plays an essential role in specifying cell fates in the embryonic central nervous system. Emx2 controls several biological parameters of cortical neuroblast proliferation and subsequent cell migration of postmitotic neurons in the mouse brain (Gulisano et al., 1996), as well as imparts positional identity to cortical cells in the developing neocortex (Bishop et al., 2002). Our current findings are in accordance with the previously published papers revealing that high Plaur expression stimulates neuronal migration to the outer layers of mouse neocortex during embryogenesis (Shmakova et al., 2021), as well as the absence of GABA neurons in Plaur-knockout mice (Powell et al., 2003). The most plausible explanation for these data is that uPAR functions as a morphogenic factor in the brain, realizing its action via Plaur-miR1-5p and its target Emx2 (Gulisano et al., 1996).
Another target gene of Plaur-miR1, Mef2d, encodes a developmental protein that regulates large-scale gene expression programs necessary in embryogenesis and tissue architecture maintenance, including the brain, and contributes to the regulation of neurogenesis, neuronal apoptosis and differentiation (Pon and Marra, 2016; Assali et al., 2019). Mef2d gene disruption could be a risk factor for multiple neurodevelopmental disorders and mental illnesses, such as autism spectrum disorders, intellectual disability and schizophrenia (Assali et al., 2019). Considering that Plaur polymorphisms in humans are associated with cognitive disorders (Campbell et al., 2008) in mice with behavioral dysfunction and epilepsy (Powell et al., 2003), apoptosis of neuronal cells in vitro (Rysenkova et al., 2018), as well as Plaur gene knockout leads to impaired brain formation (Eagleson et al., 2011), we hypothesize that these “protective” uPAR effects on brain neurons may be implemented via Plaur-miR1 and its target Mef2d.
In conclusion, we identified the novel Plaur-miR1 as a functional miRNA of Plaur intron 3. Furthermore, we revealed that the Plaur-miR1 expression specifically controls the MEF2D expression at the mRNA and protein levels. Taking into account our previously published data and the present results we suggest a novel role for Plaur as a morphogenetic factor in brain development and a marker of brain disorders.
Data Availability Statement
The datasets presented in this study can be found in online repositories. The names of the repository/repositories and accession number(s) can be found in the article/Supplementary Material.
Author Contributions
KDR and EVS conceived and designed the experiments. KDR, EVS, PSK, TRB, EMS, AAS, DYT, OII, KVA, and MNK carried out the experiments, analyzed the data, and performed the statistical analyses. KET, KDR, and MNK performed the bioinformatics screening. KDR, EVS, and KAR contributed to the manuscript writing. MEZ, VAT, and EVS made a substantial contribution to the conception of the manuscript. All authors read and approved the final version of the manuscript.
Funding
This research was supported by the Russian Science Foundation, Project No. 19-75-30007 “Fundamental issues of regenerative medicine: Regulation of human tissue renewal and repair,” and by the Ministry of Science and Higher Education of the Russian Federation, Project No. 075-15-2020-801. Isolation of mRNA and miRNA from the mouse brain was carried out with the support of Project No. 075-15-2020-801. All other methods and research were supported by Project No. 19-75-30007.
Conflict of Interest
The authors declare that the research was conducted in the absence of any commercial or financial relationships that could be construed as a potential conflict of interest.
Publisher’s Note
All claims expressed in this article are solely those of the authors and do not necessarily represent those of their affiliated organizations, or those of the publisher, the editors and the reviewers. Any product that may be evaluated in this article, or claim that may be made by its manufacturer, is not guaranteed or endorsed by the publisher.
Supplementary Material
The Supplementary Material for this article can be found online at: https://www.frontiersin.org/articles/10.3389/fnmol.2022.865858/full#supplementary-material
Footnotes
- ^ https://www.mirbase.org/
- ^ https://services.healthtech.dtu.dk/service.php?Promoter-2
- ^ http://lifefaculty.biu.ac.il/gershon-tamar/index.php/element-description
- ^ https://evryrna.ibisc.univ-evry.fr/miRNAFold
- ^ http://unafold.rna.albany.edu/?q=DINAMelt/Quickfold
- ^ http://diana.imis.athena-innovation.gr/DianaTools/index.php?r=mrmicrot/index
- ^ www.ncbi.nlm.nih.gov/tools/primer-blast/
- ^ https://eu.idtdna.com/pages/tools/oligoanalyzer/
- ^ https://evryrna.ibisc.univ-evry.fr/miRNAFold
- ^ https://www.ensembl.org
- ^ https://doi.org/10.1101/2022.04.01.486772
References
Agrawal, N., Dasaradhi, P. V. N., Mohmmed, A., Malhotra, P., Bhatnagar, R. K., Mukherjee, S. K., et al. (2003). RNA interference: biology, mechanism, and applications. Microbiol. Mol. Biol. Rev. 67, 657–685. doi: 10.1128/MMBR.67.4.657-685.2003
Assali, A., Harrington, A. J., and Cowan, C. W. (2019). Emerging roles for MEF2 in brain development and mental disorders. Curr. Opin. Neurobiol. 59, 49–58. doi: 10.1016/j.conb.2019.04.008
Auyeung, V. C., Ulitsky, I., McGeary, S. E., and Bartel, D. P. (2013). Beyond secondary structure: primary-sequence determinants license pri-miRNA hairpins for processing. Cell 152, 844–858. doi: 10.1016/j.cell.2013.01.031
Bishop, K. M., Rubenstein, J. L. R., and O’Leary, D. D. M. (2002). Distinct actions of Emx1. Emx2, and Pax6 in regulating the specification of areas in the developing neocortex. J. Neurosci. 22, 7627–7638. doi: 10.1523/JNEUROSCI.22-17-07627.2002
Broughton, J. P., Lovci, M. T., Huang, J. L., Yeo, G. W., and Pasquinelli, A. E. (2016). Pairing beyond the Seed Supports MicroRNA Targeting Specificity. Mol. Cell 64, 320–333. doi: 10.1016/j.molcel.2016.09.004
Bruneau, N., and Szepetowski, P. (2011). The role of the urokinase receptor in epilepsy, in disorders of language, cognition, communication and behavior, and in the central nervous system. Curr. Pharm. Des. 17, 1914–1923. doi: 10.2174/138161211796718198
Campbell, D. B., Li, C., Sutcliffe, J. S., Persico, A. M., and Levitt, P. (2008). Genetic evidence implicating multiple genes in the MET receptor tyrosine kinase pathway in autism spectrum disorder. Autism Res. 1, 159–168. doi: 10.1002/aur.27
Chu, Y., Kilikevicius, A., Liu, J., Johnson, K. C., Yokota, S., and Corey, D. R. (2020). Argonaute binding within 3′-untranslated regions poorly predicts gene repression. Nucleic Acids Res. 48, 7439–7453. doi: 10.1093/nar/gkaa478
Dokanehiifard, S., Soltani, B. M., Parsi, S., Hosseini, F., Javan, M., and Mowla, S. J. (2015). Experimental verification of a conserved intronic microRNA located in the human TrkC gene with a cell type-dependent apoptotic function. Cell. Mol. Life Sci. 72, 2613–2625. doi: 10.1007/s00018-015-1868-4
Dokanehiifard, S., Yasari, A., Najafi, H., Jafarzadeh, M., Nikkhah, M., Mowla, S. J., et al. (2017). A novel microRNA located in the TrkC gene regulates the Wntsignaling pathway and is differentially expressed in colorectal cancer specimens. J. Biol. Chem. 292, 7566–7577. doi: 10.1074/jbc.M116.760710
Eagleson, K. L., Campbell, D. B., Thompson, B. L., Bergman, M. Y., and Levitt, P. (2011). The autism risk genes MET and PLAUR differentially impact cortical development. Autism Res. 4, 68–83. doi: 10.1002/aur.172
Eden, G., Archinti, M., Furlan, F., Murphy, R., and Degryse, B. (2011). The urokinase receptor interactome. Curr. Pharm. Des. 17, 1874–1889. doi: 10.2174/138161211796718215
Gkirtzou, K., Tsamardinos, I., Tsakalides, P., and Poirazi, P. (2010). MatureBayes: a probabilistic algorithm for identifying the mature miRNA within novel precursors. PLoS One 5:e11843. doi: 10.1371/journal.pone.0011843
Gulisano, M., Broccoli, V., Pardini, C., and Boncinelli, E. (1996). Emx1 and Emx2 show different patterns of expression during proliferation and differentiation of the developing cerebral cortex in the mouse. Eur. J. Neurosci. 8, 1037–1050. doi: 10.1111/j.1460-9568.1996.tb01590.x
Kjaergaard, M., Hansen, L. V., Jacobsen, B., Gardsvoll, H., and Ploug, M. (2008). Structure and ligand interactions of the urokinase receptor (uPAR). Front. Biosci. 13:5441–5461. doi: 10.2741/3092
Klimovich, P. S., Semina, E. V., Karagyaur, M. N., Rysenkova, K. D., Sysoeva, V. Y., Mironov, N. A., et al. (2020). Urokinase receptor regulates nerve regeneration through its interaction with α5β1-integrin. Biomed. Pharmacother. 125:110008. doi: 10.1016/j.biopha.2020.110008
Lee, D., and Shin, C. (2018). Emerging roles of DROSHA beyond primary microRNA processing. RNA Biol. 15, 186–193. doi: 10.1080/15476286.2017.1405210
Mahmood, N., Mihalcioiu, C., and Rabbani, S. A. (2018). Multifaceted Role of the Urokinase-Type Plasminogen Activator (uPA) and Its Receptor (uPAR): diagnostic. Prognos, Therap. Appl. Front. Oncol. 8:24. doi: 10.3389/fonc.2018.00024
Ørom, U. A., Nielsen, F. C., and Lund, A. H. (2008). MicroRNA-10a binds the 5′UTR of ribosomal protein mRNAs and enhances their translation. Mol. Cell 30, 460–471. doi: 10.1016/j.molcel.2008.05.001
Paraskevopoulou, M. D., Georgakilas, G., Kostoulas, N., Vlachos, I. S., Vergoulis, T., Reczko, M., et al. (2013). DIANA-microT web server v5.0: service integration into miRNA functional analysis workflows. Nucleic Acids Res. 41, W169–W173. doi: 10.1093/nar/gkt393
Parfenova, E. V., Plekhanova, O. S., Men’shikov, M. I., Stepanova, V. V., and Tkachuk, V. A. (2009). [Regulation of growth and remodeling of blood vessels: the unique role of urokinase]. Ross. Fiziol. zhurnalIm. I.M. Sechenova 95, 442–464.
Place, R. F., Li, L.-C., Pookot, D., Noonan, E. J., and Dahiya, R. (2008). MicroRNA-373 induces expression of genes with complementary promoter sequences. Proc. Natl. Acad. Sci U. S A 105, 1608–1613. doi: 10.1073/pnas.0707594105
Pon, J. R., and Marra, M. A. (2016). MEF2 transcription factors: developmental regulators and emerging cancer genes. Oncotarget 7, 2297–2312. doi: 10.18632/oncotarget.6223
Powell, E. M., Campbell, D. B., Stanwood, G. D., Davis, C., Noebels, J. L., and Levitt, P. (2003). Genetic disruption of cortical interneuron development causes region- and GABA cell type-specific deficits, epilepsy, and behavioral dysfunction. J. Neurosci. 23, 622–631. doi: 10.1523/JNEUROSCI.23-02-00622.2003
Reczko, M., Maragkakis, M., Alexiou, P., Grosse, I., and Hatzigeorgiou, A. G. (2012). Functional microRNA targets in protein coding sequences. Bioinformatics 28, 771–776. doi: 10.1093/bioinformatics/bts043
Rysenkova, K. D., Klimovich, P. S., Shmakova, A. A., Karagyaur, M. N., Ivanova, K. A., Aleksandrushkina, N. A., et al. (2020). Urokinase receptor deficiency results in EGFR-mediated failure to transmit signals for cell survival and neurite formation in mouse neuroblastoma cells. Cell Signal 75:109741. doi: 10.1016/j.cellsig.2020.109741
Rysenkova, K. D., Semina, E. V., Karagyaur, M. N., Shmakova, A. A., Dyikanov, D. T., Vasiluev, P. A., et al. (2018). CRISPR/Cas9 nickase mediated targeting of urokinase receptor gene inhibits neuroblastoma cell proliferation. Oncotarget 9, 29414–29430. doi: 10.18632/oncotarget.25647
Semina, E. V., Rubina, K. A., Shmakova, A. A., Rysenkova, K. D., Klimovich, P. S., Aleksanrushkina, N. A., et al. (2020). Downregulation of uPAR promotes urokinase translocation into the nucleus and epithelial to mesenchymal transition in neuroblastoma. J. Cell. Physiol. 235, 6268–6286. doi: 10.1002/jcp.29555
Semina, E. V., Rubina, K. A., Sysoeva, V. Y., Makarevich, P. I., Parfyonova, Y. V., and Tkachuk, V. A. (2016). The role of urokinase in vascular cell migration and in regulation of growth and branching of capillaries. Cell tissue biol. 10, 37–46. doi: 10.1134/S1990519X16010089
Shmakova, A. A., Balatskiy, A. V., Kulebyakina, M. A., Schaub, T., Karagyaur, M. N., Kulebyakin, K. Y., et al. (2021). Urokinase Receptor uPAR Overexpression in Mouse Brain Stimulates the Migration of Neurons into the Cortex during Embryogenesis. Russ. J. Dev. Biol. 52, 53–63. doi: 10.1134/S1062360421010069
Shmakova, A. A., Rubina, K. A., Rysenkova, K. D., Gruzdeva, A. M., Ivashkina, O. I., Anokhin, K. V., et al. (2020). Urokinase receptor and tissue plasminogen activator as immediate-early genes in pentylenetetrazole-induced seizures in the mouse brain. Eur. J. Neurosci. 51, 1559–1572. doi: 10.1111/ejn.14584
Sloutskin, A., Danino, Y. M., Orenstein, Y., Zehavi, Y., Doniger, T., Shamir, R., et al. (2015). ElemeNT: a computational tool for detecting core promoter elements. Transcription 6, 41–50. doi: 10.1080/21541264.2015.1067286
Tav, C., Tempel, S., Poligny, L., and Tahi, F. (2016). miRNAFold: a web server for fast miRNA precursor prediction in genomes. Nucleic Acids Res. 44, W181–W184. doi: 10.1093/nar/gkw459
Tkachuk, V. A., Parfyonova, Y. V., Plekhanova, O. S., Stepanova, V. V., Menshikov, M. Y., Semina, E. V., et al. (2019). [Fibrinolytics: from the thrombolysis to the processes of blood vessels growth and remodeling, neurogenesis, carcinogenesis and fibrosis]. Ter. Arkh. 91, 4–9. doi: 10.26442/00403660.2019.09.000411
Tkachuk, V. A., Plekhanova, O. S., and Parfyonova, Y. V. (2009). Regulation of arterial remodeling and angiogenesis by urokinase-type plasminogen activator. Can. J. Physiol. Pharmacol. 87, 231–251. doi: 10.1139/Y08-113
Vlachos, I. S., and Hatzigeorgiou, A. G. (2013). Online resources for miRNA analysis. Clin. Biochem. 46, 879–900. doi: 10.1016/j.clinbiochem.2013.03.006
Vlachos, I. S., Zagganas, K., Paraskevopoulou, M. D., Georgakilas, G., Karagkouni, D., Vergoulis, T., et al. (2015). DIANA-miRPath v3.0: deciphering microRNA function with experimental support. Nucleic Acids Res. 43, W460–W466. doi: 10.1093/nar/gkv403
Wang, X., She, H., and Mao, Z. (2009). Phosphorylation of neuronal survival factor MEF2D by glycogen synthase kinase 3 beta in neuronal apoptosis. J. Biol. Chem. 284, 32619–32626. doi: 10.1074/jbc.M109.067785
Xue, C., Li, F., He, T., Liu, G.-P., Li, Y., and Zhang, X. (2005). Classification of real and pseudo microRNA precursors using local structure-sequence features and support vector machine. BMC Bioinform. 6:310. doi: 10.1186/1471-2105-6-310
Keywords: urokinase receptor, uPAR, Plaur, Plaur-miR1-5p, Mef2d, neuroblastoma, Plaur-miR1-3p, Neuro2A
Citation: Rysenkova KD, Troyanovskiy KE, Klimovich PS, Bulyakova TR, Shelomentseva EM, Shmakova AA, Tanygina DY, Ivashkina OI, Anokhin KV, Karagyaur MN, Zvereva MI, Rubina KA, Tkachuk VA and Semina EV (2022) Identification of a Novel Small RNA Encoded in the Mouse Urokinase Receptor uPAR Gene (Plaur) and Its Molecular Target Mef2d. Front. Mol. Neurosci. 15:865858. doi: 10.3389/fnmol.2022.865858
Received: 30 January 2022; Accepted: 16 May 2022;
Published: 06 July 2022.
Edited by:
Cristian A. Droppelmann, Western University, CanadaReviewed by:
Asla Pitkänen, University of Eastern Finland, FinlandBeena Pillai, Institute of Genomics and Integrative Biology, India
Copyright © 2022 Rysenkova, Troyanovskiy, Klimovich, Bulyakova, Shelomentseva, Shmakova, Tanygina, Ivashkina, Anokhin, Karagyaur, Zvereva, Rubina, Tkachuk and Semina. This is an open-access article distributed under the terms of the Creative Commons Attribution License (CC BY). The use, distribution or reproduction in other forums is permitted, provided the original author(s) and the copyright owner(s) are credited and that the original publication in this journal is cited, in accordance with accepted academic practice. No use, distribution or reproduction is permitted which does not comply with these terms.
*Correspondence: Karina D. Rysenkova, a2FyaW5hX3J5QG1haWwucnU=; Ekaterina V. Semina, ZS1zZW1pbmFAeWFuZGV4LnJ1
†These authors have contributed equally to this work