 Hye-Ryun Cho
 Sangki Cho1,2
 Jueun Kim
 Wooyong Um
- 1Nuclear Chemistry Research Team, Korea Atomic Energy Research Institute, Daejeon, Republic of Korea
- 2Radiochemisty in Nuclear Science and Technology, University of Science and Technology, Daejeon, Republic of Korea
- 3Division of Advanced Nuclear Engineering, Pohang University of Science and Technology, Pohang, Republic of Korea
PuO2(cr) dissolution in natural water was investigated at 25°C and 60°C under atmospheric conditions. The concentration of Pu in solutions [Pu], was monitored for 1 year of reaction time. PuO2(cr) dissolution in natural water reached a steady state within 2 months at 25°C. The [Pu] in groundwater and seawater at pH 8 were in the range of [Pu] = 0.9–34 and 3.4–27 nM, respectively. The [Pu] in concrete porewater (rainwater equilibrated with concrete) at pH 8.1–10.9 was in the range of 0.1–3.2 nM. The [Pu] and pH values of groundwater were similar to those of seawater samples having a high ionic strength. The measured [Pu] at equilibrium in all samples was higher than the calculated solubility curves for PuO2(am, hyd). Experimental evidence is insufficient to confirm the oxidation state of Pu in solution and solid phases. However, the results of geochemical modeling indicate that PuO2(am, hyd) and aqueous Pu(IV) species are dominant in natural water samples of this work. The dissolution behavior of PuO2(cr) in natural waters is comparable to the oxidative dissolution of PuO2(am, hyd) in the presence of PuO2(coll, hyd). The dissolution of PuO2 in groundwater decreased at higher temperatures, whereas the influence of temperature in seawater and porewater was not significant under these experimental conditions.
1 Introduction
The safety of radioactive waste disposal facilities can be guaranteed by strictly isolating radionuclides (RNs) until their toxicity is reduced to the level of natural radioactivity (IAEA, 2011). RNs can dissolve in natural water, react with various ligands, adsorb on engineering and natural barriers (clays and rocks), diffuse through barriers, and migrate along the flow of natural water (Kim, 2006). The disposal environment in each country and region differs by waste type, radioactive level, selected engineering and natural barriers, and natural water properties (Choi et al., 2013; Grambow, 2016; Zhang et al., 2020). The underground disposal environment is generally expected to be at high temperatures, anaerobic, and reducing and neutral or weakly basic pH conditions. In near-surface disposal facilities, aerobic conditions should be considered and depending on the location of the repository, the potential intrusion of seawater should also be considered. The migration behavior of RNs through natural water is estimated by geochemical modeling using thermodynamic data, such as solubility, formation constants, enthalpy and entropy of reaction, and sorption/diffusion properties of RNs. Several thermodynamic databases (TDB) have been developed by OECD NEA (Ragoussi and Brassinnes, 2015), ThermoChimie (Giffaut et al., 2014), NAGRA/PSI (Thoenen et al., 2014), and JAEA (Kitamura, 2020) to increase the reliability of geochemical modeling.
Plutonium chemistry in aqueous solutions is complex because of the redox sensitivity of Pu (Romanchuk et al., 2016) and reliable thermodynamic data on the dissolution, redox reaction, hydrolysis, complexation, etc., of Pu are insufficient compared to other actinides. The thermodynamic constants recommended by the latest NEA-TDB (Grenthe et al., 2020) are related to only 9, 16, 6, and 18 reactions in aqueous solutions for Pu(III), Pu(IV), Pu(V), and Pu(VI), respectively, which are much lower than the 25 and 127 data for U(IV) and U(VI), respectively. Various essential data for the geochemical modeling of Pu in natural water, such as the reactions of Pu(III-VI) with OH−, CO32-, and Cl−, are summarized in Supplementary Table S1. Data on the dissolution of various Pu solids are insufficient compared to those on the formation of aqueous Pu species. Reaction enthalpy and entropy are scarce and study for determination of the values has recently been encouraged for the reliable estimation of chemical behaviors of Pu at high temperatures (Cho et al., 2022). The geochemical modeling of Pu in repository environments contains a relatively large uncertainty; therefore, site-specific investigation of the chemical behavior of Pu is often required for the safety assessment of radioactive waste disposal facilities.
In this work, the dissolution of PuO2(cr) in natural water contacted with air was investigated and compared to the calculated solubility curves of various Pu hydroxides. Groundwater, seawater, and rainwater were collected in the vicinity of Gyeongju, Korea, where the disposal site for low- and intermediate-level radioactive waste is located. The dissolution of PuO2(cr) in various natural waters was observed for 1 year at 25°C and 60°C under atmospheric pressure to evaluate geochemical behaviors of Pu in near-surface disposal environments.
2 Materials and methods
2.1 PuO2(s) powder
PuO2(s) powder was purchased from Oak Ridge National Laboratory (ORNL) in 1990, with 239Pu (99.75 atom %) and used as received. Table 1 shows the certified Pu isotope inventory (atom %) for 1990 and half-life. As a result of decay, the isotopic content and relative alpha activity changed in 2020 (over 30 years) and are shown in Table 1. 241Am accumulated over time owing to the beta decay of 241Pu. The alpha particles generated by 241Am-decay were simultaneously counted with those generated by 239Pu using a liquid scintillation counter (LSC) with an α/β discriminator.
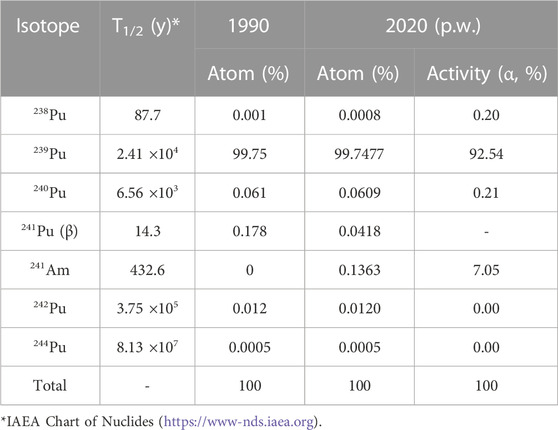
TABLE 1. Isotopic inventory of PuO2(s) (ORNL, USA) and its activities.
2.2 Preparation of natural water samples
Three types of natural waters were used to investigate the solubility of PuO2(s): groundwater (GW), seawater (SW), and concrete porewater (PW, rainwater (RW) equilibrated with concrete). The collection and preparation processes are as follows: GW samples were collected at two locations in the Gyeongju area every 3 months in a year (set A–D), considering the domestic seasonal change, and equilibrated with crushed granite or sedimentary rocks collected at the same site. Thus, 16 GW samples were prepared. SW and RW were collected at four different times (set A–D) and treated with seabed soil and concrete, respectively. All solid phases (composition, see the Supplementary Table S2) were crushed and sieved to prepare a powder with particle size in the range of 0.075–0.15 mm and added to natural water samples with a solid-liquid ratio of 10 g/L. Equilibrium was achieved while in contact with air. The sample reached a steady state after 1 month, which was confirmed by monitoring the pH. The solid phase was separated by filtration using a membrane filter with a pore size of 0.45 μm. The prepared natural water samples were stored in a refrigerator before use. The chemical compositions of the natural water samples were measured by inductively coupled plasma mass spectrometry (ICP-MS), inductively coupled plasma optical emission spectroscopy (ICP-OES), ion chromatography (IC), and a total organic carbon (TOC) analyzer in a creditable analytical laboratory.
2.3 Preparation of Pu samples
Pu samples were prepared by adding PuO2(s) powder into natural water. A total of 30 mL of GW samples and 60 mL of SW and PW samples were prepared in plastic bottles (polyethylene). About 0.5–1.0 mg of PuO2(s) powder was collected using a disposable pipette with a tip of ∼1 mm (see Supplementary Figure S1A), and added to the natural water samples (see Supplementary Figure S1B). The end of the disposable pipette used for collecting PuO2(s) powder was cut and placed in a sample bottle, which was not removed until the solubility measurement was completed. Black PuO2(s) powder settled down to the bottom of the sample bottle containing natural water (see Supplementary Figure S1C). All samples were stored in a constant temperature chamber at 25°C, and the concentration of Pu ([Pu]) in natural water was periodically measured for 1 year. Then, four of the GW samples and one of the SW and PW samples (set A) were placed in a constant temperature chamber at 60°C to observe the dissolution of PuO2(s) at higher temperatures. An aliquot of the supernatant was used for the determination of [Pu] which was quickly sampled outside the temperature-controlled chamber at 25°C and 60°C without phase separation. Phase separation by filtration could not be applied because of the small volume of the sample solution, which was limited by the amount of stocked PuO2(s) powder (∼20 mg). While trying not to disturb the samples to prevent the floating of the settled PuO2(s), 0.5 mL of supernatant in GW samples and 1.0 mL in SW and PW samples were collected into LSC vials in triplicate.
2.4 pH, redox potential, and conductivity measurements
The pH of the natural water before and after equilibration with PuO2(s) was measured using a glass combination pH electrode (8103BNUWP Ross Ultra, Orion) calibrated using pH buffers (pH 4.01, 7.00, and 10.01, Orion) at room temperature (23°C ± 2°C). The redox potential values were measured using a combination ORP electrode (InLab® Redox, Mettler Toledo). The measured potential values were converted to Eh (versus the standard hydrogen electrode, SHE) by correcting the potential of the Ag/AgCl reference electrode. Conductivity (EC) was measured using a conductivity cell (TetraCon 925, WTW) calibrated with 0.001–1.0 M KCl solutions.
2.5 Liquid scintillation counter
A liquid scintillation counter (Tri-Carb4910TR, Packard) with an α/β discriminator was employed to determine the [Pu]. An aliquot of the natural water sample was mixed with 15 mL of LSC cocktail (Ultima Gold AB, PerkinElmer). The activity of 239Pu was 92.54% of the total alpha activity (7.05% for 241Am), based on the certified isotope inventory of Pu, as shown in Table 1. In considerations of the probable solubility difference between Pu and Am, the ratio of 239Pu to total alpha activity in natural water samples were checked at the end of experiments by alpha spectrometry (Alpha analyst, CANBERRA). The ratio in 4 GW samples and a PW sample was 0.95 ± 0.01 and 0.92, respectively, which is comparable to the theoretical value (0.9254) in the PuO2 solid state. Although, it was difficult to confirm the ratio in the SW samples due to the high salts contents that interfere the detection of the alpha emissions [Pu] in all the GW, PW, and SW samples were calculated using the theoretical ratio (0.9254) from the LSC measurement. The limit of detection (LOD) was calculated using the minimum detectable activity (MDA, Bq/mL), as in Eq. 1 (Currie, 1968),
where B (cps) is the count rate of the background material, tB and T (s) are the measurement times for the background and sample, respectively, and V (mL) is the sample volume.
2.6 X-ray diffraction measurement
A shielded XRD system (D8 Advanced, Bruker AXS) with a modified microbeam was used to confirm the crystallinity of the PuO2(s) powder. The instrumentation has been described in detail elsewhere (Park et al., 2013). An appropriate amount of PuO2(s) powder was placed on an acrylic holder and covered with a polyimide film. The powder XRD spectra were obtained by step scanning in the range of 10°–80° (2θ) with a step interval of 0.02° (2θ) for 25 s per count; the total measurement time was approximately 24 h. The measured XRD spectrum of the PuO2(s) powder was compared with the reported powder diffraction file (PDF) (Gates-Rector and Blanton, 2019).
3 Results and discussion
3.1 PuO2(cr) characterization
Figure 1 shows the XRD data of the PuO2 powder compared to that of a blank sample prepared with an acrylic holder covered with a polyimide film without Pu. Only one peak at approximately 28.7° (marked with an asterisk), corresponding to the applied film material, was observed. The picture in the inset of Figure 1 shows the upper side of the prepared sample, where the black PuO2 powder is located in the center, with a size of 0.5 × 4 mm2. The collected XRD pattern of PuO2 was identical to the reported data for PuO2(cr) (PDF #75–2011) and no additional peaks were observed.
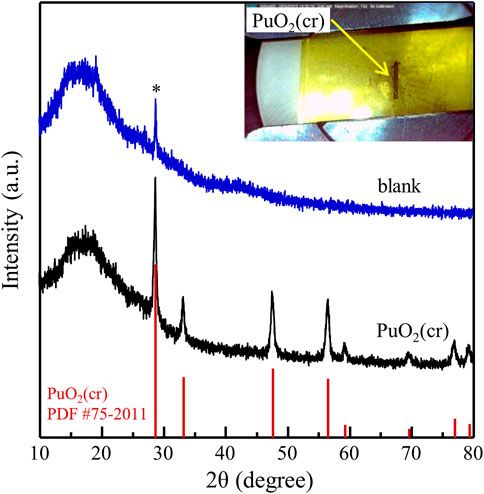
FIGURE 1. XRD spectrum of PuO2(cr) measured before solubility study. XRD spectrum of the blank sample without Pu is shown for comparison.
3.2 Natural water characterization
Representative data (set A) for raw natural water samples are listed in Table 2, which include two groundwater samples (GW1 and GW2) collected at different locations, seawater (SW), and rainwater (RW). A pH of 8 was measured for both GW and SW, whereas that of RW was weakly acidic (pH 6). The redox potentials for all natural waters were confirmed to be weak oxidation conditions. A high conductivity of SW containing excessive amounts of salt, such as NaCl and MgCl2 was found. GW and RW contained various ions of Mg, Na, K, Ca, Si, Cl, and SO42- at the mg/L level, and Al, Li, and Sr at the μg/L level. The properties of natural water were changed by equilibrating it with the selected solid powder, as shown in Table 2. GW1 samples equilibrated with fractured granite (F) and sedimentary (S) rocks were named GW1F and GW1S, respectively. The pH of GW and SW remained at pH 8, whereas the pH of RW increased from 6 to 12 after equilibrating it with concrete (PW). An increase in the concentrations of Ca, Si, Al, etc., in PW, was observed because of the leaching of components present in the concrete. Because GW and SW were already in equilibrium with the surrounding minerals and rocks at the time of collection, the change in the chemical composition due to the additional equilibrium step with the selected solids was not significant. The TOC was increased by the solid-liquid equilibrium in all natural waters.
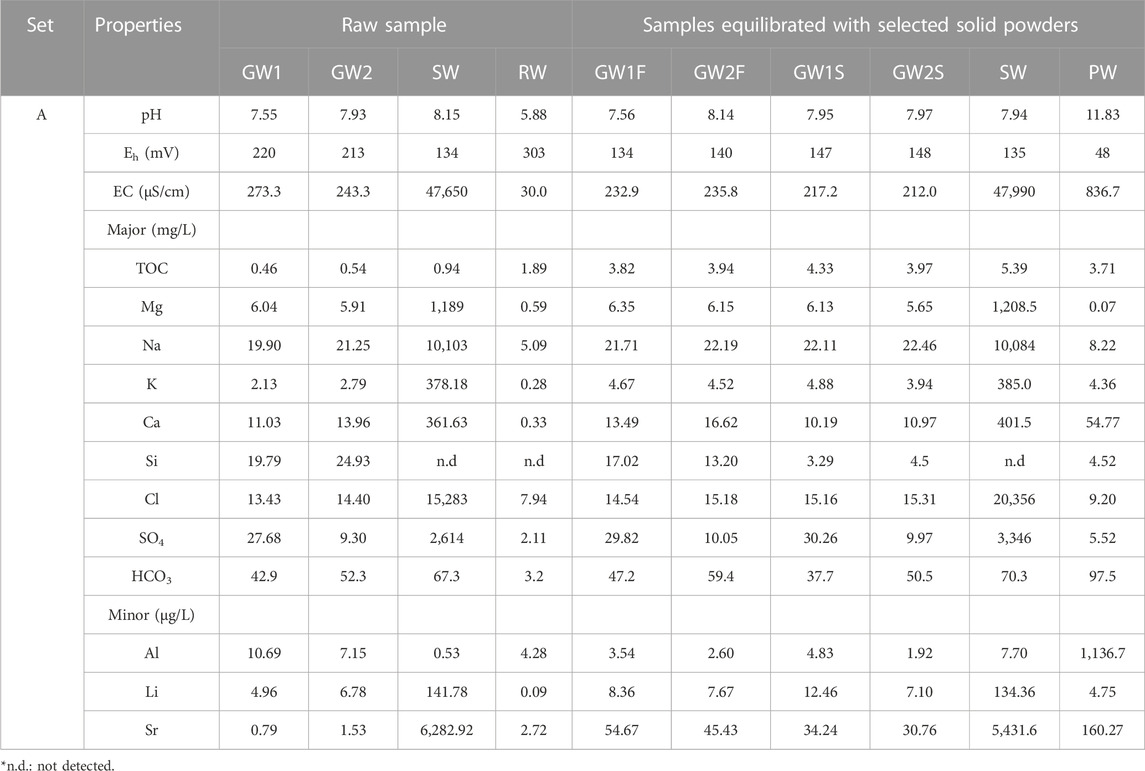
TABLE 2. Physical and chemical properties of representative natural water samples before and after equilibrated with the selected solid phase.
The physicochemical properties of natural water samples do not critically depend on the domestic seasonal change (see data for set B–D in Supplementary Table S3). The pH of GW and SW was in the range of 7.6–8.2 and 7.8–7.9, respectively, whereas the pH of PW was in the range of 11.6–11.9. Although the Eh values were slightly reduced after the reaction with solids, they maintained oxidizing conditions. The conductivity of GW and SW did not change, whereas that of PW increased approximately 10 times after the reaction with the concrete. The TOC of GW, SW, and PW increased to 1.49–4.33, 1.95–5.39, and 3.71–16.08 mg/L, respectively, and the highest TOC was observed for the PW sample. The major cation concentrations in GW were in the order of Na > Ca > Si > K > Mg, and those in SW were in the order of Na > Mg > K ≈ Ca. Al, Ca, and Si, which are the major components of the concrete, were dominant in the PW samples. In the case of anion species, HCO3 > SO4 ≈ Cl are present in the GW and PW, and Cl > SO4 > HCO3 in the SW.
3.3 Dissolution behavior of PuO2(cr) at 25°C
Figure 2 shows [Pu] as a function of reaction time at 25°C. Each data point is the average of the measurements in triplicate and error bar means standard deviation of triplicate (error bars (≤±0.05) were omitted when they are smaller than the symbol size). The measured data for the six samples (set A) listed in Table 2 are represented in Figure 2 (data for set B–D, see Supplementary Figure S2). The dashed lines in Figure 2 indicate the LOD of 1.3 × 10⁻¹⁰ M for 0.5 mL of GW samples in Figure 2A and 0.6 × 10⁻¹⁰ M for 1.0 mL of SW and PW samples in Figure 2B. A rapid decrease of [Pu] was observed at the beginning of the experiments in all samples. This was caused by the highly reactive site on the surface of PuO2(cr) powder made during manufacturing process that would dissolve very quickly in aqueous solutions. The high initial [Pu] decreased with the precipitation of Pu in a solubility-limited solid phase in equilibrium with the natural waters. All samples reached a steady state after 1–2 months of reaction time. After reaching equilibrium, the measured [Pu] was relatively high in a few samples. Such sudden change could be an experimental error caused by incomplete phase separation. Small PuO2(cr) particles or colloids may have been included during the sampling of 0.5 or 1.0 mL of supernatant without filtration. Although the measured [Pu] at the same reaction time were significantly different in a few samples, all measured values had been averaged without excluding any data. These samples showed large errors as shown in Figure 2 for GW1S and PW samples.
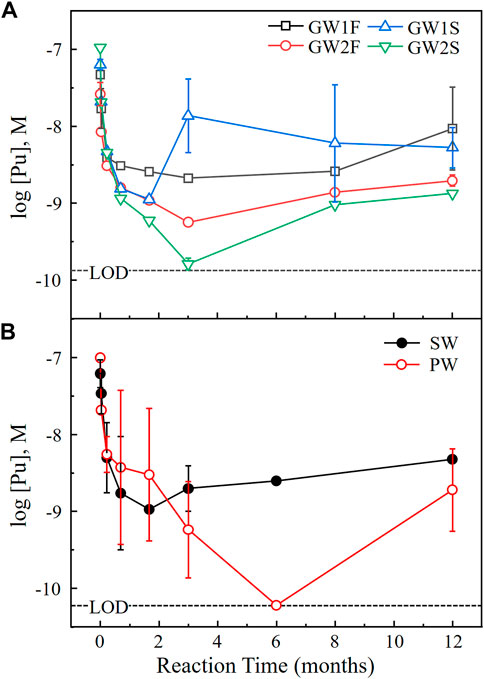
FIGURE 2. Dissolution behaviors of PuO2(cr) at 25°C in (A) groundwater and (B) seawater and concrete porewater (set A) as a function of the reaction time. The dashed lines indicate the LOD by LSC under the given experimental conditions.
As shown in Figure 2A, the dissolution of PuO2(cr) in most GW samples reached equilibrium after 2 months. The characteristics of the GW samples did not differ depending on the sampling season, location, and type of equilibrium solid, as shown in Tables 2 and Supplementary Table S3, and no significant correlation was observed in the measured [Pu] in the various GW samples. The measured [Pu] after 3 months were in the range of 0.2–30 nM, and after 1 year of reaction time were 0.9–34 nM (see Figure 2A and Supplementary Figure S2A). The dissolution of PuO2(cr) in the SW samples reached equilibrium after 2 months, and [Pu] at 1 year were 3.4–27 nM (see Figure 2B and Supplementary Figure S2B). As shown in Figure 2B (open circles), the lowest solubility of PuO2(cr) was observed for PW, and some measured [Pu] were below the LOD at reaction times longer than 1 month. The measured [Pu] at 1 year in PW were 0.10–3.2 nM (LOD = 0.06 nM, see Figure 2B and Supplementary Figure S2C). All measured [Pu] at 1 year were listed in Table 3 (set A) and Supplementary Table S4 (set B–D).
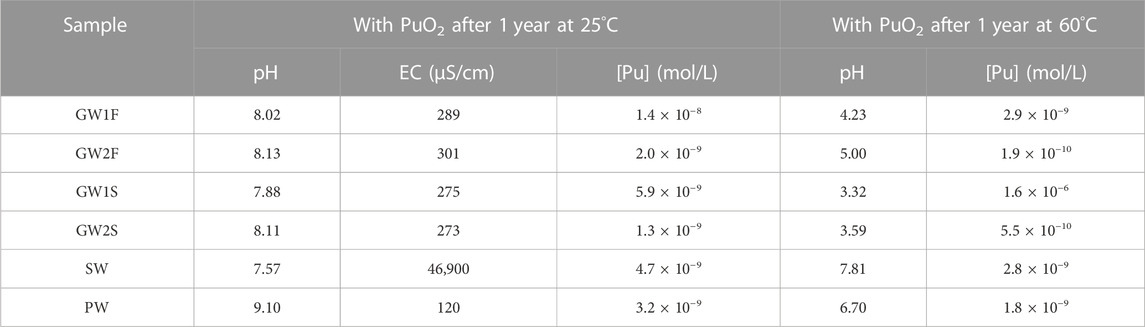
TABLE 3. Representative [Pu], pH and conductivity of natural water samples with PuO2 measured after 1 year of reaction time at 25°C and 60°C, respectively.
To check whether the characteristics of natural water changed during the PuO2(cr) dissolution study, the pH and conductivity of the samples were measured at the end of the experiments. GW samples in the pH range of 7.6–8.2 maintained a pH of 8 after the dissolution of PuO2(cr). An initial conductivity of 163–390 μS/cm for the GW samples did not significantly change and was in the range of 217–338 μS/cm. The conductivity of SW was slightly changed from 45,900–59,500 to 46,900–50,700 μS/cm at constant pH. The pH and conductivity of the PW decreased from 12 to 8.1–10.9 and 484–1,000 to 120–370 μS/cm, respectively. For the six samples (set A), the measured pH and conductivity values after 1 year with PuO2(cr) at 25°C are listed in Table 3 (pH of set B–D, see Supplementary Table S4). To understand the pH change of PW, the pH of the PW sample stored for the same period in a refrigerator without PuO2(cr) was measured, which decreased from 11.6–11.9 to 9.4–10.7. As described in the experimental section, the concrete powder was removed from the equilibrated PW solution by filtration and stored in contact with air. CO2 present in the ambient air continuously dissolves into the alkaline PW sample, the concentration of dissolved inorganic carbon increases, and therefore, the pH decreases over time (Beuvier et al., 2014). The decrease in conductivity of PW indicates a reduced concentration of dissolved ions, which could be induced by precipitation at lower alkalinity. The major leached components from the concrete in PW were Ca, Si, Al, and CO32- ions at pH 12. The conductivity could be reduced owing to the formation of precipitates at neutral pH conditions; however, the change of dissolved ion concentration was not confirmed because the residual amount of the sample was not sufficient at the end of the experiments.
Figure 3 shows the measured [Pu] at 1 year in natural waters compared with the solubility curves of Pu hydroxide calculated based on the thermodynamic data listed in Supplementary Table S1. The measured pH and [Pu] were displayed for 16 GW (○), 4 SW (×), and 4 PW (□) samples. As mentioned above, the pH in PW samples was distributed in a relatively wide range of 8.1–10.9 and the [Pu] was 0.1–3.2 nM, which is lower than that of SW or GW samples. The pH value of most GW samples was maintained at approximately 8, and 4 GW samples (set C) were acidified to pH 7.1–7.4. The range of pH and [Pu] for GW and SW samples were similar.
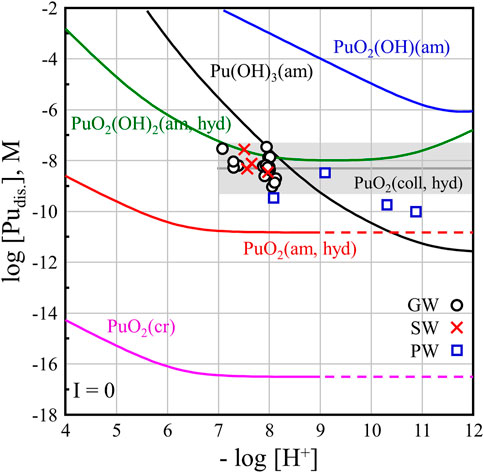
FIGURE 3. Solubility of PuO2(cr) powder in natural water (GW, SW, and PW) were compared with the calculated solubility curves for hydroxide and oxide compounds of Pu(III-VI).
The solid lines in Figure 3 were calculated using the reported solubility products of PuO2(am, hyd), Pu(OH)3(am), PuO2OH(am), and PuO2(OH)2(am, hyd) and formation constants for aqueous Pu-OH species (I = 0 M, at 25°C) listed in Supplementary Table S1. Because reliable logK values of Pu(OH)2+ and Pu(OH)3 species have not been reported, −15.1 and −26.2 of Am(OH)2+ and Am(OH)3 species were applied, respectively (Grenthe et al., 2020). The ionic strength of GW and PW samples was as low as a few millimoles, so it can be compared with the calculated solubility curve using thermodynamic data at the standard state (Grenthe et al., 2020). However, because the ionic strength of the SW samples was high (0.5 M), a direct comparison of the SW samples’ results with the solubility curves shown in Figure 3 is not possible. The dissolution behaviors of PuO2(cr) in SW could be related to the estimated solubility curves of Pu hydroxide at a 0.5 M ionic strength ([Cl−] = 0.5 M) based on the specific ion interaction theory (SIT). However, the ion interaction coefficients for the Pu(III-VI) ions and Pu-OH species with Cl− ions, such as ε(Pu4+, Cl−), ε(Pu(OH)3+, Cl−), ε(PuO22+, Cl−), etc., have not yet been reported (Grenthe et al., 2020). Generally, the solubility of actinide compounds increases at higher concentrations of [Cl−] in NaCl, MgCl2, and CaCl2 solutions (Altmaier et al., 2013). The measured [Pu] in SW was comparable to the increased solubility curve of Pu solids at I = 0.5 M.
In this work, PuO2(cr) was applied to investigate dissolution in various natural waters. The solubility product of PuO2(cr), logK°sp = −64.0 ± 0.5, is included in ThermoChimie TDB v. 11a.1 The calculated solubility curve for PuO2(cr) shown in Figure 3, which deviates significantly from the measured values. The solubility product of PuO2(cr) was calculated using Gibb’s free energy of formation ΔfG°m for the well-defined crystalline phase. As mentioned in the literature (Grenthe et al., 2020), the theoretical stability of PuO2(cr) can be evaluated using this value; however, it is difficult to interpret the dissolution behavior of PuO2(cr) in aqueous solutions. In our dissolution study of PuO2(cr) in natural water samples, a higher [Pu] than the solubility curve of PuO2(am, hyd) was obtained for all the samples. This means that the crystallinity of PuO2(cr) was not maintained and probably converted to an amorphous solid phase. Amorphization by radiation effect has been reported for a few Pu solid phases such as Pu-oxalate and PuF4(cr) (McCoy et al., 2017; Corbey et al., 2021). Unfortunately, solid-phase characterization to confirm the transformation of solids could not be performed because of the limited amount of the remaining PuO2(s) in the samples after the solubility experiments.
Geochemical modeling was carried out in order to evaluate geochemical behaviors of Pu at the measured redox potentials under all the examined natural water conditions. A commercial software, Geochemist’s Work Bench (GWB, standard, 17.0) was used for the modeling with ThermoChimie TDB v. 11a, which was updated with the latest NEA-TDB (Grenthe et al., 2020). Redox behavior, solubility limiting solid phase, and aqueous species distribution of Pu at natural water conditions were evaluated. For the modeling, the solubility product of PuO2(cr) was excluded, because it was too low to explain our experimental results. Under all natural water conditions, the solubility limiting solid phase was identified as PuO2(am, hyd), and aqueous Pu(OH)4(aq), Pu(OH)2(CO3)22-, and Pu(OH)3+ species was dominant in a pH of 7–12 (see Figure 4 for GW1F and Supplementary Figure S3 for SW and PW of sample set A, respectively). The pH and Eh of GW (○), SW (×), and PW (□) samples are shown in Figure 4A, Supplementary Figure S3A, S3C, respectively. Considering the thermodynamic data included in ThermoChimie TDB v. 11a, solid and aqueous species of Pu(IV) were dominant in the investigated natural water samples.
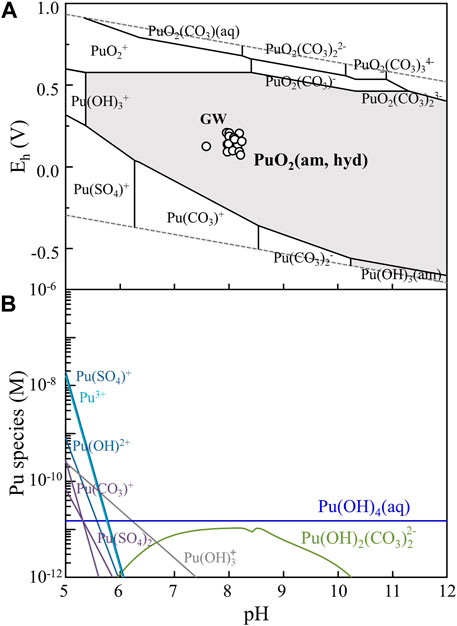
FIGURE 4. (A) Pourbaix diagram of Pu ([Pu] = 10−10 M) was a result of geochemical modeling at the GW1F condition (set A) and displayed with the measured Eh and pH values of GW (○) listed in Table 2 and Supplementary Table S3. The dashed lines indicate the boundaries of water stability: upper and lower limits for the oxidation and reduction of water, respectively. (B) Species distribution at [Pu] of 10−6 M in the GW1F sample shows that low concentrations of Pu(OH)4(aq) and Pu(OH)2(CO3)22- species as dominant in this experimental condition. Geochemical modeling was carried out using Geochemist’s workbench based on ThermoChimie v. 11a TDB.
In all samples of GW, SW, and PW, the [Pu] was higher than the solubility curves of PuO2(am, hyd) as shown in Figure 3. The initially settled black PuO2(s) remained until the end of experiments. The higher [Pu] at the present experimental condition where tetravalent Pu is dominant can be explained by the oxidative dissolution of PuO2(am, hyd) in the presence of PuO2(coll, hyd). The formation of PuO2+x(am, hyd) during solubility measurement of PuO2(am, hyd) in the presence of oxygen was reported by Neck et al. (Neck et al., 2007). They described that the (pe + pH) = 12.5 ± 1.2 at pH > 4 (Region C of the literature, see Supplementary Figure S4) can only be explained when considering the dominant colloidal PuO2 in neutral and alkaline solution. The initial (pe + pH) value of natural water samples was in a range of 9.5–11.8 in this work, which is slightly lower than the Region C. Neck et al. (Neck et al., 2007) reported log[Pu] = −8.3 ± 1.0 in equilibrium with PuO2(coll, hyd) in the neutral and basic pH ranges which is shown by the grey box in Figure 3. Dissolution behaviors of PuO2(cr) in various natural water are comparable to the solubility of the hydrated amorphous PuO2+x(am, hyd) with the presence of hydrated PuO2 colloids, PuO2(coll, hyd). Due to the limited sample volumes, we were not able to perform phase separation to monitor the existence of colloidal Pu in our samples until the end of experiments. The GW samples (set B), SW and PW (set C) were stored at 25°C for 3-year, and the measured (pe + pH) values remained in a range of 12.9–13.4 at pH 7.7–8.1. The presence of colloidal Pu was confirmed by [Pu] analysis before and after ultrafiltration using a cellulose membrane filter (Amicon, Ultracel YM-10, 10 kD) which was rinsed with 6 mL of a sample solution. The results showed that most of Pu in the supernatant was colloidal Pu in GW and PW samples, and colloidal Pu was not found in SW (see Supplementary Table S5).
3.4 Dissolution behavior of PuO2 at 60°C
Among the natural water samples studied at 25°C, 4 GW, 1 SW, and 1 PW samples (set A) were selected to evaluate the dissolution behavior of PuO2 at higher temperatures. Table 3 lists the pH and [Pu] of six samples measured before (at the end of the experiment at 25°C) and after 1 year of reaction time at 60°C. Figure 5 shows [Pu] as a function of reaction time at 60°C. Each data point is the average of the measurement for the 4 GW, 1 SW, and 1 PW samples in triplicate and error bar means standard deviation of triplicate (errors (≤±0.05) were omitted when smaller than symbol size). In the 4 GW samples [Pu] below 10–8 M observed at the initial time of reaction was dramatically increased to 10–5 M after 50 days, as shown in Figure 5A. Subsequently [Pu] gradually decreased over time. [Pu] in GW1F and GW2S reached a steady state after 6 months. At 1 year of the reaction time [Pu] was 2–10 times lower than the results at 25°C for GW1F, GW2F, and GW2S samples. The decrease of pH in GW samples was observed at 60°C. A significant change was observed in the GW1S sample, whose pH was 3.32 with a [Pu] of 1.6 μM. An increase in the [Pu] of the SW sample was observed at the beginning of the dissolution at 60°C, and then [Pu] gradually decreased. The reaction equilibrium was reached after 3 months, and [Pu] in the SW sample at higher temperatures was slightly decreased compared to the solubility of PuO2 at 25°C. The pH 7.57 of the SW sample remained at pH 7.81 after 1 year at 60°C. In the PW sample, the measured [Pu] after 1 day at 60°C was 100 times higher than the last measured data at 25°C. The [Pu] continuously decreased over time and reached minimum after 3 months and then slowly increased until 1 year. The [Pu] in PW at 60°C was similar to or slightly lower than that measured at 25°C. The pH of the PW sample decreased from 9.10 to 6.70 during the 1-year experiment at 60°C.
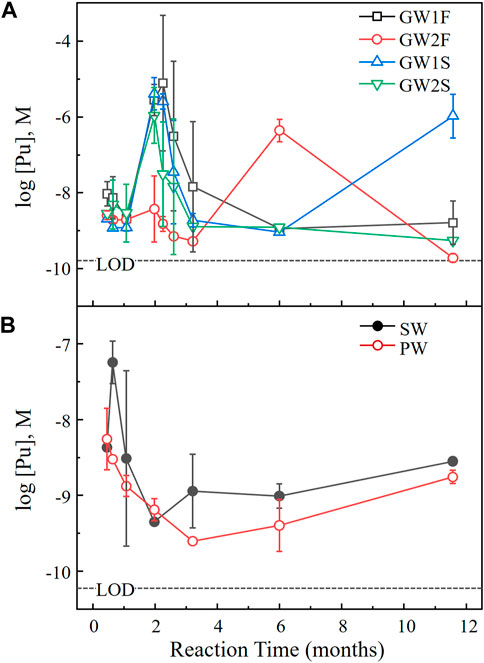
FIGURE 5. Dissolution behaviors of PuO2(cr) at 60°C in (A) groundwater and (B) seawater and concrete porewater (set A) as a function of the reaction time. The dashed lines indicate the LOD by LSC under the given experimental conditions.
The pH at 60°C significantly decreased in GW and PW, whereas no change in pH was observed in SW as shown in Table 3. Notably, the pH of GW samples at 60°C with a reaction time of 1 year dropped to 3.32–5.00, which was too low to consider because of equilibration with air. Actinide has been considered as a potential catalyst due to its electrical flexibility of 5 f-orbital and high reactivity in low oxidation states. The oxygen evolution reaction (4OH− → O2 + 2H2O+ 4e−) in alkaline solutions can occur by tetravalent actinides such as Th(IV) and U(IV), under mild conditions of the sample solution (Hu et al., 2019; Leduc et al., 2019). In this case, the reduction of Pu(IV) to Pu(III) would have occurred, but the change in the oxidation state in the liquid and solid phases of Pu could not be confirmed. The decrease in the pH of the PW samples is in the pH range, which can be interpreted as contact with air. No pH changes were observed in the SW samples. The biggest difference between the SW and GW/PW samples is the ionic strength (concentration of dissolved ions). It is considered that high concentrations of ions, such as Na+, Mg2+, Cl−, and SO42- caused different carbonate behaviors in the SW samples.
4 Conclusion
The dissolution behaviors of PuO2(cr) in various natural waters were investigated, which is the basic parameter for the safety assessment of radioactive waste disposal facilities. The results were compared with geochemical modeling and estimated solubility curves of Pu hydroxides using a thermodynamic database. Groundwater, seawater, and concrete porewater were systematically prepared to consider various disposal environments. The concentration of dissolved Pu in three different natural waters that reached equilibrium with PuO2(cr) was monitored at 25°C and 60°C in contact with air. The results at 25°C showed that the dissolution behaviors of PuO2(cr) correspond to the oxidative dissolution of PuO2(am, hyd) in the presence of PuO2(coll, hyd). During the experimental period of 1 year, there was no significant change in the properties, such as pH, of the natural waters used in the experiments at 25°C. However, the results at 60°C are not conclusive, as the properties of the examined waters, in particular pH values, were considerably changed over time. To understand the dissolution behavior of Pu in natural waters at higher temperatures of the underground disposal environment, the influence of air contact should be excluded and high pressure should be considered.
Data availability statement
The original contributions presented in the study are included in the article/Supplementary Material, further inquiries can be directed to the corresponding author.
Author contributions
H-RC and WU defined the initial concept and experimental study. H-RC, H-KK, SC, SH, and JK performed experiments and evaluated the data. H-RC wrote the first draft of the manuscript, and all the authors wrote the sections and contributed to the revision and approval of the manuscript.
Funding
This study was supported by the Nuclear Research and Development Program of the National Research Foundation (NRF) of Korea (No. 2017M2A8A5014719) and the Institute for Korea Spent Nuclear Fuel and NRF of Korea (No. 2021M2E1A1085202).
Acknowledgments
The authors acknowledge the facility support from the KAERI Institutional Program (Project No. 521330-22).
Conflict of interest
The authors declare that the research was conducted in the absence of any commercial or financial relationships that could be construed as a potential conflict of interest.
Publisher’s note
All claims expressed in this article are solely those of the authors and do not necessarily represent those of their affiliated organizations, or those of the publisher, the editors and the reviewers. Any product that may be evaluated in this article, or claim that may be made by its manufacturer, is not guaranteed or endorsed by the publisher.
Supplementary material
The Supplementary Material for this article can be found online at: https://www.frontiersin.org/articles/10.3389/fnuen.2023.1118594/full#supplementary-material
Footnotes
1https://www.thermochimie-tdb.com
References
Altmaier, M., Gaona, X., and Fanghänel, T. (2013). Recent advances in aqueous actinide chemistry and thermodynamics. Chem. Rev. 113, 901–943. doi:10.1021/cr300379w
Beuvier, T., Calvignac, B., Bardeau, J.-F., Bulou, A., Boury, F., and Gibaud, A. (2014). Quantification of the dissolved inorganic carbon species and of the pH of alkaline solutions exposed to CO2 under pressure: A novel approach by Raman scattering. Anal. Chem. 86, 9895–9900. doi:10.1021/ac5025446
Cho, S., Kim, H.-K., Kim, T.-H., Cha, W., and Cho, H.-R. (2022). Thermodynamic studies on the hydrolysis of trivalent plutonium and solubility of Pu(OH)3(am). Inorg. Chem. 61, 12643–12651. doi:10.1021/acs.inorgchem.2c01590
Choi, H.-J., Lee, J. Y., and Choi, J. (2013). Development of geological disposal systems for spent fuels and high-level radioactive wastes in Korea. Nucl. Eng. Technol. 45, 29–40. doi:10.5516/NET.06.2012.006
Corbey, J. F., Sweet, L. E., Sinkov, S. I., Reilly, D. D., Parker, C. M., Lonergan, J. M., et al. (2021). Quantitaitve microstructural characterization of plutonium oxalate auto-degradation and evidence for PuO2 nanocrystal formation. Eur. J. Inorg. Chem. 2021, 3277–3291. doi:10.1002/ejic.202100511
Currie, L. A. (1968). Limits for qualitative detection and quantitative determination. Application to radiochemistry. Anal. Chem. 40, 586–593. doi:10.1021/ac60259a007
Gates-Rector, S., and Blanton, T. (2019). The powder diffraction file: A quality materials characterization database. Powder Diffr. 34, 352–360. doi:10.1017/S0885715619000812
Giffaut, E., Grivé, M., Blanc, P., Vieillard, P., Colàs, E., Gailhanou, H., et al. (2014). Andra thermodynamic database for performance assessment: ThermoChimie. Appl. Geochem. 49, 225–236. doi:10.1016/j.apgeochem.2014.05.007
Grambow, B. (2016). Geological disposal of radioactive waste in clay. Elements 12, 239–245. doi:10.2113/gselements.12.4.239
Grenthe, I., Gaona, X., Rao, L., Plyasunov, A., Runde, W., Grambow, B., et al. (2020). Second update on the chemical thermodynamics of uranium, neptunium, plutonium, americium and technetium. Chem. Thermodyn. 14. Boulogne-Billancourt France, OECD. doi:10.1787/20743300
Hu, C., Zhang, L., and Gong, J. (2019). Recent progress made in the mechanism comprehension and design of electrocatalysts for alkaline water splitting. Energy and Environ. Sci. 12, 2620–2645. doi:10.1039/C9EE01202H
IAEA (2011). Disposal of radioactive waste. Specific safety requirements SSR-5. Vienna, Austria: International Atomic Energy Agency.
Kim, J.-I. (2006). Significance of actinide chemistry for the long-term safety of waste disposal. Nucl. Eng. Technol. 38, 459–482.
Kitamura, A. (2020). JAEA-TDB-RN in 2020: Update of JAEA’s thermodynamic database for solubility and speciation of radionuclides for performance assessment of geological disposal of high-level and TRU wastes. JAEA-Data/Code 20. Japan: JAEA. doi:10.11484/jaea-data-code-2020-020
Leduc, J., Frank, M., Jürgensen, L., Graf, D., Raauf, A., and Mathur, S. (2019). Chemistry of actinide centers in heterogeneous catalytic transformations of small molecules. ACS Catal. 9, 4719–4741. doi:10.1021/acscatal.8b04924
McCoy, K., Casella, A., Sinkov, S., Sweet, L., Mcnamara, B., Delegard, C., et al. (2017). Radiation damage and annealing in plutonium tetrafluoride. J. Nucl. Mater. 496, 379–387. doi:10.1016/j.jnucmat.2017.08.005
Neck, V., Altmaier, M., and Fanghänel, T. (2007). Solubility of plutonium hydroxides/hydrous oxides under reducing conditions and in the presence of oxygen. C. R. Chim. 10, 959–977. doi:10.1016/j.crci.2007.02.011
Park, Y.-S., Kim, J.-g., Seo, H.-S., Ha, Y.-k., and Song, K. (2013). Lattice parameter changes for spent UO2 fuels with and without Gd. Asian J. Chem. 25, 7006–7008. doi:10.14233/ajchem.2013.04
Ragoussi, M.-E., and Brassinnes, S. (2015). The NEA thermochemical database project: 30 years of accomplishments. Radiochim. Acta 103, 679–685. doi:10.1515/ract-2015-2392
Romanchuk, A. Y., Kalmykov, S. N., Kersting, A. B., and Zavarin, M. (2016). Behavior of plutonium in the environment. Russ. Chem. Rev. 85, 995–1010. doi:10.1070/RCR4602
Thoenen, T., Hummel, W., Berner, U., and Curti, E. (2014). The PSI/nagra chemical thermodynamic database 12/07.
Keywords: PuO2, solubility, dissolution, groundwater, seawater, concrete porewater
Citation: Cho H-R, Cho S, Kim J, Han S, Kim H-K and Um W (2023) Dissolution behaviors of PuO2(cr) in natural waters. Front. Nucl. Eng. 2:1118594. doi: 10.3389/fnuen.2023.1118594
Received: 07 December 2022; Accepted: 24 March 2023;
Published: 04 April 2023.
Edited by:
Michael Ojovan, Imperial College London, United KingdomReviewed by:
Tomo Suzuki-Muresan, UMR6457 Laboratoire de Physique Subatomique et des Technologies Associées (SUBATECH), FranceAnna Romanchuk, Lomonosov Moscow State University, Russia
Copyright © 2023 Cho, Cho, Kim, Han, Kim and Um. This is an open-access article distributed under the terms of the Creative Commons Attribution License (CC BY). The use, distribution or reproduction in other forums is permitted, provided the original author(s) and the copyright owner(s) are credited and that the original publication in this journal is cited, in accordance with accepted academic practice. No use, distribution or reproduction is permitted which does not comply with these terms.
*Correspondence: Hye-Ryun Cho, aHJjaG9Aa2FlcmkucmUua3I=