 B. Grambow
 R. Müller1
 X. Gaona
- 1Karlsruhe Institute for Technology, Institut für Nukleare Entsorgung, Karlsruhe, Germany
- 2SUBATECH, CNRS-IN2P3, Nantes University, IMT Atlantique, Nantes, France
Understanding of the properties of dissolution and precipitation of Uranium under reducing geochemical conditions is important in radioactive waste management and assessments of natural uranium deposits. The mechanism of forming UO2+y from U(VI) and U(IV) containing aqueous solution (1 M NaCl) and the solubilities of the precipitates were studied under well-controlled reducing conditions as a function of pH, particle size, and supersaturation. The results show that tetramer and colloid formation are critical initial steps. Precipitation is not growth-controlled but appears to be nucleation-controlled, with critical nuclei dimensions of one unit cell of UO2. The precipitates were always crystalline, and amorphous UO2 was not observed.
1 Introduction
The geochemical cycle of uranium, the stability of ore deposits, and its general distribution among mobile and immobile phases strongly depends on phase and species oxidation states and corresponding redox reactions. In natural geochemical environments, uranium exists almost entirely as U(IV) or U(VI). The low mobility of uranium is associated with the tetravalent state, with uraninite being the most abundant solid phase. Uraninite ore deposits are often stable for billions of years, provided that reducing conditions are maintained. By analogy, as a nuclear waste form for deep geological disposal, uranium dioxide is expected to be highly stable if reducing conditions are maintained. Under oxidizing conditions, uranium is soluble as a uranyl(VI) ion; in particular, carbonate complexation further increases uranium(VI) mobility, even under fairly strong reducing conditions (pe + pH < 5).
However, due to colloid formation, the tetravalent state of uranium also shows some mobility.
Well-performed experimental studies have established the thermodynamics of UO2 solubility with respect to dissolved tetravalent uranium species in the pH range 0–12 (Parks and et Pohl, 1988; Bruno et al., 1987; Rai et al., 1997; Cevirim-Papaioannou, N. 2018; Fujiwara et al., 2003). Uncertainty in thermodynamic solubility data remains, particularly under low-temperature (25 °C) conditions (Yajima and Kawamura, 1995). At ambient temperatures, solubility data under carbonate-free reducing conditions vary by as much as five orders of magnitudes for a given pH (Yajima and Kawamura, 1995). This difference was interpreted as resulting from different crystallinity (Bruno et al., 1987) or insufficient control of low redox conditions (Rai et al., 1990; Yajima and Kawamura, 1995). A further source of uncertainty is the oxidation state of uraninite. Pure UO2.00 can be oxidized rather easily to phases such as UO2+x, U4O9, or U3O7. All these phases have essentially the same crystal structure (fluorite), but their solubility as well as their dissolution rates can deviate by orders of magnitude.
The aim of this research was to study the transition from dissolved U(IV) to the formation of polymer and colloidal species and then to solid precipitates to study the properties of these precipitates, including the effect of particle size on solubility.
2 Experimental
2.1 Description of test procedures
Four types of solid/liquid interaction experiments were performed under reducing hydrogen saturated conditions, approaching solubility equilibria either from supersaturated or undersaturated conditions: 1) electrochemical reduction of an aqueous U(VI) solution to an U(IV) solution, followed or not by formation of a U(IV) precipitate; 2) solubility tests with U(IV) precipitates from test (1); 3) precipitation of U(IV) solid phases by alkaline titration of an initially acid U(IV) solution; 4) solubility tests with large UO2 particles. pH values and reducing conditions were always controlled by the counteraction of acidometric and coulometric titration. No precautions were taken to fix the pH at constant values if the reaction drove the pH in an acidic direction, such as due to precipitation or polymerization.
(1) Reduction experiments with UO2Cl2 in 1 M NaCl solutions were performed in the pH range 1–4. A new experiment was performed at each pH. The pH was held constant at ±0.05 pH units. In most reduction tests, the current being passed through the coulometric bridge was held at 1 mA, with a starting concentration of U(VI) of 0.005 m. Supersaturated conditions were slowly achieved by this coulometric reduction. In order to study the effect of U(IV) generation rates on the formation of U(IV) precipitates, the current in a few tests was varied between 0.05 and 1 mA (error ±0.1%). In order to study the effect of colloid growth or crystal growth on final U(IV) concentrations, starting concentrations of 0.01 and 0.001 m were also used in certain experiments. Experiments typically lasted a few days.
(2) In order to investigate whether the measured ultrafiltered U(IV) concentrations reflect thermodynamic equilibrium with respect to stable or metastable precipitates, solubility experiments were performed in the same reaction vessels after terminating the reduction reaction. The precipitate of a reduction experiment performed at pH 2.56 was therefore allowed to settle, and unsaturated conditions were established by replacing the supernatant solution with the help of an Ar-filled syringe by fresh deoxygenated 1 M NaCl solution without allowing the precipitate to dry or come in contact with oxygen. The procedure was repeated twice. The solubility test was then started under conditions of coulometric/acidometric control of reducing conditions and of pH. The uranium concentration increased in the fresh NaCl solution by dissolution of the precipitate. The increase of uranium concentration in the new solution was studied as a function of time until constant concentrations were obtained (3 days). Thereafter, the pH was varied stepwise to study the solubility as a function of pH.
(3) In another experiment, supersaturated conditions were achieved by alkali added to a 0.005 M UCl4/1 M NaCl solution (pH 0.2) until a selected pH was achieved. This experiment avoids the drawback of experiment (1), where some U(VI) may have been incorporated into the U(IV) precipitate. The entire experiment lasted 60 days, including the shift to pH 12 and, thereafter, the return to pH 0.
(4) For comparison, solubility tests were performed for 60 days with high bulk purity UO2.00 of 100–200 µm size using depleted uranium. This material had been stored as pellets for some years in air, which may have caused surface oxidation of a few monolayers. The powder was cleaned in an ultrasonic bath in acetone to remove adhering fines and was placed under Ar into the reaction vessel. Based on the geometric surface area of the powder (0.04 m2/g), a ratio of surface area to solution volume of S/V = 40 m−1 was adjusted. The experiment was commenced at pH 2.5, and the pH was varied both in acid and alkaline directions. The supernatant solution was replaced twice by fresh solution to test the equilibrium state of the solid/liquid system and to dissolve potentially remaining U3O7 surface layers. The whole experiment lasted 60 days.
2.2 Description of equipment
All experiments were performed in 50–100 mL of 1 M NaCl solution placed in a double-walled reaction vessel made from borosilicate glass. A scheme of the reaction vessel is given in Supplementary Figure S1.
The vessel was equipped with five ground glass neck joints for introducing Teflon capillary tubing (inner diameter 0.3 mm) for acidometric titration, a pH-electrode, a salt bridge, a platinized Pt-counter electrode combined with an Ar-gas inlet, and a sampling port for solution samples. The temperature was held constant at 25.0 °C±0.1 °C using a K20/DC1thermostat (Fa. Haake). Coulometric titrations were performed using a mercury electrode connected to the reaction vessel via a 1 M NaClO4-filled salt bridge. The salt bridge was filled with 1 M NaClO4. After passing 5·10−3 F through the bridge, the Hg had to be regenerated (alternate washing with 10% NaOH and 10% HCl); due to the formation of white crystals, the NaClO4 of the bridge had to be replaced. The counter electrode consisted of Pt–Rh mesh enclosing the Ar-gas inlet. Finally, the sampling port consisted of a stopcock connected to a pipe tee with ends closed by septa.
The coulometric titration was controlled either by a constant current source type 6402 (Fa. Burster) with a maximum error of 0.1% or using a DIGISTAN® Typ 6705 (Fa. Burster) calibration source with an error of 0.2% at 1 mA and 2% at 0.1 mA. Coulometric titration leads to both reduction and alkalization of the solution. In order to perform reductive titration at a fixed pH or at a sequence of preselected pH-values, alkalization was counterbalanced by acidimetric pH-stat titration using a Titroprocessor 686 with a Dosimat 665 (both Fa. Metrohm).
2.3 Stability of reducing media
Even traces of oxidants will cause oxidation of dissolved U(IV) to U(VI), so experiments with U(IV) species must be performed under conditions which exclude all oxygen access. This is ensured in the present work by performing the experiments in nearly closed reaction vessels under a permanent stream of 4 L/h of 99.999% pure Ar. Prior to passing into the reaction vessel, the Ar was passed through three washing bottles: the first contained a blue solution of ammonium vanadate in HCl over Zn-amalgam to remove traces of oxygen in the gas. V(V) was regenerated if the vanadate had been oxidized to green V(VII). The second and third wash bottles contained 1 M NaCl to ensure that the relative humidity of the Ar-stream was in equilibrium with the water activity in the reaction vessel to avoid water evaporation or condensation during Ar-bubbling. Since this bubbling may not have been sufficient to remove all leaking oxygen, the solutions were permanently titrated coulometrically using a current of 0.05–1 mA. This should ensure the immediate reduction of any leaking oxygen.
Special precautions were taken to maintain reducing conditions during the introduction of solid and liquid phases into the reaction vessel, as well as during sampling, transfer, and the use of samples in the various analytical procedures.
• Oxygen-free NaCl solutions, U(VI) containing NaCl solutions, and HCl solutions for acidometric titration were prepared by boiling 1) nanopure water for 3 h in an Ar stream in a quartz vessel and 2) passing the oxygen-free water by Ar pressure via liquid transfer lines into an Ar-containing stopcock-sealed storage flask. Oxygen-free conditions in the flask were ensured prior to introducing oxygen-free water by alternating evacuation and flushing by Ar gas. From the storage flask, oxygen-free water was transferred by Ar pressure via liquid transfer tubes into similarly prepared flasks previously filled with either a weighted aliquot of solid NaCl (p.a. quality) with an aliquot of a uranyl chloride solution, or with HCl. The flask was located on a balance to allow the accurate adjustment of target concentrations. The resulting solutions were analyzed for U (ICP-AES). Errors in the starting concentrations were below 0.5%. Finally, the oxygen-free uranyl ion containing NaCl solutions were transferred by Ar pressure via liquid transfer lines through a septum into the reaction vessel (sampling port).
• Solution and solid sampling during the experiment or at test termination was also performed under inert conditions. This is true for non-filtered samples, for solutions filtered by 0.45 µm membranes, and for ultrafiltered solution samples. Solution sampling was facilitated via an Ar-filled syringe attached to an inline membrane filter (pore size 0.45 µm), a two directional stopcock, and a Teflon capillary that intersected the septum of the sampling port. An aliquot of the 0.45 µm filtrate was transferred by this system directly under Ar into the ultrafilter unit (Centrisart cut-off 20.000, Fa. Sartorius) prior to being centrifuged for 5 min.
• In case of precipitation, suspended samples of the solid phase were collected on the 0.45 µm filter membrane. The precipitate was washed twice with 10 mL water to remove NaCl contents. No precautions were taken to avoid oxygen access during the washing of the solid precipitates, but, after few minutes, the filters with the solid samples were dried and stored in a desiccator over CaCl2 in an Ar atmosphere. However, this precaution may not have been sufficient to prevent surface oxidation of the precipitates detectable by XPS analyses (see chapter 3.6.4). Therefore, in the case of solubility experiments with large UO2 particles, the reaction vessel was opened in an inert gas box (impurities of 15 ppm of O2) to prevent oxidation of the UO2 surfaces. After washing off the adhering NaCl solution, the samples were pressed in their wet state into a foil of indium and were transferred under inert gas conditions into the vacuum chamber of the XPS.
2.4 Analytical procedures
2.4.1 Solution analyses
Online pH measurements were performed during the experiments. A combination electrode System Ross (SC 8162) was used, filled with 1 M NaCl solution. This electrode is highly stable in saline solutions and small time drifts. Electrode calibration was performed using NIST-standard solutions. For pH levels close to 0, a 1 M HCl solution was used as reference. A pH of 0.24 with respect to the NBS-pH convention was calculated with the geochemical code EQ3/6 (Wolery, 1983; Scherbaum and Knopp, 1996). The electrode calibration procedures were adapted to the experimental setup. In case of the reduction of a U(VI) solution at a fixed pH, two-point calibration within one pH unit was performed, whereas if the pH varied between 0 and 12, calibration was performed using seven pH buffers. The deviation of a single buffer from a straight-line calibration curve was always less than 0.03 pH units. If an experiment lasted up to 5 days, only one calibration at the beginning of the test was sufficient. In experiments with pH variations between 0 and 12, the duration of the test was up to 2 months. In this case, the calibration was checked at test termination, using the same buffer solutions as before. An average drift of +0.18±0.05 pH units was observed after 2 months. Drift correction was made assuming a linear drift increase with time at a rate of 0.003/d. All pH values measured were corrected for liquid junction and were referred to the pH convention pH≡log mH+—log γH+≡1. Correction was made by the equation pHcorr = pHmeas + ΔpH with a ΔpH value of 0.06 determined using the NIST-buffer calibrated electrodes in 1 M NaCl solutions with a known molality of H+.
Solution samples for determining total U-concentrations were acidified prior to analysis. Solution concentrations of uranium >10−4 m were analyzed by ICP-OES (ARL 3580), and lower concentrations by ICP-MS (PerkinElmer Elan 6000). The introduction of highly saline solutions into the ICP-mass spectrometer will cause mechanical blocking of the sampler and skimmer cones. The analysis of uranium in saline solutions, therefore, is made by flow injection. Only 100 µL of a 1:5 diluted sample was injected into the ICP-MS. Physical and chemical interferences generated by the salt matrix were corrected by using Lu-175 as an internal standard.
To determine solution speciation and to check the completeness of the reduction process and the efficiency of inert solution handling procedures, U(IV)-containing solutions in the pH range 0–2 were analyzed by UV-VIS spectroscopy in a glove box with 100% Ar atmosphere and an oxygen content lower than 10 ppm. A sample holder with a 1 cm quartz cuvette was therefore placed in the glove box and connected to a CARY-5E spectrometer (Varian) outside the box via an optical fiber system. The spectra were taken in the wavelength range 300–750 nm and evaluated using GRAMS software (Galactic). In certain cases, the evolution with time of solution speciation was followed over more than 14 days.
2.4.2 Colloid analyses
Colloids formed during the reduction of U(VI) solutions were analyzed using both ultrafiltration and laser breakdown detection (LIBD). By focusing a laser beam with sufficient power on or into the probe, a plasma can be generated. The critical power density to produce a plasma—the breakdown threshold—is much lower for solids than for liquids (Radziemski and et Cremers, 1989; Bettis, 1992). Thus, if the laser pulse power density does not exceed the breakdown threshold of the aqueous phase, the plasma is generated almost exclusively on the colloids. As shown in the literature, the breakdown probability under constant experimental conditions depends on the number, density, size, and material of the colloids (Kitamori et al., 1989; Fujimori et al., 1992; Scherbaum and Knopp, 1996). Colloid sizes as low as a few nm can be detected (Bundschuh et al., 2001).
The experimental setup of the LIBD system is shown in Supplementary Figure S2. A pulsed Nd-YAG laser (Continuum; Surelite I) frequency doubled at λem. = 532 nm with a pulse length of 12 ns and a repetition rate of 20 Hz was used. The energy of the laser pulse is adjusted by a variable attenuator. A breakdown-induced acoustic wave is measured by a piezoelectric detector (PZT) directly attached to the cuvette wall. The spatial distribution of the plasma light emission is monitored by a CCD camera system triggered by the laser pulse using a macro-microscope. This yields, in addition to the acoustic signal of the pressure wave, information about the size distribution of the particles in solution. Colloid sizes as low as 10 nm can be detected.
The LIBD-analyses were performed on U(IV)-containing solutions formed by the reduction of U(VI) solutions at pH values between 1.66 and 1.76 (experiment type 1). The same Ar-filled cuvettes from UV-VIS spectroscopy were also used for LIBD analyses to allow comparison. Colloid formation was followed in the cuvette as a function of time.
2.4.3 Solid-state analyses
The morphology and composition of solid precipitates were determined by SEM/EDX analysis. To obtain the required high resolution of 10 nm, an SEM (CAMSCAN FE-44) with a Schottky emitter source was used.
XRD analyses were performed to determine the crystal structure of the precipitate and estimate the particle size of the precipitates. The powder samples for X-ray diffraction analyses were prepared either by spreading the fine-grained uranium powder over a flat sample holder or by analyzing the precipitate-containing filters directly. By using a theta–theta powder diffractometer Seifert XRD 5000 with a graphite secondary monochromator and Ni-filtered Cu Kα (λ = 1.5406 Å) radiation, the sample remained in a horizontal position during measurement. X-ray investigations were performed in step-scan mode over the range 2θ = 10°–65° in steps of 0.02°, with a counting time of 2 s/step. The voltage applied was 40 kV and the current was 30 mA (fixed divergency, scatter slits of 1°, receiving slit of 0.2 mm). To improve particle statistics, the sample was rotated using a sample spinner.
The broadening of the diffracted line profiles can be used to estimate mean crystallite dimensions. The width β of a line profile at half maximum (FWHM) is given by the Scherrer relationship
where K is the crystal shape factor (∼1), λ is the wavelength, β is the line broadening (radian) derived from the measured width and corrected for instrumental broadening, θ is the diffraction angle (radian), and D is the average particle dimension.
From the equation, it follows that, for particle sizes approximately below 50 nm, the broadening of the diffraction lines increases strongly and, conversely, the method is very sensitive for small particles <500 Å. Particle size determination by X-ray diffraction does not necessarily agree with the real or microscopic size. Only the coherent diffracting domains are determined by X-ray diffraction. The line broadening can also be increased by lattice strains, which result from displacements of the unit cells and by crystal defects, such as stacking disorder in montmorillonite. In the case of the sample material studied, such broadening effects can be excluded.
In order to determine uranium oxidation states and water/hydroxide contents of the solid phases and their surfaces, analysis by XPS (PHI Model 5600ci) was performed using the monochromatized X-ray radiation Al Kα (1486.7 eV). Transfer of solid UO2 particles (experiment type 4) was performed for all steps in an Ar atmosphere. The diameter of the sampling areas was 0.4 or 0.8 mm. No charging of the sample during measurement was observed. To identify and quantify the elements, survey scans were determined at high pass energy of the analyzer (187.85 eV). Atomic concentration was determined with 10%–20% of relative uncertainty. In order to determine binding energies, the energy resolution of the analyzer was increased by reducing the pass energy to 11.75 eV. The full width half maximum (FWHM) of the Ag 3d5/2 elemental line of pure silver was then 0.62 eV. The binding energy scale was calibrated by reference lines of Cu 2p3/2, Ag 3d5/2, and Au 4f7/2 of the pure metals determined with the same measurement parameters.
Transmission electron microscopy analyses (TEM) were performed with two devices: the TEM EM 400 (Philips) was used with HV = 120 kV, and HRTEM analyses were performed using the CM12 (Philips) with a Super Twin Objective Lens, HV = 120 kV, a point resolution of 3 Å, and a line resolution of 1.4 Å.
Solid samples were analyzed by TEM without precautions against surface oxidation. They were stored under Ar but were exposed to air during shipment and sample preparation for approximately 3 days. The precipitated powder was removed from the filter membrane by cutting an area of 2 mm × 2 mm from the membrane, dissolving it in 1 mL p.a. acetone in an ultrasonic bath for 4 min, centrifuging it for 5 min at 6000 U/min in a Eppendorf centrifuge 5415C, and washing four times with 1 mL acetone (4 min ultrasonic bath, 5 min centrifugation); then, after decanting the acetone, the wet residue was homogenized in an ultrasonic bath and a drop of it was placed onto a carbon-coated Cu-grid (200 mesh) for analysis.
3 Results
3.1 Reduction of water and oxygen in the reaction vessel
The coulometric reductive decomposition of water molecules leads to an alkalization of the solution, which is balanced by acidimetric titration. In the absence of uranyl ions or after completely terminating the reduction of uranyl ions, slopes m = Δ(equivalents added acid)/ΔFaraday close to unity were determined between pH 2 and 11 with correlation coefficients between coulometric and acidometric additions between 0.99 and 0.9999 (Supplementary Figure S3).
There are two reactions in the absence of uranyl ions, both of which require one equivalent of acid added per mole of electron transfer for pH stat conditions; the reduction of water according to the reaction was
and the reduction of possibly remaining traces of dissolved oxygen was according to
3.2 Reduction of U(VI)-containing solutions (experiment type 1)
In the presence of uranyl ions, slopes m between 2 and 0 were observed. The results for various pH levels are given in Supplementary Figure S4. Slopes m of 0 were observed once precipitation was encountered. A typical titration curve for precipitation at pH 2.5 is given in Figure 1. Initially, a 1 M NaCl blank solution was reduced to remove potentially remaining oxygen. After adding 7.2·10−5 F, an aliquot of deoxygenated UO2Cl2 solution was added to achieve a U concentration of 0.005 m. Further addition of up to 7.8·10−5 F led to a reduction of U(VI) to U(IV) in the solution phase. The slope m was 0.24. Addition of a further charge led to precipitation of black U(IV) containing phases and a slope of zero. Finally, after all U(VI) was again reduced, a slope of unity was achieved. It can be seen that the onset of precipitation can be monitored by the changes of slopes m = Δ(equivalent added acid)/ΔFaraday.
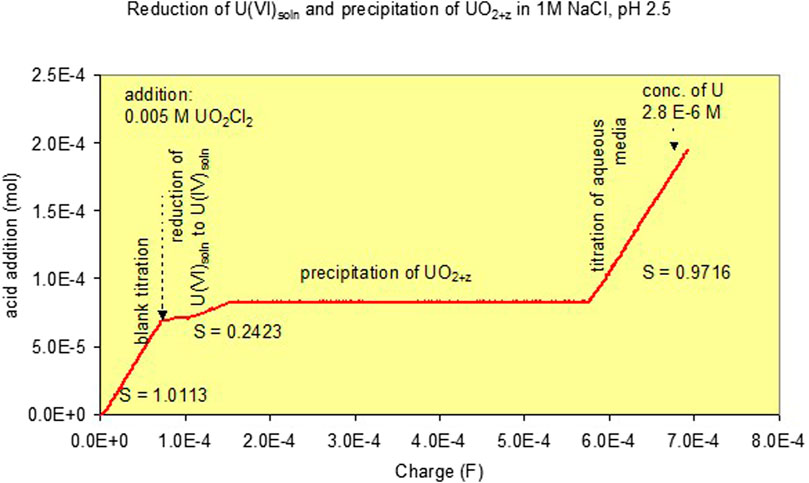
FIGURE 1. Curve for combined volumetric pH stat and coulometric titrations to a 1 M NaCl solution at pH 2.5. Effect of the addition of 0.005 m U(VI) and its reduction and precipitation as UO2+z [Experiment (1)].
The heterogeneous reduction leads to U(IV) oxide precipitation principally according to the following reaction:
which would not lead to any change in pH. Considering mass balance, 2 Faradays would have to be used for 1 mole of UO2(s) formation. Alternatively, U3O7, or U4O9, or UO2+y in general may have been formed with y being 0.33 for U3O7 and 0.25 for U4O9:
This reaction would lead to an acidification of the solution. However, no precautions were taken for alkalimetric titration to fix the pH. Consequently, the pH would decrease until the reduction was completed. In the plot Δ(equivalent added acid) versus ΔFaraday, this would result also in a slope m of 0.
A variety of reactions are possible for homogeneous reduction in solution phase, which lead either to U(V) or U(IV). The reduction to U(V) is only possible in the acid range because, under alkaline conditions, U(V) is not stable. Under acidic conditions, only the free non-hydrolyzed uranyl(V) ion is stable (UO2+) as intermediate species and reduction may thus be described by a single reaction:
This process does not require the addition of acid to keep the pH constant. The reduction of an intermediate U(V) to U(IV) would require 4 moles of acid addition per mole of electron transfer:
In contrast, the direct reduction of U(VI) to U(IV) under strongly acid conditions leads to U4+ and requires two equivalent additions of a strong acid per mole of electron transfer.
More generally, considering hydrolysis of U(IV), the general direct reduction from U(VI) to U(IV) can be written as
(4−n)/2 moles of strong acid are required to keep the pH constant during the reduction process, whereas the reduction of an intermediate U(V) species would require 4−n moles of strong acid. In this equation,
The corresponding solution concentrations of dissolved U(IV) are shown in Figure 2 as a function of pH, comparing both filtered, ultrafiltered, and non-filtered solutions. Included in the diagram are the critical supersaturation concentrations Ccr of U(IV) necessary to be achieved before precipitation of U(IV) is observed. Ccr values are determined by half of the charge added (in Faraday) before slope m turns to 0. Precipitation was observed only at pH values >1.95. At lower pH, the critical supersaturation concentrations were higher than the initial U concentration. This means that, even if all U(VI) is reduced, there is still insufficient U(IV) to allow precipitation in 1–2 days. For pH values higher than 1.95, the Ccr values decrease with increasing pH, and, at pH 3.96, precipitation occurred almost instantaneously with the start of the reduction reaction. At pH > 2.1, constant concentrations were observed in the ultrafiltrate samples. The low value at pH 1.95 appears to be an artifact, but repeated analyses gave the same results. Based on sequential filtration comparison, the quantity of colloids (difference between 0.45 µm and 1.8 nm filtrate) decreases with pH, potentially indicating pH-dependent coagulation phenomena.
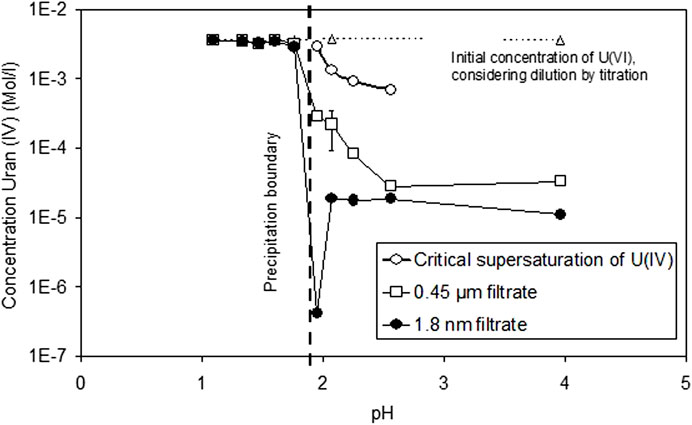
FIGURE 2. Solution concentrations of dissolved U(IV) as a function of pH, comparing both filtered, ultrafiltered, and non-filtered solutions. Critical supersaturation concentrations of U(IV) before precipitation are observed.
An important parameter in the precipitation process is the rate by which the Ccr values are exceeded. This rate was changed by changing the current passing through the coulometric bridge. Supplementary Figure S5 shows the effect of the coulometric current on final U concentrations after terminating the reduction process at pH 2.56 with a starting concentration of U(VI) of 0.005 m.
Increasing currents led to slightly higher supersaturation (pH 2.6: 6.9⋅10−4 M at 1 mA versus 6.0–6.3⋅10−4 M at 0.05–0.1 mA) due to the faster formation of U(IV). They also led to in an increase in the final U-concentration (at pH 2.6 1.8⋅10−5 M at 1 mA instead of 5(±2.5)⋅10−6 M at 0.05–0.1 mA) associated with smaller particle sizes and larger solubility (see discussion of the effect of particle size on solubility in chapters 3.4 and 3.5 and in Figure 12). In an attempt to increase particle size (and decrease solubility equilibrium concentrations), the starting concentration of U(VI) was varied. This had no effect on final U-concentrations (data not shown). Consequently, final U(IV) concentrations are controlled by the degree of supersaturation prior to precipitation (nucleation control) and not by the quantity of U available for particle growth (growth control).
3.3 Solubility of precipitates formed by U(VI) reduction (experiment type 2)
In order to check whether final U concentrations from Experiment 1 represent equilibrium concentrations, fresh precipitates formed at pH 2.56 were dissolved at the same pH in fresh 1 M NaCl solution continuing coulometric titration and counterbalancing acidometric titration to study the solubility of the precipitates (Figure 3). After 2 h, U concentrations of 2.3·10−6 m were already achieved, returning almost to the value of 2.8·10−6 m achieved in the initial reduction experiment. This indicates equilibrium with respect to the precipitated phases. After three more days, the solution concentration decreased slightly to a value of 1.7·10−6, probably caused by the precipitate's ripening. Thereafter, the pH was first decreased to a value of 2.05 and then stepwise increased to pH 10, leading in the neutral to slightly alkaline pH range to U concentrations well below 10−8 m. The experiment lasted 20 days.
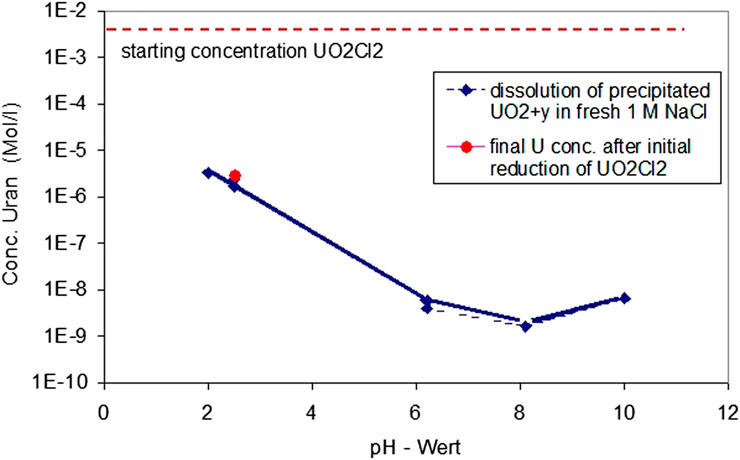
FIGURE 3. Study of the reversibility of the solubility equilibrium of the precipitates by redissolution at the same pH and solution composition of precipitates formed 1 M NaCl solution at pH 2.56, continuing coulometric titration and counterbalancing acidometric titration.
3.4 Precipitation from acid U(IV) solutions and solubility of precipitates (experiment type 3)
A characteristic of the reduction experiments (type 1) is that the reaction path often passes the stability field of higher oxidation states first, such as U4O9 and U3O7, prior to entering the stability field of UO2. This is shown in Supplementary Figure S6 for the coulometric reduction/precipitation at pH 2.56, using an Eh/pH diagram calculated for the starting concentration of dissolved U(VI) of 0.005 m. Thus, the path of the coulometric reduction reaction at pH 2.56 will not go directly from the uranyl ion to uraninite, but the first stable phase is U4O9. However, the calculation in Supplementary Figure S6 is for well-crystalline phases. The exact position of phase boundaries will vary with crystallinity/particle size.
In order to minimize the presence of U(VI) in the formed solid phases, the solubility of precipitates was studied, formed by stepwise alkali added to initially acid U(IV) solutions (starting pH 0.3). Precipitation here occurs only after all U(VI) has been transformed into U(IV). Using this procedure, the evolution of U concentrations at the start of the precipitation process is shown in Figure 4. At pH 1.5, the U concentrations started to decrease with time. Hence, the first signs of precipitation occurred at approximately 0.4 pH units earlier than in case of direct coulometric U(VI) reduction (experiment 1).
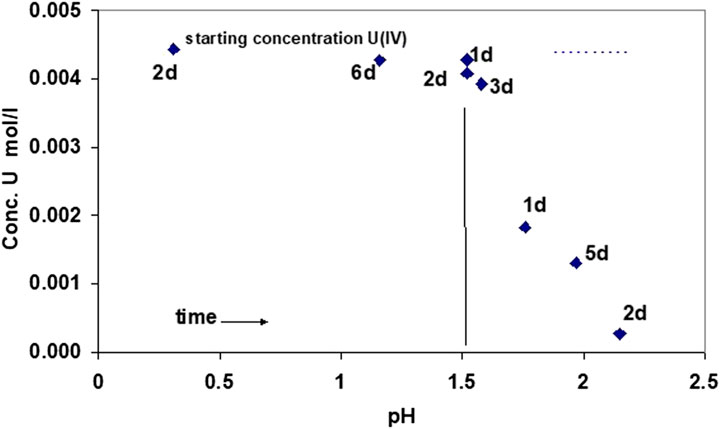
FIGURE 4. Evolution of U(IV) concentrations as a function of time and pH, adding a NaOH solution to a solution of U(IV) at an initial pH of 0.31. Precipitation starts at pH 1.5, as measured by decreasing U(IV) concentration in solution.
The kinetics of this growth process were also studied by monitoring the pH evolution in the reaction vessel. The solutions became slightly more acid. Acidimetric titration did not work to fix the pH. The maximum deviation in pH was 0.1 pH units. This pH evolution is assessed further as the initial steps of the precipitation process.
At pH 1.7, precipitation started to become more pronounced. Solution concentrations at higher pH values are shown in Figure 5. Arrows denote the direction of pH change. As in Experiment 1, strong precipitation occurred at approximately pH 2. Apparent equilibrium solution concentrations of U at pH 2.56 remained higher than in direct reduction of U(VI). A minimum solution concentration of U is attained at a pH of approximately 6–8. The subsequent increase of U concentrations at higher pH values cannot be explained by known data of U(IV) hydrolysis and may be attributed to oxygen contamination of the precipitates or of the aqueous solution (discussed chapter 3.5). The return to lower pH values leads to U concentrations much lower than those initially observed when the pH was changed in an alkaline direction. U concentrations increased with a slope of −1.3 with decreasing pH. These data do not reflect an equilibrium of stoichiometric UO2, neither with U4+ nor with U(OH)3+. At pH 0, the whole precipitate became dissolved again. In the pH range 2–3, the data are very similar to the data for 1 M NaCl solution in Rai et al. (1997), who derived from these data the thermodynamic solubility of so-called hydrous UO2(am).
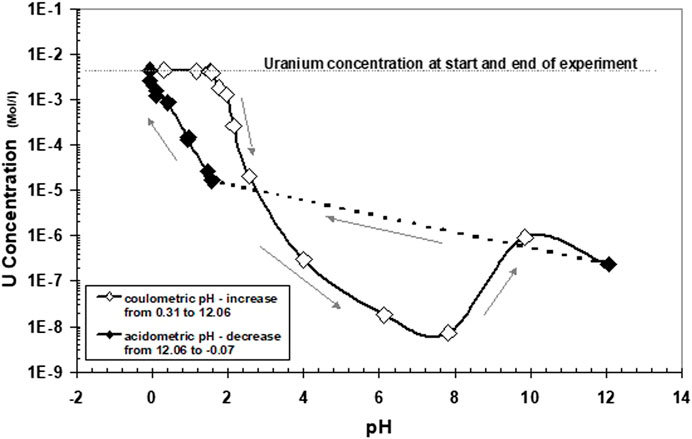
FIGURE 5. Same experiment as described in Figure 4, showing solution concentrations at higher pH values. Arrows denote the direction of pH change.
3.5 Solubility of 100–200 µm UO2 particles (experiment type 4)
For comparison and as reference for particle size effects, solubility tests with crystalline UO2 were performed under the same conditions as the solubility tests with the precipitates formed by coulometric reduction. The results of ultrafiltered solution samples are given in Figure 6. A minimum solubility was observed in the pH range 6–10. The increase in solution concentration at higher pH can be explained by the formation of a surface oxidation film (see below). Almost constant concentrations were achieved between pH 0 and 2. This is caused by the slow dissolution rates of UO2 at pH 2. The duration of acidometric titration was too short for some weeks and the surface area of particles (approximately 0.001 m2/L of solution) too small to allow the dissolution of sufficient U(IV) to approach the solubility limit of UO2+y.
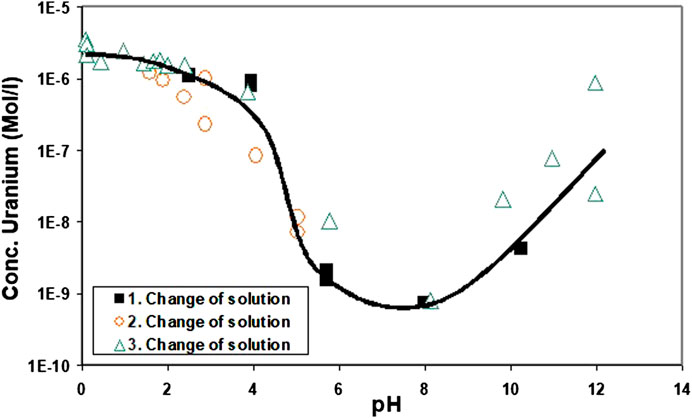
FIGURE 6. Ultrafiltered solution samples resulting from solubility tests with pure 100–200 µm UO2 particles. The tests were performed under similar conditions as those with the precipitates formed by coulometric reduction.
After the third change of the supernatant solution, the experiment started again with fresh solution and permanent coulometric reduction at pH 0. It was expected that this would effectively remove any potential oxidized surface layer still adhering on the UO2 powder. However, at pH 0, the solution concentrations decreased with time (for 3 days). This was surprising since, at this pH, the solution was expected to be undersaturated with respect to pure UO2 and even more with respect to more oxidized surface layers. Under alkaline conditions, the solution concentration from the pH excursion after the third exchange of supernatant solutions was higher than during the first cycle. A possible explanation would be the fresh solution containing traces of oxygen introduced into the reaction vessel to cause U(VI) formation.
3.6 Results from solid-phase characterization
3.6.1 X-ray diffraction
X-ray diffraction patterns were obtained from three precipitates formed during the reduction of U(VI) at pH 2.56 (Supplementary Figure S7). The broadest lines were observed under conditions of high coulometric currents of 0.5 mA (high rates of U(IV) formation), and the finest lines were observed in experiments with slow reduction rates using 0.05 mA. A comparison was made with the powder pattern of pure UO2.00 used in the solubility tests. This pattern closely matched the values reported in the literature for UO2.03 (JCPDS-ICDD No. 13-0225, 1996). The precipitates show strong line broadening, yet the major peaks of uraninite remain clearly visible, indicating that crystalline rather than amorphous UO2 had formed. Note that we considered here the UO2 crystalline, even if the coherence length was only a few nm.
The oxidation of stoichiometric uraninite results in a decreased unit cell dimension of 5.47 Å for UO2.00 to 5.44 Å for U4O9. The line broadening does not allow the accurate determination of the structure of the precipitates, but peak analyses of the 111 peak (peak at 2θ = 28–29) indicates a cell dimension of 5.43 Å, closely resembling the U4O9 unit cell. U4O9 has a small reflection at 2θ = 58.8. No indications for U3O7 formation were found (absence of a peak shoulder at 2θ = 55.1). The formation of U4O9 is consistent with the thermodynamic calculations given in Supplementary Figure S6: at pH 2.56, the reaction path for reduction of U(VI) intersected only the stability field of U4O9 and not of U3O7. The average particle size of the precipitate was estimated from the line broadening. Particle sizes were found in the range of 6–13 nm at pH 2.56 (see discussion chapter 4.4 on the effect of particle size on solubility). It is important to note that the particle size of the UO2 precipitates was significantly smaller than that of crystalline (pure) UO2 of 100–200 μm.
3.6.2 SEM analyses
Precipitates formed during coulometric reduction were analyzed under SEM to obtain a first image of the morphology. Spherical particles were typically observed. An example is precipitates collected on a filter membrane, given in Supplementary Figure S8 for precipitates formed at pH 2.25. At pH 2–2.5, the average particle sized was 30–60 nm, whereas it was close to 100 nm at higher pH values. The SEM images were not sufficiently clear to rule out agglomerates of smaller particles being formed and thus explaining the difference with the X-ray-determined particle sizes.
3.6.3 HRTEM analyses
Two samples of solid precipitate were selected for TEM and HRTEM analyses. The first precipitate was formed during coulometric reduction of 0.005 m U(VI)-containing solution at a constant pH of 2.5; the second was formed after reduction under acidic conditions and subsequent coulometric alkalization of the solution (experiment type 3). In the latter case, the precipitate was formed at approximately pH 2 (Figure 4) and the sample was taken after pH excursion to a value of 12. The results are given in Figure 7 and Supplementary Figure S9. Clearly, crystalline phases are formed in both cases: in the first, with a size of approximately 30 nm, in the second case, only 4 nm. The reasons for this difference will be further discussed below. Using TEM analyses (diagrams not shown), attempts were made to determine whether the observed particles from the coulometric reduction experiment are representative or were only arbitrarily encountered. It appears that a large fraction of particles were 30 nm in size; however, there were also many more larger particles of approximately 100 nm, similar to those encountered during SEM analyses. This is important for studying the dependency of solubility on the particle size of the precipitated material: if two size fractions coexist in the precipitate, the smallest particles will determine the overall solubility as long as the precipitate has not completely dissolved.
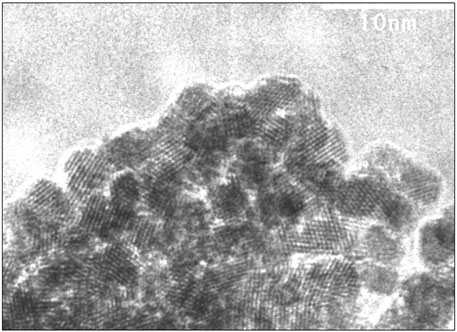
FIGURE 7. HRTEM analyses of precipitate formed after reduction under acidic conditions and subsequent coulometric alkalization of the solution (experiment type 3). Precipitation started at approximately pH 2, and the sample was taken after pH excursion to a value of 12, showing a particle size of approximately 4 nm. The 111 direction is visible with d-spacings between 3.06 and 3.18 Å, corresponding to unit cell parameters between 5.38 and 5.50 Å.
The lattice fringes of the precipitated crystals most closely match those of UO2 or similar fluorite type phases like U4O9 or U3O7. In Figure 7, the 111 direction is visible with d-spacings between 3.06 and 3.18 Å, corresponding to unit cell parameters between 5.38 and 5.50 Å. The accuracy of the electron diffraction data is not sufficient to determine the oxidation state of the precipitate.
There is obviously no slow transition from initially formed amorphous phases to more crystalline phases, but crystalline phases are very quickly formed almost directly by precipitation. With these data, one may question whether phases denoted in the literature as UO2(am) or U(IV)-hydrous oxides really exist. Many solubility studies use so-called precipitated amorphous UO2 (e.g. Bruno et al., 1987; Rai et al., 1997) as characterized by almost structureless X-ray diffraction patterns. The present study suggests that the X-ray amorphous phases used in those studies may have really been very small crystalline phases similar than those of Supplementary Figure S9. An average particle size of 4 nm will essentially give the appearance of an amorphous X-ray diffraction pattern. This particle size corresponds to a molar surface area of UO2 of approximately 36,000 m2/mol, much higher than the value of 7,954 m2/mol reported by Bruno (1989) for “amorphous” UO2. Consequently, one must study the effect on solubility of particle size and not of crystallinity vs. amorphous behavior.
3.6.4 XPS
High resolution XPS investigations of the U 4f7/2 elemental line of precipitates from reduction experiments at pH 2.56 (current 0.05 mA) show slight asymmetry at the high-binding energy side (Supplementary Figure S10) compared to the U 4f7/2 elemental line of certified UO2 (IRMM No. CBNM106) fractured under UHV inside the XPS as reference. This slight asymmetry can be assigned to less crystallinity of the fine precipitate compared to UO2 bulk. No additional satellite is observed which may indicate presence of U(V) or U(VI). The O1s spectrum indicates the presence of hydroxide and water.
An UOx precipitate formed at pH 2.5 was collected on a filter and imprinted onto indium foil (as substrate for XPS). The sample showed very low oxidation, if any, compared to the fractured UO2 sample; some H2O/OH was present at the O 1s spectrum. An anhydrous oxide appears to have been precipitated from the solution covered with only few monolayers of hydroxide surface groups. Samples from solubility testing with crushed UO2 pellets clearly show some oxidation. It is well known that even short contact to air will cause UO2.0 oxidation to UO2+x.
3.7 Results from a spectrophotometric study
It is already apparent that pH-dependent changes in the color of the solution in the reaction vessel were observed in the acid range after terminating the reduction process. The observations are summarized in Table 1.
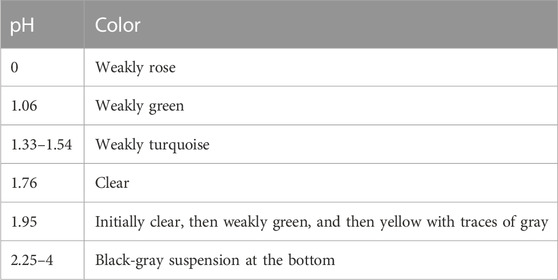
TABLE 1. pH dependence of the color of the solution in the reaction vessel after terminating the reduction process.
UV/VIS absorption spectra were taken from U(IV)-containing solutions immediately after completing the reduction reaction (experiment type 1) in the pH range 0–1.7 (Supplementary Figure S11). The spectra could be interpreted as being composed of two monomer species: U+4 and UOH+3. With increasing pH, the spectra show a decrease in the U+4-peaks at 671, 649, 549, 495, and 430 nm, an increase in the minimum between the peaks, and the growth of a new shoulder at approximately 614 nm associated to UOH+3 formation. The spectra in Supplementary Figure S11 are very similar to those reported between pH 0.7 and pH 2.2 in perchlorate media with identically positioned peaks (according to Table 2 and Figure 1B in Cha et al., 2020). Comparing at the peak of 649 (or 648 nm in the literature) the reported ε(cm−1·M−1) = 66.5 ± 1.8 (Table 2 of the authors) in the perchlorate medium with a value of ε(cm−1·M−1) = 45 ± 2 obtained in the present work for chloride media, we can explain the decreased absorption by the coexistence of U(IV) chloride complexation. Indeed, by using the stability constants reported in Grenthe et al. (2020), UCl+3 complexes should be dominant (65% when applying PHREEQC with SIT coefficients—see details of calculations chapter 4.1) in this system. It is notable that no increase of absorption at wavelengths <400 nm is observed, indicating the absence of polymerization. The degree of contamination by remaining or regenerated U(VI) is difficult to assess because the extinction coefficients are very small. The extinction at 404 nm between 0.001 and 0.005 indicates U(VI) concentrations between 1 × 10⁻⁴ and 1.4 × 10⁻³ M.
An enlargement of the absorption peaks shows an isosbestic point at 623 nm (Figure 8) which is indicative of the presence of only two U(IV) species of U+4 and UOH+3 (Cha et al., 2020). Indeed, the spectra and isosbestic point are similar to those reported for perchlorate media (Figure 2B in Cha et al., 2020). The similarity of our spectra with the literature data in perchlorate media indicates that ours are not influenced by chloride complexation. By peak deconvolution at the various pH values and ignorance of potential U(VI) contributions, concentrations of UOH+3 were determined which resulted in a conditional formation constant of UOH+3 of log *ß1(1 M NaCl) = −1.44 ± 0.06. If potential U(VI) contamination is corrected for, a log *ß1 value of −1.58 ± 0.15 is obtained. The latter value agrees well with the first hydrolysis constant determined by Kraus and Nelson (1950) under analogous experimental conditions: log *ß1(1.03 M Na/HCl) = −1.73. Note that this reference was considered in the NEA-TDB review by Grenthe et al. (1992) for the extrapolation to I = 0 and selection of log *ß.1 = −0.54 ± 0.06.
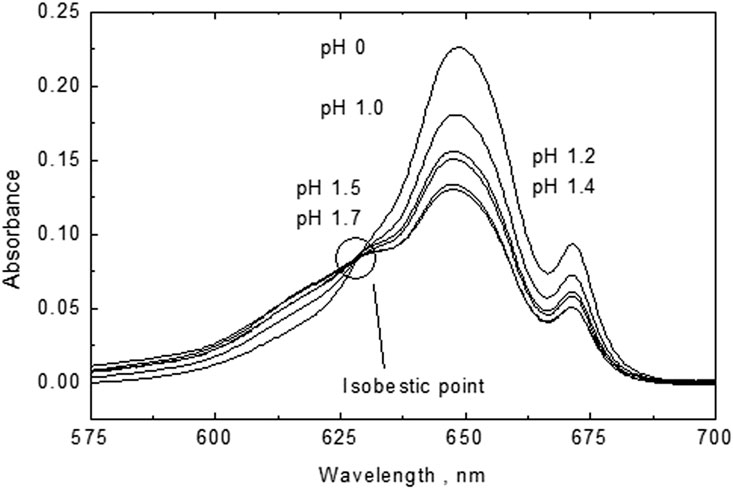
FIGURE 8. An enlargement of the absorption peaks showing an isosbestic point at 623 nm indicative for the presence of only two U(IV) species: U+4 and UOH+3.
3.8 Polymer formation with time
The evolution of U(IV) absorption spectra with time was studied for 15 days at pH 1.66. As indicated by increased absorption in the range 300–700 nm (diagram not shown), strong polymerization was observed after 14 days. “Polymerization” is used here in a generic form starting from dimerization, as no detailed polymer analyses were performed. A decrease in the U(IV) concentration from 3.1 × 10⁻³ M to 2.2 × 10⁻³ M probably resulted from the reaction.
No intermediate species between the monomer UOH+3 and the polymer could be identified spectrophotometrically, neither in the wavelength range 400–700 nm nor in the range 900–1300 nm.
Polymer formation occurs almost instantaneously at pH 2. The time dependency of its formation could be identified by studying the increase in the polymer signal. After mathematical subtraction of this polymer background, the residual spectrum only shows peaks for UOH+3 with a maximum of approximately 625 nm (Supplementary Figure S12). No higher hydrolysis species (e.g., U(OH)2+2, etc.) were observed. With increasing time, the UOH+3 concentration decreased, as expected for continuing polymerization. After adding acid to this solution (pH = 0), UOH+3 peaks only remain as small shoulders of a dominant U+4 peak at 649 nm (Supplementary Figure S13). The kinetics of redissolution of the polymer are slow, in contrast to the fast transformation of UOH+3 to U+4.
3.9 Laser-induced breakdown detection of colloid formation
Colloid formation was studied by laser-induced breakdown detection (LIBD) in two duplicate samples which resulted from the complete reduction of initial solutions containing U(VI). One experiment was performed at a constant pH of 1.66 (Figure 9) and the other at a pH of 1.76 (Supplementary Figure S14). After reduction to U(IV), both solutions were supersaturated. The evolution of colloid formation was followed as a function of time for up to 15 days. The same solutions were also analyzed by UV-VIS absorption spectroscopy (see chapter 3.7).
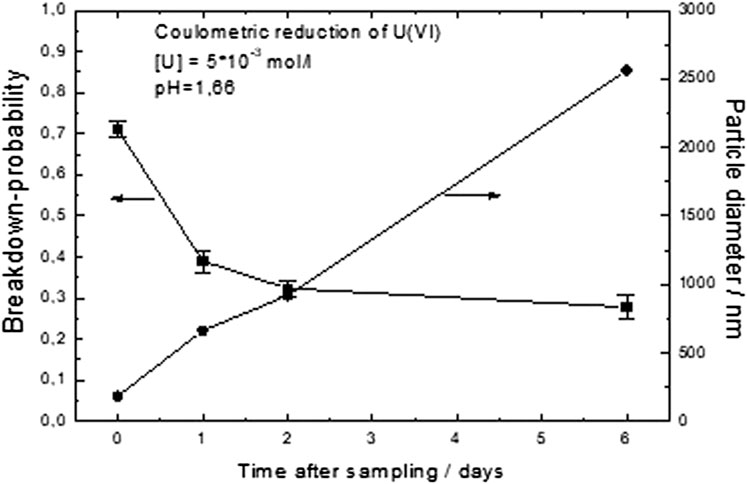
FIGURE 9. Colloid formation studied by laser-induced breakdown detection (LIBD) in a sample resulting from the complete reduction of initially U(VI)-containing solutions at a constant pH of 1.66. The evolution of colloid formation was followed as a function of time for up to 15 days.
In both cases, the growth of colloids was clearly observed. However, the behavior at the two pH values was reproducibly quite different. At pH 1.76 within 14 h, small colloids were grown with an average dimension of approximately 30 nm (Supplementary Figure S14). Prior to colloid growth, there were also some preexisting larger colloids; later, however, the dominant colloid form was the newly formed small ones. This size range is similar to the particle size of the precipitates of coulometric reduction experiments observed at pH values > 1.9 (see chapter 3.6). Thus, it is likely that UO2+y colloids were formed.
At pH 1.66, the colloid growth process had a different character: much larger colloids were formed (Figure 9). It appears as if the preexisting colloids simply grew with time, whereas the concentration of colloids decreased (decreasing breakdown probability). Final sizes (after few days) were larger than a micrometer. The character of this colloid growth process is thus that of coagulation, probably caused by the action of U(IV) ions in solution.
4 Discussion
4.1 First step of reaction: hydrolysis
The stability ranges of dominant uranium (IV) hydrolysis species were estimated using the standard state stability constants from a recent review (Grenthe et al., 2020). Only two hydrolysis species of U(IV) appear to be important: UOH+3 and U(OH)4(aq). For UOH+3, a standard state formation constant log *ßa1 of −0.54 and for U(OH)4(aq) of log *ßa4 of −10.0 were reported. Additionally, UCl3+ formation in 1 M NaCl must be accounted for, with a log *β°1 = 1.72 ± 0.13 reported in the aforementioned review. To calculate the corresponding activity coefficients, the SIT theory was used. We first used the interaction coefficients ε = 0.76 ± 0.06 kg∙mol−1 and ε = 0.48 ± 0.08 kg∙mol−1 given in the aforementioned work for the interaction of U4+ and of UOH3+ in perchlorate media. We then considered the difference of these species between perchlorate and chloride media being the same difference Δ as for Th4+ and ThOH3+ in both media of Δ = 0.45 and Δ = 0.29. This led to ion interaction coefficients in chloride media of ε(U4+,Cl−) = 0.31 kg∙mol−1 and ε(UOH3+,Cl−) = 0.19 kg∙mol−1. The activity coefficient for the neutral U(OH)4(aq) was assumed to be unity in 1 M NaCl solution. Using these data, a conditional formation constant log *ß1(1 M NaCl) of −1.80 was calculated for the reaction U+4 + H2O => UOH+3 + H+ in 1 M NaCl solution. This is slightly lower than the average value (average of values obtained with and without considering U(VI) contamination) of log *ß1(1 M NaCl) = −1.51 ± 0.15 obtained by our spectrophotometric study; it is close to the spectrophotometrically determined value of log *ß1 = −1.73 reported by Kraus and Nelson (1950) for 1.01 M Na/HCl solutions.
Hydrolysis of tetravalent uranium [U(IV)] and U(IV) nanoparticle formation kinetics were examined by Cha et al. (2020) in aqueous NaClO4 over a wide range of temperatures using spectrophotometric reaction modeling analysis. As in our work, no further hydrolysis equilibrium beyond the formation of U(OH)3+ was identified for pH < 2.2. The UV and Vis spectra observed by these authors are quite similar to ours. These authors obtained, at room temperature, a log *ß1(1.05 m NaClO4) = −1.48 ± 0.03 rather than the value of −1.51 ± 0.15 for NaCl at the same molality and temperature in our study.
4.2 Second step of reaction: formation of polymers
The spectrophotometric data show for the pH range 0–1.8 that monomer solution species (mainly U+4 and UOH+3) dominate aqueous speciation during the first day after completion of coulometric reduction at constant pH. However, at pH 1.76, for example, the first signs of colloidal UO2+y formation become obvious. Consequently, polymer transition species between monomer and colloid species are expected to form under certain conditions.
The polymerization reaction became observable at pH 1.5 in the coulometric alkalization experiment of acid U(IV) solutions. At this pH, despite coulometric alkalization, the pH became more acidic for a certain period, and further alkalization was retarded (Figure 10). Figure 10 shows a straight line, indicating the expected evolution of the quantity of H+ in solution in the absence of polymerization. Retardation of alkalization may be explained by polymerization reactions. This may be illustrated, for example, by a hypothetical binarization reaction of the general type
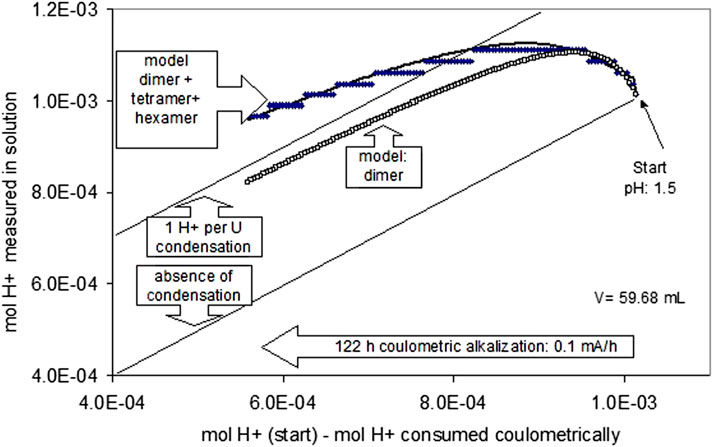
FIGURE 10. Polymerization of U(IV) hydrolysis species at pH 1.5. The lower straight line indicates the expected evolution of the quantity of H+ in solution in case of the absence of polymerization.
In this example, the binary species is formed by a dehydration reaction of two monomers bound together by two adjacent oxo-bonds. This speculative mechanism is deliberately selected, as the lattice of the fluorite structure of UO2 can be constructed entirely by infinite condensation of these units. There is no proof that such species also exist in aqueous solution, but if anhydrous crystalline UO2+y forms directly from aqueous solution, dehydrative polymerization is probably an initial step.
More than one H+-ion per monomer uranium species is not released if a binary species with two oxo-bonds is formed, and even less H+ ions are produced if only one oxo-bond is formed. The respective theoretical straight line is included in Figure 10. The observed retardation of the coulometric alkalization is stronger than expected for forming binary species. Consequently, higher polymerized species must be invoked, such as trimers and tetramers. The formation of tetramers (U4(OH)124+) was also inferred from potentiometric titrations in 1 M NaClO4 (Ekberg et al., 2001). In the simplest, yet speculative, way, two binary species may condense to form tetramers, then hexamers, and finally uraninite.
The experimental curve for the evolution of the quantity of H+-ions in solution was fitted by rate equations for binary, tetramer, and hexamer formation. Attempts failed to use only binary species (Supplementary Figure S15). Coupled general rate equations of the form
were used to describe the experimental data. The monohydroxo species UOH+3 was considered as a monomer since it is the dominant species at this pH and no polymerization was observed at more acidic pH values with U+4 as the dominant species. The initial concentration of the monohydroxo species was calculated with the hydrolysis stability constant, derived previously. The following constants were obtained: k1 = k2 = 70⋅s−1 and k3 = 13⋅s−1.
The corresponding species distribution as a function of time is given in Supplementary Figure S15. The fitting exercise was mainly performed for illustrative purposes. More accurate experiments would be necessary to study the details of the polymerization kinetics in depth. If this mechanism for the initial polymerization stages of uraninite formation is correct, polymer species such as dimers, tetramers, or hexamers would merely be transitory, leading finally to the nucleation and growth of uraninite.
4.3 Third step of reaction: formation of colloids
Colloid formation is a key mechanism that increases the mobility of tetravalent uranium in natural water systems. According to Supplementary Figure S14, small colloids, probably UO2, were formed at pH 1.76; according to Figure 9, large colloids at only a 0.1 pH unit less. The different behavior at the two pH values was reproducible and may be explained by the rate at which supersaturated conditions are achieved. Although the rate of U(IV) formation was the same at the two pH values (controlled by coulometric reduction with 1 mA), this is not true for the rate for achieving supersaturated conditions. For a given solution concentration of U(IV) to supersede the thermodynamic solubility of UO2+y, solutions at pH 1.76 are supersaturated to a higher degree than at pH 1.66 because the thermodynamic solubility decreases in this pH range with increasing pH.
The relationship between the rate of achieving supersaturation and the mechanism of colloid formation is illustrated schematically in Supplementary Figure S16. With high supersaturation rates, homogeneous nucleation of colloids may be achieved, whereas, at lower rates, the uptake of U(IV) by sorption on preexisting colloids is faster than the production rate of U(IV), and the critical nucleation boundary cannot be achieved. Using this reasoning, one may conclude that the critical nucleation boundary in our experiments lies between pH 1.66 and 1.76 for a critical U(IV) concentration of 5·10−5 M. However, this boundary may shift to higher pH values in natural systems because there are much more heterogeneous nucleation sites available than in the laboratory. Consequently, adherence of U(IV) to natural colloids is expected.
4.4 Fourth step of reaction: solid-phase formation
The results of solid-state characterization indicate the formation of uraninite of different degrees of oxidation probably most closely matching a stoichiometry between UO2 and U4O9 under all conditions. The results are consistent with observations on natural uraninite, in that pure UO2 is not formed directly from aqueous solutions. The observed particle size of the precipitates is similar to those of the “true” colloids observed at pH 1.76, indicating that precipitation also has the character of a coagulation process. The changes in the slopes Δ acid addition/Δ added charge, however, show a clear difference between the colloid forming conditions at pH 1.76 and the precipitation regime (Supplementary Figure S3).
In order to assess the formation conditions of “uraninite,” both the nucleation and growth processes must be quantified. According to classical nucleation and growth theories, the degree of supersaturation is a key parameter. This requires an assessment of the solubility of the precipitates as a function of pH, particle size, and oxidation state—both of the solid and aqueous media. The saturation state is difficult to assess for redox sensitive phases because it depends both on solid and solution oxidation states.
A comparison of solubility data obtained in the present study with calculated solubilities of stoichiometric UO2 and of U4O9 with well-known thermodynamic properties and with some experimental data from the present work and from literature is given in Figure 11. The thermodynamic solubilities were calculated for aqueous solutions of 1 M NaCl at 1 atm H2 using the thermodynamic data described previously, with solid-phase stability constants for well-crystalline UO2 and U409 taken from Grenthe et al. (2020). As particle size and associated surface energy might have influenced our solubility data, a curve for nanocrystalline UO2 has also been calculated using the surface energy obtained in Figure 12 (see further this chapter below). After terminating the reduction process in all our experiments, the slopes (Δ acid addition/Δ current) indicate the electrolytic decomposition of water, so the assumption is made that equilibrium is established between the aqueous solution and 1 atm H2(g). Under these conditions, only U(IV) aqueous species are dominant. Under these conditions, the difference in solubility between U4O9 and UO2 is four orders of magnitude. The importance of solid-state oxidation states on controlling aqueous solubility under reducing conditions is well recognized (Parks and et Pohl, 1988; Bruno, 1989) for solubility studies with well-crystalline UO2. Parks and et Pohl (1988) reported a solid-phase stoichiometry close to UO2.006 after terminating their solubility experiment. However, probably due to difficulties in the characterization of solids and their surfaces, many studies with so-called amorphous UO2 reported in the literature do not discuss the implication of solid phase oxidation states on solubility under reducing conditions (Rai et al., 1997; Yajima and Kawamura, 1995; Bruno et al., 1987). In particular, reported amorphous to crypto-crystalline XRD data do not allow distinguishing between UO2 and U4O9. Hence, it may well be that the observed difference in the reported solubility of “UO2(am)” (e.g., discussion in Yajima and Kawamura, 1995) may be attributed to differences in surface or bulk solid oxidation states rather than to differences in maintaining reductive environments, as proposed by Rai et al. (1990).
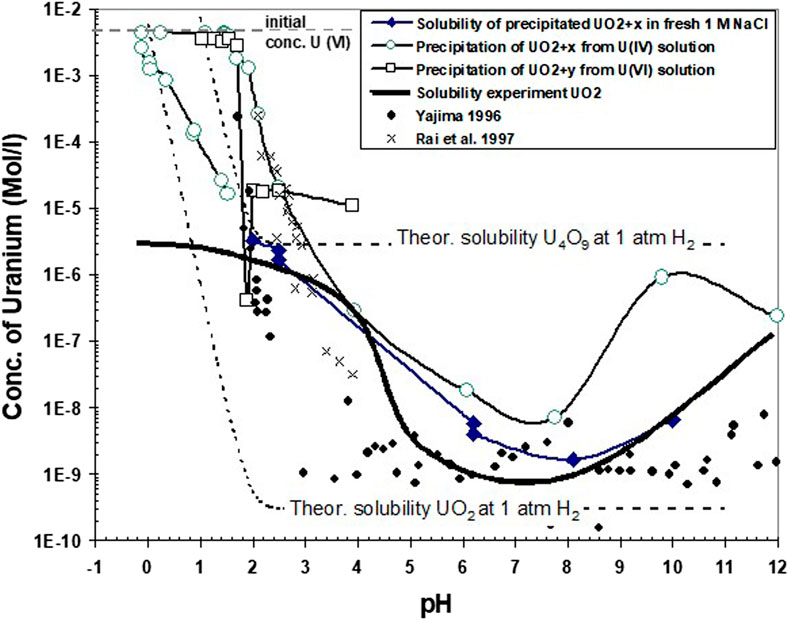
FIGURE 11. Comparison of solubility data obtained in the present study with calculated solubilities (see text) of stoichiometric crystalline and nanocrystalline UO2 and of crystalline U4O9 for aqueous solutions of 1 M NaCl at 1 atm H2. Additionally, the data are compared with the solubility of crystalline UO2 in the presence of traces (1E-8 atm) of dissolved O2, which might have existed in the experimental device.
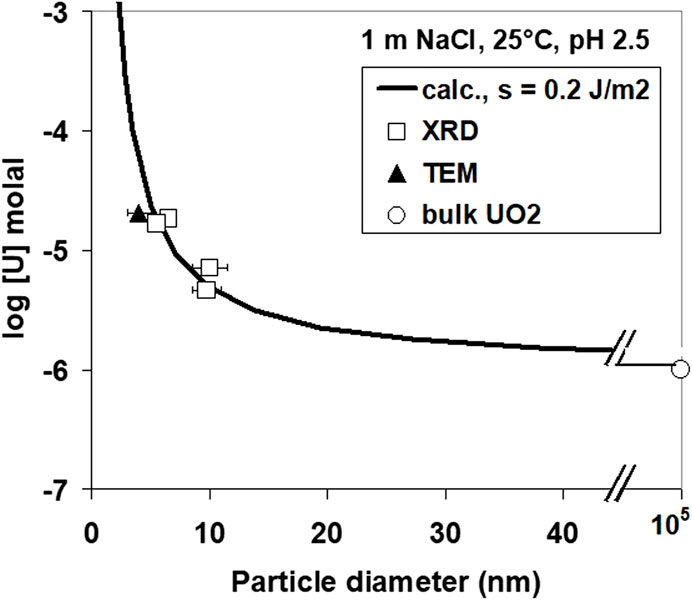
FIGURE 12. Theoretical solubility calculations for UO2 as a function of particle size.
However, above pH 4, all experimental solubility values are higher than any of the three model curves, showing that neither oxidation of the solid (U4O9) nor particle size can explain the results. Therefore, the hypothesis is tested, with another calculated curve, that traces of O2 (1E-8 atm) might have persisted in the experimental device, despite permanent purging by hydrogen. The calculated curve matches exact average experimental data. Indeed, all experimental data could be “explained” with different, rather small quantities of remaining dissolved oxygen.
Nevertheless, it cannot be excluded that different oxidation states of uraninite coexisted in our experiment. This was clearly observed in our experiments with “pure UO2”, but coulometric reduction may also have led to coexistence of different oxidation states. The initial precipitates remain in contact with not-yet reduced U(VI) in solution, whereas the final precipitate is formed in the absence of U(VI). Consequently, the initial products are expected to be more oxidized than the later ones.
The reaction path from higher to lower Eh values is illustrated in Supplementary Figure S6. If two uraninite phases of different degree of oxidation coexist, they may establish equilibrium conditions, implying that the Eh is fixed by the phase equilibrium and that U-solubility would have to be assessed at this phase boundary redox potential. The solubility at this boundary is calculated, for example, for the boundary UO2/U4O9 with an equilibrium oxygen fugacity log O2(g) = −51.85. Such conditions may exist at the solid’s surface even under conditions of aqueous solutions saturated with H2. U(VI) and not U(VI) species are dominant solution species at this “surface redox potential.” Hence, the solubility and the pH dependency of solubility are quite different from those calculated given in Figure 11 for the case of Eh values at the lower stability field boundary of water. If this situation had occurred in our tests, a non-equilibrium system would have been established: any U(VI) generated by dissolution of U4O9 would be reduced coulometrically, and, subsequently, new U(VI) would be dissolved. The steady state between coulometric reduction and the dissolution of U(VI) may have resulted in some of the variability of solubility data in Figure 11. The results of all our tests show the lowest concentrations in the pH range 6–8, which is a range of high significance for many natural water systems. In this pH range, our data are similar to those of Yajama (1996) for “amorphous” UO2. When comparing the results of our different experiments with the data from solubility tests with large particles, stoichiometric UO2 show the lowest solubility as expected. Compared with the thermodynamic solubility of pure UO2, much lower solution concentrations are experimentally encountered below pH 1. This is interpreted as resulting from the slow dissolution rates of the large UO2 particles and does not reflect solubility but control by slow dissolution rates which do not allow dissolved U concentrations to achieve equilibrium. The data for precipitation by coulometric alkalization from initially acid U(IV) solutions require special attention: precipitation does not initially occur to a large extent until a pH of approximately 2. Thereafter, up to pH 8, the solution concentrations decrease rapidly with increasing pH. In the pH range of 2–3, the data are very similar to those of Rai et al. (1997), also obtained in 1 M NaCl solution with an initial acid solution of U(IV). Rai et al. (1997) used these solubility values, with other similar data, to obtain thermodynamic parameters for describing the solubility of so called hydrous UO2(am). However, the acidometric return of our curve to low pH values (0–2) also shows a hysteresis, with lower solubilities than previously encountered. Solution concentrations of precipitate with a particle size of only 4 nm (HRTEM analyses, Figure 7) are also much lower than those of Rai et al. (1997). TEM images of crystalline primary particles of only 2–3 nm with uraninite-like structure and their clusters (20–30 nm) were also recently reported by Cha et al. (2020), which could also have resulted in an aging of the initial precipitate. However, the aging time of 60 days was lower than in Rai et al. (1997). Another explanation could be a control of U-concentrations by dissolution kinetics of the precipitate, similar to the experiment with large particles of UO2. However, the particle size is rather small, and the specific surface area is much higher than in the experiment with large particles of UO2. Consequently, equilibrium should be reached much more easily. Moreover, in the acidic range, solution concentrations remained essentially constant with time, provided the pH was kept constant. This would suggest that the pH data would reflect solubility data rather than kinetically controlled values. If this were true, there would be a transition from solubility values close to theoretical U4O9 solubility at the end of coulometric alkalization (pH 10–12) to theoretical solubility values close to theoretical UO2 solubility at the end of acidometric titration at pH values close to zero. This transition may be caused by the dissolution of U4O9, which is thermodynamically unstable at very low pH values.
The observed difference in the solubility data may not only reflect different oxidation states but also different particle sizes. The effect of particle size on solubility was studied by compiling various experiments performed at pH 2.56. The results are shown in Figure 12. A theoretical curve for the solubility S of small cubic particles of diameter d can be determined from the eqution
if the solubility So of large particles and the surface energy σ is known. In this equation, Vm is the molecular volume of UO2, R is the gas constant, and T is the absolute temperature. A surface energy of 0.4 J/m2 is obtained using the measured solubility for large particles of 10−6 m for a uraninite phase of the surface stoichiometry UO2+y. This is approximately a factor of 5 lower than the value calculated from solubility data by Bruno (1989) for UO2. If the reported surface energy value was correct, 4-nm particles would not be stable in solution.
Using our surface energy value, the conditions for solid phase nucleation can now be established. According to classical theory, for a given solution concentration CU(IV), the nucleation rate J is given by the following equation.
with the pre-exponential factor A being 1033 m−3s−1, the shape factor ß with a value of 32 for cubic
crystal morphology, the Boltzmann constant k, and the number of atoms n in molecule.
Using this equation together with the theoretical solubility calculations for UO2 as a function of particle size (Figure 12), the nucleation rate is calculated as function of pH (Figure 13). The diameter of the critical nuclei is approximately 5 Å. Based on this relation, critical U concentrations for precipitation were calculated as a function of pH (Figure 14) for both a nucleation rate of 1020/(m3s) (upper curve) and for 1/(cm3s)—the so-called “critical supersaturation condition.” This diagram may help explain our experimental results: precipitation (high nucleation rate) starts at pH 1.9, whereas true colloid formation (slow nucleation rate) already commences at a lower pH of approximately 1.7. The calculations also qualitatively describe the observed (experiment type 1, Figure 2) decrease in the critical concentration for precipitation with pH.
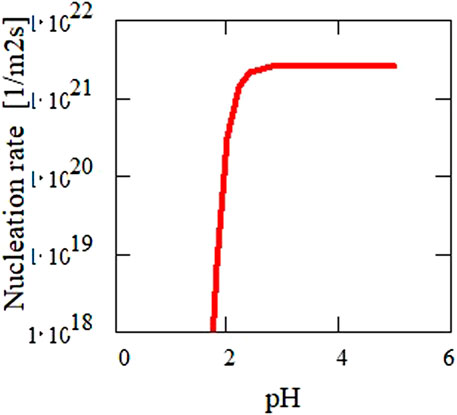
FIGURE 13. Calculated nucleation rate as a function of pH for the determined surface energy (Figure 12) of 0.2 J·m−2. The diameter of the critical nuclei is approximately 5 Å.
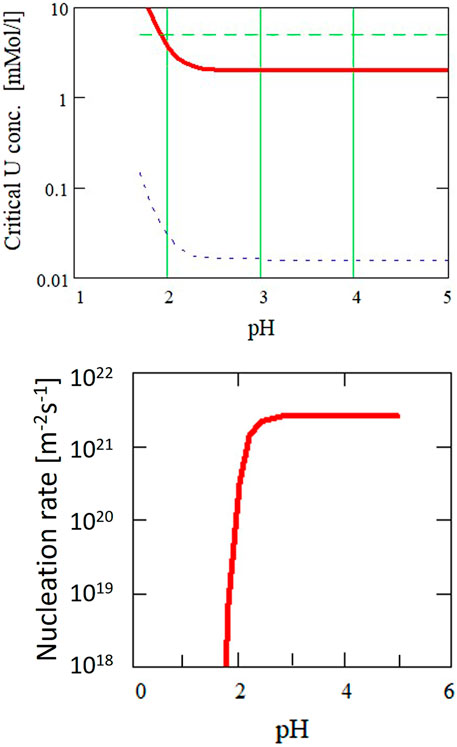
FIGURE 14. Critical supersaturation concentration for the formation of UO2+y from aqueous solutions with nucleation rates of 1020 m−3s−1 (upper curve) and 106 m−3s−1 (lower curve).
5 Conclusion
Reduction of U(VI) solutions leads to uraninite solid phases with oxidation states between UO2 and U4O9. Observed solubilities at pH > 4 were much higher than those predicted in pure H2 saturated systems. Discrepancies can be explained by a combination of three effects: oxidation of the solid to U4O9, effect of particle size, and/or oxygen traces as low as 1E-8 atm in gas contacting the aqueous solution. The effect of particle size/crystallinity and solid oxidation alone cannot explain the observation. Crystalline phases are always precipitated, and amorphous phases are never formed. Precipitation rates are controlled by nucleation kinetics, not by growth. Surface energies were approximately 0.2 J/m2. Homogeneous nucleation led to colloid formation at pH > 1.7. At lower pH, pseudocolloids were observed. The homogeneous nucleation of uraninite is not expected under natural conditions, unless the total U(IV) concentration is higher than 10−5 m. Such concentrations are seldom encountered.
Data availability statement
The raw data supporting the conclusion of this article will be made available by the authors, upon request without undue reservation.
Author contributions
BG: conceptualization, formal analysis, investigation, methodology, supervision, validation, writing–original draft, and writing–review and editing. RM: data curation, formal analysis, investigation, methodology, and writing–original draft. DS: investigation, validation, and writing–original draft. XG: supervision, validation, and writing–review and editing.
Funding
The authors declare that no financial support was received for the research, authorship, and/or publication of this article.
Acknowledgments
The experimental work of this paper was conducted at INE between 1997 and 1998. It has never been published but was quoted in the research work of INE as “BG, RM, to be published,” as in Neck et Kim (2001).
Conflict of interest
The authors declare that the research was conducted in the absence of any commercial or financial relationships that could be construed as a potential conflict of interest.
The BG and XG declared that they were an editorial board member of Frontiers, at the time of submission. This had no impact on the peer review process and the final decision.
Publisher’s note
All claims expressed in this article are solely those of the authors and do not necessarily represent those of their affiliated organizations, or those of the publisher, the editors, and the reviewers. Any product that may be evaluated in this article, or claim that may be made by its manufacturer, is not guaranteed or endorsed by the publisher.
Supplementary material
The Supplementary Material for this article can be found online at: https://www.frontiersin.org/articles/10.3389/fnuen.2023.1308064/full#supplementary-material
References
Bettis, J. R. (1992). Correlation among the laser-induced breakdown thresholds in solids, liquids, and gases. Appl. Spectrosc. 31, 3448. doi:10.1364/ao.31.003448
Bruno, J., Casas, I., Lagerman, B., and et Munoz, M. (1987). “The determination of the solubility of amorphous UO2(s) and the mononuclear hydrolysis constants of uranium(IV) at 25°C,” in Materials Research Society Symposium Proceedings. Editors J. K. édité par, and W. B. Bates et (Pittsburgh, PA USA: Materials Research Society), 153–160. Seefeldt, Scientific Basis for nuclear waste management X.
Bruno, J., Turpeinen, U., Lehmann, M. S., Sjöström, M., Wold, S., Colacio, E., et al. (1989). A reinterpretation of the solubility product of solid uranium(IV) dioxide. Acta Chem. Scand. 43 (1), 99–100. doi:10.3891/acta.chem.scand.43-0099
Bundschuh, T., Knopp, R., and et Kim, J. I. (2001). Laser-induced breakdown detection (LIBD) of aquatic colloids with different laser systems. Colloids Surfaces A Physicochem. Eng. Aspects 177 (1), 47–55. doi:10.1016/s0927-7757(99)00497-5
Cevirim-Papaioannou, N. (2018). Redox chemistry, solubility and hydrolysis of uranium in dilute to concentrated salt systems. PhD Thesis. Karlsruhe, Germany: Karlsruhe Institute of Technology.
Cha, W., Kim, H.-K., Cho, H., Cho, H.-R., Jung, E. C., and et Lee, S. Y. (2020). Studies of aqueous U(IV) equilibrium and nanoparticle formation kinetics using spectrophotometric reaction modeling analysis. RSC Adv. 10, 36723–36733. doi:10.1039/d0ra05352j
Ekberg, C., Brown, P., Comarmond, J., and et Albinsson, Y. (2001). “On the hydrolysis of tetravalent metal ions,” in Materials Reseach Society Symposia Proceedings. Editors K. édité par, P. Hart et, and G. R. Lumpkin (Warrendale, PA, USA: Materials Research Society), Scientific Basis for nuclear waste management XXIV, 1091–1099.
Fujimori, H., Matsui, T., Ajiro, T., Yokose, K., Hsueh, Y. M., and et Izumi, S. (1992). Detection of fine particles in liquids by laser breakdown method. Jpn. J. Appl. Phys. 31, 1514. doi:10.1143/jjap.31.1514
Fujiwara, K., Yamana, H., Fujii, T., and et Hirotake, M. (2003). Determination of uranium(IV) hydrolysis constants and solubility product of UO2·xH2O. Radiochim. Acta 91 (6), 345–350. doi:10.1524/ract.91.6.345.20023
Grenthe, I., Fuger, J., Konings, R. J. M., Lemire, R. J., Muller, A. B., Nguyeng-Trung, C., et al. (1992). Chemical thermodynamics of uranium in Chemical thermodynamics series (Amsterdam, Netherlands: North-Holland), 1.
Grenthe, I., Gaona, X., Plyasunov, A. V., Rao, L., Runde, W., Grambow, B., et al. (2020). Second update on the chemical thermodynamics of uranium, neptunium, plutonium, americium and technetium, 14. Paris: NEA/OECD. Chemical Thermodynamics https://www.oecd-ilibrary.org/fr/nuclear-energy/second-update-on-the-chemical-thermodynamics-of-uranium-neptunium-plutonium-americium-and-technetium-volume-14_bf86a907-en.
Kitamori, T., Yokose, K., Sakagami, M., and et Sawada, T. (1989). Detection and counting of ultrafine particles in ultrapure water using laser breakdown acoustic method. Jpn. J. Appl. Phys. 28, 1195. doi:10.1143/jjap.28.1195
Kraus, K. A., and et Nelson, F. (1950). Hydrolytic behavior of metal ions. I. The acid constants of uranium(IV) and plutonium(IV). J. Am. Chem. Soc. 72 (9), 3901–3906. doi:10.1021/ja01165a020
Neck, V., and et Kim, J. I. (2001). Solubility and hydrolysis of tetravalent actinides. Radiochim. Acta 89 (1), 1–16. doi:10.1524/ract.2001.89.1.001
Parks, G. A., and et Pohl, D. C. (1988). Hydrothermal solubility of uraninite. Geochimica Cosmochimica Acta 52 (4), 863–875. doi:10.1016/0016-7037(88)90357-2
Radziemski, L. J., and et Cremers, D. A. (1989). Laser-induced plasmas and applications. New York·Basel: Marcel Dekker.
Rai, D., Felmy, A. R., and et Ryan, J. L. (1990). Uranium(IV) hydrolysis constants and solubility product of UO2.xH2O(am). Inorg. Chem. 29, 260–264. doi:10.1021/ic00327a022
Rai, D., Felmy, A. R., Sterner, S. M., Moore, D. A., Mason, M. J., and et Novak, C. F. (1997). The solubility of Th(IV) and U(IV) hydrous oxides in concentrated NaCl and MgCl2 solutions. Radiochim. Acta 79 (4), 239–247. doi:10.1524/ract.1997.79.4.239
Scherbaum, F. J., Knopp, R., and et Kim, J. I. (1996). Counting of particles in aqueous solutions by laser-induced photoacoustic breakdown detection. Appl. Phys. B Lasers Opt. 63 (3), 299–306. doi:10.1007/s003400050087
Wolery, T. J. (1983). EQ3/6 modifications for geochemical modeling of brines. Livermore, CA USA: Lawrence Livermore National Laboratory.
Yajima, T., Kawamura, Y., and et Ueta, S. (1995). “Uranium(IV) solubility and hydrolysis constants under reduced conditions,” in Materials Research Society Symposia Proceedings. Editors T. édité par, and R. C. Murakami et (Pittsburgh, PA, USA: Materials Research Society), 1137–1142. Ewing, Scientific Basis for nuclear waste management XVIII.
Keywords: solubility, uranium, redox, colloids, precipitation
Citation: Grambow B, Müller R, Schild D and Gaona X (2023) Solids, colloids, and the hydrolysis of tetravalent uranium in chloride media. Front. Nucl. Eng. 2:1308064. doi: 10.3389/fnuen.2023.1308064
Received: 05 October 2023; Accepted: 08 November 2023;
Published: 27 November 2023.
Edited by:
Tara Beattie, TB Environmental Services Ltd., United KingdomReviewed by:
Mavrik Zavarin, Lawrence Livermore National Laboratory (DOE), United StatesNathalie Wall, University of Florida, United States
Copyright © 2023 Grambow, Müller, Schild and Gaona. This is an open-access article distributed under the terms of the Creative Commons Attribution License (CC BY). The use, distribution or reproduction in other forums is permitted, provided the original author(s) and the copyright owner(s) are credited and that the original publication in this journal is cited, in accordance with accepted academic practice. No use, distribution or reproduction is permitted which does not comply with these terms.
*Correspondence: B. Grambow, Z3JhbWJvd0BzdWJhdGVjaC5pbjJwMy5mcg==