 Eric P. Allain1
 Michèle Rouleau1Trang Le2
 Katrina Vanura2Lyne Villeneuve1Patrick Caron1Véronique Turcotte1Eric Lévesque3
 Chantal Guillemette1,4*
- 1Pharmacogenomics Laboratory, Faculty of Pharmacy, Centre Hospitalier Universitaire de Québec (CHU de Québec) Research Center – Université Laval, Laval University, Québec City, QC, Canada
- 2Division of Hematology and Hemostaseology, Department of Medicine I, Medical University of Vienna, Vienna, Austria
- 3Division of Hemato-Oncology, Faculty of Medicine, CHU de Québec Research Centre – Université Laval, Laval University, Québec City, QC, Canada
- 4Canada Research Chair in Pharmacogenomics, Québec City, QC, Canada
High expression of the metabolic enzyme UDP-glucuronosyltransferase UGT2B17 in chronic lymphocytic leukemia (CLL) cells was associated with poor prognosis in two independent studies. However, the underlying mechanism remains unknown. We hypothesized that UGT2B17 impacts intracellular levels of hormone-like signaling molecules involved in the regulation of gene expression in leukemic cells. We initially confirmed in a third cohort of 291 CLL patients that those with high UGT2B17 displayed poor prognosis (hazard ratio of 2.31, P = 0.015). Consistent with the unfavorable prognostic significance of elevated UGT2B17 expression in CLL patients, high UGT2B17 expression was associated with enhanced proliferation of MEC1 and JVM2 malignant B-cell models. Transcriptomic analyses revealed that high UGT2B17 was linked to a significant alteration of genes related to prostaglandin E2 (PGE2) and to its precursor arachidonic acid, both in cell models and a cohort of 448 CLL patients. In functional assays, PGE2 emerged as a negative regulator of apoptosis in CLL patients and proliferation in cells models, whereas its effect was partially abrogated by high UGT2B17 expression in MEC1 and JVM2 cells. Enzymatic assays and mass-spectrometry analyses established that the UGT2B17 enzyme inactivates PGE2 by its conjugation to glucuronic acid (GlcA) leading to the formation of two glucuronide (G) derivatives. High UGT2B17 expression was further associated with a proficient inactivation of PGE2 to PGE2-G in CLL patient cells and cell models. We conclude that UGT2B17-dependent PGE2 glucuronidation impairs anti-oncogenic PGE2 effects in leukemic cells, thereby partially contributing to disease progression in high UGT2B17 CLL patients.
Introduction
Chronic lymphocytic leukemia (CLL) is the most common form of adult leukemia in the western world (1). It is characterized by an accumulation of mature B-cells in peripheral blood, bone marrow, and other lymphoid organs. CLL has a highly variable course and generally develops at a slower pace than other leukemia subtypes. The accumulation of CLL cells in patients can be explained, in part, by defects in the regulation of apoptosis (2), but other studies have also shown evidence of clonal evolution (3, 4) and the importance of active proliferation in progressive disease (5, 6).
A significant increase in therapeutic options for CLL patients has been associated with improved survival. However, CLL remains incurable (7). Recent investigations have yielded insights into molecular indicators used to better predict clinical outcome of this disease. Of those, uridine diphospho-glucuronosyltransferase 2B17 (UGT2B17) expression was identified as a novel molecular marker for CLL progression in two independent CLL cohorts (8, 9). The initial report associated high UGT2B17 mRNA expression with poor prognosis, unmutated-IGHV and other expression-based markers, such as LPL and CD38 (9). The second study reported high UGT2B17 expression as a prognostic marker particularly for mutated-IGHV individuals, a subgroup of patients for which few indicators of progression currently exist (8). The UGT2B17 gene encodes a member of a superfamily of metabolic enzymes responsible for the conjugation of small lipophilic substrates to glucuronic acid (GlcA) derived from its co-substrate UDP-GlcA (10). Glucuronidation inactivates the enzyme's substrates, increases their polarity and facilitates their elimination through bile or urine. The function of this metabolic route is to maintain homeostasis of endogenous molecules while protecting cells from potentially harmful chemicals arising from exogenous sources, including pharmacological compounds (11).
The underlying mechanism(s) by which the UGT2B17 protein may affect CLL malignancy and disease progression in patients remains unknown. Amongst the 19 human UGT isoforms, UGT2B17 is the only significantly expressed UGT in CLL cells. The UGT2B17 protein is enzymatically functional, as it was shown to conjugate UGT2B17 substrates such as androgens in cells isolated from CLL patients (9). It is plausible that UGT2B17 influences intracellular levels of hormone-like signaling molecules involved in the regulation of gene expression, with subsequent impacts on cancer cell growth and survival. We hypothesized that overexpression of UGT2B17 perturbs the bioavailability and response to endogenous B-cell modulators with consequences on the transcriptome of leukemic cells and neoplastic behavior. We report that high UGT2B17 modifies expression of genes related to prostanoids. It also impairs prostaglandin-mediated growth inhibition of malignant cells through direct inactivation of these hormone-like molecules by glucuronidation.
Materials and Methods
Patients, Cell Lines, and Culture
The B-cell neoplastic cell lines MEC1 and JVM2 were purchased from DSMZ (Braunschweig, Germany) in 2010 and ATCC (Manassas, VA) in 2015, respectively. The MEC1-2B17 and JVM2-2B17 cell models were generated by electroporation of parental cells with a pcDNA6 vector containing the coding sequence of UGT2B17 for stable overexpression. Electroporation was achieved with the Neon Transfection System (Thermo Fisher scientific, Waltham, MA). The JVM2-CTRL cells were produced by electroporation with the pcDNA6 vector and the MEC1-CTRL cells were prepared as described (9). All cell lines were cultured in RPMI medium supplemented with 10% fetal bovine serum (FBS), 1% penicillin/streptomycin, 1% sodium pyruvate and 1% L-glutamine. Selection of MEC1-2B17 cells was achieved by supplementing culture medium with 20 μg/mL blasticidin for 3 weeks, after which selection was maintained by growing cells with 10 μg/mL of blasticidin. MEC1-CTRL cells were supplemented with 3 μg/mL of puromycin. For JVM2-CTRL and JVM2-2B17 cells, selection for 3 weeks and subsequent growth was achieved by supplementing medium with 5 μg/mL blasticidin. All cell culture components were purchased from Wisent Bioproducts (St-Bruno, QC). Cells were regularly tested for mycoplasma, with the most recent carried out on February 9th, 2019.
Cryopreserved peripheral blood mononuclear cells (PBMCs) from 15 CLL patients diagnosed between 1987 and 2011 at Vienna General Hospital were used (Table S1). Cell purity was assessed by measuring CD5 and CD19 surface expression by cytometry prior to experimentation, with CLL cells representing 67% of total PBMCs on average. Primary cells from CLL patients were cultured in RPMI supplemented with 10% FBS, 1% sodium pyruvate, and 1% L-glutamine without antibiotics. All subjects gave written informed consent in accordance with the Helsinki Declaration and the study was evaluated and approved by local Ethical Research Committees of the Medical University of Vienna (Ethics vote 1499/2015) and the Center Hospitalier Universitaire (CHU) de Québec (A14-10-1205).
Immunoblotting
For western blot, microsomal fractions were prepared from MEC1 and JVM2 by resuspending 108 cells in 1 mL microsome buffer (4 mM potassium phosphate, 20% glycerol, pH 7.0). Cells were sonicated three times for 30 s, alternating with 30-s pauses on ice. Extracts were centrifuged twice at 12,000 × g for 22 min at 4°C. Supernatants were centrifuged at 105,000 × g for 60 min at 4°C to isolate the microsomal fraction that was resuspended in microsome buffer containing 0.5 mM dithiothreitol (DTT). Microsomal fractions (20 μg) were mixed with Laemmli sample buffer (Bio-Rad, Mississauga, ON), heated at 95°C for 5 min prior to SDS-PAGE and transfered to nitrocellulose membranes. Protein detection was adapted from a previously described immunoblotting strategy (12) using the polyclonal anti-UGT2B antibody EL-93 (1:2,000) for detection of UGT2B17 (13) or an anti-calnexin antibody (1:2,000, Enzo Life Science, Farmingdale, NY) as a loading control.
Glucuronidation Assays
Enzyme activity assays, incubated at 37°C for 120 min, were conducted with cell homogenates (100 μg) prepared by resuspending 108 JVM2 and MEC1 cells in 1 mL PBS containing 0.5 mM DTT or with microsomal fractions (20 μg) from primary cells from CLL patients (prepared as described above) in a final volume of 100 μL. The reaction assays also contained 50 mM Tris-HCl (pH 7.5), 10 mM MgCl2, 5 μg/mL pepstatin, 0.5 μg/mL leupeptin, 0.5 mM UDP-GlcA, 20 μg/mL alamethicin, and indicated substrates. Final substrate concentrations were 200 μM for prostaglandins (PG) and vorinostat (SAHA; Sigma-Aldrich) or 25 μM for dihydrotestosterone (DHT), testosterone (Testo) and estradiol (E2) (all from Steraloids, Newport, RI). Steroid glucuronides (-G) were analyzed by liquid chromatography and tandem mass spectrometry (LC-MS/MS) as previously described (14). For PGs, chromatographic separation was performed onto an ACE C18 HL column (3 μM packing material, 100 × 4.6 mm; Canadian Life Science, Peterborough, ON) and a Nexera system (Shimadzu Scientific instruments, Columbia, MD). Elution of PGs-G was done in isocratic conditions consisting of 65% methanol, 35% H2O, 1 mM ammonium formate at a constant flow rate of 0.9 ml/min. For vorinostat, chromatographic separation was performed onto an ACE C18 HL column (3 μM packing material, 100 × 4.6 mm; Canadian Life Science). The mobile phases were solvent A: H2O, 0.1% formic acid and solvent B: acetonitrile, 0.1% formic acid. Vorinostat-G was eluted using the following program: 0–1.5 min, isocratic 40% B; 1.5–1.6 min, linear gradient 40–90% B; 1.6–2.9 min, isocratic 90% B; 2.9-3.0 min, linear gradient 90–40% B; 3.1–6.0 min, isocratic 40% B. Relative amounts of glucuronides were compared by area under the curve (AUC) by tandem MS (API 6500; Sciex, Concord, ON) operated in multiple reactions monitoring mode (MRM) and equipped with a turbo ion-spray source. The following mass ion transitions (m/z) were used: 527.2 → 175 for PGE2-G and 441.3 → 265.1 for vorinostat-G. Both systems were controlled through Analyst Software (version 1.6.1, AB Sciex).
Gene Expression Analysis
Publicly available data sets were used for analysis of overall survival (OS) of CLL patients and CLL expression profiles in relation to UGT2B17 levels using the affy (v1.48) and limma (v3.26.9) packages for R (http://www.bioconductor.org). The first dataset was obtained from the International Cancer Genome Consortium (ICGC-CLLE-ES, n = 291) (15, 16). A second dataset was from the Gene Expression Omnibus (GEO-GSE13159, n = 448 untreated patients) (17). For MEC1 and JVM2 cell models, total RNA from three biological replicates was extracted using RNeasy mini kit, as per manufacturer's instructions (Qiagen, Toronto, ON). Samples were subjected to ribosomal RNA depletion before Illumina HiSeq2000 paired-end sequencing at Genome Québec McGill University and at the CHU de Québec Research center - Université Laval. Raw data was processed using the MUGQIC pipeline version 1.3. Briefly, reads were quality trimmed and aligned to the hg38 human genome. Differential gene expression analysis was performed using the edgeR and DESeq2 tools for R v3.2.2 (18, 19). Differences in gene expression were considered significant if Benjamini-Hochberg adjusted P-values for both tools were below 0.05. Analysis of enriched biological pathways was carried out using g:profiler (20) with the Reactome (21), KEGG (22–24), and GO biological process databases. Reactome FI plugin for Cytoscape v3.2.1 was also used for clustering of genes into modules and visualization of enriched pathways (25). Altered expression of selected genes was validated by quantitative real time PCR. Briefly, total RNA was DNase I-treated and purified using the RNeasy MinElute Cleanup kit (Qiagen, Hilden, DE) following the manufacturer's instructions. First-strand cDNA synthesis was accomplished using Superscript IV RNase H-RT (Invitrogen Life Technologies, Burlington, ON, CA), PCR purification kit (Qiagen, Hilden, DE) was used to purify cDNA. Oligoprimer pairs were designed by GeneTool 2.0 software (Biotools Inc, Edmonton, AB, CA), their specificity was verified by BLAST alignment to human RefSeq sequences and were synthesized by IDT (Integrated DNA Technology, Coralville, IA, USA) (Table S2). RT-qPCR quantification was carried out using the LightCycler 480 (Roche Diagnostics, Mannheim, DE). Reagent LightCycler 480 SYBRGreen I Master (Roche Diagnostics, Indianapolis, IN, USA) was used as described by the manufacturer with 2% DMSO. Relative quantity was calculated using the second derivative method and by applying the delta Ct method (26). B2M, HPRT1, and UBC were used as reference genes for normalization (27). Quantitative qPCR measurements were performed in compliance with MIQE guidelines by the Gene Expression Platform of our institution (28, 29).
Cell Proliferation and Viability Assays
Cells were plated at 1 × 10⁴ cells/well (MEC1) or 5 × 10⁴ cells/well (JVM2) in 96-well U-bottom tissue culture plates (BD Bioscience, Mississauga, ON). For treatment assays, growth media was supplemented with PGs or vehicle (ethanol) at time of plating and renewed every 48 h. PGE2, Butaprost and PGE1-OH, used at concentrations indicated in the text, were purchased from Cayman chemicals (Ann Arbor, MI). Every 24 h, an aliquot of cells was stained with trypan blue (50%) and counted with a TC-10 automated cell counter (Bio-Rad). Assays were replicated at least three times in duplicate. For MTS assays, 20 μL of CellTiter aqueous one solution cell proliferation reagent (MTS Promega, Madison, WI, USA) was added to 100 μL of cells. Absorbance at 490 nm was read after a 4-h incubation at 37°C. To further assay cell proliferation, cells were labeled with 5 μM of CFSE (Thermo Fisher Scientific) and incubated at 37°C for 10 min before rinsing once with DPBS and plating at 4 × 10⁶ cells/mL in 12-well culture plates with whole medium 72 h prior to analysis.
Migration Assays
CLL PBMCs were plated at 3 × 10⁶ cells/mL in 24-well culture plates 24 h prior to migration assays. Cells were then treated for 24 h with PGE2 (1–5 μM) before initiation of migration experiments. Transwell 5 μm-pore inserts (Corning, New-York, NY) were then placed in a 24-well plate with 600 μL of medium in the lower well and 100 μL in the upper well, containing 5 × 10⁵ CLL cells. Cells were treated with either vehicle (PBS) or CXCL12 (200 ng/mL) before incubation for 4 h at 37°C. Cells in the upper and lower compartments were recovered in separate tubes by incubation with a non-enzymatic cell dissociation solution (Sigma-Aldrich, Oakville, ON) for 10 min at 37°C. Each tube was then spiked with 50 μL of 123eBeads (Thermo Fisher Scientific) and counted using a FACS Canto II flow cytometer (BD Bioscience). Migration was calculated with the following formula:
Flow Cytometry Analyses
Each patient PBMC sample was thawed and diluted to 3 × 10⁶ cells/ml prior to identification of CLL cells by analysis of cell surface markers using PerCPCy5.5-conjugated anti-human CD5 (BD Pharmingen), PE-Cy7-conjugated anti-human CD19 (BD Bioscience) and APC-Cy7-conjugated anti-human CD45 (BD Bioscience). All analyses were conducted with a FACS Canto II flow cytometer (BD Bioscience).
Cell Death
Aliquots of 5 × 10⁵ cells were centrifuged at 520 × g and rinsed twice with Dulbecco's Phosphate Buffered Saline (DPBS) before resuspension in Annexin V binding buffer (50 mM HEPES, 700 mM NaCl, 12.5 mM CaCl2, pH 7.4). Cells were labeled with Alexa Fluor 647-conjugated Annexin V as per manufacturer's instructions (Thermo Fisher scientific) and propidium iodide (PI; 4 ng/mL) in the dark, on ice, for 30 min prior to analysis.
BCR Stimulation Assays
Primary CLL PBMCs (5 × 10⁵ cells) were treated with PGE2 (1–5 μM) or DMSO 2 h after thawing. Cells were primed with PMA (10 ng/mL, Sigma-Aldrich) for 1 h, then stimulated with LPS (200 ng/mL Sigma-Aldrich) or F(ab')2 anti-human IgM (10 μg/mL, Southern Bioscience, Birmingham, AL). For assessment of ERK phosphorylation, cell aliquots (5 × 10⁵) were labeled with LIVE/DEAD® fixable dead cell stain kit (Thermo Fisher Scientific) as per manufacturer's instructions after 15 min of stimulation, then fixed with 3.7% paraformaldehyde and permeabilized with 90% ice-cold methanol before staining with 5 μL APC-conjugated rabbit anti-human p44/42 MAPK (pERK1/2, Cell Signaling Technologies, Danvers, MA) and analysis. For assessment by surface markers, aliquots of 5 × 10⁵ cells were labeled with LIVE/DEAD® 24 h post-stimulation, rinsed once with DPBS and incubated 30 min on ice with mouse anti-human PE-conjugated CD80 (BioLegend, San Diego, CA) and APC-conjugated CD86 (BD Pharmingen) before analysis.
Statistical Analysis
The half maximal inhibitory concentrations (IC50) were calculated by fitting variable slope non-linear curves to normalized response data from PGE2 treatments. Statistical analysis was carried out using a two-tailed Student's t-test, unless otherwise indicated in the legends. Analysis of overall survival was done using the Kaplan-Meier method and the Log-Rank test. Statistics were performed using GraphPad Prism v5 (GraphPad Software Inc., La Jolla, CA) and R v3.2.2. Statistical significance is defined as * P < 0.05, ** P < 0.01. Each experiment was performed with three biological replicates, unless otherwise indicated in figure legends.
Results
UGT2B17 Confers a Proliferative Advantage to Malignant B- Cell Models
A significant reduction in overall survival (OS) was established in 291 CLL patients from the International Cancer Genome Consortium (ICGC) expressing high UGT2B17 levels (Figure 1A). Neoplastic B-cell models MEC1 and JVM2 stably overexpressing UGT2B17 were created to examine its role in CLL progression. These two cell lines were chosen on the basis of relatedness to CLL and diversity of cytogenetic aberrations. Overexpression was confirmed at the mRNA (2.6-fold) and protein (2.6-fold) levels in the MEC1-2B17 cells, and the functionality of the enzyme was supported by an enhanced glucuronidation activity for characteristic UGT2B17 substrates vorinostat (SAHA), testosterone (Testo), dihydrotestosterone (DHT), and estradiol (E2) by 1.6–1.7-fold (P < 0.05), compared to control cells levels (Figures 1B–D). In the JVM2-2B17 model, a 2.5-fold enhanced mRNA expression and 2.2-fold higher protein levels were observed with a corresponding 2.1–2.5-fold enhanced UGT2B17 activity (P < 0.05) (Figures 1B–D). Consistent with the unfavorable prognostic significance of UGT2B17 expression in CLL patients (above) (8, 9), high UGT2B17 expression was associated with enhanced proliferation by 1.7 (P < 0.05) and 2.0-fold (P < 0.01) for MEC1 and JVM2, respectively (Figures 1E,F). A significantly shorter doubling time for high UGT2B17 expressing cells was evidenced in cell lines by cell counts, MTS assays, and CFSE labeling (Figures 1E–I). No significant difference in cell viability was noted by Annexin V/PI and trypan blue exclusion assays when cells were grown in either basal or serum starvation conditions (data not shown). Robustness of cellular phenotypes was measured periodically for several months to confirm stability of UGT2B17 cell models.
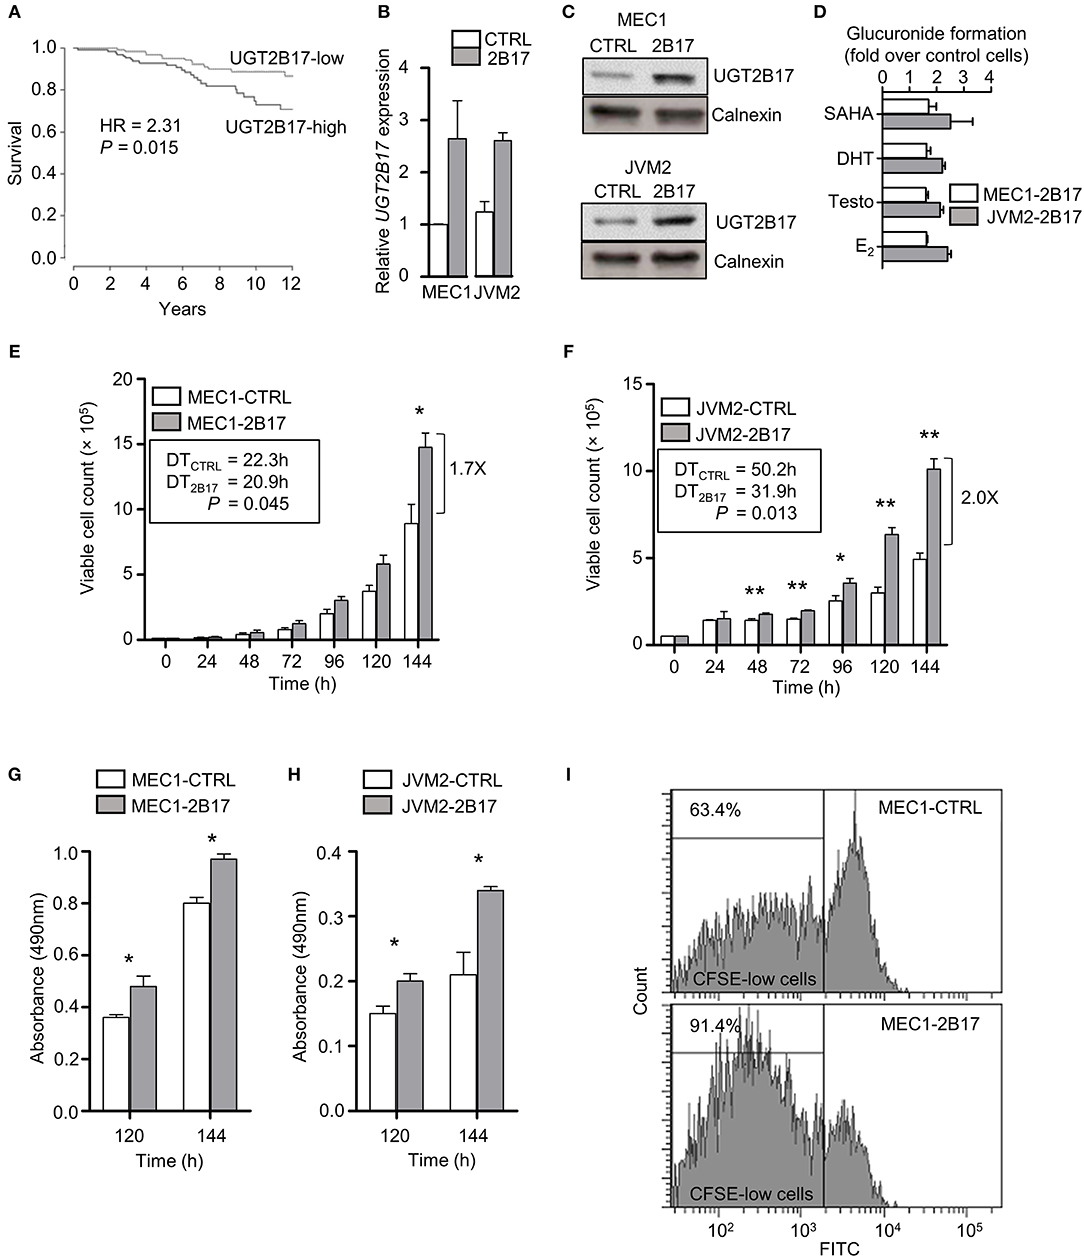
Figure 1. UGT2B17 confers a proliferative advantage to leukemic cells. (A) High UGT2B17 levels are significantly associated with reduced overall survival of CLL patients. Kaplan Meier plot represents survival of 291 CLL patients of the ICGC cohort, dichotomized according to the median expression of UGT2B17. (B–D) The malignant B-cell models MEC1 and JVM2 stably expressing low (CTRL) or high UGT2B17 (2B17) levels, as characterized (B) at the mRNA level by qPCR, (C) at the protein level by immunoblotting of the microsomal fraction with a UGT2B-specific antibody; and (D) by measuring the glucuronidation activity in cell homogenates using the UGT2B17 substrates vorinostat (SAHA), testosterone (Testo), dihydrotestosterone (DHT), and estradiol (E2). Calnexin was used as a protein loading control in (C). (E–F) High UGT2B17 expression enhances the proliferation rate of (E) MEC1 and (F) JVM2 neoplastic cells. Viable cell count was determined every 24 h for 7 days. Doubling times (DT) were calculated from the exponential growth phase (96–144 h). MTS assays of (G) MEC1 and (H) JVM2 cells also indicated increased proliferation of UGT2B17 overexpressing cells. (I) Representative cytometry data of CFSE labeling in MEC1 72 h after plating. CFSE-low cells represent the fraction of cells having undergone at least one cell division. Data represent mean ± SEM of three independent experiments. Cellular phenotypes associated with high UGT2B17 were reproducibly observed over time, attesting of the stability of cell models. * P < 0.05, ** P < 0.01. Comparisons without reported P-value are non-significant.
UGT2B17 Modulates Expression of Genes Related to Prostanoids in Cell Models and Leukemic Cells From Patients
RNA sequencing revealed a strong effect of elevated UGT2B17 on global gene expression. A total of 5474 and 2880 genes were differentially expressed in MEC1-2B17 and JVM2-2B17 cells, respectively, when compared to control cells (FDR < 0.05) (Figure 2A). Of those, 683 modulated genes were concordant between models, among which 272 had an absolute fold-change (FC) > 1.3 (FDR < 0.05) in UGT2B17 overexpressing cells (Table S3). Pathway analyses using the Reactome and KEGG databases revealed biological pathways overrepresented among common modulated genes such as cell adhesion, chemokine signaling, antigen processing, translation, apoptosis, antigen-receptor signaling as well as steroid and lipid signaling pathways (Figure 2B). The latter was well-represented with 54 genes connected to the metabolism and biosynthesis of lipids or eicosanoids (prostanoids and leukotrienes) significantly modified by UGT2B17 (Table S4). This is plausible given that several bioactive lipids are glucuronidated by the UGT pathway (30). This set of genes was selected for further investigation. Genes involved in arachidonic acid metabolism such as FADS1, FADS2, and ACSL4 were significantly down-regulated in both cell models (Figures 2C,D; Table S4). The leukotriene biosynthesis genes ALOX5 and LTA4H as well as genes from prostaglandin-related pathways were also differentially expressed. This included lower expression of the genes encoding the prostaglandin (PG) E receptors PTGER2 and PTGER4, higher expression of the PG-inactivating enzyme PTGR2, as well as decreased expression of the prostanoid biosynthesis enzymes PTGES2 and CBR1. Quantitative PCR confirmed these observations (Figure 2E). Their clinical relevance was supported by the altered expression of these genes in CLL patients expressing high levels of UGT2B17 in a cohort of 448 cases (GSE13159) dichotomized on the basis of median UGT2B17 expression (Figure 2E). Notably, genes of the PG biosynthesis pathway and PG receptors were significantly down-regulated in CLL patients with high UGT2B17 expression (Figure 2E). Also, the expression of genes coding for membrane transporters known to mediate PG influx such as SLCO3A1 and SLCO4A1 was reduced in CLL patients with high UGT2B17, while the PG efflux transporter gene ABCC4 was enhanced (not shown). Pathway enrichment analysis of genes commonly altered in both MEC1 and JVM2 further revealed that response to PGE2 was a significantly enriched pathway (FDR = 0.032). According to these observations coherent for CLL patients and cell models, the effect of PGE2 on B-cell phenotypes and the influence of UGT2B17 expression were investigated further.
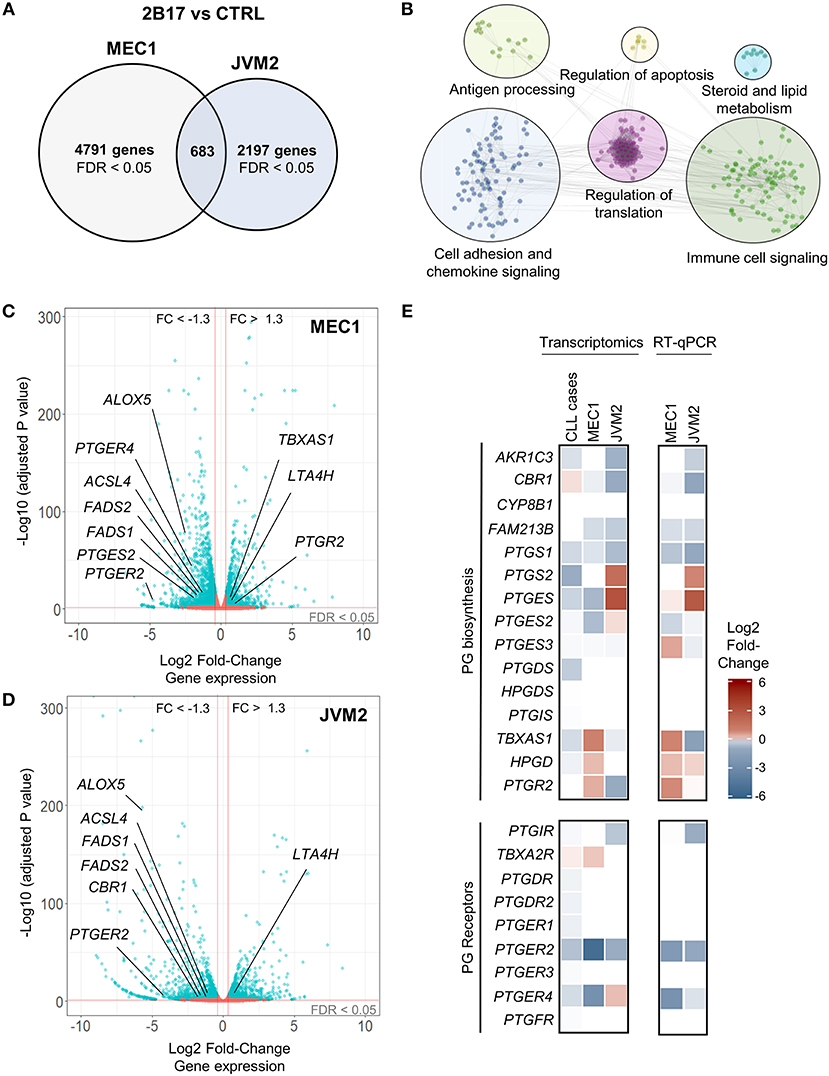
Figure 2. UGT2B17 alters the gene expression profile of lymphoid cells. (A) Genes significantly differentially expressed in MEC1 and JVM2 leukemic cells with high UGT2B17 expression vs. controls (false discovery rate (FDR) < 0.05) are represented in the Venn diagram, with 683 genes showing overlapping and concordant changes in both cell lines. Differential expression was established by DEseq2 and EdgeR analyses of gene expression profiles in each cell model determined by RNA sequencing (GSE121626). (B) Pathway enrichment analysis of the 683 differentially expressed genes common to both MEC1 and JVM2 models based on the Reactome, KEGG and GO biological process databases. (C,D) Volcano plot overviews of genes differentially expressed in high UGT2B17 vs. control MEC1 and JVM2 cells. Blue data points represent significantly (FDR < 0.05) and differentially expressed genes (fold change (FC) > 1.3). Several genes related to eicosanoid biosynthesis and signaling are highlighted. (E) left: Differential expression of genes related to prostaglandin (PG) biosynthesis and signaling in UGT2B17-high vs. control MEC1 and JVM2 cells, and in B-cells of CLL patients (n = 448, GSE13159) dichotomized into high vs. low UGT2B17 expression subsets based on median expression level. Gene sets included are shown as defined in the Reactome pathway database. Right: RT-qPCR validation of altered expression in selected genes related to PGE2. Data represents mean ± SEM of three independent experiments.
PGE2 Increases Cell Death and Inhibits Migration of Primary CLL Patient Cells
PBMCs from 15 CLL patients were analyzed following treatment with PGE2 for potential differences in cell death, activation and migration by flow cytometry. Sample purity was assessed by analysis of CD5, CD19, and CD45 expression. A trend toward increased cell death was observed for primary CLL cells treated for 24 h with 5 μM PGE2 (P = 0.067). By 48 h of treatment, cell death was significantly enhanced by PGE2 (P = 0.0007), suggesting that PGE2 promotes cell death of CLL cells (Figure 3A). CLL cells showed a trend for inhibition of CXCL12-directed migration by 5 μM PGE2 when compared to cells treated only with CXCL12 (Figure 3B; P = 0.102). PGE2 did not alter the activation of PBMCs triggered by IgM stimulation, which was assessed with CD80 and pERK markers (Figures 3C,D). Based on these data, potential anti-oncogenic effects of PGE2 and possible interactions with UGT2B17 were investigated further using in vitro cell models of B-cell malignancies.
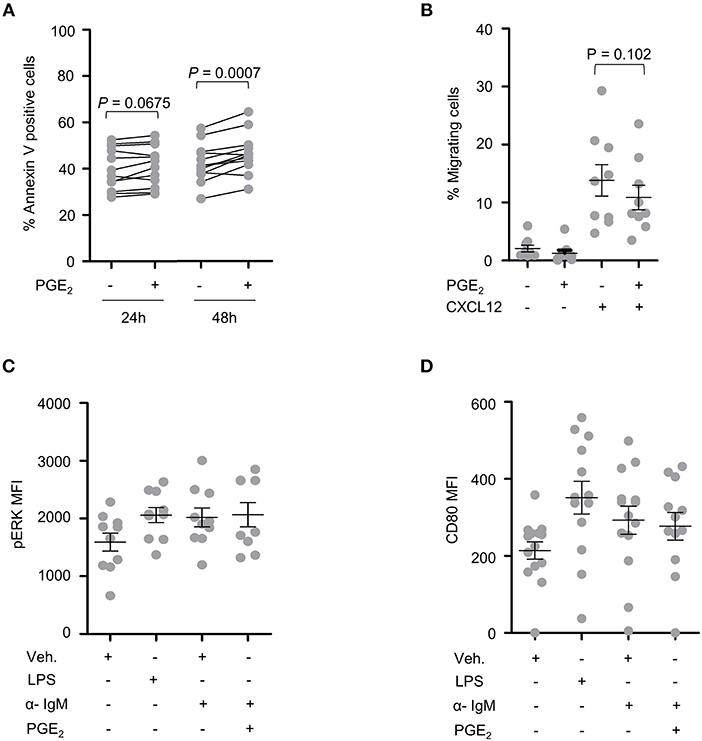
Figure 3. CLL patient cells are sensitive to PGE2. (A) Cell death of CLL patient PBMCs (n = 12) induced by PGE2 (5 μM). (B) Influence of PGE2 (5 μM) on CXCL12-induced migration of CLL patient PBMCs (n = 9). Migration assays were conducted 24 h after treatment with PGE2. (C,D) Influence of PGE2 (5 μM) on the activation of CLL PBMCs (n = 9) with F(ab')2 anti-human IgM. Activation was assessed by mean fluorescence intensity (MFI) of (C) pERK 15 min after stimulations and (D) by CD80 expression 24 h post-treatment. Stimulated cells were primed with PMA 1 h prior to addition of anti-human IgM. LPS was used as a positive control. Purity of CLL fraction was 70% on average, as determined by CD5, CD19, and CD45 expression. In (B–D), data represent means ± SEM of patient samples. Statistics were calculated using a paired-sample T-test. Comparisons without reported P-value are non-significant (n.s).
High UGT2B17 Expression Hinders PGE2-Mediated Growth Inhibition in Cell Models
MEC1 cells treated with PGE2 or with synthetic agonists of the PGE2 receptors EP2 (butaprost) or EP4 (PGE1-OH) showed considerable growth inhibition (Figure 4A). MEC1 cells exposed to increasing physiologically relevant concentrations of PGE2 (1–20 μM) further supported a repressive effect of PGE2 on B-cell growth, with an inhibition profile significantly different for MEC1-2B17 compared to control cells (Figure 4B). High UGT2B17 significantly decreased the responsiveness of B-cells to PGE2, evidenced by a 1.5-fold higher half maximal inhibitory concentration (IC50) of 12.4 vs. 8.2 μM for high vs. low expressing cells (P = 0.0006). We then tested the effects of other PGs. In these experiments, the level of UGT2B17 expression affected the inhibitory effect of PGE2 by up to 33% (P ≤ 0.022) but not of the other PGs (Figures 4C,D).
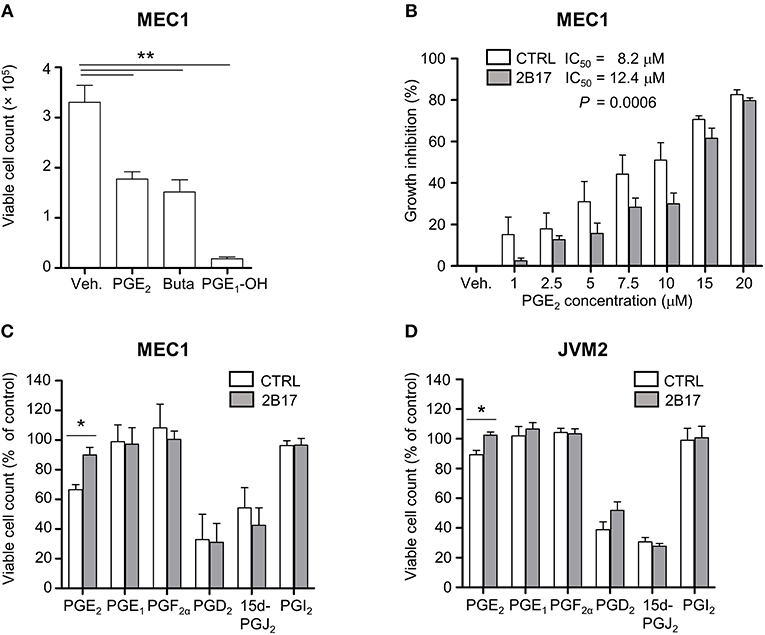
Figure 4. UGT2B17 impedes PGE2-mediated inhibition of neoplastic cell growth. (A) Influence of PGE2 and the EP receptor agonists PGE1-OH and Butaprost (Buta) on MEC1 cell growth. Cells were counted 120 h after initiation of treatment with vehicle (Veh) or 10 μM of each compound. (B) PGE2 IC50 was determined in MEC1 cell models by fitting a non-linear curve to normalized response data and comparing the best-fit parameters with the sum of squares F test. (C–D) Influence of prostaglandins (5 μM) on (C) MEC1 and (D) JVM2 cell growth relative to vehicle-treated cells, 120 h post-treatment. Data represent mean ± SEM of three independent experiments, each with three technical replicates; * P < 0.05, ** P < 0.01. All other data were non-significant (n.s.).
UGT2B17 Inactivates PGE2 and Other Related PGs
PGs share a lipid backbone and comprise several functional groups (hydroxyl and carboxyl groups) that may be susceptible to conjugation with GlcA by the UGT pathway (Figure 5A). Amongst all 19 human UGT enzymes, UGT2B17 largely predominates in human leukemic B-cells, although with significant variability (CVUGT2B17 = 242.9%; n = 291 CLL patients) (Figure 5B). We investigated the possibility that PGE2 may be a substrate of UGT2B17. The initial series of experiments revealed the formation of two glucuronide (G) derivatives (PGE2-G1 and PGE2-G2) detected by MS in MRM mode, upon incubations of PGE2 with MEC1-2B17 microsomes (Figure 5C). The patterns of fragmentation of individual glucuronides were consistent with the loss of the GlcA moiety (molecular mass of 176) (Figure 5C) and support UGT2B17 targeting two of the functional groups on the PGE2 molecule. Enzymatic assays with PGE2 further established that primary CLL samples and cell lines expressing high UGT2B17 levels produced significant amounts of PGE2-G1 and PGE2-G2 derivatives whereas they were not detected in those expressing low UGT2B17 levels in CLL patients (Figure 5D).
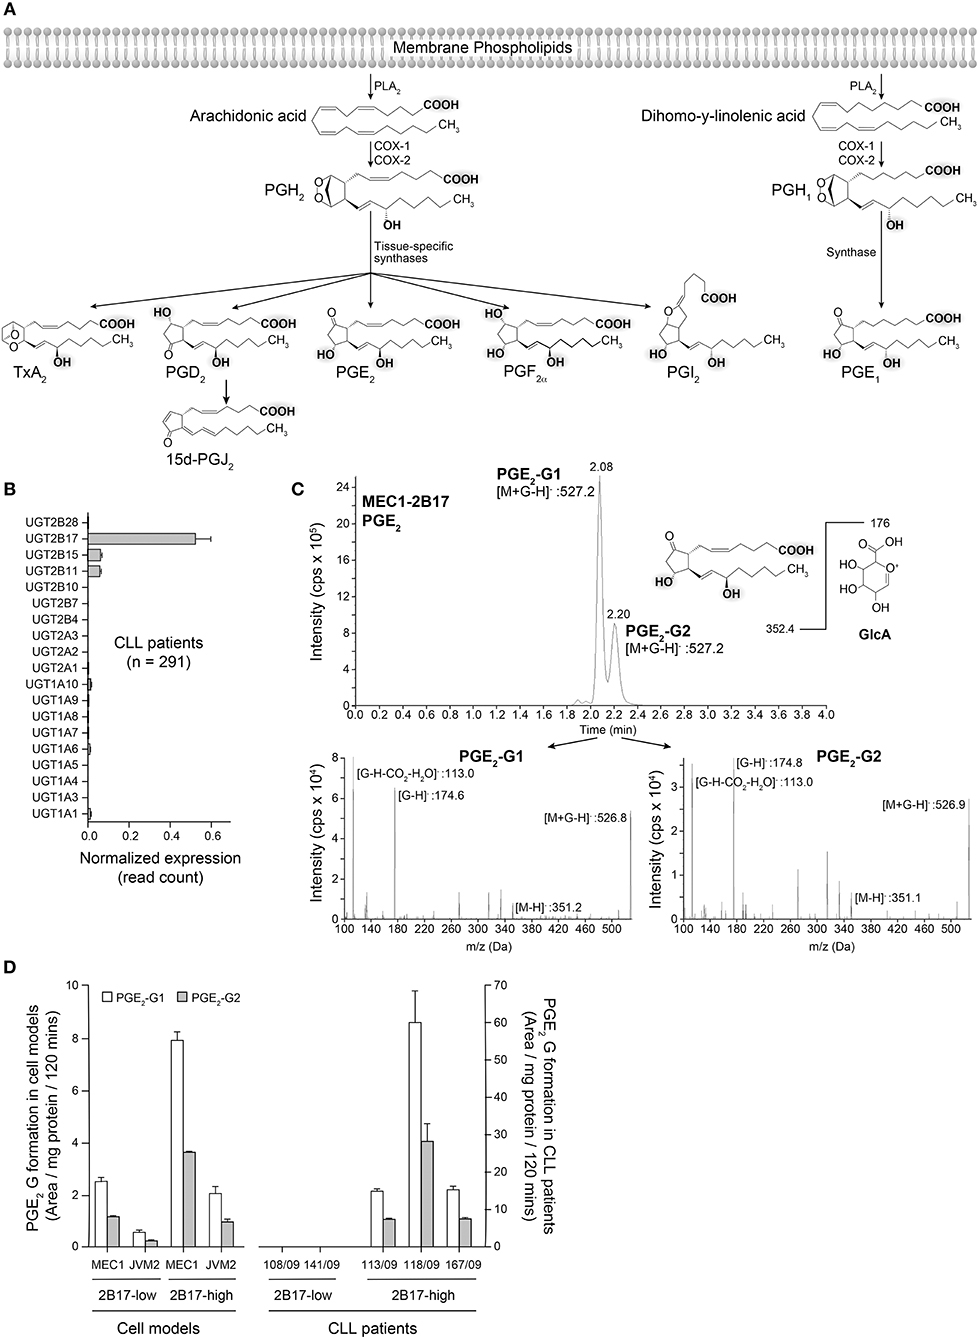
Figure 5. Glucuronidation of PGE2 by UGT2B17 and CLL patient cells. (A) The prostaglandin biosynthetic pathway. Functional groups on arachidonic acid and related molecules with a potential for glucuronidation are gray-shadowed. PLA2, phospholipase A2; COX-1/-2, cyclooxygenase−1 and−2. (B) UGT2B17 is the predominant UGT gene expressed in CLL PBMCs, based on data from the ICGC CLL cohort. (C) Top, Mass spectrometry analysis of PGE2 glucuronides (-G) produced by MEC1-2B17 cell homogenates. Elution profiles indicate the formation of two glucuronidated products (PGE2-G1 and PGE2-G2). The deprotonated PGE2 glucuronide ([M+G-H]-) mass (527.2 Da) is consistent with the masses of PGE2 (352.4 Da) and glucuronic acid (GlcA; 176 Da). Bottom, The MS/MS fragmentation pattern of each eluted molecule confirmed the identity of PGE2-glucuronides with mass/charge (m/z) ratios of fragments specific to PGE2 glucuronides, including [M+G-H]−, PGE2 [M-H]− and the glucuronide moieties, such as [G-H]− and [G-H-CO2-H2O]−. (D) LC-MS/MS quantification of PGE2 glucuronides formed by PBMC cell homogenates of CLL patient cells and lymphoid cell lines engineered to overexpress UGT2B17. Cells with high (n = 3) UGT2B17 expression efficiently produced the two PGE2 glucuronides but not those with low expression (n = 2). MEC1-2B17 and JVM2-2B17 cells efficiently conjugating PGE2 served as positive controls. Data represents mean ± SEM of at least two assays.
Discussion
CLL is a chronic disease characterized by a high degree of heterogeneity, with complex clonal dynamics resulting in an imbalance between B-cell proliferation and death that favors an accumulation of leukemic cells during progressive disease (5). We demonstrated that high UGT2B17 expression is associated with adverse outcome in a cohort of 291 CLL patients, consistent with two independent previous reports (8, 9). UGT2B17 is the only appreciably expressed UGT in CLL cells, although heterogeneously expressed. Our work revealed that high UGT2B17 expression confers a growth advantage to malignant B-cells that is mediated, at least in part, through significant changes in gene expression in PGE2-related pathways and its inactivation by the UGT2B17 enzyme. This enhanced proliferation rate results in a significantly larger B-cell population only after several days in culture, consistent with the slow rate of B-cell accumulation in CLL. PGE2 emerges as a potential regulator of B-cell growth and apoptosis, a notion supported by previous reports in mouse models and in human B cells (31–36). Similarly, our analysis of primary cells from CLL patients exposed to physiological concentrations of PGE2 revealed an enhanced cell death after 48 h and a slight inhibition of CXCL12-mediated migration. Furthermore, in CLL patients' samples expressing high UGT2B17 levels, we also observed PGE2 inactivation but not in those with low UGT2B17 levels. One mechanism by which UGT2B17 may modify cancer cell behavior may be through inactivation of PGE2, thereby altering homeostatic levels of PGE2 and gene expression related to PGE2 synthesis, transport and action.
PGE2 is a key lipid hormone-like signaling molecule of the eicosanoid family, and plays important roles in disease-associated inflammation and normal physiological functions (37). PGE2 is produced from a cascade of enzymatic modifications to arachidonic acid (Figure 5), a polyunsaturated fatty acid esterified in cell membrane phospholipids and a previously reported substrate of UGT2B7 (not expressed in B-cells) leading to its inactivation in the liver (38). Two PGE2 glucuronide derivatives were produced by UGT2B17 in leukemic cells, consistent with the conjugation of hydroxyl groups that corresponds to the preferred substrate moieties of the enzyme (39), whereas the hepatic UGT2B7 enzyme may preferentially target the carboxyl group (40). Analysis of PGE2-G by nuclear magnetic resonance will be required to confirm this reasoning.
PGE2 displays tumor suppressor functions in B-cells and other immune cells by impairing BCR activation and cell proliferation, as well as by triggering cell death (31, 35). PGE2 signals through different types of E-series PG receptors (EPs), namely EP1, EP2, EP3, and EP4 (41). Past studies in murine cells have demonstrated inhibition of B-cell activation by PGE2 through binding and activation of EP2 and EP4 (31, 32, 36, 42). EP4 was shown to be a negative feedback regulator of B-cell activation via the BCR signaling cascade, which is an integral pathway in CLL (31). Our findings that PGE2 receptor agonists mimicked the growth-inhibition induced by PGE2 support a receptor-mediated mechanism of action in human neoplastic B-cells. The expression of genes related to PGE2 signaling, including the EP receptors, was reduced in CLL patient cells and B-cell models with high UGT2B17 expression, likely further disrupting PGE2 homeostasis. The mechanism by which UGT2B17 modulates PGE2-related gene expression remains to be addressed, but likely involves regulatory PGE2 feedback loops. Together, this altered expression profile combined with the direct PGE2 inactivation by UGT2B17 support the notion that CLL cells with high UGT2B17 are less responsive to PGE2, thus conferring a proliferative advantage that could influence CLL disease course.
Our results provide a first potential mechanism for understanding the role UGT2B17 in CLL by circumventing the actions of endogenous signaling factors such as PGE2. This study does have limitations, namely the use of two cell models imperfectly representing CLL, the variability in CLL sample purity and limited number of available patients to investigate the correlation between UGT2B17 expression levels and PGE2 response in detail. UGT2B17-dependent glucuronidation of additional endogenous effectors remain to be identified and may contribute to divergent expression profiles and phenotypes reported here for low and high UGT2B17 expressing B-cells.
In conclusion, our findings imply a relevant anti-oncogenic function of PGE2 in CLL cells that is blocked by high UGT2B17 expression, through a direct metabolic inactivation of PGE2 and altered PGE2-related gene expression leading to PGE2 unresponsiveness.
Data Availability
The datasets generated during the current study are available in the Gene Expression Omnibus repository with the accession number GSE121626.
Ethics Statement
All subjects gave written informed consent in accordance with the Helsinki Declaration and the study was evaluated and approved by local Ethical Research Committees of the Medical University of Vienna (Ethics vote 1499/2015) and the Center Hospitalier Universitaire (CHU) de Québec (A14-10-1205).
Author Contributions
EA, LV, PC, and VT performed the experiments. EA, MR, LV, EL, and CG analyzed the data. EA performed bioinformatics analyses. EA, MR, EL, and CG designed the research. TL and KV provided patient samples, collected clinical data, and revised the manuscript. EA, MR, and CG wrote the manuscript.
Funding
The Cancer Research Society, the Leukemia and Lymphoma Society of Canada, the Canadian Institutes of Health Research (FRN-152986), and the Canada Research Chair Program financially supported this study.
Conflict of Interest Statement
The authors declare that the research was conducted in the absence of any commercial or financial relationships that could be construed as a potential conflict of interest.
Acknowledgments
The authors wish to thank Alexandre Brunet, Andréa Fournier, Nathalie Paquet, and Sylvie Desjardins for excellent technical assistance. We acknowledge Calcul Québec and Compute Canada for the use of the MUGQIC pipelines, developed by the bio-informatics team of the Center d'innovation Génome Québec and McGill University. These pipelines, installed on the Colosse supercomputer at Laval University, are under the shared responsibility of the teams of Calcul Québec and Arnaud Droit at Laval University. The Colosse supercomputer is managed by Calcul Québec and Compute Canada. The operation of the Colosse supercomputer was funded by the Canada Foundation for Innovation, the ministère de l'Économie, de la science et de l'innovation du Québec and the Fonds de recherche du Québec - Nature et technologies. EA has received scholarships from Université Laval foundation - Leadership and sustainable development award, and CHU de Québec foundation - Fernand Labrie excellence award. EL is recipient of the CIHR phase II clinician-scientist award. CG holds a Canada Research Chair in Pharmacogenomics.
Supplementary Material
The Supplementary Material for this article can be found online at: https://www.frontiersin.org/articles/10.3389/fonc.2019.00606/full#supplementary-material
References
1. Siegel RL, Miller KD, Jemal A. Cancer statistics, 2016. CA Cancer J Clin. (2016) 66:7–30. doi: 10.3322/caac.21332
2. Schimmer AD, Munk-Pedersen I, Minden MD, Reed JC. Bcl-2 and apoptosis in chronic lymphocytic leukemia. Curr Treat Options Oncol. (2003) 4:211–8. doi: 10.1007/s11864-003-0022-y
3. Burger JA, Landau DA, Taylor-Weiner A, Bozic I, Zhang H, Sarosiek K, et al. Clonal evolution in patients with chronic lymphocytic leukaemia developing resistance to BTK inhibition. Nat Commun. (2016) 7:11589. doi: 10.1038/ncomms11589
4. Stilgenbauer S, Sander S, Bullinger L, Benner A, Leupolt E, Winkler D, et al. Clonal evolution in chronic lymphocytic leukemia: acquisition of high-risk genomic aberrations associated with unmutated VH, resistance to therapy, and short survival. Haematologica. (2007) 92:1242–5. doi: 10.3324/haematol.10720
5. Chiorazzi N. Cell proliferation and death: forgotten features of chronic lymphocytic leukemia B cells. Best Pract Res Clin Haematol. (2007) 20:399–413. doi: 10.1016/j.beha.2007.03.007
6. Messmer BT, Messmer D, Allen SL, Kolitz JE, Kudalkar P, Cesar D, et al. In vivo measurements document the dynamic cellular kinetics of chronic lymphocytic leukemia B cells. J Clin Invest. (2005) 115:755–64. doi: 10.1172/JCI23409
7. Burger JA, O'Brien S. Evolution of CLL treatment - from chemoimmunotherapy to targeted and individualized therapy. Nat Rev Clin Oncol. (2018) 15:510–27. doi: 10.1038/s41571-018-0037-8
8. Bhoi S, Baliakas P, Cortese D, Mattsson M, Engvall M, Smedby KE, et al. UGT2B17 expression: a novel prognostic marker within IGHV-mutated chronic lymphocytic leukemia? Haematologica. (2016) 101:e63–5. doi: 10.3324/haematol.2015.136440
9. Gruber M, Bellemare J, Hoermann G, Gleiss A, Porpaczy E, Bilban M, et al. Overexpression of uridine diphospho glucuronosyltransferase 2B17 in high-risk chronic lymphocytic leukemia. Blood. (2013) 121:1175–83. doi: 10.1182/blood-2012-08-447359
10. Guillemette C, Levesque E, Harvey M, Bellemare J, Menard V. UGT genomic diversity: beyond gene duplication. Drug Metab Rev. (2010) 42:24–44. doi: 10.3109/03602530903210682
11. Guillemette C, Levesque E, Rouleau M. Pharmacogenomics of human uridine diphospho-glucuronosyltransferases and clinical implications. Clin Pharmacol Ther. (2014) 96:324–39. doi: 10.1038/clpt.2014.126
12. Girard H, Court MH, Bernard O, Fortier LC, Villeneuve L, Hao Q, et al. Identification of common polymorphisms in the promoter of the UGT1A9 gene: evidence that UGT1A9 protein and activity levels are strongly genetically controlled in the liver. Pharmacogenetics. (2004) 14:501–15. doi: 10.1097/01.fpc.0000114754.08559.27
13. Levesque E, Beaulieu M, Green MD, Tephly TR, Belanger A, Hum DW. Isolation and characterization of UGT2B15(Y85): a UDP-glucuronosyltransferase encoded by a polymorphic gene. Pharmacogenetics. (1997) 7:317–25. doi: 10.1097/00008571-199708000-00007
14. Lepine J, Bernard O, Plante M, Tetu B, Pelletier G, Labrie F, et al. Specificity and regioselectivity of the conjugation of estradiol, estrone, and their catecholestrogen and methoxyestrogen metabolites by human uridine diphospho-glucuronosyltransferases expressed in endometrium. J Clin Endocrinol Metab. (2004) 89:5222–32. doi: 10.1210/jc.2004-0331
15. Ramsay AJ, Martinez-Trillos A, Jares P, Rodriguez D, Kwarciak A, Quesada V. Next-generation sequencing reveals the secrets of the chronic lymphocytic leukemia genome. Clin Transl Oncol. (2013) 15:3–8. doi: 10.1007/s12094-012-0922-z
16. Zhang J, Baran J, Cros A, Guberman JM, Haider S, Hsu J, et al. International cancer genome consortium data portal–a one-stop shop for cancer genomics data. Database (Oxford). (2011) 2011:bar026. doi: 10.1093/database/bar026
17. Kohlmann A, Kipps TJ, Rassenti LZ, Downing JR, Shurtleff SA, Mills KI, et al. An international standardization programme towards the application of gene expression profiling in routine leukaemia diagnostics: the Microarray Innovations in LEukemia study prephase. Br J Haematol. (2008) 142:802–7. doi: 10.1111/j.1365-2141.2008.07261.x
18. Love MI, Huber W, Anders S. Moderated estimation of fold change and dispersion for RNA-seq data with DESeq2. Genome Biol. (2014) 15:550. doi: 10.1186/s13059-014-0550-8
19. Robinson MD, McCarthy DJ, Smyth GK. edgeR: a Bioconductor package for differential expression analysis of digital gene expression data. Bioinformatics. (2010) 26:139–40. doi: 10.1093/bioinformatics/btp616
20. Reimand J, Kull M, Peterson H, Hansen J, Vilo J. g:Profiler–a web-based toolset for functional profiling of gene lists from large-scale experiments. Nucleic Acids Res. (2007) 35:W193–200. doi: 10.1093/nar/gkm226
21. Fabregat A, Jupe S, Matthews L, Sidiropoulos K, Gillespie M, Garapati P, et al. The reactome pathway knowledgebase. Nucleic Acids Res. (2018) 46:D649–55. doi: 10.1093/nar/gkx1132
22. Kanehisa M, Furumichi M, Tanabe M, Sato Y, Morishima K. KEGG: new perspectives on genomes, pathways, diseases and drugs. Nucleic Acids Res. (2017) 45:D353–61. doi: 10.1093/nar/gkw1092
23. Kanehisa M, Sato Y, Kawashima M, Furumichi M, Tanabe M. KEGG as a reference resource for gene and protein annotation. Nucleic Acids Res. (2016) 44:D457–62. doi: 10.1093/nar/gkv1070
24. Kanehisa M, Goto S. KEGG: kyoto encyclopedia of genes and genomes. Nucleic Acids Res. (2000) 28:27–30. doi: 10.1093/nar/28.1.27
25. Shannon P, Markiel A, Ozier O, Baliga NS, Wang JT, Ramage D, et al. Cytoscape: a software environment for integrated models of biomolecular interaction networks. Genome Res. (2003) 13:2498–504. doi: 10.1101/gr.1239303
26. Pfaffl MW. A new mathematical model for relative quantification in real-time RT-PCR. Nucleic Acids Res. (2001) 29:e45. doi: 10.1093/nar/29.9.e45
27. Warrington JA, Nair A, Mahadevappa M, Tsyganskaya M. Comparison of human adult and fetal expression and identification of 535 housekeeping/maintenance genes. Physiol Genomics. (2000) 2:143–7. doi: 10.1152/physiolgenomics.2000.2.3.143
28. Bustin SA, Benes V, Garson JA, Hellemans J, Huggett J, Kubista M, et al. The MIQE guidelines: minimum information for publication of quantitative real-time PCR experiments. Clin Chem. (2009) 55:611–22. doi: 10.1373/clinchem.2008.112797
29. Bustin SA, Beaulieu JF, Huggett J, Jaggi R, Kibenge FS, Olsvik PA, et al. MIQE precis: practical implementation of minimum standard guidelines for fluorescence-based quantitative real-time PCR experiments. BMC Mol Biol. (2010) 11:74. doi: 10.1186/1471-2199-11-74
30. Turgeon D, Chouinard S, Belanger P, Picard S, Labbe JF, Borgeat P, et al. Glucuronidation of arachidonic and linoleic acid metabolites by human UDP-glucuronosyltransferases. J Lipid Res. (2003) 44:1182–91. doi: 10.1194/jlr.M300010-JLR200
31. Murn J, Alibert O, Wu N, Tendil S, Gidrol X. Prostaglandin E2 regulates B cell proliferation through a candidate tumor suppressor, Ptger4. J Exp Med. (2008) 205:3091–103. doi: 10.1084/jem.20081163
32. Prijatelj M, Celhar T, Gobec M, Mlinaric-Rascan I. EP4 receptor signalling in immature B cells involves cAMP and NF-kappaB dependent pathways. J Pharm Pharmacol. (2012) 64:1090–8. doi: 10.1111/j.2042-7158.2012.01499.x
33. Roper RL, Graf B, Phipps RP. Prostaglandin E2 and cAMP promote B lymphocyte class switching to IgG1. Immunol Lett. (2002) 84:191–8. doi: 10.1016/S0165-2478(02)00185-2
34. Roper RL, Phipps RP. Prostaglandin E2 and cAMP inhibit B lymphocyte activation and simultaneously promote IgE and IgG1 synthesis. J Immunol. (1992) 149:2984–91.
35. Simkin NJ, Jelinek DF, Lipsky PE. Inhibition of human B cell responsiveness by prostaglandin E2. J Immunol. (1987) 138:1074–81.
36. Prijatelj M, Celhar T, Mlinaric-Rascan I. Prostaglandin EP4 receptor enhances BCR-induced apoptosis of immature B cells. Prostaglandins Other Lipid Mediat. (2011) 95:19–26. doi: 10.1016/j.prostaglandins.2011.04.001
37. Funk CD. Prostaglandins and leukotrienes: advances in eicosanoid biology. Science. (2001) 294:1871–5. doi: 10.1126/science.294.5548.1871
38. Little JM, Kurkela M, Sonka J, Jantti S, Ketola R, Bratton S, et al. Glucuronidation of oxidized fatty acids and prostaglandins B1 and E2 by human hepatic and recombinant UDP-glucuronosyltransferases. J Lipid Res. (2004) 45:1694–703. doi: 10.1194/jlr.M400103-JLR200
39. Beaulieu M, Levesque E, Hum DW, Belanger A. Isolation and characterization of a novel cDNA encoding a human UDP-glucuronosyltransferase active on C19 steroids. J Biol Chem. (1996) 271:22855–62. doi: 10.1074/jbc.271.37.22855
40. Sakaguchi K, Green M, Stock N, Reger TS, Zunic J, King C. Glucuronidation of carboxylic acid containing compounds by UDP-glucuronosyltransferase isoforms. Arch Biochem Biophys. (2004) 424:219–25. doi: 10.1016/j.abb.2004.02.004
41. Bhattacharya M, Peri K, Ribeiro-da-Silva A, Almazan G, Shichi H, Hou X, et al. Localization of functional prostaglandin E2 receptors EP3 and EP4 in the nuclear envelope. J Biol Chem. (1999) 274:15719–24. doi: 10.1074/jbc.274.22.15719
Keywords: UGT2B17, CLL, prostaglandins, glucuronidation, PGE2
Citation: Allain EP, Rouleau M, Le T, Vanura K, Villeneuve L, Caron P, Turcotte V, Lévesque E and Guillemette C (2019) Inactivation of Prostaglandin E2 as a Mechanism for UGT2B17-Mediated Adverse Effects in Chronic Lymphocytic Leukemia. Front. Oncol. 9:606. doi: 10.3389/fonc.2019.00606
Received: 29 March 2019; Accepted: 19 June 2019;
Published: 04 July 2019.
Edited by:
Abhinav Dhall, Boston Children's Hospital, Harvard Medical School, United StatesReviewed by:
Silvia Deaglio, University of Turin, ItalyStefania Fiorcari, University of Modena and Reggio Emilia, Italy
Copyright © 2019 Allain, Rouleau, Le, Vanura, Villeneuve, Caron, Turcotte, Lévesque and Guillemette. This is an open-access article distributed under the terms of the Creative Commons Attribution License (CC BY). The use, distribution or reproduction in other forums is permitted, provided the original author(s) and the copyright owner(s) are credited and that the original publication in this journal is cited, in accordance with accepted academic practice. No use, distribution or reproduction is permitted which does not comply with these terms.
*Correspondence: Chantal Guillemette, chantal.guillemette@crchudequebec.ulaval.ca