 Yang An1†
 Qiang Wang1†
 Lu Zhang1
 Fengjie Sun1
 Guosen Zhang1
 Huan Dong1
 Yingkun Li1
 Yanyu Peng1
 Haojie Li1
 Wan Zhu2
 Shaoping Ji1
 Yunlong Wang3*
 Xiangqian Guo1*
- 1Department of Predictive Medicine, Institute of Biomedical Informatics, Cell Signal Transduction Laboratory, Bioinformatics Center, Henan Provincial Engineering Center for Tumor Molecular Medicine, Kaifeng Key Laboratory of Cell Signal Transduction, School of Basic Medical Sciences, School of Software, Henan University, Kaifeng, China
- 2Department of Anesthesia, Stanford University, Stanford, CA, United States
- 3Henan Bioengineering Research Center, Zhengzhou, China
Glioma is the most frequent primary brain tumor that causes high mortality and morbidity with poor prognosis. There are four grades of gliomas, I to IV, among which grade II and III are low-grade glioma (LGG). Although less aggressive, LGG almost universally progresses to high-grade glioma and eventual causes death if lacking of intervention. Current LGG treatment mainly depends on surgical resection followed by radiotherapy and chemotherapy, but the survival rates of LGG patients are low. Therefore, it is necessary to use prognostic biomarkers to classify patients into subgroups with different risks and guide clinical managements. Using gene expression profiling and long-term follow-up data, we established an Online consensus Survival analysis tool for LGG named OSlgg. OSlgg is comprised of 720 LGG cases from two independent cohorts. To evaluate the prognostic potency of genes, OSlgg employs the Kaplan-Meier plot with hazard ratio and p value to assess the prognostic significance of genes of interest. The reliability of OSlgg was verified by analyzing 86 previously published prognostic biomarkers of LGG. Using OSlgg, we discovered two novel potential prognostic biomarkers (CD302 and FABP5) of LGG, and patients with the elevated expression of either CD302 or FABP5 present the unfavorable survival outcome. These two genes may be novel risk predictors for LGG patients after further validation. OSlgg is public and free to the users at http://bioinfo.henu.edu.cn/LGG/LGGList.jsp.
Introduction
Glioma is the most frequent primary brain tumor with four grades from grade I to IV. Grade IV glioma is also known as glioblastoma, while grade II and III glioma refer to low-grade glioma (LGG) designated by World Health Organization (WHO) (1–4). LGG includes three histological types: astrocytoma, oligodendroglioma, and oligoastrocytoma (4–6), while oligoastrocytoma is no longer considered as a separate entity since the current WHO classification has included molecular markers (including IDH1 mutation and 1p/19q codeletion) to identify astrocytoma and oligodendroglioma, not oligoastrocytoma (3, 7). Although less aggressive than high-grade glioma, LGG eventually advances to high-grade glioma without intervention therapy (5, 8). For most LGG patients, the treatment is surgical excision followed by radiotherapy and/or chemotherapy including temozolamide (TMZ) and PCV (combination of procarbazine, lomustine, and vincristine) (5, 9). However, some patients would be tolerant or resistant to such uniform treatment and progress to relapse and eventual lead to death faster than the others (5, 8), maybe due to the molecular heterogeneity of LGG (10–12), so the optimum timing of the therapeutic schedule needs to be determined case by case (13).
With the availability of public gene expression profiling data, more and more molecular predictive and prognostic indicators have recently been identified in LGG to guide the personalized therapy by informing which patients require early intervention and predicting the prognosis outcome (6, 14). However, it requires specific bioinformatics skills to perform prognosis analysis using these gene expression profiling data. It is desirable that users with limited bioinformatics skills can assess prognostic biomarkers for LGG using a convenient and easy-to-use bioinformatics tool. In the present study, we developed an easy-to-use web server named OSlgg, which provides a platform to evaluate the prognostic value of a gene of interest by applying Kaplan-Meier plot to present the association between candidate gene and survival rate, conduce to the clinical translation of potential prognostic biomarkers and targeted therapies for LGG patients.
Methods
Data Collection
Gene expression profiling and related long-term follow-up data of low-grade gliomas were collected from GEO (Gene Expression Omnibus) and TCGA (The Cancer Genome Atlas) database. For dataset searching, the keywords, including “low-grade glioma,” “gene expression,” and “survival” were used in GEO database. The criteria for dataset accession are as followed: (1) has gene expression profiling data; (2) includes the long-term follow-up data of patients; (3) contains more than 50 LGG cases to enable valid survival analysis. Thus, one GEO dataset (GSE107850) with 195 LGG cases was collected (Table 1). For TCGA dataset, gene expression profiling (RNA-seq, level-3, HiSeqV2) and follow-up data of 525 LGG cases were downloaded in 2019 (Table 1). The survival terms of follow-up data include OS (overall survival), RFS (relapse-free survival) and PFS (progression-free survival) (Table 1). And the clinicopathologic characteristics of LGG patients are summarized in Table S1.
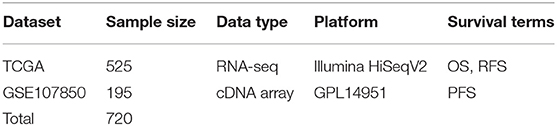
Table 1. Summary of datasets in OSlgg.
Development of OSlgg
OSlgg adopts object-orient programming method to develop each function module based on the structure of B/S (Browser/Server). Java and R are used to achieve server-side. The web server function was divided into three parts, including UI (user interface), data analysis and data access. Java and R language are used for data analysis and data access, respectively. UI is developed by HTML5, JQurey, and JSP. And the real time communication between web server and clients is achieved by Servlet. Gene expression profiling and clinical data were stored in relational tables in SQL Server database. System architecture flow diagram is presented in Figure 1, as previously described (15–18). OSlgg can be accessed at bioinfo.henu.edu.cn/LGG/LGGList.jsp.
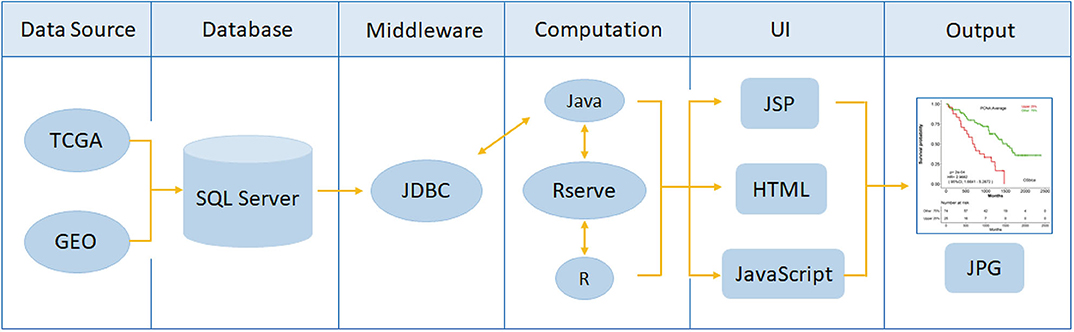
Figure 1. Flowchart of web server OSlgg architecture.
Verification of Prognostic Biomarkers in OSlgg
To assess the reliability of prognostic analysis of OSlgg web server, previously published prognostic biomarkers of LGG were searched in PubMed using the keywords “low-grade glioma,” “survival,” “prognosis” and “biomarker.” As a result, we collected 93 papers with 86 reported prognostic biomarkers. The prognostic abilities of these prognostic genes were assessed in OSlgg.
Discovery of Novel Prognostic Biomarkers in OSlgg
To identify novel prognostic biomarker for LGG, we genome-widely analyzed the prognostic values of human genes using Cox regression analysis. Genes significantly related to prognosis were selected (cox p value < 0.05), including CD302 and FABP5. As they exhibited significant correlation with prognosis (p value < 0.000001) in Cox regression analysis, we further evaluated the prognostic values of CD302 or FABP5 in OSlgg. In addition, correlation analysis and GSEA (Gene Set Enrichment Analysis) were performed to investigate the functions of CD302 and FABP5. Correlations between the expression levels of CD302 or FABP5 and 86 previously reported LGG prognostic biomarkers were assessed using Spearman's rank correlation test of a non-normal distribution as continuous measures and TCGA data. For GSEA analysis, patients from TCGA cohort were split into two subgroups according to CD302 or FABP5 expression, named as CD302 or FABP5 Upper 25% expression and Lower 75% expression. Then GSEA was run to investigate the gene sets enriched in each subgroup.
Statistical Analysis
Statistical evaluation was performed with SPSS 19.0 (SPSS Inc., Chicago, IL, USA) and GraphPad Prism 7.0 (GraphPad Inc., La Jolla, CA, USA). The association between CD302/FABP5 expression and clinicopathological characteristics was measured by using Chi-square test. Students' t-test and one-way ANOVA (analysis of variance) were employed to determine the significance of expression difference of CD302/FABP5 expression in distinct histologic grades and primary therapy outcomes, respectively. Univariate and multivariate cox regression analysis of CD302/FABP5 expression and clinical factors associated with survival of LGG patients were conducted by using SPSS. A value of p < 0.05 was considered to be statistical significant.
Results
Clinical Features of LGG Patients in OSlgg
In TCGA cohort, the median age of 525 LGG patients is 41. Three histological types were included. Specifically, astrocytoma accounts for 37% of all the LGG patients (n = 196), oligoastrocytoma accounts for 26% (n = 134) and oligodendroglioma accounts for 37% (n = 195) (Table S1). A summary of clinical features for each cohort was shown in Table S1. The Kaplan-Meier plots for LGG patients in OSlgg grouped by different histological type, histologic grade, IDH status, primary and follow-up therapy outcome were presented in Figure 2. As shown, these clinical features were significantly associated with survival (OS or PFS), respectively (Figure 2).
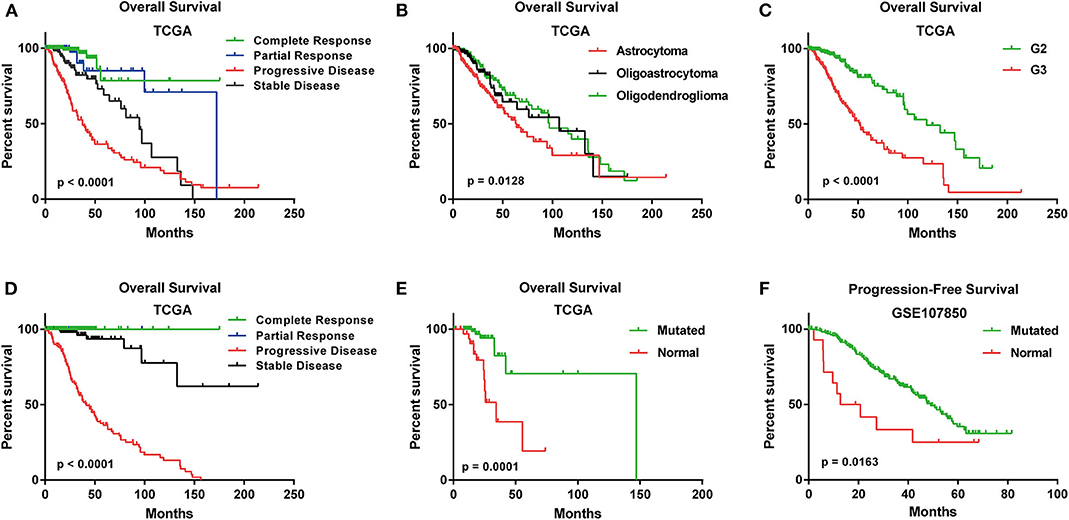
Figure 2. Survival analysis of LGG patients with different clinical features in OSlgg. Kaplan-Meier plots for (A) Primary therapy outcome, (B) Histological type, (C) Neoplasm histologic grade, (D) Follow-up therapy outcome, (E) IDH status in terms of OS in TCGA cohort; (F) IDH status in terms of PFS in GSE107850 cohort.
Application of OSlgg
In OSlgg, “Gene symbol,” “Data Source,” “Survival,” and “Split patients by” are set as the four main parameters to assess the prognostic value of a gene of interest (Figures 3, 4). Typically, the official gene symbol is required to be filled into the “Gene symbol” input box by users. Drop-down menu of “Data source” offers two options for users to pick either of the two independent cohorts (TCGA and GSE107850) (Figure 3B). Next, users may select the cut-off, by which patients can be split into 2-4 groups according to the expression of the inquired gene (Figure 3C). Furthermore, according to user's special needs, users may divide LGG patients into subgroups by setting different clinical factors, such as histological type, IDH status, therapy outcome, gender, treatment, etc. (Figures 3, 4). Then user could click the “Kaplan-Meier plot” button, OSlgg will receive the query and output the analysis results to users in a graphical manner on the web page, present the Kaplan-Meier survival curve, HR (with 95% confidence interval) and p value.
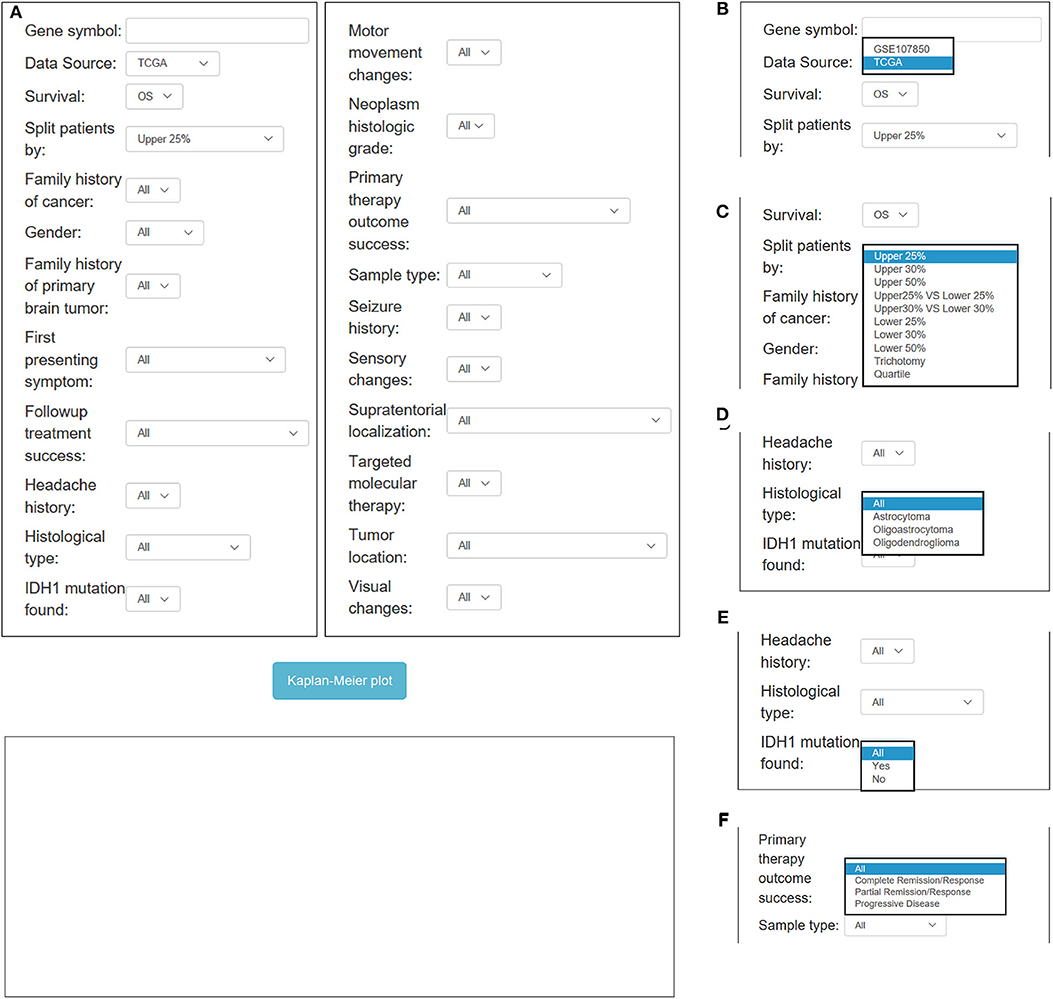
Figure 3. Overview of OSlgg subfield interface for TCGA cohort. (A) Screenshot of OSlgg main interface. (B–F) Input interfaces of OSlgg for Data source (B), cut-off (C), Histological type (D), IDH1 mutation (E), and therapy outcome (F).
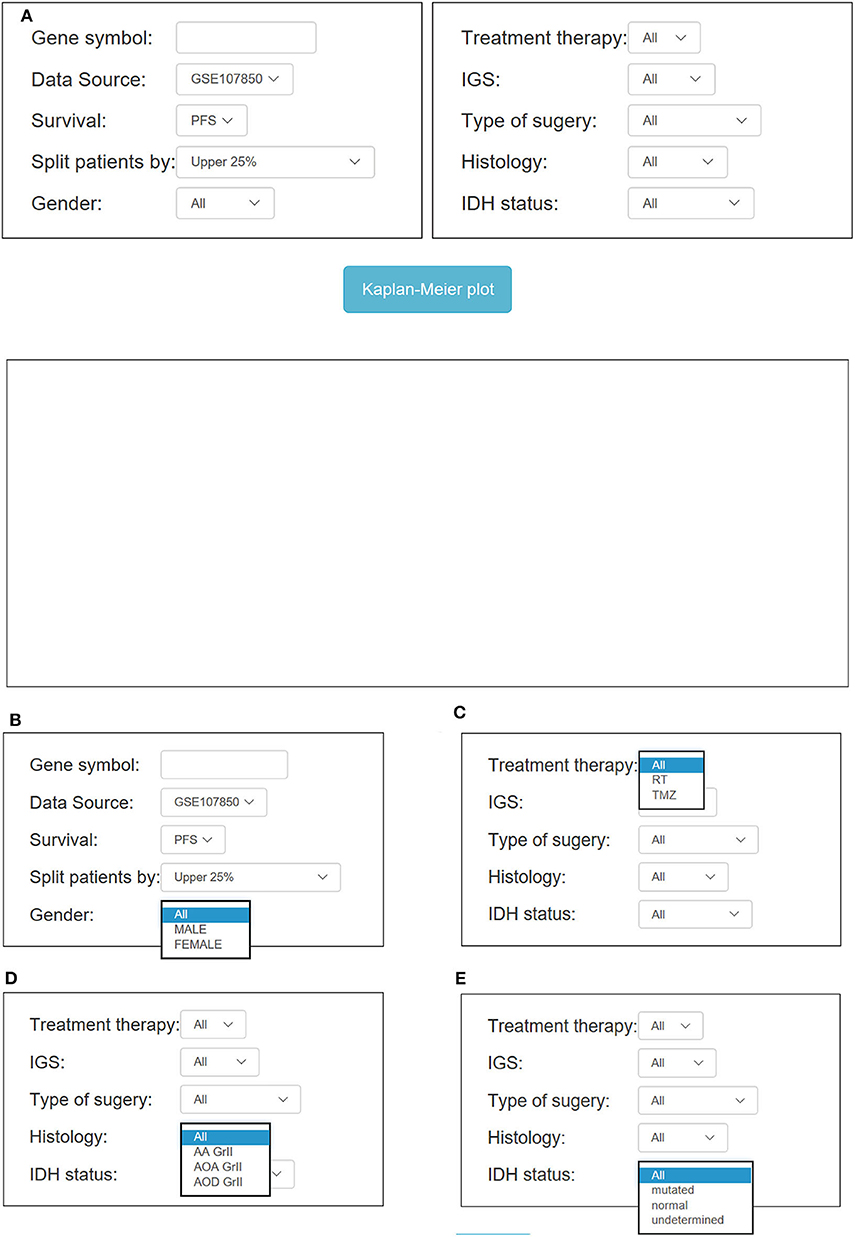
Figure 4. Overview of OSlgg subfield interface for GSE107850 cohort. (A) Screenshot of OSlgg main interface. (B–E) Input interfaces of OSlgg for Gender (B), Treatment (C), Histology (D), and IDH status (E).
Verification of Previously Published LGG Prognostic Biomarkers in OSlgg
To test the reliability of OSlgg web server in prognosis analysis, we collected 86 previously published prognostic biomarkers from 93 papers, including β-catenin, NF-kB, vimentin, Cyclin A, CD31, etc., and assessed their prognostic performances in OSlgg. The analysis results by OSlgg showed that all the 86 biomarkers have predictive values in OSlgg, which was consistent with previous reports (Table 2 and Table S2, Figure 5 and Figure S1), and the housekeeping genes were also presented as negative controls (Figure S2). Among these, N-cadherin (encoded by CDH2 gene), EGFR, IDH1, VEGF, nestin (encoded by NES gene), survivin (encoded by BIRC5 gene), PCNA, Ki-67 (encoded by MKI67 gene), and p27 (encoded by CDKN1B gene) were frequently reported as risk predictors for LGG (19–34). As previously described, these genes were significantly associated with survival (OS, RFS and PFS) in OSlgg (Table 2, Figure 5 and Figure S1). The elevated expression of CDH2, EGFR, IDH1, VEGFA, NES, BIRC5, PCNA, and MKI67 indicated the unfavorable outcome, while the increased CDKN1B expression predicted a favorable outcome for LGG patients (Table 2, Figure 5 and Figure S1). In the remaining 77 biomarkers, 59 genes were adverse predictors, and 18 genes were beneficial predictors (Table S2).
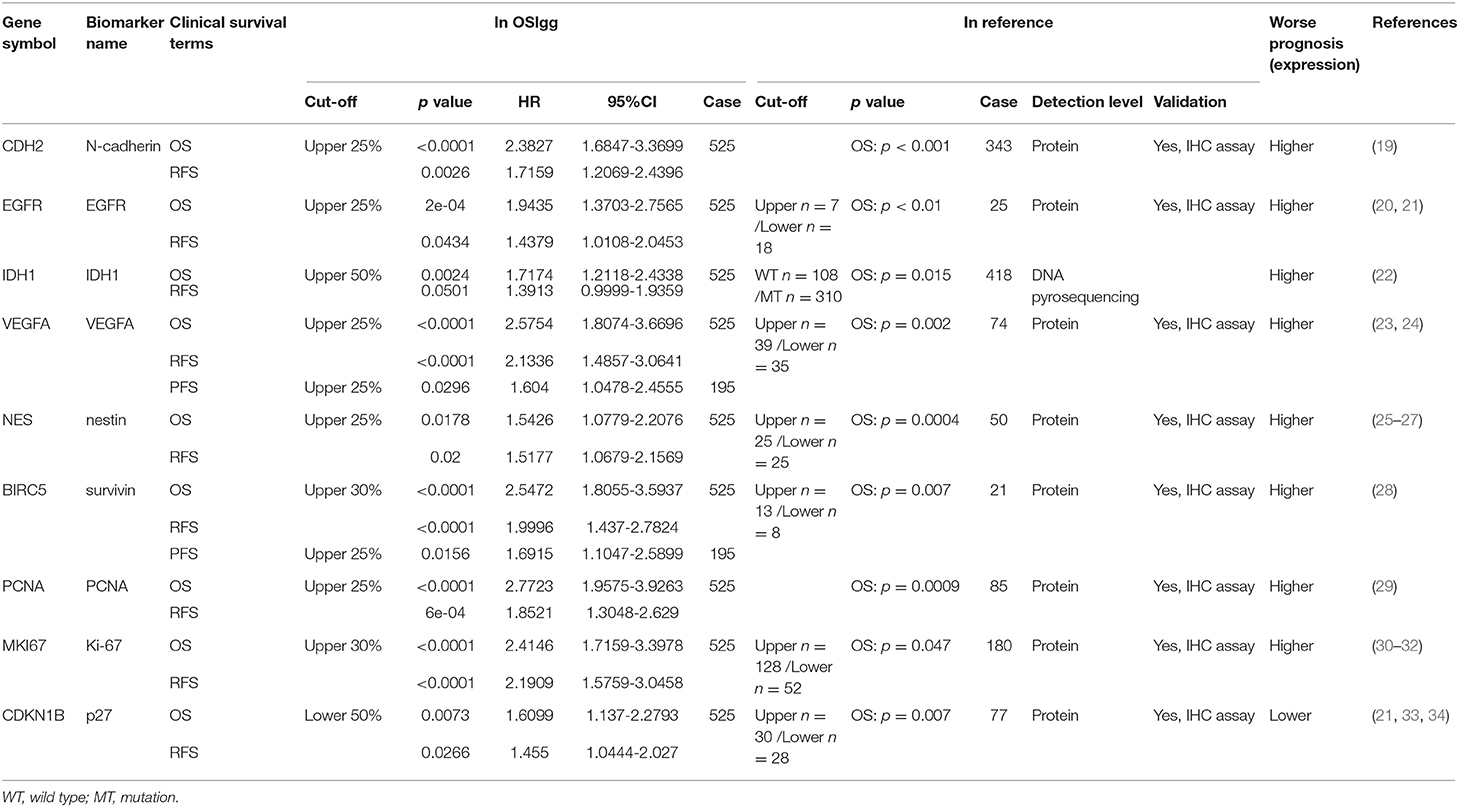
Table 2. Verification of previously reported LGG prognostic predictors in OSlgg.
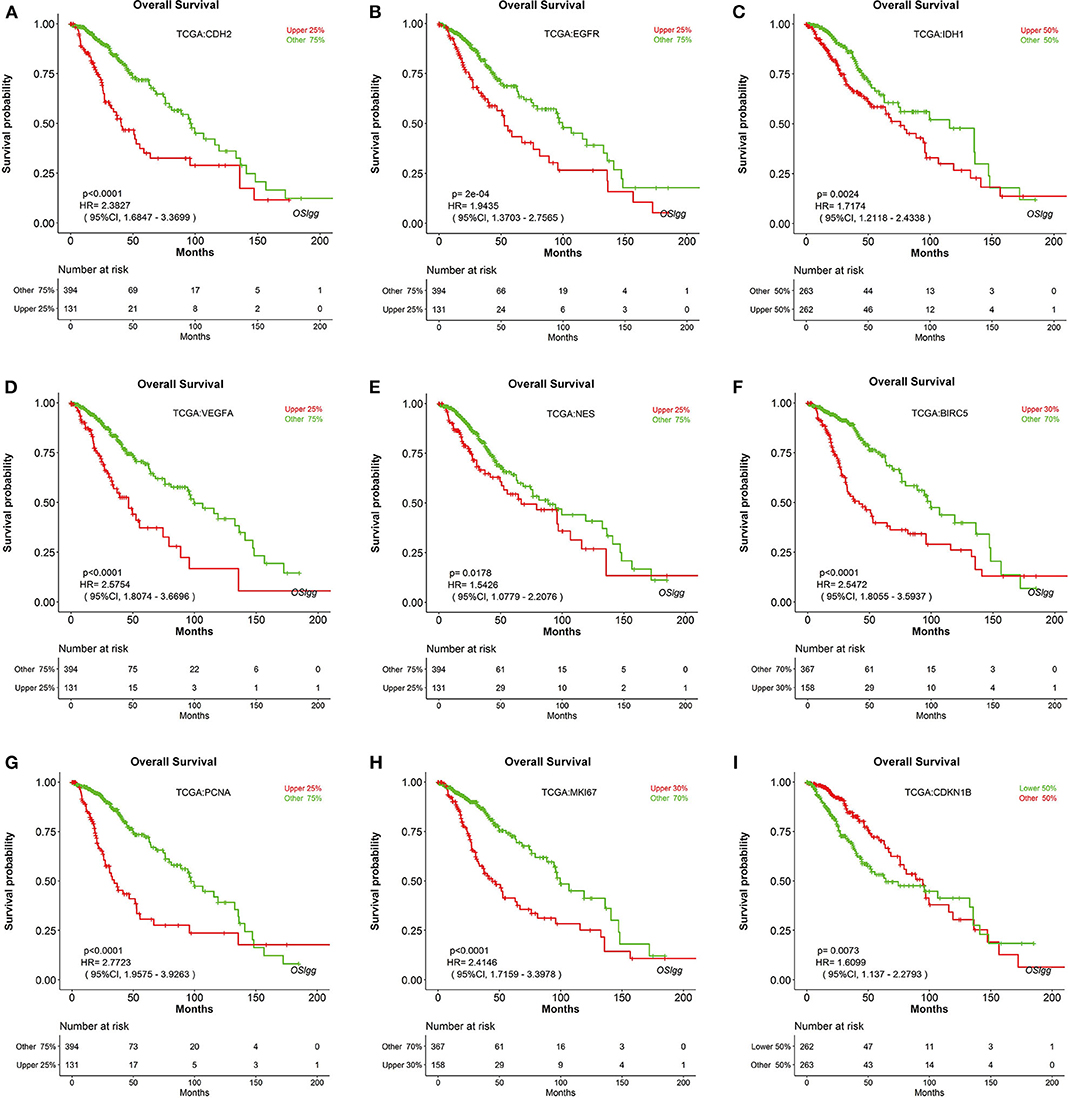
Figure 5. Verification of previously reported prognostic biomarkers in OSlgg. Kaplan[[Inline Image]]-Meier plots for (A) CDH2, (B) EGFR, (C) IDH1, (D) VEGFA, (E) NES, (F) BIRC5, (G) PCNA, (H) MKI67, and (I) CDKN1B in terms of OS. p-value, confidence interval (95%CI) and number at risk are as shown. The y-axis represents survival rate and the x-axis represents survival time (months).
Discovery of Novel Potential Prognostic Biomarkers in OSlgg
In order to discover novel risk predictors for LGG, we analyzed the prognostic abilities of all known human genes using Cox regression. As a result, two genes were identified as potential biomarkers, including CD302 and FABP5, which were both significantly associated with survival (OS, RFS and PFS) in OSlgg (Figure 6 and Table 3). Moreover, we found that patients with elevated CD302 or FABP5 expression exhibited worse survival in both TCGA (OS and RFS) and GSE107850 (PFS) datasets, while the lower expression patients presented better survival (Figure 6 and Table 3), indicating that both CD302 and FABP5 could predict the adverse outcome as unfavorable predictors.
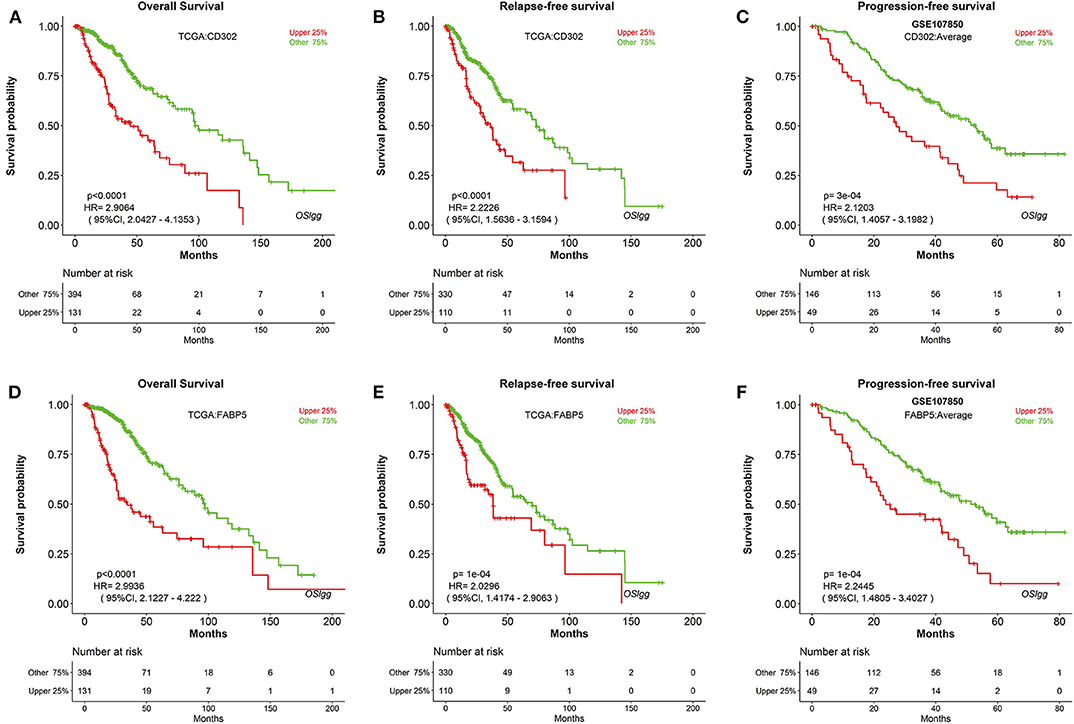
Figure 6. Identification of potential prognostic biomarkers in OSlgg. Kaplan-Meier plots for low (green) and high (red) CD302 (A–C) or FABP5-expression (D–F) in TCGA cohort (A,B,D,E) and GSE107850 cohort (C,F). (A,D) OS, Overall survival; (B,E) RFS, Relapse-free survival; (C,F) PFS, Progression-free survival. p-value, confidence interval (95%CI) and number at risk are as shown. The y-axis represents survival rate and the x-axis represents survival time (months).
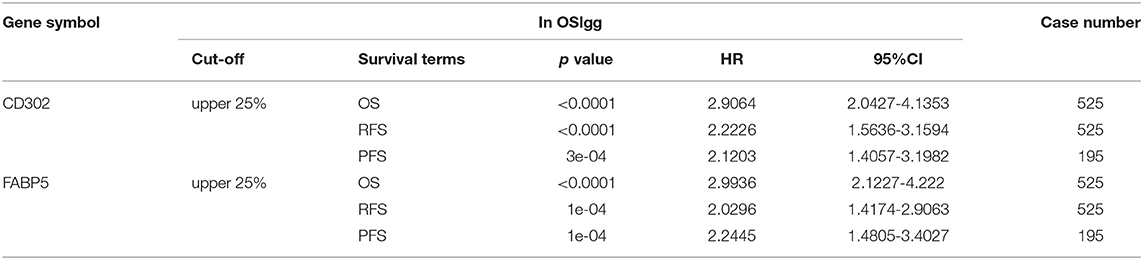
Table 3. Identification of potential LGG prognostic biomarkers in OSlgg.
To determine whether the prognostic significances of CD302 and FABP5 are caused by correlation with the previously reported prognostic genes, the correlation analysis between CD302/FABP5 and the 86 reported prognostic biomarkers were performed, and showed that CD302/FABP5 were positively correlated with 6 reported prognostic genes, including RAB34, CHI3L1, VIM, YAP1, FTL, and MMP14 (Figure 7A). Among these, RAB34 is positively associated with both CD302 and FABP5, CHI3L1 is positively associated with FABP5, and the remaining four genes are all positively correlated with CD302 (Figure 7A). The GSEA analysis of LGG cases showed that those cases with high CD302 expression enriched gene sets involved in JAK/STAT signaling pathway, cytokine receptor interaction, and primary immunodeficiency (Figure 7B). And the same analysis found that LGG cases with higher FABP5 expression enriched gene sets including ECM receptor interaction, cytokine receptor interaction and JAK/STAT signaling pathway (Figure 7C). Moreover, LGG with CD302 overexpression presented GPR65 and PIK3CG up-regulation, while CHI3L1 and RAB36 were up-regulated in tumors with FABP5 overexpression (Figures 7D,E). In addition, we found that GPR65, PIK3CG, and RAB36 have prognostic abilities in LGG, the elevated expression of which were significantly associated with worse survival of LGG patients (Table S2 and Figure S3). As Figure S4 showed, there is no significant difference of the copy numbers between CD302 or FABP5 higher and lower expression groups, respectively, indicating the prognostic significance of CD302 and FABP5 is not caused by genomic copy number changes.
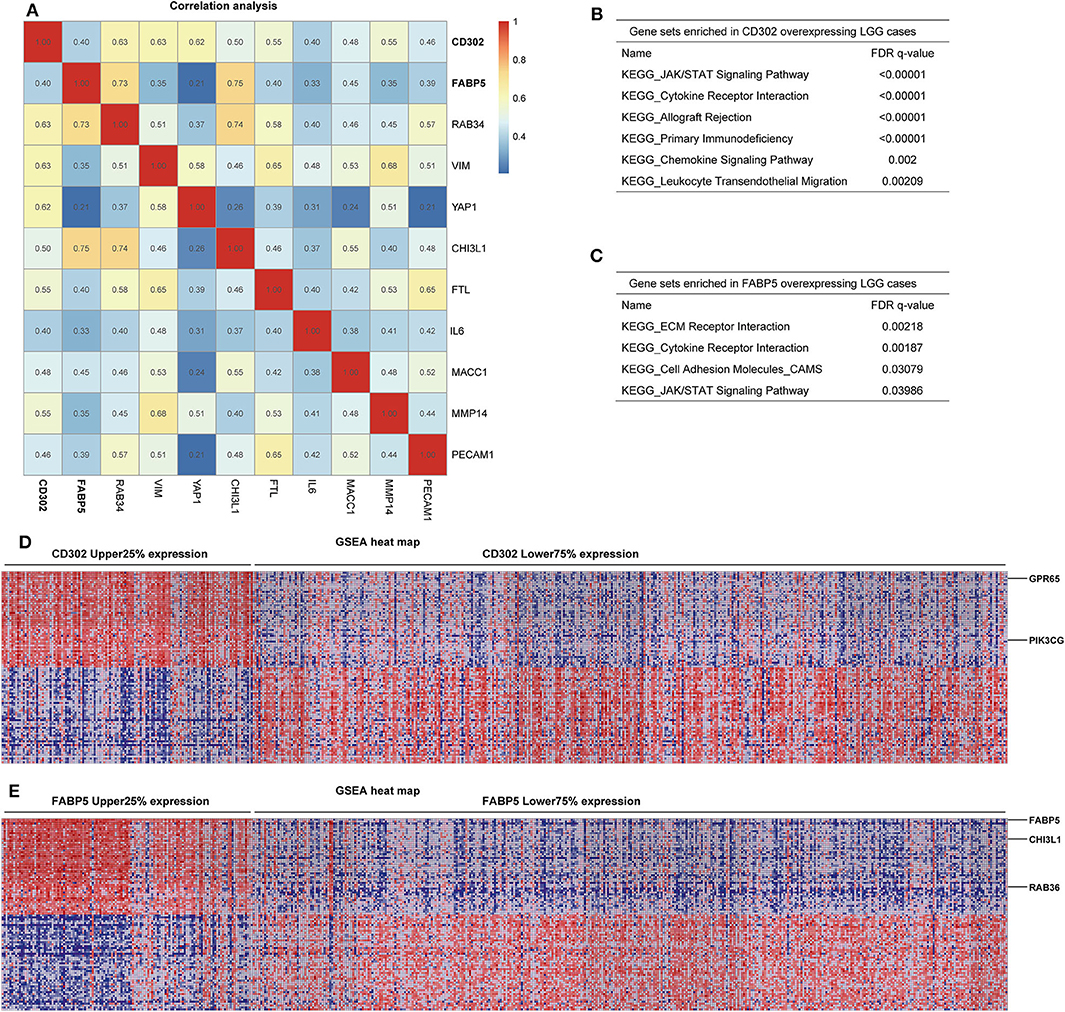
Figure 7. Correlation and GSEA analysis of CD302 and FABP5. (A) Correlation analysis between CD302 or FABP5 and the previously reported prognostic biomarkers by Spearman's rank correlation test with correlation coefficient marked on the matrix plot. (B–E) GSEA analysis of tumors with high versus low expression of CD302 and FABP5. LGG patients were split into two subgroups according to CD302 or FABP5 expression, named as CD302 or FABP5 Upper 25% expression and Lower 75% expression. (B,C) Gene sets enriched in CD302 and FABP5 overexpressing LGG cases, respectively. (D,E) GSEA heat maps for differential expression genes enriched in CD302 and FABP5 overexpressing LGG cases, respectively.
Independent Prognostic and Clinical Significance of CD302 and FABP5
To further investigate the relationship between CD302/FABP5 and clinical factors, we analyzed the expression differences of CD302/FABP5 between LGG subgroups with distinct clinical features, the results showed that LGG patients suffered from histologic grade 3 and progressive disease had significant higher expression of CD302/FABP5, respectively (Figure S5). In addition, as shown in Table 4, the expression of CD302/FABP5 was significantly associated with histologic grade and primary therapy outcome. The higher CD302 and FABP5 expression subgroup presented a significantly higher ratio of patients in histologic grade 3 (91/40 vs. 178/215, p < 0.001 and 85/46 vs. 184/209, p < 0.001) compared to the lower CD302 and FABP5 subgroup, respectively (Table 4). The following multivariate analysis confirmed that the elevated CD302/FABP5 expression is an independent prognostic indicator of LGG survival (HR: 1.842, 95% CI: 1.232-2.754, p = 0.003, and HR: 2.187, 95% CI: 1.488-3.214, p < 0.001), respectively (Table 5).
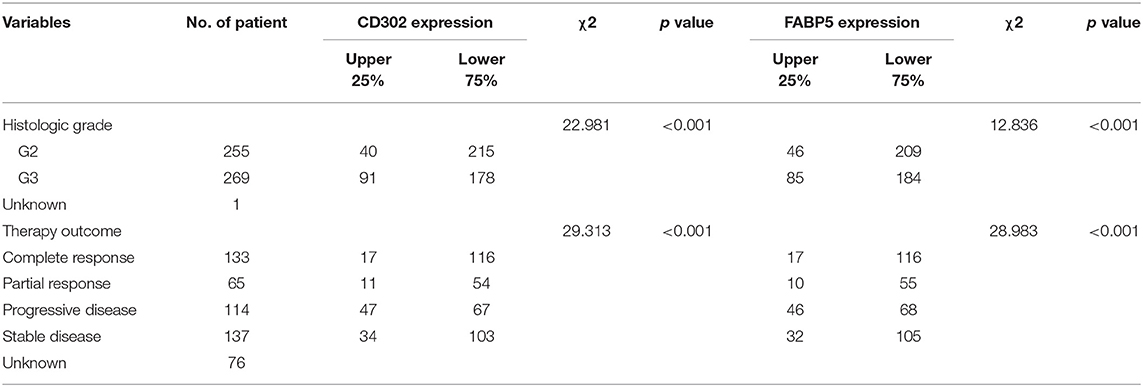
Table 4. The association of CD302 or FABP5 expression with clinical features in LGG patients.
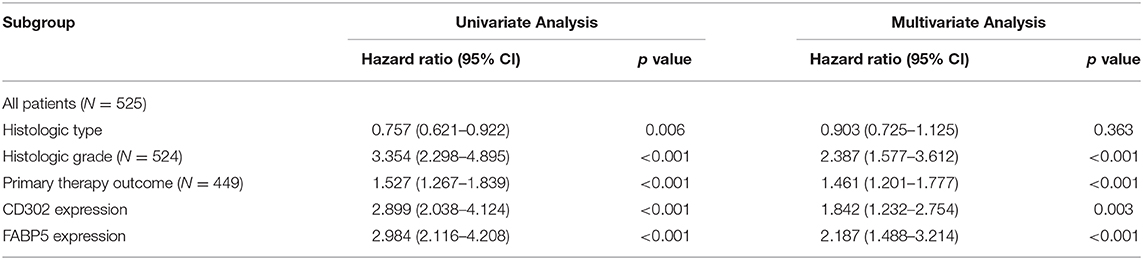
Table 5. Univariate and multivariate analysis of factors associated with LGG survival.
Furthermore, we also found that the prognostic abilities of CD302 and FABP5 were independent of the critical clinical features of LGG patients, including histologic grade, therapy and primary therapy outcome (Figures 8, 9, Figures S6, S7). In detail, patients with CD302/FABP5 overexpression exhibited worse survival in both histologic grade 2 and 3 (Figure 8), both stable and progressive disease (Figure 9), and both radiotherapy and TMZ (temozolomide) therapy (Figures S6, S7), while no significant prognostic significance of CD302/FABP5 observed in patients with complete and partial response.
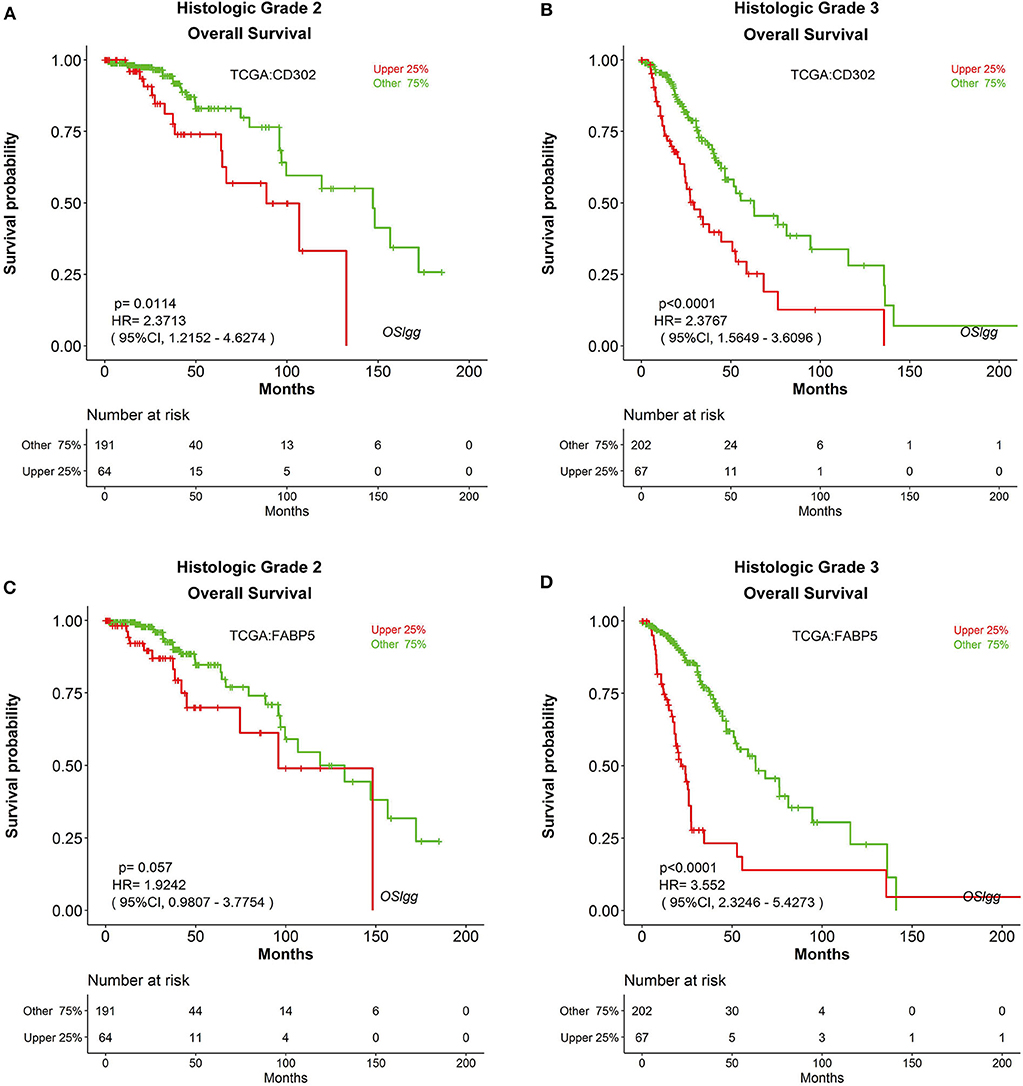
Figure 8. The prognostic abilities of CD302 and FABP5 in terms of histologic grade. Kaplan-Meier plots for CD302 in histologic grade 2 (A) and 3 (B), and for FABP5 in histologic grade 2 (C) and 3 (D), respectively. p-value, confidence interval (95%CI) and number at risk are as shown. The y-axis represents survival rate and the x-axis represents survival time (months).
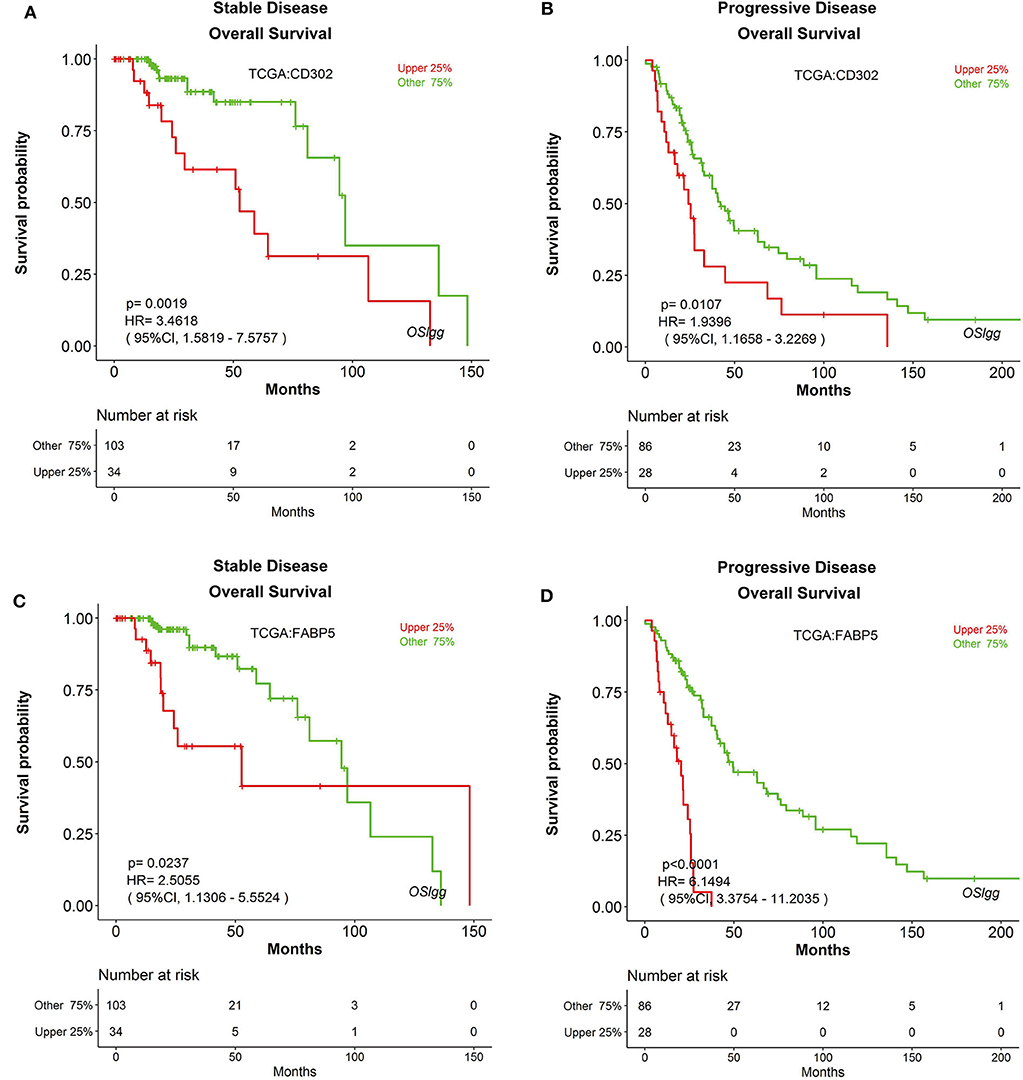
Figure 9. The prognostic abilities of CD302 and FABP5 in terms of primary therapy outcome. Kaplan-Meier plots for CD302 in stable (A) and progressive (B) disease, and for FABP5 in stable (C) and progressive (D) disease, respectively. p-value, confidence interval (95%CI) and number at risk are as shown. The y-axis represents survival rate and the x-axis represents survival time (months).
Discussion
Gliomas are graded as I to IV according to the histology and clinical criteria. Grade II and III glioma are designated as low-grade glioma (LGG) (1–4). Although LGG accounts for a minority of gliomas, it is the major cause of mortality for young adults (14). Although the survival outcomes for patients diagnosed with LGG are better than those for high-grade gliomas, LGG almost universally advances to high-grade glioma (5, 8). Surgical resection is the major treatment for LGG. However, even under gross total resection (GTR), the survival rates of LGG patients are still low, having the risk of tumor progression (9). Some low-risk patients exhibit tumor progression-free without intervention, while others with high-risk suffer from the progressive disease, for which intervention treatment may be given after being diagnosed (6). As the patients suffering from LGG have distinct clinical performances, it is necessary to classify patients into subgroups with different risks to guide following treatments.
In this study, we developed a web server OSlgg, by which users could evaluate the prognostic value of genes of interest even for users with limited bioinformatics skills. To determine the reliability of OSlgg, we have verified the prognostic roles of 86 previously reported LGG prognostic biomarkers including IDH1, BIRC5, CDKN1B, PCNA, and MKI67. Furthermore, we have identified two novel potential prognostic biomarkers for LGG patients, including CD302 and FABP5. As C-type lectin receptor, CD302 has roles in cell immune and migration (35, 36), and acts as a prognostic biomarker in myeloma (37), is also a potential therapeutic target for acute myeloid leukemia (38). In addition, CD302 had been identified as a biomarker to categorize the metastases of neuroendocrine tumors (NET) (39), and it is reported to be overexpressed in high grade NET (40). Fatty acid-binding protein 5 (FABP5) is involved in fatty acid transport, and acts as a prognostic biomarker in cervical cancer, triple-negative breast cancer and clear cell renal cell carcinoma (41–43). In addition, FABP5 was found to be expressed in 9 of 23 gliomas with moderate to strong cytoplasmic staining in Human Protein Atlas (HPA) database, and was reported to be expressed in grade II (19/30) and III (22/31) astrocytoma (a histologic subtype of glioma) (44). The prognostic abilities of CD302 and FABP5 have not been reported in LGG yet. In our server, the cox regression analysis reveals that CD302 and FABP5 are significantly correlated with survival outcomes of LGG patients, patients with lower expression of CD302 and FABP5 have improved outcomes compared to patients with higher expression of these genes, and we found that the elevated CD302/FABP5 expression was significantly associated with higher histologic grade and worse therapeutic outcome, in the meanwhile, we found that CD302 and FABP5 were independent prognostic indicators of LGG.
Additional correlation analysis showed that CD302 and FABP5 were significantly correlated with 6 of 86 reported unfavorable prognostic biomarkers including RAB34, CHI3L1, VIM, YAP1, FTL, and MMP14, which predicted adverse outcome (45–50). These six CD302/FABP5 correlated genes were reported to be involved in tumor cell proliferation, migration, invasion and EMT (46–53). GSEA results showed LGG tumors with high expression of CD302 or FABP5 enriched JAK/STAT and ECM receptor interaction signaling pathway, which are reported to be involved in tumorigenesis and could promote tumor progression (54, 55). Moreover, LGG tumors with CD302 or FABP5 overexpression highly expressed some oncogenes, including GPR65, PIK3CG, CHI3L1, and RAB36, which were reported to promote tumor growth and metastasis (56–60). Taken together, our results highlight the clinical significance of CD302 and FABP5 in LGG, the expression of which may have a close association with tumorigenesis and malignant progression of LGG. Further assays for biological functions of these genes may offer opportunities for targeted therapies in LGG.
The limitation of OSlgg is that currently only 720 LGG cases are available in our server. Once new datasets with profiling and clinical follow-up data become available, we will update OSlgg to expand the dataset and enhance the performance.
In summary, we developed a prognosis analysis web server OSlgg, which provides a platform for researchers and clinicians to evaluate the prognostic values of genes of interest, and may offer opportunities to facilitate the development of novel targeted strategies for LGG.
Data Availability Statement
Publicly available datasets were analyzed in this study. This data can be found here: TCGA database (https://www.cancer.gov/about-nci/organization/ccg/research/structural-genomics/tcga) and GEO database (https://www.ncbi.nlm.nih.gov/gds/?term=).
Author Contributions
YA, QW, and XG developed the server, performed the evaluation of novel prognostic biomarkers, and drafted the paper. LZ, FS, GZ, and HD performed the validation of previous reported biomarkers. HL, YL, and YP collected LGG datasets. WZ, SJ, and YW contributed to data analysis and paper revision. All authors approved the final manuscript.
Funding
This work was supported by National Natural Science Foundation of China (No. 81602362), and Program for Innovative Talents of Science and Technology in Henan Province (No. 18HASTIT048), Program for Science and Technology Development in Henan Province (No. 162102310391; No. 172102210187), Program for Scientific and Technological Research of Henan Education Department (No. 14B520022), Kaifeng Science and Technology Major Project (No. 18ZD008), Supporting grant of Bioinformatics Center of Henan University (No. 2018YLJC01), and Innovation Project for College Students of Henan University (No. 2019101904).
Conflict of Interest
The authors declare that the research was conducted in the absence of any commercial or financial relationships that could be construed as a potential conflict of interest.
Supplementary Material
The Supplementary Material for this article can be found online at: https://www.frontiersin.org/articles/10.3389/fonc.2020.01097/full#supplementary-material
Figure S1. Verification of previously reported prognostic biomarkers in OSlgg. Kaplan-Meier plots for (A) CDH2, (B) EGFR, (C) IDH1, (D,J) VEGFA, (E) NES, (F,K) BIRC5, (G) PCNA, (H) MKI67 and (I) CDKN1B in terms of RFS and PFS. (A–I) RFS, Relapse-free survival, in TCGA cohort; (J,K) PFS, Progression-free survival, in GSE107850 cohort.
Figure S2. Kaplan-Meier plots for housekeeping genes as negative controls. (A) TUBB1, (B) TUBB3 and (C) ACTA1, were presented as negative control genes of Figure 5.
Figure S3. Prognostic analysis of reported oncogenes up-regulated in CD302/FABP5 overexpression cohort. Kaplan-Meier plots for (A) GPR65, (B) PIK3CG, (C) CHI3L1 and (D) RAB36. p-value, confidence interval (95%CI) and number at risk are as shown. The y-axis represents survival rate and the x-axis represents survival time (months).
Figure S4. Analysis of the relationship between mRNA expression and copy number variation of CD302 (A) and FABP5 (B) in 508 LGG patients.
Figure S5. Comparison of CD302/FABP5 expression differences in distinct clinical features. (A,B) histologic grade, (C,D) primary therapy outcome. TPM, Transcripts Per Million.
Figure S6. The prognostic abilities of CD302 and FABP5 in terms of treatment in TCGA cohort. (A) Kaplan-Meier plots for radiotherapy treatment in all tumors. (B,C) Kaplan-Meier plots for CD302 high vs. low expression in tumors with and without radiotherapy, respectively. (D,E) Kaplan-Meier plots for FABP5 high vs. low expression in tumors with and without radiotherapy, respectively. p-value is as shown. The y-axis represents survival rate and the x-axis represents survival time (months).
Figure S7. The prognostic abilities of CD302 and FABP5 in terms of treatment in GSE107850 cohort. (A,B) Kaplan-Meier plots for CD302 in radiotherapy and TMZ (temozolomide) therapy, respectively. (C,D) Kaplan-Meier plots for FABP5 in radiotherapy and TMZ (temozolomide) therapy, respectively. p-value, confidence interval (95%CI) and number at risk are as shown. The y-axis represents survival rate and the x-axis represents survival time (months).
Table S1. Clinicopathologic Characteristics of LGG patients.
Table S2. Verification of previous published predictors for LGG survival in OSlgg.
References
1. Zhang YA, Zhou Y, Luo X, Song K, Ma X, Sathe A, et al. SHOX2 is a potent independent biomarker to predict survival of WHO Grade II-III Diffuse Gliomas. EBioMedicine. (2016) 13:80–9. doi: 10.1016/j.ebiom.2016.10.040
2. Carter JH, McNulty SN, Cimino PJ, Cottrell CE, Heusel JW, Vigh-Conrad KA, et al. Targeted next-generation sequencing in molecular subtyping of lower-grade diffuse gliomas: application of the World Health Organization's 2016 revised criteria for central nervous system tumors. J Mol Diagn. (2017) 19:328–37. doi: 10.1016/j.jmoldx.2016.10.010
3. Louis DN, Perry A, Reifenberger G, von Deimling A, Figarella-Branger D, Cavenee WK, et al. The 2016 World Health Organization Classification of tumors of the central nervous system: a summary. Acta Neuropathol. (2016) 131:803–20. doi: 10.1007/s00401-016-1545-1
4. Louis DN, Ohgaki H, Wiestler OD, Cavenee WK, Burger PC, Jouvet A, et al. The 2007 WHO classification of tumours of the central nervous system. Acta Neuropathol. (2007) 114:97–109. doi: 10.1007/s00401-007-0243-4
5. Claus EB, Walsh KM, Wiencke JK, Molinaro AM, Wiemels JL, Schildkraut JM, et al. Survival and low-grade glioma: the emergence of genetic information. Neurosurg Focus. (2015) 38:E6. doi: 10.3171/2014.10.FOCUS12367
6. Schiff D, Brown PD, Giannini C. Outcome in adult low-grade glioma: the impact of prognostic factors and treatment. Neurology. (2007) 69:1366–73. doi: 10.1212/01.wnl.0000277271.47601.a1
7. Sahm F, Reuss D, Koelsche C, Capper D, Schittenhelm J, Heim S, et al. Farewell to oligoastrocytoma: in situ molecular genetics favor classification as either oligodendroglioma or astrocytoma. Acta Neuropathol. (2014) 128:551–9. doi: 10.1007/s00401-014-1326-7
8. Bready D, Placantonakis DG. Molecular Pathogenesis of Low-Grade Glioma. Neurosurg Clin N Am. (2019) 30:17–25. doi: 10.1016/j.nec.2018.08.011
9. Pedersen CL, Romner B. Current treatment of low grade astrocytoma: a review. Clin Neurol Neurosurg. (2013) 115:1–8. doi: 10.1016/j.clineuro.2012.07.002
10. Olar A, Sulman EP. Molecular markers in low-grade glioma-toward tumor reclassification. Semin Radiat Oncol. (2015) 25:155–63. doi: 10.1016/j.semradonc.2015.02.006
11. Cohen AL, Colman H. Glioma biology and molecular markers. Cancer Treat Res. (2015) 163:15–30. doi: 10.1007/978-3-319-12048-5_2
12. Weiler M, Wick W. Molecular predictors of outcome in low-grade glioma. Curr Opin Neurol. (2012) 25:767–73. doi: 10.1097/WCO.0b013e32835a0217
13. Stupp R, Janzer RC, Hegi ME, Villemure JG, Mirimanoff RO. Prognostic factors for low-grade gliomas. Semin Oncol. (2003) 30(6 Suppl 19):23–8. doi: 10.1053/j.seminoncol.2003.11.029
14. Picca A, Berzero G, Sanson M. Current therapeutic approaches to diffuse grade II and III gliomas. Ther Adv Neurol Disord. (2018) 11:1756285617752039. doi: 10.1177/1756285617752039
15. Zhang G, Wang Q, Yang M, Yuan Q, Dang Y, Sun X, et al. OSblca: a web server for investigating prognostic biomarkers of bladder cancer patients. Front Oncol. (2019) 9:466. doi: 10.3389/fonc.2019.00466
16. Wang Q, Xie L, Dang Y, Sun X, Xie T, Guo J, et al. OSlms: a web server to evaluate the prognostic value of genes in leiomyosarcoma. Front Oncol. (2019) 9:190. doi: 10.3389/fonc.2019.00190
17. Xie L, Wang Q, Dang Y, Ge L, Sun X, Li N, et al. OSkirc: a web tool for identifying prognostic biomarkers in kidney renal clear cell carcinoma. Future Oncol. (2019) 15:3103–10. doi: 10.2217/fon-2019-0296
18. Wang Q, Wang F, Lv J, Xin J, Xie L, Zhu W, et al. Interactive online consensus survival tool for esophageal squamous cell carcinoma prognosis analysis. Oncol Lett. (2019) 18:1199–206. doi: 10.3892/ol.2019.10440
19. Noh MG, Oh SJ, Ahn EJ, Kim YJ, Jung TY, Jung S, et al. Prognostic significance of E-cadherin and N-cadherin expression in Gliomas. BMC Cancer. (2017) 17:583. doi: 10.1186/s12885-017-3591-z
20. Varela M, Ranuncolo SM, Morand A, Lastiri J, De Kier Joffe EB, Puricelli LI, et al. EGF-R and PDGF-R, but not bcl-2, overexpression predict overall survival in patients with low-grade astrocytomas. J Surg Oncol. (2004) 86:34–40. doi: 10.1002/jso.20036
21. Nabika S, Kiya K, Satoh H, Mizoue T, Kondo H, Katagiri M, et al. Prognostic significance of expression patterns of EGFR family, p21 and p27 in high-grade astrocytoma. Hiroshima J Med Sci. (2010) 59:65–70.
22. Li MY, Wang YY, Cai JQ, Zhang CB, Wang KY, Cheng W, et al. Isocitrate dehydrogenase 1 gene mutation is associated with prognosis in clinical low-grade gliomas. PLoS ONE. (2015) 10:e0130872. doi: 10.1371/journal.pone.0130872
23. Abdulrauf SI, Edvardsen K, Ho KL, Yang XY, Rock JP, Rosenblum ML. Vascular endothelial growth factor expression and vascular density as prognostic markers of survival in patients with low-grade astrocytoma. J Neurosurg. (1998) 88:513–20. doi: 10.3171/jns.1998.88.3.0513
24. Karayan-Tapon L, Wager M, Guilhot J, Levillain P, Marquant C, Clarhaut J, et al. Semaphorin, neuropilin and VEGF expression in glial tumours: SEMA3G, a prognostic marker? Br J Cancer. (2008) 99:1153–60. doi: 10.1038/sj.bjc.6604641
25. Hatanpaa KJ, Hu T, Vemireddy V, Foong C, Raisanen JM, Oliver D, et al. High expression of the stem cell marker nestin is an adverse prognostic factor in WHO grade II-III astrocytomas and oligoastrocytomas. J Neurooncol. (2014) 117:183–9. doi: 10.1007/s11060-014-1376-7
26. Zhang M, Song T, Yang L, Chen R, Wu L, Yang Z, et al. Nestin and CD133: valuable stem cell-specific markers for determining clinical outcome of glioma patients. J Exp Clin Cancer Res. (2008) 27:85. doi: 10.1186/1756-9966-27-85
27. Strojnik T, Rosland GV, Sakariassen PO, Kavalar R, Lah T. Neural stem cell markers, nestin and musashi proteins, in the progression of human glioma: correlation of nestin with prognosis of patient survival. Surg Neurol. (2007) 68:133–43; discussion 43–4. doi: 10.1016/j.surneu.2006.10.050
28. Uematsu M, Ohsawa I, Aokage T, Nishimaki K, Matsumoto K, Takahashi H, et al. Prognostic significance of the immunohistochemical index of survivin in glioma: a comparative study with the MIB-1 index. J Neurooncol. (2005) 72:231–8. doi: 10.1007/s11060-004-2353-3
29. Vigliani MC, Chio A, Pezzulo T, Soffietti R, Giordana MT, Schiffer D. Proliferating cell nuclear antigen (PCNA) in low-grade astrocytomas: its prognostic significance. Tumori. (1994) 80:295–300. doi: 10.1177/030089169408000411
30. Fisher BJ, Naumova E, Leighton CC, Naumov GN, Kerklviet N, Fortin D, et al. Ki-67: a prognostic factor for low-grade glioma? Int J Radiat Oncol Biol Phys. (2002) 52:996–1001. doi: 10.1016/S0360-3016(01)02720-1
31. Zeng A, Hu Q, Liu Y, Wang Z, Cui X, Li R, et al. IDH1/2 mutation status combined with Ki-67 labeling index defines distinct prognostic groups in glioma. Oncotarget. (2015) 6:30232–8. doi: 10.18632/oncotarget.4920
32. Ahmed S, Rashed H, Hegazy A, Mohamed AM, Elmesallamy W. Prognostic value of ALDH1, EZH2 and Ki-67 in astrocytic gliomas. Turk Patoloji Derg. (2016) 32:70–81. doi: 10.5146/tjpath.2015.01344
33. Kirla RM, Haapasalo HK, Kalimo H, Salminen EK. Low expression of p27 indicates a poor prognosis in patients with high-grade astrocytomas. Cancer. (2003) 97:644–8. doi: 10.1002/cncr.11079
34. Mizumatsu S, Tamiya T, Ono Y, Abe T, Matsumoto K, Furuta T, et al. Expression of cell cycle regulator p27Kip1 is correlated with survival of patients with astrocytoma. Clin Cancer Res. (1999) 5:551–7.
35. Lo TH, Silveira PA, Fromm PD, Verma ND, Vu PA, Kupresanin F, et al. Characterization of the expression and function of the C-Type lectin receptor cd302 in mice and humans reveals a role in dendritic cell migration. J Immunol. (2016) 197:885–98. doi: 10.4049/jimmunol.1600259
36. Kato M, Khan S, d'Aniello E, McDonald KJ, Hart DN. The novel endocytic and phagocytic C-Type lectin receptor DCL-1/CD302 on macrophages is colocalized with F-actin, suggesting a role in cell adhesion and migration. J Immunol. (2007) 179:6052–63. doi: 10.4049/jimmunol.179.9.6052
37. Alaterre E, Raimbault S, Goldschmidt H, Bouhya S, Requirand G, Robert N, et al. CD24, CD27, CD36 and CD302 gene expression for outcome prediction in patients with multiple myeloma. Oncotarget. (2017) 8:98931–44. doi: 10.18632/oncotarget.22131
38. Lo TH, Abadir E, Gasiorowski RE, Kabani K, Ramesh M, Orellana D, et al. Examination of CD302 as a potential therapeutic target for acute myeloid leukemia. PLoS ONE. (2019) 14:e0216368. doi: 10.1371/journal.pone.0216368
39. Posorski N, Kaemmerer D, Ernst G, Grabowski P, Hoersch D, Hommann M, et al. Localization of sporadic neuroendocrine tumors by gene expression analysis of their metastases. Clin Exp Metastasis. (2011) 28:637–47. doi: 10.1007/s10585-011-9397-5
40. Kaemmerer D, Posorski N, von Eggeling F, Ernst G, Horsch D, Baum RP, et al. The search for the primary tumor in metastasized gastroenteropancreatic neuroendocrine neoplasm. Clin Exp Metastasis. (2014) 31:817–27. doi: 10.1007/s10585-014-9672-3
41. Liu RZ, Graham K, Glubrecht DD, Germain DR, Mackey JR, Godbout R. Association of FABP5 expression with poor survival in triple-negative breast cancer: implication for retinoic acid therapy. Am J Pathol. (2011) 178:997–1008. doi: 10.1016/j.ajpath.2010.11.075
42. Wu G, Xu Y, Wang Q, Li J, Li L, Han C, et al. FABP5 is correlated with poor prognosis and promotes tumour cell growth and metastasis in clear cell renal cell carcinoma. Eur J Pharmacol. (2019) 862:172637. doi: 10.1016/j.ejphar.2019.172637
43. Wang W, Chu HJ, Liang YC, Huang JM, Shang CL, Tan H, et al. FABP5 correlates with poor prognosis and promotes tumor cell growth and metastasis in cervical cancer. Tumour Biol. (2016) 37:14873–83. doi: 10.1007/s13277-016-5350-1
44. Xia SL, Wu ML, Li H, Wang JH, Chen NN, Chen XY, et al. CRABP-II- and FABP5-independent responsiveness of human glioblastoma cells to all-trans retinoic acid. Oncotarget. (2015) 6:5889–902. doi: 10.18632/oncotarget.3334
45. Wang HJ, Gao Y, Chen L, Li YL, Jiang CL. RAB34 was a progression- and prognosis-associated biomarker in gliomas. Tumour Biol. (2015) 36:1573–8. doi: 10.1007/s13277-014-2732-0
46. Steponaitis G, Skiriute D, Kazlauskas A, Golubickaite I, Stakaitis R, Tamasauskas A, et al. High CHI3L1 expression is associated with glioma patient survival. Diagn Pathol. (2016) 11:42. doi: 10.1186/s13000-016-0492-4
47. Lin L, Wang G, Ming J, Meng X, Han B, Sun B, et al. Analysis of expression and prognostic significance of vimentin and the response to temozolomide in glioma patients. Tumour Biol. (2016) 37:15333–9. doi: 10.1007/s13277-016-5462-7
48. Guichet PO, Masliantsev K, Tachon G, Petropoulos C, Godet J, Larrieu D, et al. Fatal correlation between YAP1 expression and glioma aggressiveness: clinical and molecular evidence. J Pathol. (2018) 246:205–16. doi: 10.1002/path.5133
49. Rosager AM, Sorensen MD, Dahlrot RH, Hansen S, Schonberg DL, Rich JN, et al. Transferrin receptor-1 and ferritin heavy and light chains in astrocytic brain tumors: Expression and prognostic value. PLoS One. (2017) 12:e0182954. doi: 10.1371/journal.pone.0182954
50. Wang L, Yuan J, Tu Y, Mao X, He S, Fu G, et al. Co-expression of MMP-14 and MMP-19 predicts poor survival in human glioma. Clin Transl Oncol. (2013) 15:139–45. doi: 10.1007/s12094-012-0900-5
51. Sun L, Xu X, Chen Y, Zhou Y, Tan R, Qiu H, et al. Rab34 regulates adhesion, migration, and invasion of breast cancer cells. Oncogene. (2018) 37:3698–714. doi: 10.1038/s41388-018-0202-7
52. Liu Z, Yee PP, Wei Y, Liu Z, Kawasawa YI, Li W. Differential YAP expression in glioma cells induces cell competition and promotes tumorigenesis. J Cell Sci. (2019) 132:5. doi: 10.1242/jcs.225714
53. Wu T, Li Y, Liu B, Zhang S, Wu L, Zhu X, et al. Expression of ferritin light chain (FTL) is elevated in glioblastoma, and FTL silencing inhibits glioblastoma cell proliferation via the GADD45/JNK pathway. PLoS ONE. (2016) 11:e0149361. doi: 10.1371/journal.pone.0149361
54. Kanno H, Sato H, Yokoyama TA, Yoshizumi T, Yamada S. The VHL tumor suppressor protein regulates tumorigenicity of U87-derived glioma stem-like cells by inhibiting the JAK/STAT signaling pathway. Int J Oncol. (2013) 42:881–6. doi: 10.3892/ijo.2013.1773
55. Bao Y, Wang L, Shi L, Yun F, Liu X, Chen Y, et al. Transcriptome profiling revealed multiple genes and ECM-receptor interaction pathways that may be associated with breast cancer. Cell Mol Biol Lett. (2019) 24:38. doi: 10.1186/s11658-019-0162-0
56. Zhu Y, Liang S, Pan H, Cheng Z, Rui X. Inhibition of miR-1247 on cell proliferation and invasion in bladder cancer through its downstream target of RAB36. J Biosci. (2018) 43:365–73. doi: 10.1007/s12038-018-9755-4
57. Guerreiro AS, Fattet S, Kulesza DW, Atamer A, Elsing AN, Shalaby T, et al. A sensitized RNA interference screen identifies a novel role for the PI3K p110gamma isoform in medulloblastoma cell proliferation and chemoresistance. Mol Cancer Res. (2011) 9:925–35. doi: 10.1158/1541-7786.MCR-10-0200
58. Qiu QC, Wang L, Jin SS, Liu GF, Liu J, Ma L, et al. CHI3L1 promotes tumor progression by activating TGF-beta signaling pathway in hepatocellular carcinoma. Sci Rep. (2018) 8:15029. doi: 10.1038/s41598-018-33239-8
59. Wang HX, Chen YH, Zhou JX, Hu XY, Tan C, Yan Y, et al. Overexpression of G-protein-coupled receptors 65 in glioblastoma predicts poor patient prognosis. Clin Neurol Neurosurg. (2018) 164:132–7. doi: 10.1016/j.clineuro.2017.11.017
Keywords: low-grade glioma, prognostic biomarker, gene expression profiling, survival analysis, survival outcome
Citation: An Y, Wang Q, Zhang L, Sun F, Zhang G, Dong H, Li Y, Peng Y, Li H, Zhu W, Ji S, Wang Y and Guo X (2020) OSlgg: An Online Prognostic Biomarker Analysis Tool for Low-Grade Glioma. Front. Oncol. 10:1097. doi: 10.3389/fonc.2020.01097
Received: 10 February 2020; Accepted: 02 June 2020;
Published: 07 July 2020.
Edited by:
Maciej Harat, Franciszek Lukaszczyk Oncology Centre, PolandReviewed by:
Vidyasiri Vemulapalli, Dana–Farber Cancer Institute, United StatesMaria Caffo, University of Messina, Italy
Copyright © 2020 An, Wang, Zhang, Sun, Zhang, Dong, Li, Peng, Li, Zhu, Ji, Wang and Guo. This is an open-access article distributed under the terms of the Creative Commons Attribution License (CC BY). The use, distribution or reproduction in other forums is permitted, provided the original author(s) and the copyright owner(s) are credited and that the original publication in this journal is cited, in accordance with accepted academic practice. No use, distribution or reproduction is permitted which does not comply with these terms.
*Correspondence: Yunlong Wang, biowyl@126.com; Xiangqian Guo, xqguo@henu.edu.cn
†These authors have contributed equally to this work