 Chunsheng Wang
 Kewei Zhao
 Shanliang Hu1
- 1Department of Radiation Oncology, Qingdao University Medical College Affiliated Yantai Yuhuangding Hospital, Yantai, China
- 2Department of Radiation Oncology, Shandong Cancer Hospital and Institute, Shandong University, Jinan, China
- 3Department of Nuclear Medicine, Shandong Cancer Hospital and Institute, Shandong University, Jinan, China
Background: The maximum standardized uptake values (SUVmax) derived from 18F-fluorodeoxy-glucose positron emission tomography/computed tomography (18F-FDG PET/CT) have some well-known shortcomings in predicting treatment response and prognosis in oncology. The standardized SUVmax with an appropriate reference background may overcome this problem in some instances. This study explored the prognostic value of the tumor-to-liver SUVmax ratio (SUVTLR) and the tumor-to-blood pool SUVmax ratio (SUVTBR) in predicting the objective response (OR) and overall survival (OS) in patients with locally advanced esophageal cancer after concurrent chemoradiotherapy (CCRT).
Methods: We retrospectively analyzed 128 newly diagnosed esophageal squamous cell carcinoma (ESCC) patients who were treated with CCRT. The SUVmax of primary tumor, SUVTLR, SUVTBR and clinicopathologic features data were analyzed. Univariate and multivariate analyses were used to determine the predictors of tumor response. Survival analysis was performed using the Kaplan–Meier method and Cox proportional hazards model.
Results: Receiver operating characteristic (ROC) curve analysis demonstrated that SUVTLR was superior to SUVmax and SUVTBR in predicting treatment response. Univariate and multivariate analyses revealed that advanced tumor stage (hazard ratio [HR] = 9.67; 95% CI: 1.15-81.28; P = 0.037) and high SUVTLR (HR = 21.92; 95% CI: 2.26-212.96; P = 0.008) were independent predictors of poor treatment response. Cox regression analysis showed that good clinical tumor response (p < 0.014, HR =0.501; 95% CI: 0.288–0.871) was a favorable independent predictive factor for OS, while an advanced tumor stage (p = 0.018, HR = 1.796; 95% CI: 1.107-2.915) and a high SUVTLR (p < 0.002, HR = 2.660; 95% CI: 1.425–4.967) were prognostic factors for poor OS. The median OS of patients in the low SUVTLR and high SUVTLR groups was 13.47 vs. 19.30 months, respectively.
Conclusions: PET-derived SUVTLR is superior to tumor SUVmax and SUVTBR in predicting treatment response and overall survival in patients with ESCC undergoing CCRT. High SUVTLR was an independent predictor of poor treatment response and shorter overall survival.
Introduction
Esophageal cancer (EC) is the eighth most common malignancy and the sixth leading cause of cancer-related death worldwide (1). The extremely high mortality may be due to the fact that most patients with esophageal cancer have locally advanced disease at the time of diagnosis (2, 3). Concurrent chemoradiotherapy (CCRT) has been established as a first-line treatment for these patients with locally advanced esophagus cancer, according to the phase III intergroup trial of RTOG 85-01 (4). However, the treatment outcome of CCRT remains to be improved, despite CCRT improved local control and overall survival compared with radiotherapy alone. According to the literature, the overall response rate of CCRT in patients with esophageal cancer ranges from 53.3 to 94.0% (5–7), with an estimated 5-year overall survival (OS) rate varying from 20 to 31% (4, 7, 8). The assessment of tumor response and survival in advance plays an important role in the treatment of the disease (9).
18F-Fluorodeoxy-glucose positron emission tomography/computed tomography (18F-FDG PET/CT) is a functional imaging technique based on the theory that cancer cells generally exhibit increased glucose uptake and glycolysis. PET/CT is now widely used and is considered a useful imaging technique for cancer detection, staging, planning and monitoring treatment (10, 11). In addition, PET/CT is known to be effective for predicting treatment response and prognosis (12–14). The semiquantitative parameter derived from FDG-PET, maximum standardized uptake values (SUVmax), has been reported to be a strong predictor of survival in patients with esophageal cancer (13, 14). SUVmax has also been associated with CCRT response (15–17). Other volume-based PET parameters such as metabolic tumor volume (MTV) and total lesion glycolysis (TLG) are dependent on SUVmax. However, these PET parameters based on SUVmax methodology has some well-known shortcomings, such as weight, blood glucose level, time interval, and technical factors (17–20). The use of total weight is the most commonly used method of calculating the average radioactive concentration. However, heavier patients often have a higher body fat percentage, and white body fat is less metabolically active (i.e., takes up less FDG) than muscle tissue. Therefore, comparison of SUVs among patients with different body compositions is flawed (17). On the other hand, the fasting plasma glucose levels may vary significantly between examinations, especially in diabetic patients (21). In addition, different manufacturers and scanner models have different physical properties and different acquisition as well as reconstruction options. Each scanner has a calibration coefficient that converts the measured count to radioactivity. The calibration method and care of how this calibration is performed will affect the basic quantitative accuracy of PET scanner (17). Many recent studies have suggested that standardization of semiquantitative measurement may be superior to SUVmax in the prediction of treatment response and prognosis (22, 23). Standardization in its most common form is a ratio of FDG uptake in tumors to that in normal background tissue, such as the liver and mediastinal blood pool (24–28). This method can provide reliable and reproducible data across different PET scanners and improve the PET characterization of tumors more accurately (29–32).
However, data regarding the prognostic significance of the tumor-to-liver SUVmax ratio (SUVTLR) and tumor-to-blood pool SUVmax ratio (SUVTBR) in EC are limited. Hence, we conducted this retrospective study to evaluate the predictive value for treatment response and prognosis of SUVTLR and SUVTBR in patients with esophageal squamous cell carcinoma (ESCC) undergoing first-line chemoradiotherapy.
Materials and Methods
Patients
The ethics committee of Shandong Cancer Hospital and Institute approved the study. In addition, informed consent was exempted due to the retrospective nature of the study. Patients were included if they had an Eastern Cooperative Oncology Group (ECOG) performance status between 0 and 2 and were confirmed by histopathological analysis. They also needed to fulfill the following criteria: (1) adequate hematological, liver, and renal function; (2) completed PET/CT examination 1 week before treatment; and (3) locally advanced disease based on the 7th edition of the American Joint Committee on Cancer guidelines (AJCC 7th edition), with comorbidities making the tumor ineligible for surgery. The exclusion criteria were as follows: (1) distant metastasis or multiple primary esophageal lesions, (2) history of other malignancies, or (3) any liver disease that may affect liver metabolism and function, such as acute or chronic hepatitis, fatty liver, cirrhosis. We finally included 128 newly diagnosed ESCC patients who were treated with definitive CRT between January 2012 and December 2016 in our hospital.
PET/CT Scanning and Image Analysis
PET/CT scanning was performed 1 week before treatment with an advanced PET/CT scanner (Discovery LS, GE Healthcare). Before undergoing PET/CT scans, all patients were asked to fast for at least 6 h and have a blood glucose level ≤ 11.1 mmol/L. Then each of they were injected into 3.5–4.5 MBq/kg of 18F-FDG. Sixty minutes later, a whole-body PET and CT scans were initiated from top of the skull to the proximal thigh for 5 min per field of view, each covering 14.5 centimeters, with an axial sampling at 4.25 millimeters per slice. The PET data sets were reconstructed with CT-derived attenuation correction using the ordered-subset expectation maximization algorithm. The attenuation-corrected PET images, CT images, and fused PET/CT images were displayed as coronal, sagittal, and axial slices on the Xeleris workstation (GE Healthcare). Two experienced nuclear medicine physicians visually and semiquantitatively analyzed the PET images by measuring the SUVmax of the primary tumor, the liver and the blood pool. Contour threshold method standard uptake values (SUVs) were based on the region of interest (ROI), which was a suspicious area showing an increased FDG uptake compared to the surrounding esophagus tissue. A threshold SUV of 2.5 was used to define ROI boundaries, which has been widely approved. The SUVmax of the liver and the blood pool was calculated using a round-shaped 10-mm ROI at the VIII hepatic segment and the aortic arch (without involving the vessel wall). Then the ratio of the SUVmax of the primary tumor to the SUVmax of the liver (SUVTLR) and the ratio of SUVmax of the primary tumor to the SUVmax of blood pool (SUVTBR) were calculated, respectively.
Treatment Protocols
All patients received CCRT as their treatment option. The radiation treatments were performed using intensity-modulated radiation therapy (IMRT) with a total dose of 50–64 Gy administered once daily in 25–32 fractions (i.e., 1.8 or 2.0 Gy/ fractions, 5 days/week). Chemotherapy began on Day 1 concurrent with the initial radiation treatments, cycled every 28 days for 2–4 cycles for 2 cycles with radiation followed by 2 cycles without radiation. 5-Fluorouracil (700 mg/m2) was administered intravenously (iv) continuous infusion over 24 h daily on Days 1–4, and cisplatin (75 mg/m2) was administered by iv on Day 1.
Assessment of Response and Follow-Up
Patients were asked to visit the clinic within 2–4 weeks after completion of all therapies. Barium meal and contrast-enhanced thoracic and abdomen computed tomography scans were used to evaluate treatment response based on evaluation criteria in solid tumors (RECIST) Version 1.1. Tumor response was defined as complete response (CR) or partial response (PR); non-response was defined as stable disease (SD) or progressive disease (PD). A primary tumor response that fulfilled the CR criteria and PR criteria was defined as objective response (OR) (OR = CR+PR), and the other was defined as Non-OR. These examinations were performed for all patients every 3 months for the first 2 years and every 6 months thereafter. The last follow-up date was December 30, 2018.
Statistical Analysis
The selection of cut-off values of baseline PET/CT parameters was determined using receiver operating characteristics (ROC) curve analysis. Analysis of the AUCs of the ROC curves was done using Delong's test to compare the performance of PET/CT parameters for predictive response. Univariate and multivariate logistic regression analyses were used to determine the clinical tumor response predictors. OS was defined as the interval between the treatment and death or the last follow-up. The Kaplan-Meier method and the log-rank test were used to analyze the association of each marker with OS, and the associated 95% CIs were calculated. Cox's proportional hazards models were used to perform multivariate analysis defining the independent prognostic factors for OS, and hazard ratios were reported as relative risks with corresponding 95% confidence intervals. The analyses were performed with the SPSS 22.0 program (SPSS Inc., Chicago, IL, USA) and the MedCalc program (Version 18.11). A two-sided p-value < 0.05 was considered statistically significant.
Results
Patient Characteristics
A total of 128 newly diagnosed ESCC patients were retrospectively analyzed, including 103 (80.47%) males and 25 (19.53%) females, with a median age of 65 years (range: 39–83 years). Patients who had a history of smoking were slightly more represented (56.4%) than those who had never smoked, as well as those with a history of alcohol consumption. The lesions were mainly located in the middle thoracic segment of the esophagus (59, 46.10%), followed by the lower thoracic segment (35, 27.34%), and the upper thoracic segment (27, 21.09%), and lesions in the cervical segment were the least common (7, 5.47%). Additionally, most of the patients had stage III disease (96, 75.0%), whereas 32 (25.0%) had stage II disease. The number of patients in the OR and non-OR groups was 105 and 23, respectively, with an overall OR rate of 82.03%. The patients' clinical characteristics are summarized in Table 1.
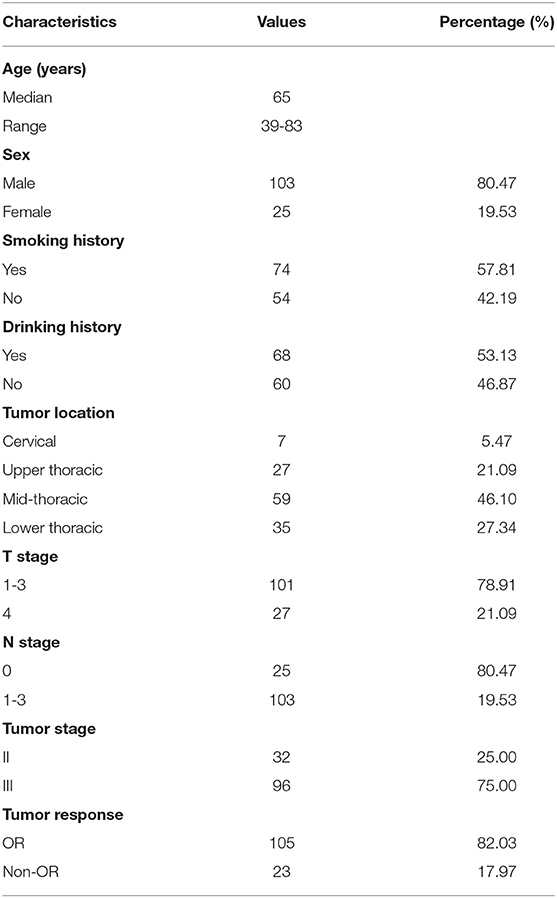
Table 1. Patient baseline characteristics.
ROC Curve Analysis
The patients had a median SUVmax of primary tumor of 15.5 (range: 3.43–31.54), SUVTLR of 4.04 (range: 0.73–9.09) and SUVTBR of 3.79 (range: 0.30–14.59). All of the parameters that were calculated from PET/CT are summarized in Table 2. By ROC curve analysis, we found that SUVTLR had the largest area under the curve of 0.855 (95% CI: 0.782–0.911), which was significantly larger than that of SUVmax (AUC = 0.755, 95% CI: 0.693–0.844; ΔAUC = 0.0797, p = 0.018) and SUVTBR (AUC = 0.705, 95% CI: 0.618–0.782; ΔAUC = 0.1500, p = 0.024) (Figure 1). The optimal cut-off value for SUVTLR was 4.21 (sensitivity 95.7%, specificity 63.8%), it was 14.68 for SUVmax (sensitivity 91.3%, specificity 53.3%), and 5.06 for SUVTBR (sensitivity 60.9%, specificity 77.1%) (Table 3). Based on these cut-off values, patients were stratified into different PET/CT parameter groups. The baseline clinical characteristics based on PET/CT parameters are summarized in Supplementary Table 1.

Table 2. PET parameters.
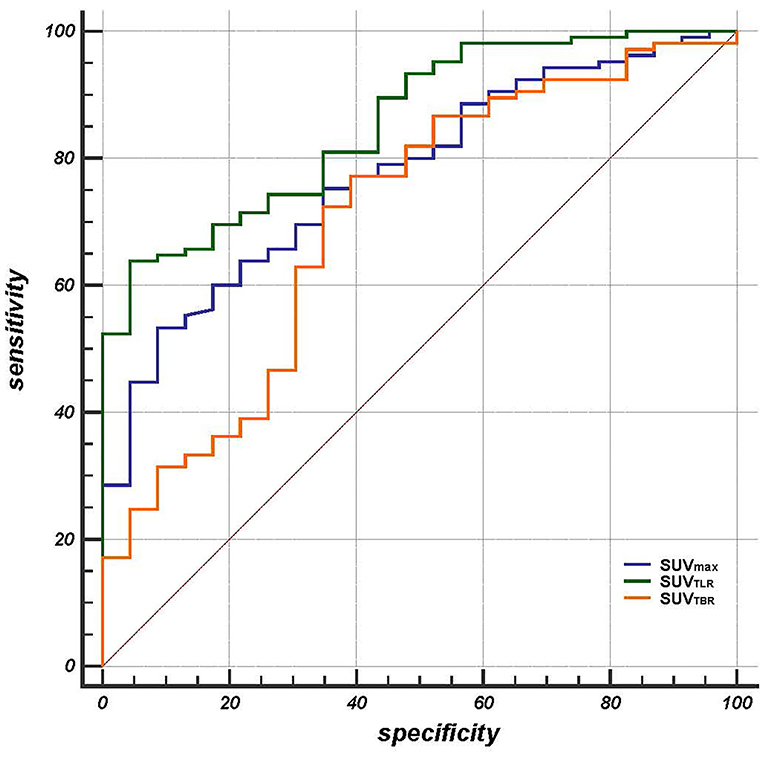
Figure 1. The area under the curve of SUVTLR (AUC = 0.855 95% CI: 0.782-0.911) was significantly larger than that of SUVmax (AUC = 0.755, 95% CI: 0.693-0.844; ΔAUC = 0.0797, p = 0.018) and SUVTBR (AUC = 0.705, 95% CI: 0.618-0.782; ΔAUC = 0.1500, p = 0.024).
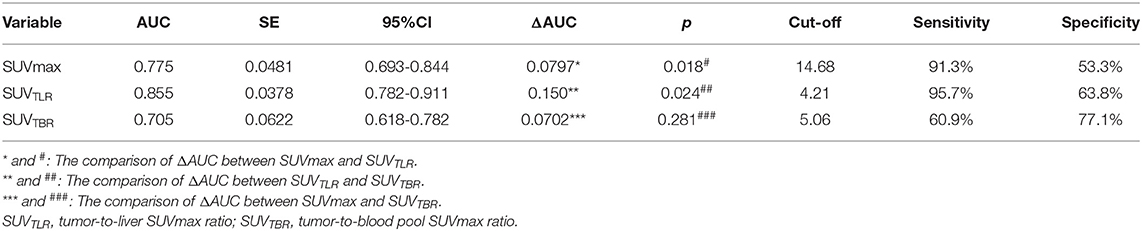
Table 3. Analysis of ROC curves in predicting treatment response.
Univariate and Multivariate Analyses of Treatment Response
The univariate analysis revealed that tumor stage (P = 0.012), SUVmax (P < 0.001), SUVTLR (P < 0.001) and SUVTBR (P < 0.001) were prognostic factors for OR. Advanced tumor stage (stage III), high SUVmax (>14.68), high SUVTLR (>4.21), and high SUVTBR (>5.06) were significantly associated with poor treatment response. The objective remission rates of the tumor stage III group, high SUVmax group, high SUVTLR group and high SUVTBR group were 77.08, 68.57, 63.33, and 63.16%, respectively. However, these values were significantly higher in the corresponding groups (96.87, 96.55, 98.53, and 90.00%, respectively). However, none of the other parameters (i.e., age, sex, smoking history, drinking history, tumor location, T stage, and N stage) showed significant differences (Table 4). Subsequently, the significant variables from the univariate analysis (tumor stage, SUVmax, SUVTLR, and SUVTBR) were included in the multivariate logistic regression models. Multivariate analysis revealed that only advanced tumor stage (hazard ratio [HR] = 0.103; 95% CI: 0.012-0.87; P = 0.037) and high SUVTLR (HR = 0.446; 95% CI: 0.074-2.692; P = 0.008) were independent predictors of poor treatment response (Figure 3).
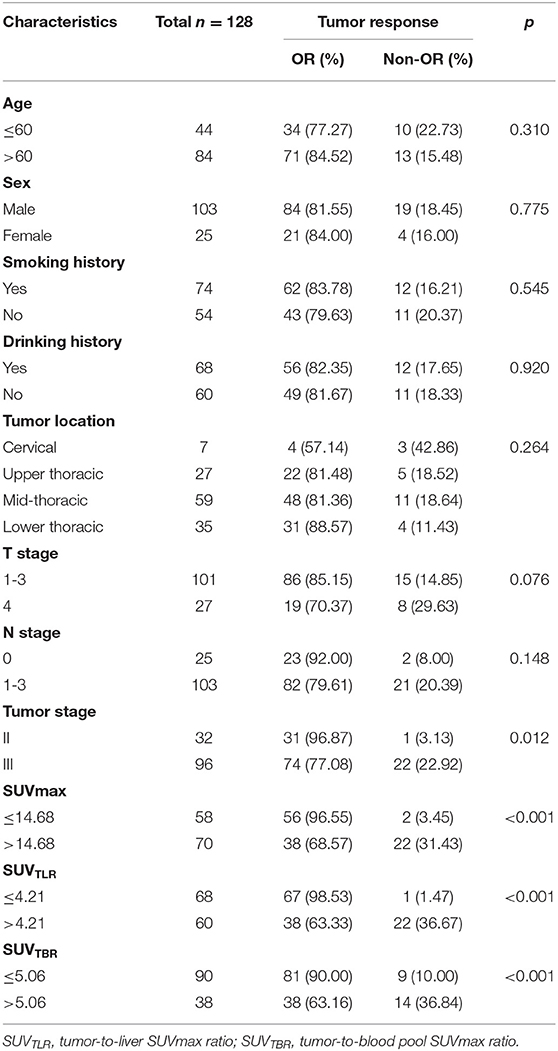
Table 4. Univariate analysis for treatment response.
Prognostic Values of the PET/CT Parameters for OS
The median follow-up time was 28 months. At the end of follow-up, 106 patients (82.8%) died from ESCC, whereas 22 patients (17.2%) were still alive. The median OS was 18.35 months (range: 5.37–42.7 months). In the univariate analysis, tumor stage (p = 0.020), tumor response (p < 0.001), SUVmax (p = 0.003), SUVTLR (p < 0.001) and SUVTBR (p = 0.002) were significantly associated with OS. As shown in Figure 2, the Kaplan-Meier curves revealed that, compared to patients in the high SUVmax group, in the high SUVTLR group and in the high SUVTBR group, patients in the low SUVmax group, in the low SUVTLR group and in the low SUVTBR group had a longer OS. None of the other parameters (i.e., age, sex, smoking history, drinking history, tumor location, T stage, and N stage) were associated with OS (Table 5). All these factors were included in the subsequent multivariate analysis. In addition, although variables such as age and gender are not significant in univariate analysis, these variables may be an important confounding factor, so they are also included in the multivariate analysis. The multivariate analysis confirmed that only tumor stage (HR = 1.777; 95% CI: 1.087–2.904, p = 0.022), tumor response (HR = 2.043; 95% CI: 1.170–3.567, p = 0.012), and SUVTLR (HR = 2.620; 95% CI: 1.405–4.887, p = 0.002) were independent prognostic factors for OS (Figure 4). Overall, a good clinical tumor response was a favorable independent predictive factor for OS, while an advanced tumor stage and a high SUVTLR were prognostic factors for poor OS. The median OS of patients in tumor stages II and III, in the OR group and non-OR group, and in the low SUVTLR and high SUVTLR groups were 20.68 vs. 17.77 months, 13.47 vs. 19.30 months, and 22.05 vs. 15.65 months, respectively.

Figure 2. Kaplan-Meier analyses of OS according to SUVman, SUVTLR and SUVTBR.Patients with low SUVmax (A), low SUVTLR (B), and low SUVTBR (C) achieved better OS than patients with high SUVmax, high SUVTLR and high SUVTBR.
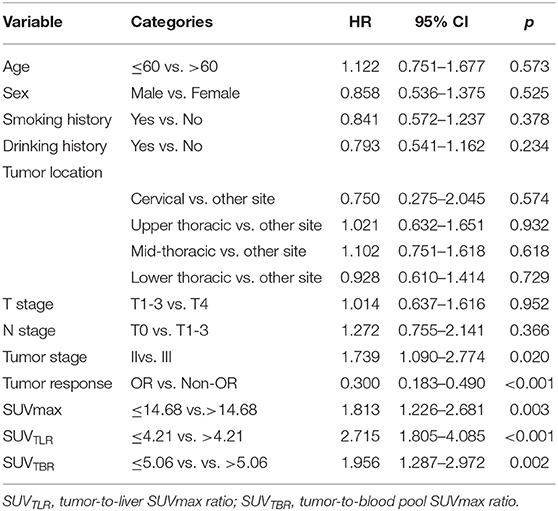
Table 5. Univariate analysis for OS.
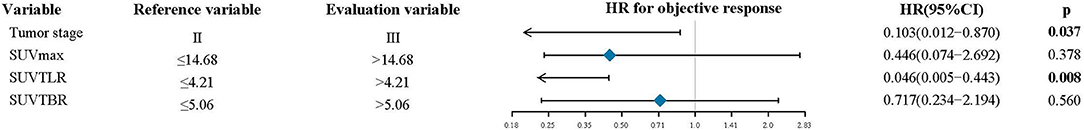
Figure 3. Multivarite analysis for treatment response.
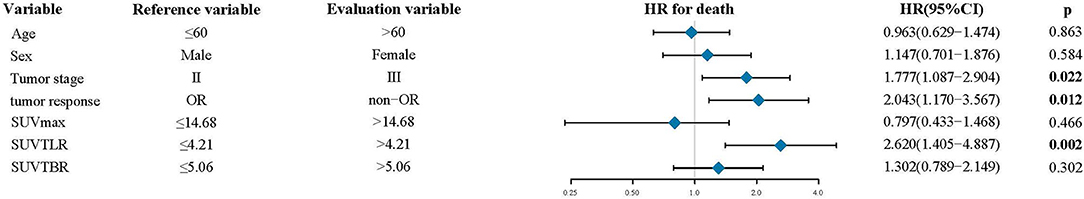
Figure 4. Multivarite analysis for OS.
Discussion
Concurrent chemoradiotherapy is the main treatment for locally advanced inoperable esophageal cancer patients. In the present study, we investigated the prognostic value of SUVTLR and SUVTBR in locally advanced esophageal cancer patients who were treated with CCRT. We demonstrated that SUVTLR was an independent predictive factor for treatment response. Furthermore, SUVTLR was also an independent risk factor for OS. The median OS was significantly different below and above the cut-off value of SUVTLR (22.05 vs. 15.65 months). However, SUVmax and SUVTBR did not significantly correlate with OR or OS. To the best of our knowledge, this is the first study focusing on the potential prognostic role of the ratio between tumor lesions and reference background SUVmax in locally advanced esophageal cancer patients treated with CCRT.
18F-FDG PET/CT, which reflects glucose metabolism, has been widely applied in the management of oncological patients (10–14). The semiquantitative metabolic parameters derived from PET/CT, such as SUVmax, have been reported as useful prognostic factors in various cancers, including EC (13–15). For example, a previous retrospective study in 179 esophageal or gastroesophageal carcinoma patients showed that patients who reached a clinical complete response after definitive CCRT had a median SUVmax of 10.2, whereas those who did not achieve a clinical complete response had a median SUVmax of 15.3 (16). This study also revealed that patients with higher SUVmax were associated with poorer OS compared with patients with a lower SUVmax after definitive chemoradiotherapy. These results are supported by the study of Atsumi et al. in which the analysis of 56 esophageal carcinoma patients showed that the median SUVmax of the patients who reached a complete response was 10.6, compared with 17.6 in non-CR patients. SUVmax was significantly associated with OS, and the 2-year OS rates in the low-SUVmax (<10) and high-SUVmax (≥10) groups were 100 and 41% (15). Our results highly agree with this finding; patients with higher SUVmax (>14.68) are more likely to have a poor tumor response and a shorter OS than those with a lower one ( ≤ 14.68). Although SUVmax performs well in predicting prognosis, it has many well-known limitations, as explained in the introduction section (17–20). SUV measurements are influenced by body composition and habits, as well as time intervals. In addition, SUVmax is also affected by some technical factors, for example, errors in scanner calibration, reconstruction settings, and the attenuation-corrected protocol (33). Moreover, it was reported that FDG uptake and biodistribution are affected by tumor burden, tumor volume, and the volume of interest (34–36). In light of this variation, recent reports have suggested that applying a standardized SUVmax, i.e., tumor SUVmax normalized by an appropriate reference background, may overcome this problem in some instances (36, 37). The liver and blood pool are the most widely used reference background (37, 38), since they maintain a nearly constant SUV level over time after injecting 18F-FDG. There are some important advantages to applying this ratio, e.g., it is independent of management activities and weight as well as different PET/CT scanners, so at least part of the abovementioned inherent variability in SUV methodology and inter instrumental variability problems can be reduced or addressed (35, 36). Another advantage is that it is practical and simple in daily clinical use, and clinicians can easily identify primary tumor uptake compared to liver/blood pool uptake without the use of additional or special software or equipment. This method of analysis can yield reproducible results across different institutions or researchers without the need for additional imaging data that would lead to further economic burden and radiation exposure. In the present study, SUVmax of the eighth hepatic segment and aortic arch were used as the reference background to standardize one of the primary lesions, namely, SUVTLR and SUVTBR. This methodology was reported in previous studies in lymphoma (39). In the present study, we first performed a ROC analysis to determine the best cut-off values of SUVTLR, SUVTBR and SUVmax and then compared their predictive performance. We found that SUVTLR performed the best with a significantly higher ROC of >0.85 and yielded a sensitivity and specificity of 0.957 and 0.638, respectively. SUVTLR was the best predictor of the OR. Further analysis indicated that SUVTLR is an independent predictor of treatment response in patients undergoing CCRT. Patients with a high SUVTLR are more likely to have a poor treatment outcome than are those with a low SUVTLR. Considering OS, we demonstrated that SUVTLR was also an independent predictor. With a median overall survival of 18.35 months in all patients, patients with a lower SUVTLR (<4.21) had a significantly longer OS than those with a higher SUVTLR (>4.21) (22.05 vs. 15.65 months). This is the first study to report the prognostic value of SUVTLR in patients with esophageal cancer after CCRT. The results of this study are basically consistent with the results of previous studies in other tumors. In a study by Huang et al. (35), 504 patients with stage IIA colorectal cancer following curative resection were examined. They found that SUVTLR was superior to tumor SUVmax in predicting recurrence. Patients with SUVTLR>6.2 revealed a 14.7-fold increased risk of disease-specific mortality. The 1-, 3-, and 5-year OS rates were 100.0, 100.0, and 98.3% for patients with lower SUVTLR vs. 98.1, 83.3, and 74.3% for those with higher SUVTLR. Similarly, Park et al. retrospectively reviewed 167 patients with surgical margin-negative stage IA non-small cell lung cancer; the result indicated that SUVTLR was an independent prognostic factor for recurrence and disease-free survival (40). In the study of 23 adenoid cystic carcinomas of salivary gland patients, high SUVTLR was significantly associated with decreased OS. With a SUVTLR cut-off of 2.69, there was a 1.83-fold increase in the risk of death (41). In addition, the prognostic value of SUVTLR was also reported in lymphoma (30, 42). In the current study, tumor stage and treatment response were also found to be independent prognostic factors for OS, and these factors have already been well established as significant prognostic factors.
In addition, several previous studies have reported the prognostic value of the SUVmax ratio between tumor lesions and the blood pool. In a study in esophageal cancer, SUVTBR was an independent prognostic factor for overall survival and distant metastasis (26). Normalization to the blood pool SUVmax improved the prognostic value and led to a higher hazard ratio than did the metabolically active tumor volume, which was also an independent prognostic factor for overall survival and distant metastasis. Similarly, Gencturk et al. (41) came to a similar conclusion that patients with lower SUVTBR (<4.14) have a significantly longer progression-free survival and overall survival than those with a higher SUVTBR. However, in our study, Cox's proportional hazards models indicated that SUVTBR was not an independent prognostic factor for OS, despite a significantly longer OS in patients with lower SUVTBR in the univariate analysis. This result is highly in agreement with the previous findings by Albano et al. (43, 44). One possible explanation is that, due to the anatomical structure, the SUVmax of the blood pool may be influenced by the primary esophageal tumor and mediastinal metastatic lymph nodes. Another possible explanation is that although the SUV values of the liver and blood pool are stable over time, they are not the same in nature. The blood pool is only the storage vessel of the 18F-FDG, while the liver is both a storage organ and a consumption organ. This may result in different baseline states. It seems preferable to select liver uptake as a background reference. This conclusion was supported by Itti E's previous result that with mediastinal blood pool as a reference, PET was unable to distinguish early responders from nonresponders (45). In contrast, with liver as a reference, 2-year progression-free survival was significantly different between patients with PET-negative findings and patients with PET-positive findings. Therefore, we suggest that the liver is a more optimal reference background tissue than the blood pool for normalization of FDG uptake when performing semiquantitative metabolic tumor response and prognosis prediction.
This study has some limitations. First, this is a retrospective single-center study. Further prospective, multicenter, clinical trial should be conducted to clarify the results of our findings. Second, although we have applied endoscopic ultrasonography, enhanced CT and PET/CT, clinical TNM staging is still not as accurate as pathological TNM staging. Lastly, only a small number of patients underwent a second PET/CT examination after the end of treatment, so we did not have enough data to deeply analyze the changes in metabolic parameters before and after treatment, as well as the prognostic value.
Conclusion
In summary, our study indicated that the PET-derived tumor-to-liver maximum standardized uptake value ratio (SUVTLR) is superior to the tumor SUVmax and tumor-to-blood pool maximum standardized uptake value ratio (SUVTBR) in predicting treatment and overall survival in patients with ESCC undergoing first-line chemoradiotherapy. Patients with a higher SUVTLR are more likely to have a poor treatment response and shorter overall survival than those with a lower one.
Data Availability Statement
The datasets generated for this study are available on request to the corresponding author.
Ethics Statement
The studies involving human participants were reviewed and approved by The ethics committee of Shandong Cancer Hospital and Institute approved the study. Written informed consent for participation was not required for this study in accordance with the national legislation and the institutional requirements.
Author Contributions
ML and YS: conceptualization, methodology, supervision, and project administration. YH and LM: software. CW and KZ: formal analysis, writing-original draft preparation, and writing-review and editing. SH: resources. KZ: data curation. All authors contributed to the article and approved the submitted version.
Funding
The Natural Science Foundation of China (NSFC 81672995), the National key research and development program (2018YFC1313201) supported this study.
Conflict of Interest
The authors declare that the research was conducted in the absence of any commercial or financial relationships that could be construed as a potential conflict of interest.
References
1. Siegel RL, Miller KD, Jemal A. Cancer statistics. Cancer J Clin. (2019) 69:7–34. doi: 10.3322/caac.21551
2. Enzinger PC, Mayer RJ. Esophageal cancer. N Engl J Med. (2003) 349:2241–52. doi: 10.1056/NEJMra035010
3. Courrech Staal EF, van Coevorden F, Cats A, Aleman BM, van Velthuysen ML, Boot H, et al. Outcome of low-volume surgery for esophageal cancer in a high-volume referral center. Ann Surg Oncol. (2009) 16:3219–26. doi: 10.1245/s10434-009-0700-5
4. Cooper JS, Guo MD, Herskovic A, Macdonald JS, Martenson JA Jr, Al-Sarraf M, et al. Chemoradiotherapy of locally advanced esophageal cancer: long-term follow-up of a prospective randomized trial (RTOG 85-01). Radiation Therapy Oncology Group. JAMA. (1999) 281:1623–7. doi: 10.1001/jama.281.17.1623
5. Zhao T, Chen H, Zhang T. Docetaxel and cisplatin concurrent with radiotherapy versus 5-fluorouracil and cisplatin concurrent with radiotherapy in treatment for locally advanced oesophageal squamous cell carcinoma: a randomized clinical study. Med Oncol. (2012) 29:3017–23. doi: 10.1007/s12032-012-0228-6
6. Conroy T, Galais M-P, Raoul J-L, Bouché O, Gourgou-Bourgade S, Douillard J-Y, et al. Definitive chemoradiotherapy with FOLFOX versus fluorouracil and cisplatin in patients with oesophageal cancer (PRODIGE5/ACCORD17): final results of a randomised, phase 2/3 trial. Lancet Oncol. (2014) 15:305–14. doi: 10.1016/s1470-2045(14)70028-2
7. Zhu Y, Zhang W, Li Q, Li Q, Qiu B, Liu H, et al. A phase II randomized controlled trial: definitive concurrent chemoradiotherapy with docetaxel plus cisplatin versus 5-fluorouracil plus cisplatin in patients with oesophageal squamous cell carcinoma. J Cancer. (2017) 8:3657–66. doi: 10.7150/jca.20053
8. Minsky BD, Neuberg D, Kelsen DP, Pisansky TM, Ginsberg R, Benson A. Neoadjuvant chemotherapy plus concurrent chemotherapy and high-dose radiation for squamous cell carcinoma of the esophagus: a preliminary analysis of the phase II intergroup trial 0122. J Clin Oncol. (1996) 14:149–55. doi: 10.1200/JCO.1996.14.1.149
9. Kato H, Kuwano H, Nakajima M, Miyazaki T, Yoshikawa M, Ojima H, et al. Comparison between positron emission tomography and computed tomography in the use of the assessment of esophageal carcinoma. Cancer. (2002) 94:921–8. doi: 10.1002/cncr.10330
10. Gallamini A, Zwarthoed C, Borra A. Positron emission tomography (PET) in oncology. Cancers. (2014) 6:1821–89. doi: 10.3390/cancers6041821
11. Noble F, Bailey D, Panel SUGT, Tung K, Byrne JP. Impact of integrated PET/CT in the staging of oesophageal cancer: a UK population-based cohort study. Clin Radiol. (2009) 64:699–705. doi: 10.1016/j.crad.2009.03.003
12. Bar-Shalom R, Guralnik L, Tsalic M, Leiderman M, Frenkel A, Gaitini D, et al. The additional value of PET/CT over PET in FDG imaging of oesophageal cancer. Eur J Nucl Med Mol Imag. (2005) 32:918–24. doi: 10.1007/s00259-005-1795-y
13. Chang S, Kim SJ. Prediction of recurrence and mortality of locally advanced esophageal cancer patients using pretreatment F-18 FDG PET/CT parameters: intratumoral heterogeneity, SUV, and volumetric parameters. Cancer Biother Radiopharm. (2016) 31:1–6. doi: 10.1089/cbr.2015.1932
14. Barber TW, Duong CP, Leong T, Bressel M, Drummond EG, Hicks RJ. 18F-FDG PET/CT has a high impact on patient management and provides powerful prognostic stratification in the primary staging of esophageal cancer: a prospective study with mature survival data. J Nucl Med. (2012). 53:864–71. doi: 10.2967/jnumed.111.101568
15. Atsumi K, Nakamura K, Abe K, Hirakawa M, Shioyama Y, Sasaki T, et al. Prediction of outcome with FDG-PET in definitive chemoradiotherapy for esophageal cancer. J Radia Res. (2013) 54:890–8. doi: 10.1093/jrr/rrt021
16. Suzuki A, Xiao L, Hayashi Y, Macapinlac HA, Welsh J, Lin SH, et al. Prognostic significance of baseline positron emission tomography and importance of clinical complete response in patients with esophageal or gastroesophageal junction cancer treated with definitive chemoradiotherapy. Cancer. (2011) 117:4823–33. doi: 10.1002/cncr.26122
17. Adams MC, Turkington TG, Wilson JM, Wong TZ. A systematic review of the factors affecting accuracy of SUV measurements. Am J Roentgenol. (2010) 195:310–20. doi: 10.2214/AJR.10.4923
18. Boellaard R, Krak NC, Hoekstra OS, Lammertsma AA. Effects of noise, image resolution, and ROI definition on the accuracy of standard uptake values: a simulation study. J Nucl Med. (2004) 45:1519–27.
19. Boktor RR, Walker G, Stacey R, Gledhill S, Pitman AG. Reference range for intrapatient variability in blood-pool and liver SUV for 18F-FDG PET. J Nucl Med. (2013) 54:677–82. doi: 10.2967/jnumed.112.108530
20. Weber WA, Gatsonis CA, Mozley PD, Hanna LG, Shields AF, Aberle DR, et al. Repeatability of 18F-FDG PET/CT in advanced non-small cell lung cancer: prospective assessment in 2 multicenter trials. J Nucl Med. (2015) 56:1137–43. doi: 10.2967/jnumed.114.147728
21. Sprinz C, Altmayer S, Zanon M, Watte G, Irion K, Marchiori E, et al. Effects of blood glucose level on 18F-FDG uptake for PET/CT in normal organs: A systematic review. PLoS ONE. (2018) 13:e0193140. doi: 10.1371/journal.pone.0193140
22. Albano D, Giubbini R, Bertagna F. 18F-FDG PET/CT in splenic marginal zone lymphoma. Abdom Radiol. (2018). 43:2721–7. doi: 10.1007/s00261-018-1542-z
23. Albano D, Mazzoletti A, Spallino M, Muzi C, Zilioli VR, Pagani C, et al. Prognostic role of baseline 18F-FDG PET/CT metabolic parameters in elderly HL: a two-center experience in 123 patients. Ann Hematol. (2020) 99:1321–30. doi: 10.1007/s00277-020-04039-w
24. Wahl RL, Jacene H, Kasamon Y, Lodge MA. From RECIST to PERCIST: Evolving Considerations for PET response criteria in solid tumors. J Nucl Med. (2009) 50 Suppl 1:122S−50S. doi: 10.2967/jnumed.108.057307
25. Keramida G, Dizdarevic S, Bush J, Peters AM. Quantification of tumour (18) F-FDG uptake: Normalise to blood glucose or scale to liver uptake? Eur Radiol. (2015) 25:2701–8. doi: 10.1007/s00330-015-3659-6
26. Butof R, Hofheinz F, Zophel K, Stadelmann T, Schmollack J, Jentsch C, et al. Prognostic value of pretherapeutic tumor-to-blood standardized uptake ratio in patients with esophageal carcinoma. J Nucl Med. (2015) 56:1150–6. doi: 10.2967/jnumed.115.155309
27. Law WP, Maggacis N, Jeavons SJ, Miles KA. Concordance of 18F-FDG PET uptake in tumor and normal tissues on PET/MRI and PET/CT. Clin Nucl Med. (2017) 42:180–6. doi: 10.1097/RLU.0000000000001514
28. Lee JW, Hwang SH, Kim DY, Han KH, Yun M. Prognostic value of FDG uptake of portal vein tumor thrombosis in patients with locally advanced hepatocellular carcinoma. Clin Nucl Med. (2017) 42:e35–e40. doi: 10.1097/RLU.0000000000001422
29. Park SY, Cho A, Yu WS, Lee CY, Lee JG, Kim DJ, et al. Prognostic value of total lesion glycolysis by 18F-FDG PET/CT in surgically resected stage IA non-small cell lung cancer. J Nucl Med. (2015) 56:45–9. doi: 10.2967/jnumed.114.147561
30. Annunziata S, Cuccaro A, Calcagni ML, Hohaus S, Giordano A, Rufini V. Interim FDG-PET/CT in Hodgkin lymphoma: the prognostic role of the ratio between target lesion and liver SUVmax (rPET). Ann Nucl Med. (2016) 30:588–92. doi: 10.1007/s12149-016-1092-9
31. Hasenclever D, Kurch L, Mauz-Korholz C, Elsner A, Georgi T, Wallace H, et al. qPET - a quantitative extension of the Deauville scale to assess response in interim FDG-PET scans in lymphoma. Eur J Nucl Med Mol Imag. (2014) 41:1301–8. doi: 10.1007/s00259-014-2715-9
32. Ko KH, Hsu HH, Huang TW, Gao HW, Cheng CY, Hsu YC, et al. Predictive value of 18F-FDG PET and CT morphologic features for recurrence in pathological stage IA non-small cell lung cancer. Medicine. (2015) 94:e434. doi: 10.1097/MD.0000000000000434
33. Lim CH, Moon SH, Cho YS, Choi JY, Lee KH, Hyun SH. Prognostic value of (18)F-fluorodeoxyglucose positron emission tomography/computed tomography in patients with combined hepatocellular-cholangiocarcinoma. Eur J Nucl Med Mol Imag. (2019) 46:1705–12. doi: 10.1007/s00259-019-04327-2
34. Viglianti BL, Wale DJ, Wong KK, Johnson TD, Ky C, Frey KA, et al. Effects of tumor burden on reference tissue standardized uptake for PET imaging: modification of PERCIST criteria. Radiology. (2018) 287:993–1002. doi: 10.1148/radiol.2018171356
35. Huang J, Huang L, Zhou J, Duan Y, Zhang Z, Wang X, et al. Elevated tumor-to-liver uptake ratio (TLR) from (18)F-FDG-PET/CT predicts poor prognosis in stage IIA colorectal cancer following curative resection. Eur J Nucl Med Mol Imag. (2017) 44:1958–68. doi: 10.1007/s00259-017-3779-0
36. Hofheinz F, Butof R, Apostolova I, Zophel K, Steffen IG, Amthauer H, et al. An investigation of the relation between tumor-to-liver ratio (TLR) and tumor-to-blood standard uptake ratio (SUR) in oncological FDG PET. EJNMMI Res. (2016) 6:19. doi: 10.1186/s13550-016-0174-y
37. Chiaravalloti A, Danieli R, Abbatiello P, Di Pietro B, Travascio L, Cantonetti M, et al. Factors affecting intrapatient liver and mediastinal blood pool (1)(8)F-FDG standardized uptake value changes during ABVD chemotherapy in Hodgkin's lymphoma. Eur J Nucl Med Mol Imag. (2014) 41:1123–32. doi: 10.1007/s00259-014-2703-0
38. Park J, Chang KJ, Seo YS, Byun BH, Choi JH, Moon H, et al. Tumor SUVmax normalized to liver uptake on (18)F-FDG PET/CT predicts the pathologic complete response after neoadjuvant chemoradiotherapy in locally advanced rectal cancer. Nucl Med Mol Imag. (2014) 48:295–302. doi: 10.1007/s13139-014-0289-x
39. Albano D, Bertoli M, Ferro P, Fallanca F, Gianolli L, Picchio M, et al. 18F-FDG PET/CT in gastric MALT lymphoma: a bicentric experience. Eur J Nucl Med Mol Imag. (2017) 44:589–97. doi: 10.1007/s00259-016-3518-y
40. Park HL, Yoo IR, Boo SH, Park SY, Park JK, Sung SW, et al. Does FDG PET/CT have a role in determining adjuvant chemotherapy in surgical margin-negative stage IA non-small cell lung cancer patients? J Cancer Res Clin Oncol. (2019) 145:1021–6. doi: 10.1007/s00432-019-02858-7
41. Gencturk M, Ozturk K, Koksel Y, Li F, Cayci Z. Pretreatment quantitative (18)F-FDG PET/CT parameters as a predictor of survival in adenoid cystic carcinoma of the salivary glands. Clin Imag. (2019) 53:17–24. doi: 10.1016/j.clinimag.2018.09.021
42. Annunziata S, Cuccaro A, Tisi MC, Hohaus S, Rufini V. FDG-PET/CT at the end of immuno-chemotherapy in follicular lymphoma: the prognostic role of the ratio between target lesion and liver SUVmax (rPET). Ann Nucl Med. (2018) 32:372–7. doi: 10.1007/s12149-018-1243-2
43. Albano D, Bosio G, Pagani C, Re A, Tucci A, Giubbini R, et al. Prognostic role of baseline 18F-FDG PET/CT metabolic parameters in Burkitt lymphoma. Eur J Nucl Med Mol Imag. (2019) 46:87–96. doi: 10.1007/s00259-018-4173-2
44. Albano D, Bosio G, Bianchetti N, Pagani C, Re A, Tucci A, et al. Prognostic role of baseline 18F-FDG PET/CT metabolic parameters in mantle cell lymphoma. Ann Nucl Med. (2019) 33:449–58. doi: 10.1007/s12149-019-01354-9
Keywords: esophageal squamous cell carcinoma, SUVmax, tumor-to-liver SUVmax ratio, chemoradiotherapy, tumor response, survival
Citation: Wang C, Zhao K, Hu S, Huang Y, Ma L, Li M and Song Y (2020) The PET-Derived Tumor-to-Liver Standard Uptake Ratio (SUVTLR) Is Superior to Tumor SUVmax in Predicting Tumor Response and Survival After Chemoradiotherapy in Patients With Locally Advanced Esophageal Cancer. Front. Oncol. 10:1630. doi: 10.3389/fonc.2020.01630
Received: 17 November 2019; Accepted: 27 July 2020;
Published: 03 September 2020.
Edited by:
Georgios S. Limouris, National and Kapodistrian University of Athens, GreeceReviewed by:
Gun Oh Chong, Kyungpook National University Hospital, South KoreaSalvatore Annunziata, Catholic University of the Sacred Heart, Italy
Domenico Albano, University of Brescia, Italy
Copyright © 2020 Wang, Zhao, Hu, Huang, Ma, Li and Song. This is an open-access article distributed under the terms of the Creative Commons Attribution License (CC BY). The use, distribution or reproduction in other forums is permitted, provided the original author(s) and the copyright owner(s) are credited and that the original publication in this journal is cited, in accordance with accepted academic practice. No use, distribution or reproduction is permitted which does not comply with these terms.
*Correspondence: Minghuan Li, c2RfbG1oQHNpbmEuY29t; Yipeng Song, c29uZ3lweWhkQHNpbmEuY29t
†These authors have contributed equally to this work