 Yue Li
 Fan Li1†
 Xiaoyu Bai
 Danfang Zhang
- 1Department of Pathology, Tianjin Medical University, Tianjin, China
- 2Department of Pathology, General Hospital of Tianjin Medical University, Tianjin, China
Background: ITGA3 is a member of the integrin family, a cell surface adhesion molecule that can interact with extracellular matrix (ECM) proteins. The purpose of this study was to explore the significance of ITGA3 expression in the prognosis and clinical diagnosis of breast cancer patients.
Methods: Oncomine, the Human Protein Atlas (HPA) and UALCAN were used to analyze the expression of ITGA3 in various cancers. PrognoScan, GEPIA, Kaplan–Meier plotter and Easysurv were utilized to analyze the prognosis of ITGA3 in certain cancers. Based on TCGA data, a receiver operating characteristic (ROC) curve was used to evaluate the diagnostic performance of ITGA3 expression. cBio-Portal and MethSurv were used to evaluate the genomic mechanism. LinkedOmics, NetworkAnalyst and Metascape were used to build the signaling network. TIMER is a web server for comprehensive analysis of tumor infiltrating immune cells and tumor infiltrating lymphocytes (TILs).
Results: The expression of ITGA3 in normal breast tissues was greater than that in breast cancer tissues at both the mRNA and protein levels. High expression of ITGA3 was associated with better prognosis of breast cancer patients. ROC analysis indicated that ITGA3 had significant diagnostic value. Genomic analysis revealed that promoter methylation of ITGA3 leads to transcriptional silencing, which may be one of the mechanisms underlying ITGA3 downregulation in BRCA. Immune infiltration analysis showed that ITGA3 may be involved in the recruitment of immune cells.
Conclusions: This study identified ITGA3 as a novel biomarker to estimate the diagnosis and prognosis of breast cancer. In addition, ITGA3 is involved in ECM regulation and immune cell infiltration.
Introduction
Breast cancer is the primary killer of women. Despite long-term investigation and research, the incidence of breast cancer is still rising. Worldwide, breast cancer remains the leading cancer-related cause of disease for women (1, 2). Metastasis is considered to be the main cause of the high mortality of breast cancer (3). Breast cancer is highly heterogeneous (4), mainly in terms of treatment with surgery and chemotherapy. Recently, the combination of targeted therapy and immunotherapy has achieved certain results, and early data have revealed the clinical activity of programmed cell death-1/programmed death ligand-1 (PD-1/PD-L1) antagonists in small numbers of patients with metastatic breast cancer (5). However, not all patients benefit. Therefore, creating an effective immunotherapy for all patients and looking for immunotherapy target markers is the primary task of clinical development.
ITGA3 (integrin subunit α3), also known as integrin α3, is a member of the integrin family. Integrin is a transmembrane heterodimer composed of α and β subunits that are noncovalently bound. ITGA3 encodes the α3 subunit, which undergoes posttranslational cleavage in the extracellular domain to produce light and heavy chains to combine with the β1 subunit, forming the integrin α3β1 that interacts with many ECM proteins, mediating cell-cell adhesion and cell-matrix adhesion, and connecting the external and internal structures of cells (6). ITGA3 is widely expressed in normal organisms, but under the effects of oncogene induction, chromatin structure changes, high expression of growth factor and its receptor, ECM changes and other factors such as the enhanced transcription of integrins cause disordered expression that induces cancer. Studies have shown that ITGA3 can be used as a poor prognostic factor for pancreatic cancer (7), head and neck cancer (8) and tongue squamous cell carcinoma (9). However, the expression and prognosis of ITGA3 in breast cancer have not been reported.
In this study, we used a variety of databases to explore the expression of ITGA3 in BRCA and its impact on prognosis, analyzed its diagnostic value and genomic and interacting mechanisms, and finally analyzed its impact on TILs. Our research provides new directions and insights into the mechanism of ITGA3 in breast cancer and determined that ITGA3 may be a potential prognostic-related biomarker in BRCA, offering new ideas for clinical diagnosis and application.
Methods
Oncomine
Oncomine (www.oncomine.org) is a cancer microarray database and web-based data-mining platform aimed at facilitating discovery from genome-wide expression analyses. Differential expression analyses comparing most major types of cancer with respective normal tissues as well as a variety of cancer subtypes and clinical-based and pathology-based analyses are available for exploration (10). In this study, we set the P value to 0.001, the fold change to 1.5, and all gene rankings as significance thresholds to evaluate the expression of ITGA3 mRNA in pan-cancer.
TIMER
TIMER (cistrome.shinyapps.io/timer) can be used to comprehensively investigate the molecular characterization of tumor-immune interactions. Levels of six tumor-infiltrating immune subsets were precalculated for 10,897 tumors from 32 cancer types. TIMER provides six major analytic modules that allow users to interactively explore the associations between immune infiltrates and a wide spectrum of factors, including gene expression, clinical outcomes, somatic mutations, and somatic copy number alterations (11). In this study, “Gene Module” was used to visualize the correlation of ITGA3 mRNA levels with the immune cell infiltration levels in BRCA. The “Survival Module” was used to evaluate the correlation between the infiltration of immune cells and BRCA. The “SCNA Module” provides the comparison of tumor infiltration levels among tumors with different somatic copy number alterations for ITGA3. The “DiffExp module” was used to study the differential expression of ITGA3 between tumor and adjacent normal tissues across all TCGA tumors.
The Human Protein Atlas
The Human Protein Atlas (HPA) (www.proteinatlas.org) aims to map all human proteins in cells, tissues and organs. It presents a map of the human tissue proteome based on an integrated omics approach that involves quantitative transcriptomics at the tissue and organ level, combined with tissue microarray-based immunohistochemistry, to achieve spatial localization of proteins down to the single-cell level (12). In this study, we used the “Tissue Atlas”, which shows the distribution of ITGA3 across breast tissues in the human body. The “Pathology Atlas” shows the impact of ITGA3 protein levels on the survival of patients with breast cancer. In addition, we generated an immunohistochemical map of ITGA3 in breast tissue and breast cancer tissue.
UALCAN
Ualcan (ualcan.path.uab.edu/index.html) is a comprehensive web portal to perform in-depth analyses of TCGA gene expression data. UALCAN uses TCGA level 3 RNA-seq and clinical data from 31 cancer types to estimate the effects of gene expression levels and clinicopathologic features on patient survival (13). In this study, ITGA3 expression data were obtained using the “TCGA Analysis” module of UALCAN and the “BRCA” dataset. Student’s t test was used to generate a P value. The P value cutoff was 0.05.
PrognoScan
PrognoScan (dna00.bio.kyutech.ac.jp/PrognoScan/index.html) provides a powerful platform for evaluating potential tumor markers and therapeutic targets. It is a large collection of publicly available cancer microarray datasets with clinical annotation, as well as a tool for assessing the biological relationship between gene expression and prognosis (14). In this study, which showed the prognostic level of ITGA3 in a variety of cancers, the Cox P-value cutoff was 0.05.
GEPIA 2
GEPIA 2 (gepia2.cancer-pku.cn/#index), Gene Expression Profiling Interactive Analysis, is a web-based tool to deliver fast and customizable functionalities based on TCGA and GTEx data. GEPIA provides key interactive and customizable functions, including differential expression analysis, profiling plotting, correlation analysis, patient survival analysis, similar gene detection and dimensionality reduction analysis (15). In this study, we generated a survival map of ITGA3 in the “survival analysis” module, and the significance level was 0.05.
Kaplan–Meier Plotter
Kaplan–Meier plotter (kmplot.com/analysis/index.php?p=background) is a meta-analysis-based platform for the discovery and validation of survival biomarkers, including 54k genes (mRNA, miRNA, protein) related to on survival in breast, ovarian, lung, and gastric cancer (16). To analyze the prognostic value of a particular gene, the cohorts were divided into two groups according to the median (or upper/lower quartile) expression of the gene. The two groups can be compared in terms of relapse-free survival, overall survival, and distant metastasis-free survival. In this study, we analyzed the prognosis of ITGA3 in these four cancers. The hazard ratios (HRs) with 95% confidence intervals and log-rank P-values were also computed.
Easysurv
Easysurv (easysurv.net) is a web-based tool that can perform advanced survival analyses using user-derived data or data from The Cancer Genome Atlas (TCGA), which can conduct univariate analyses and grouped variable selections using multiomics data from TCGA and advanced statistical techniques suitable for high-dimensional data, including genetic data and integrated survival analysis. Through univariate analyses, ESurv can identify the prognostic significance for single genes using the survival curve (median or optimal cutoff), area under the curve (AUC) with C statistics, and receiver operating characteristics (ROC) (17). In this study, we used the univariate analysis and selected the median cutoff to generate a Kaplan–Meier plot of ITGA3. The P value cutoff was 0.05.
ROC Curve
The diagnostic role of ITGA3 in BRCA was assessed by receptor operating characteristic (ROC) curve analysis based on TCGA data, which were downloaded from the UCSC Xena database (xena.ucsc.edu/). In this study, we selected the GDC TCGA breast cancer cohort and extracted the gene expression RNAseq (HTSeq-Counts) data of ENSG00000005884.16 (n = 1217). A P-value <0.05 was considered statistically significant.
cBio-Portal
The cBio Cancer Genomics Portal (www.cbioportal.org/) is an open-access resource for interactive exploration of multidimensional cancer genomics data sets, currently providing access to data from more than 5,000 tumor samples from 20 cancer studies (18). Copy number variation (CNV) and methylation analysis of ITGA3 in BRCA were performed in this study.
MethSurv
MethSurv (biit.cs.ut.ee/methsurv/) is a web tool for survival analysis based on CpG methylation patterns. MethSurv enables survival analysis for a CpG located in or around the proximity of a query gene. For further mining, cluster analysis for a query gene to associate methylation patterns with clinical characteristics and browsing of top biomarkers for each cancer type are provided (19). In this study, we verified the ITGA3 methylation level and the methylation level under different clinical stages through a promoter probe.
NetworkAnalyst
NetworkAnalyst (www.networkanalyst.ca/) addresses the key need to interpret gene expression data within the context of protein–protein interaction (PPI) networks (20). It can create cell-type or tissue-specific PPI networks, gene regulatory networks, gene coexpression networks and networks for toxicogenomics and pharmacogenomics studies. In this study, we used methylated genes from the cBio-Portal database to build a signaling network.
LinkedOmics
LinkedOmics (www.linkedomics.org/login.php) contains multiomics data and clinical data for 32 cancer types and a total of 11,158 patients from The Cancer Genome Atlas (TCGA) project. It is also the first multiomics database that integrates mass spectrometry (MS)-based global proteomics data generated by the Clinical Proteomic Tumor Analysis Consortium (CPTAC) on selected TCGA tumor samples (21). In this study, we analyzed the coexpressed genes of ITGA3 in BRCA and produced volcano maps and related heat maps.
Metascape
Metascape (metascape.org/gp/index.html#/main/step1) is a web-based portal designed to provide a comprehensive gene list annotation and analysis resource for experimental biologists. Metascape combines functional enrichment, interactome analysis, gene annotation, and membership search to leverage over 40 independent knowledge bases within one integrated portal. Additionally, it facilitates comparative analyses of datasets across multiple independent and orthogonal experiments (22). In this study, we used the coexpressed genes of ITGA3 from the LinkedOmics database for Gene Ontology (GO) and Kyoto Encyclopedia of Genes and Genomes (KEGG) pathway enrichment.
Results
ITGA3 Expression Profiles in Pan-Carcinoma
We primarily analyzed the transcription levels of ITGA3 in multiple tumors and normal tissues based on the Oncomine database. We found that the mRNA expression of ITGA3 in bladder cancer, brain and CNS cancer, cervical cancer, esophageal cancer, gastric cancer, head and neck cancer, kidney cancer, leukemia, lymphoma, melanoma, myeloma, ovarian cancer, pancreatic cancer and other cancers was higher than that in adjacent normal tissues, while in breast cancer, colorectal cancer, lung cancer, prostate cancer and sarcoma, the expression was lower than that in normal controls (Figure 1A).
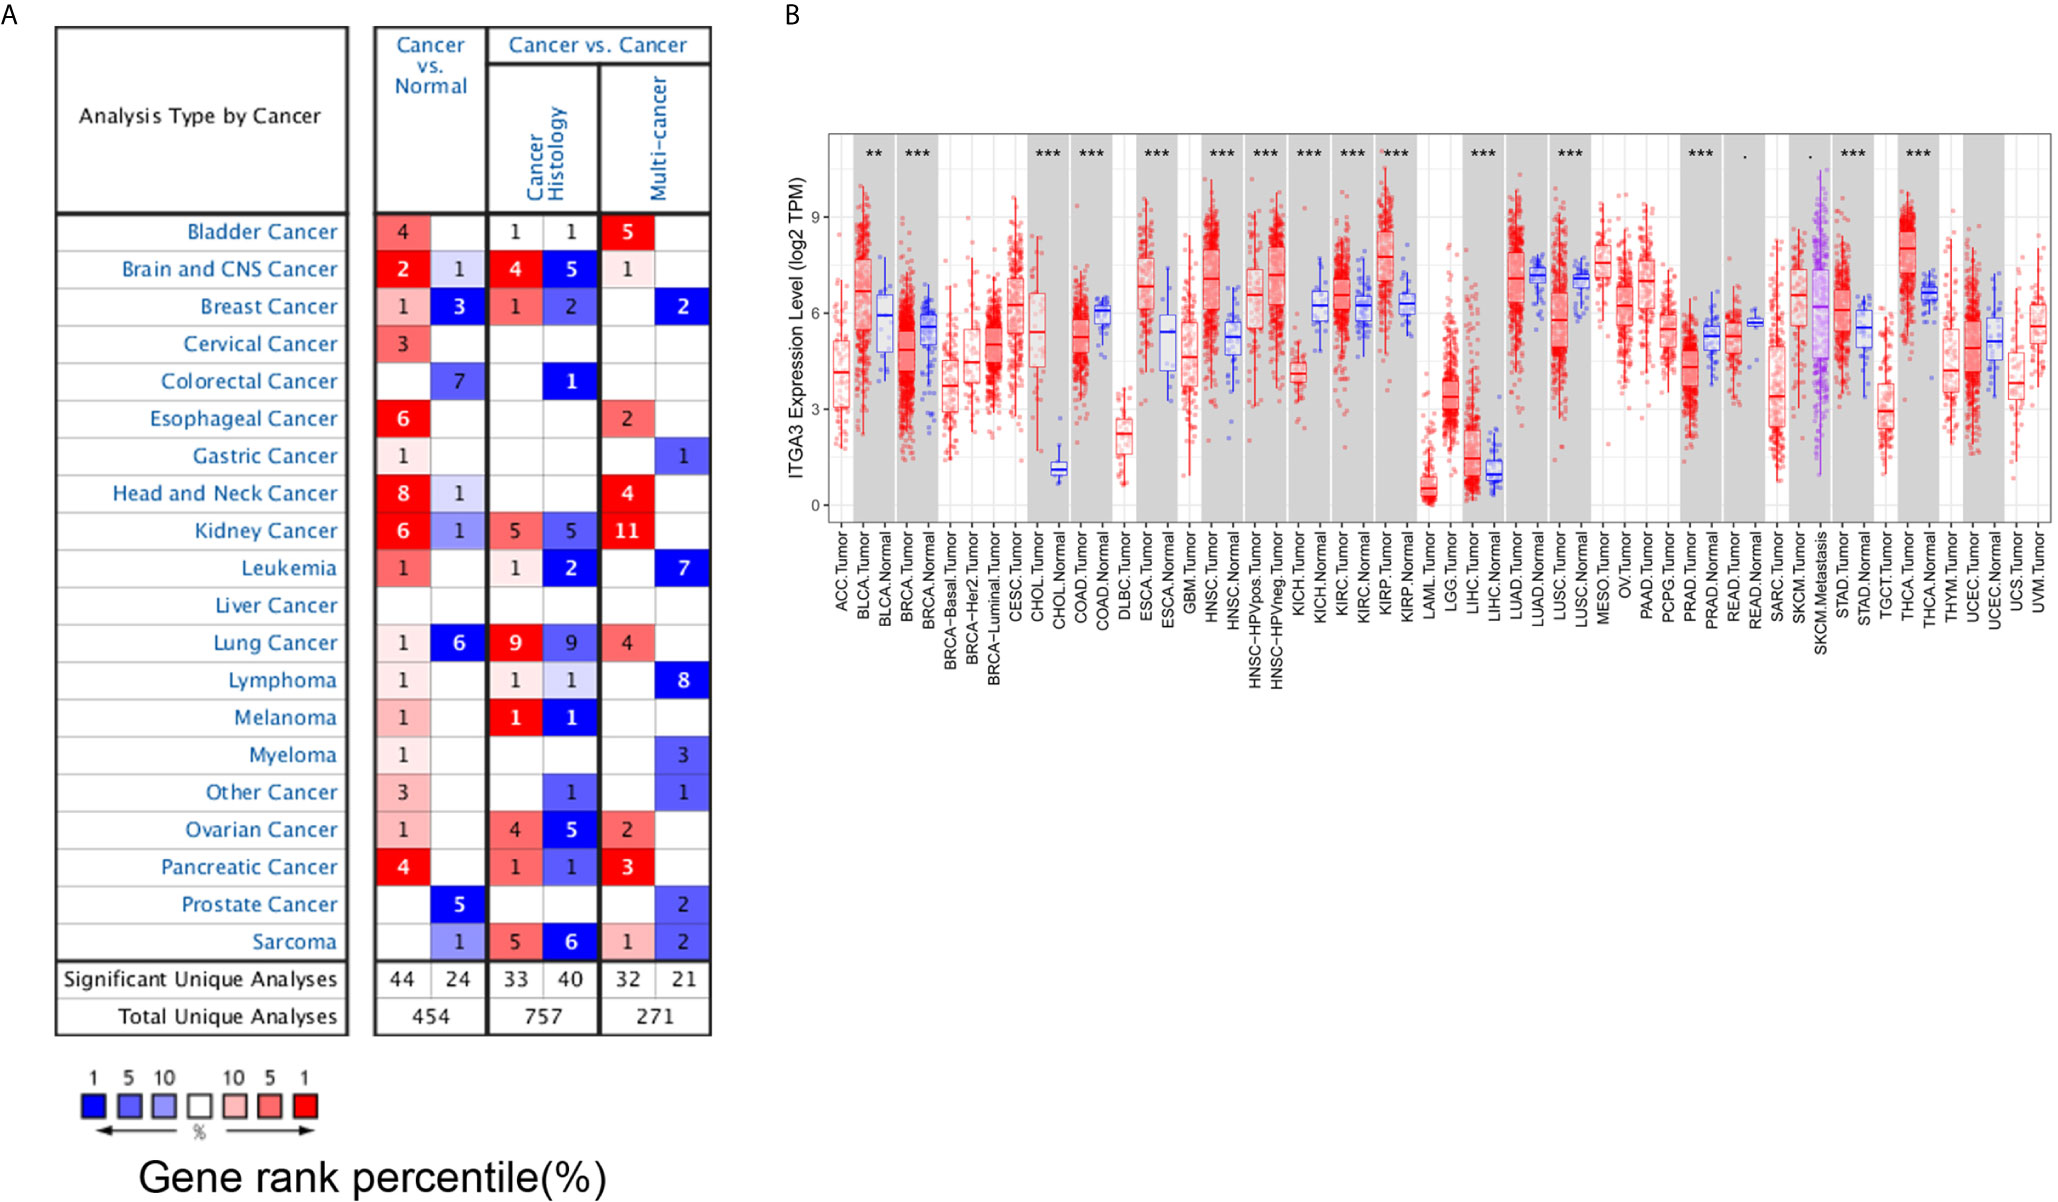
Figure 1 ITGA3 transcription level in different types of tumor tissues and normal tissues. (A) The mRNA level of ITGA3 in different types of tumor tissues and normal tissues in the Oncomine database (P value is 0.001, fold change is 1.5, and gene ranking of all.). (B) The mRNA level of ITGA3 in different types of tumor tissues and normal tissues in TIMER database (P-value Significant Codes: 0 ≤ *** < 0.001 ≤ ** < 0.01 ≤ · < 0.1).
We further used the TIMER database to evaluate which cancers have differential expression at the mRNA level. The results showed that ITGA3 was markedly overexpressed in 13 types of cancer (BLCA, ESCA, CHOL, HNSC, KIRC, KIRP, LIHC, STAD, THCA) compared with the corresponding normal controls. In contrast, ITGA3 was expressed at lower levels in BRCA, COAD, KICH, LUSC and PRAD than in normal controls (Figure 1B).
Then, we used the HPA database to analyze the protein expression level of ITGA3. As shown in Figure 2A, the protein level of ITGA3 was highly expressed in most normal tissues. Except for lymphoma, glioma, testicular cancer and prostate cancer, which were usually weakly stained or negative, most tumor tissues showed moderate to strong membrane and/or cytoplasm positivity, and the final statistics are shown in Figure 2B. In addition, the immunohistochemical staining of ITGA3 in breast tissue and breast cancer tissue is shown in Figure 2C.
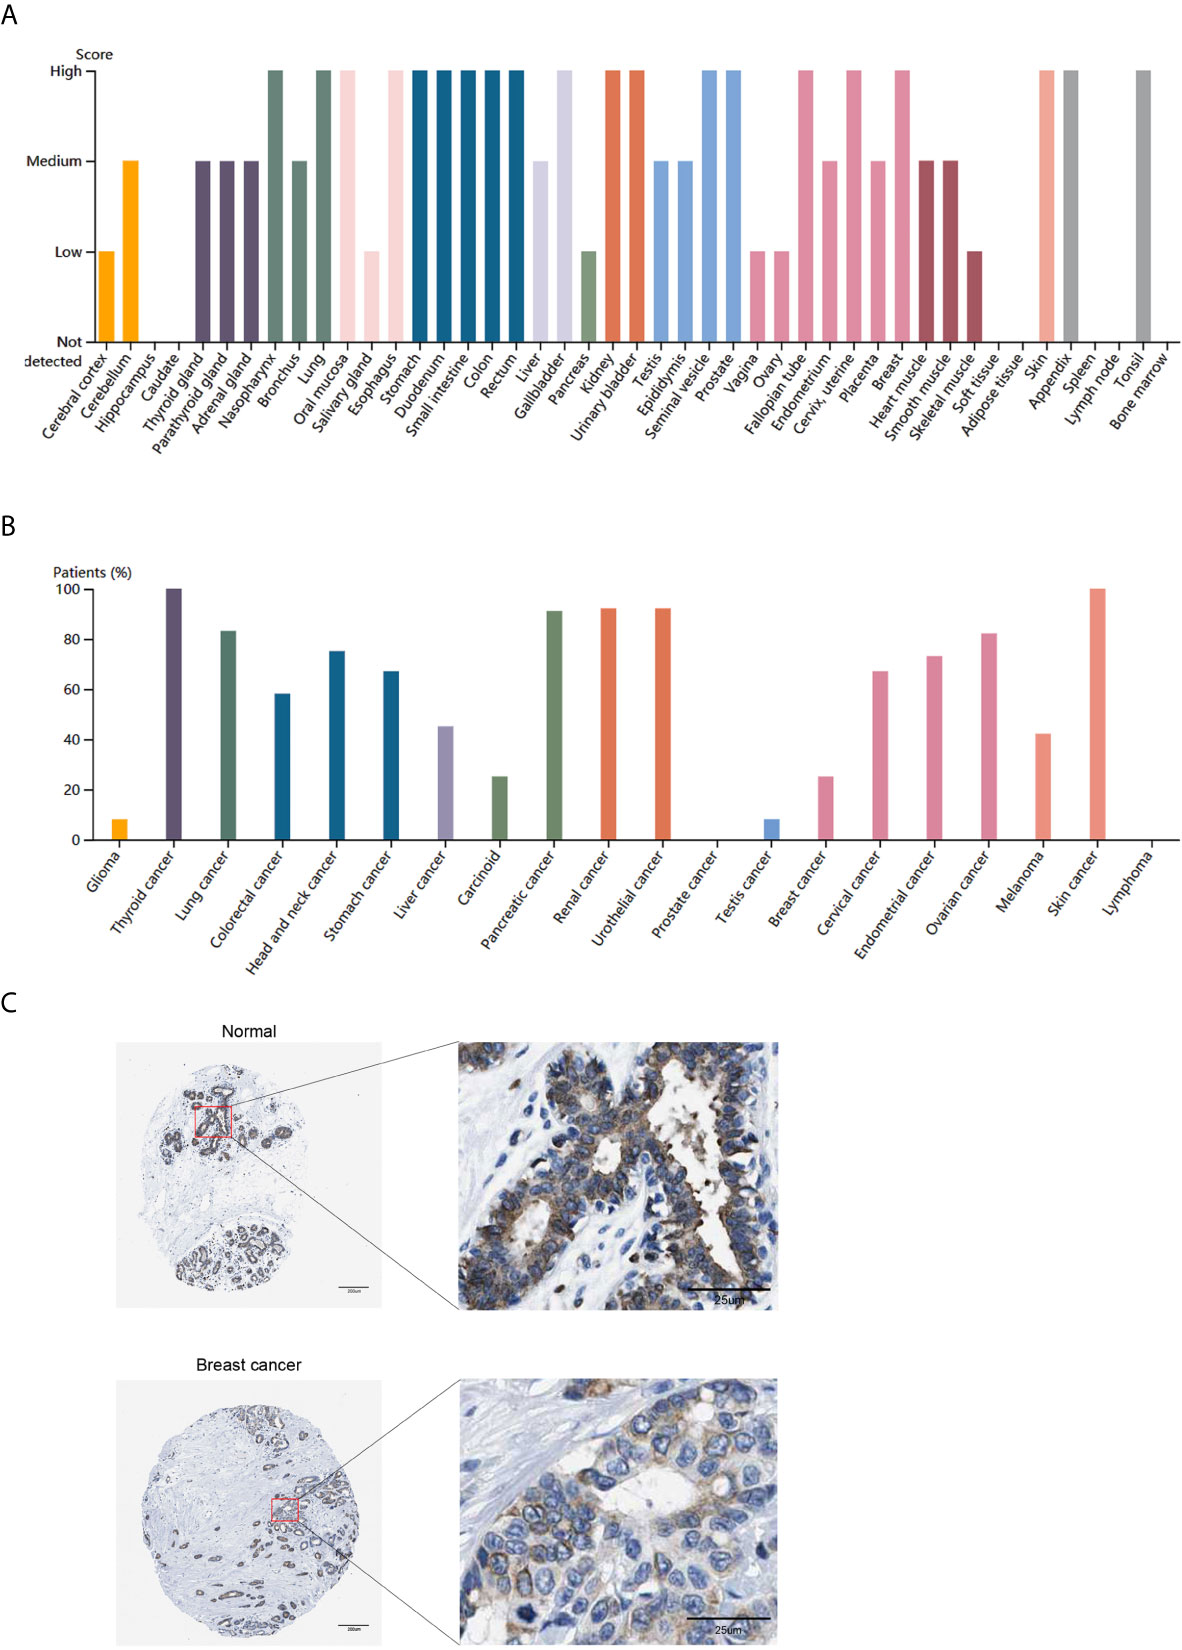
Figure 2 ITGA3 translation level in different types of tumor tissues and normal tissues. (A) The protein level of ITGA3 in different types of normal tissues in HPA. (B) The protein level of ITGA3 in different types of tumor tissues in HPA. (C) Representative IHC images of ITGA3 in normal breast tissues and breast cancer tissues (The left scale bar, 200 μm; the right scale bar, 25 μm).
In conclusion, the expression of ITGA3 in breast tissues was higher than that in breast cancer tissues at both the mRNA and protein levels. The mRNA level of ITGA3 was further analyzed by TCGA-BRCA samples in the UALCAN database. The results showed that based on the analysis of age, tumor stage, breast cancer subtype, lymph node metastasis and TP53 mutation, the expression of ITGA3 in breast cancer patients was significantly lower than that in normal controls. As shown in Figure 3, the expression of ITGA3 in triple-negative breast cancer was significantly lower than that in the luminal and HER2-positive subtypes. In the lymph node metastasis classification, the expression of N1 was significantly higher than that of N3. In addition, the expression of the TP53 mutant was significantly lower than that of the nonmutant.
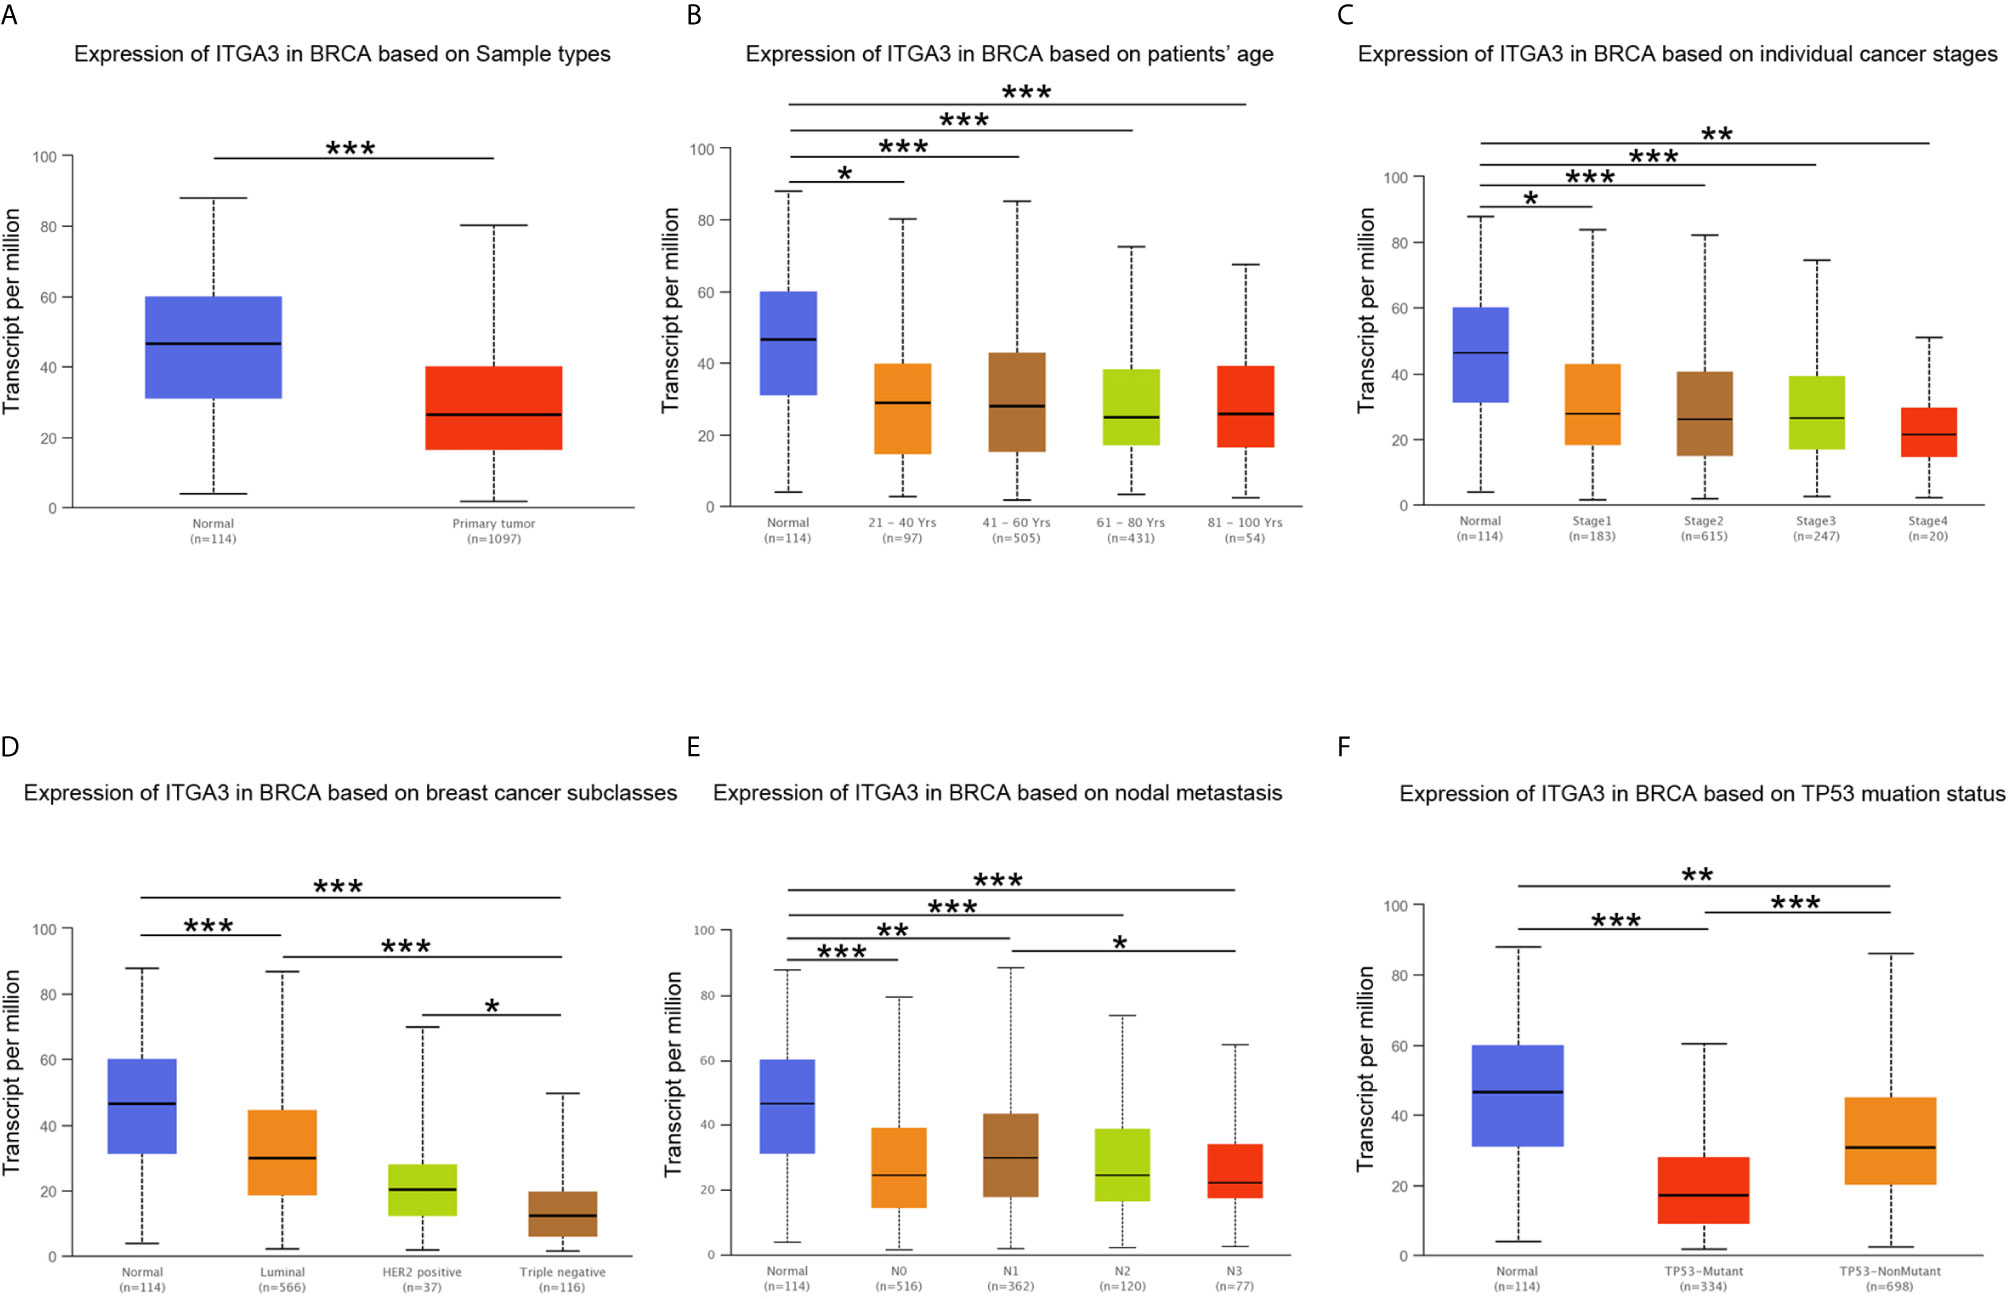
Figure 3 ITGA3 transcription level in subgroups of patients with BRCA. (A) Boxplot of ITGA3 relative expression based on sample types. (B) Boxplot of ITGA3 relative expression based on patients’ age. (C) Boxplot of ITGA3 relative expression based on cancer stages. (D) Boxplot of ITGA3 relative expression based on breast cancer subclasses. (E) Boxplot of ITGA3 relative expression based on nodal metastasis. (F) Boxplot of ITGA3 relative expression based on TP53 mutation status (The central mark is the median; the edges of the box are the 25th and 75th percentiles. *p < 0.05; **p < 0.01; ***p < 0.001).
Prognostic Analysis of ITGA3 in Cancer Patients
We subsequently used the PrognoScan database and GEPIA database to assess the relationship between ITGA3 expression and cancer patient outcomes. From the PrognoScan database, high expression of ITGA3 showed favorable prognosis in breast cancer (Figure 4A) and eye cancer (Figure 4B), and poor prognosis in colorectal cancer (Figure 4C), lung adenocarcinoma (Figure 4D), non-small-cell lung cancer (Figure 4E) and ovarian cancer (Figure 4F). In the GEPIA database, as shown in Figure 4G, in terms of RFS among 33 types of cancer, ITGA3 was a high-risk factor in GBM, LUSC, PAAD and STAD, while a protective factor in BRCA (P <0.05). For OS, ITGA3 was a high-risk factor in GBM, HNSC, LGG, LUSC and PAAD, while a protective factor in ACC (P <0.05).
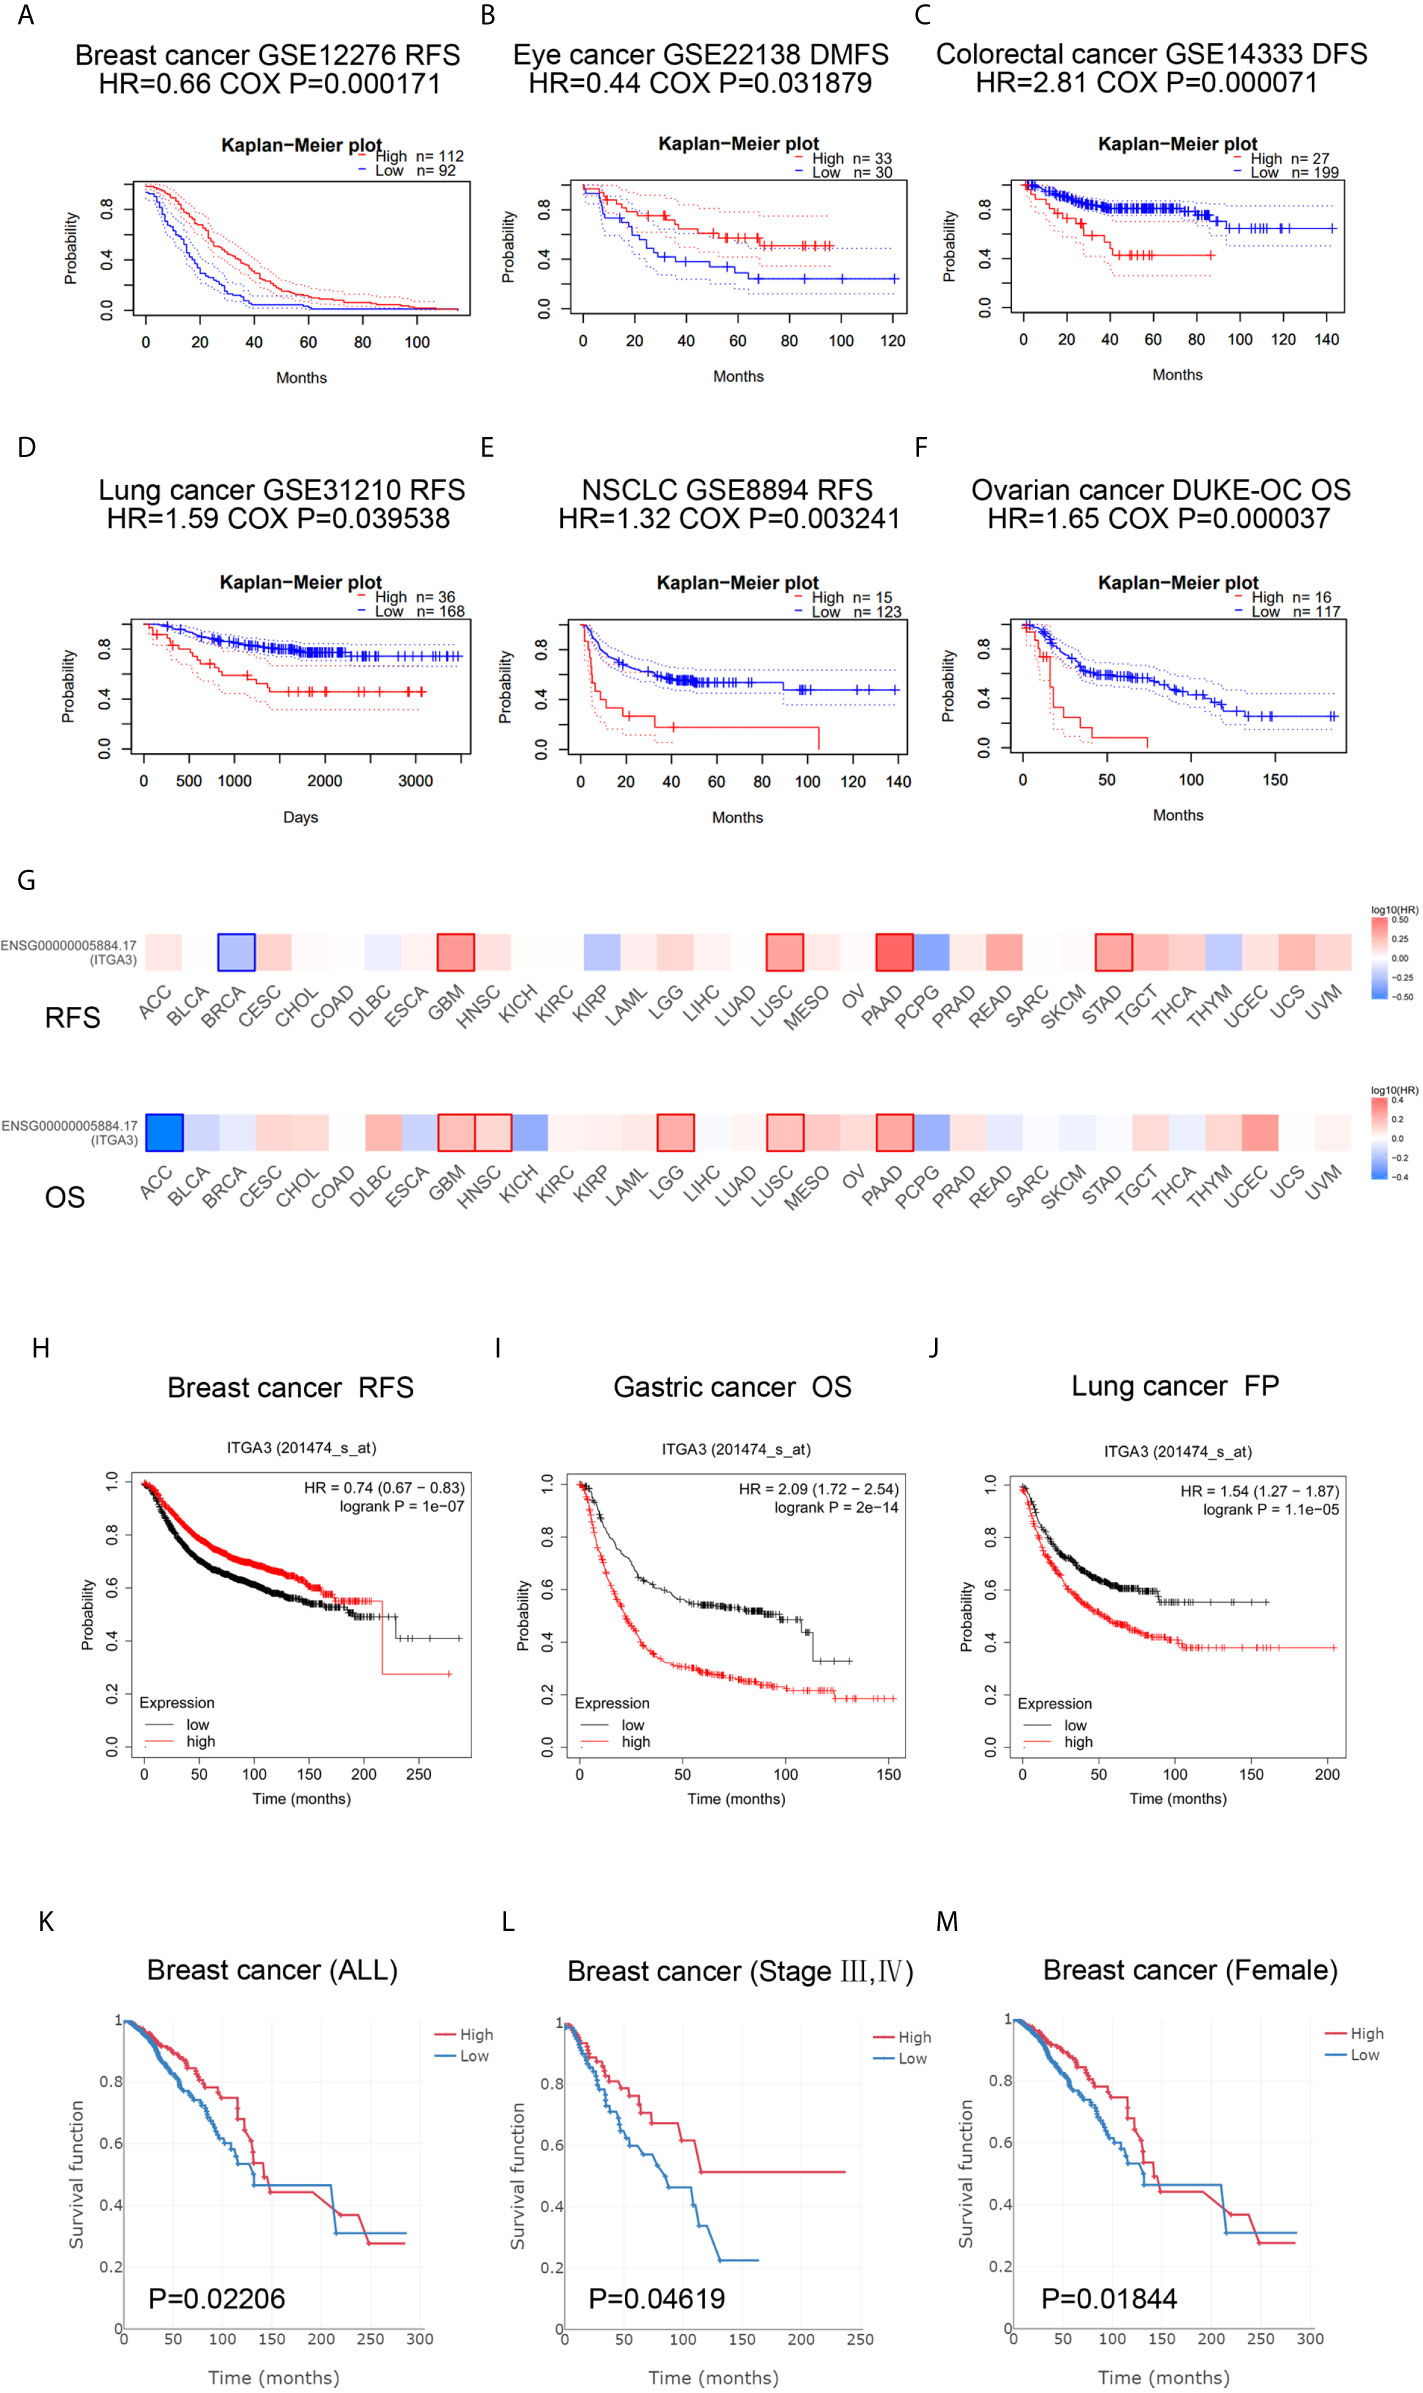
Figure 4 ITGA3 is associated with survival outcome. (A–F) Correlation between ITGA3 and prognosis of various types of cancer in the PrognoScan. (G) Survival map of ITGA3 in pan-carcinoma. (H–J) Kaplan–Meier curves comparing the high and low expression of ITGA3 in breast cancer (RFS), gastric cancer (OS), lung cancer (FP). (K–M) The expression of ITGA3 was significant for the overall (K), stage III, IV (L) and female (M) of breast cancer patients’ OS. OS, overall survival; RFS, relapse free survival; DMFS, distant metastasis free survival; FP, first progression. Logrank P-value <0.05 was considered as statistically significant.
Next, the Kaplan–Meier plotter database was used to evaluate the prognosis of ITGA3 in patients with breast cancer, ovarian cancer, lung cancer and gastric cancer, as well as the prognosis under different pathological subtypes. Figure 4H shows that the high ITGA3 expression group had significantly better RFS in breast cancer (log-rank test, P <0.05) than the low expression group. Figures 4I, J show that higher expression of ITGA3 was associated with a poorer prognosis in gastric cancer (OS) and lung cancer (FP). There was no significant difference between the expression of ITGA3 and the prognosis of ovarian cancer. We used Easysurv to further verify the effect of ITGA3 on the survival of breast cancer patients’ OS. The results showed that the expression of ITGA3 was significant for the overall, stage III, IV and female survival functions (Figures 4K–M).
These results indicated that in multiple tumor types, the expression of ITGA3 was significantly associated with a poor prognosis, while in breast cancer, the expression of ITGA3 was associated with a better prognosis. We further analyzed the prognostic value of ITGA3 in various subtypes of BRCA (Table 1). The results showed that in stages 1, 2, and 3, the expression of ITGA3 was significantly related to the survival of BRCA, and ITGA3 served as a protective factor in the prognosis of BRCA. Due to the lack of sufficient samples, its impact in BRCA stage 4 was unclear. Recently, TMB has become an emerging predictive marker for the efficacy of immune checkpoint inhibitors. Tumors with high TMB had a better response to immune checkpoint inhibitors (23). Therefore, we detected ITGA3 expression in BRCA under different TMB states and found that ITGA3 could be used as a prognostic biomarker under low TMB conditions.
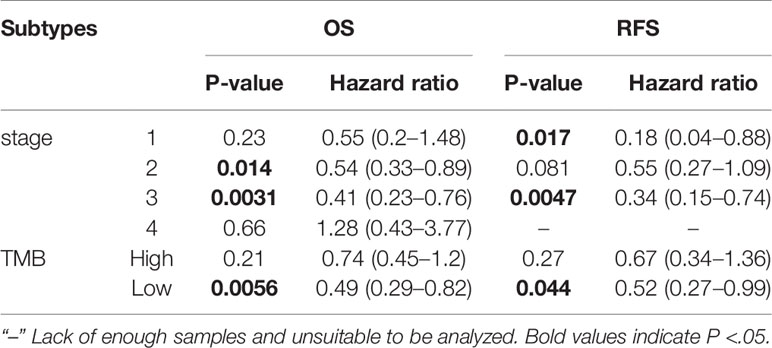
Table 1 Correlation of ITGA3 mRNA expression and clinical prognosis in breast cancer with different subtypes by Kaplan–Meier plotter.
Diagnostic Value of ITGA3 in BRCA
Through the analysis of the expression and prognosis of ITGA3 in a variety of cancers, we found that ITGA3 is differentially expressed in several cancers and has a certain impact on prognosis, making it an adverse prognostic factor. Surprisingly, the expression of ITGA3 in BRCA was lower than that in normal controls and was favorable for prognosis. In view of its prognostic value in BRCA, we used TCGA normal and breast cancer data to generate ROC curves to further analyze the diagnostic value of ITGA3 in BRCA. Figure 5 shows that the area under the curve (AUC) area was 0.658, indicating that ITGA3 has the diagnostic ability to distinguish BRCA from normal controls; subsequently, the diagnostic threshold was further calculated by the Youden index to be 12.505 [transformed by log2(count + 1)]. These results indicated that ITGA3 was expected to become a diagnostic biomarker for BRCA.
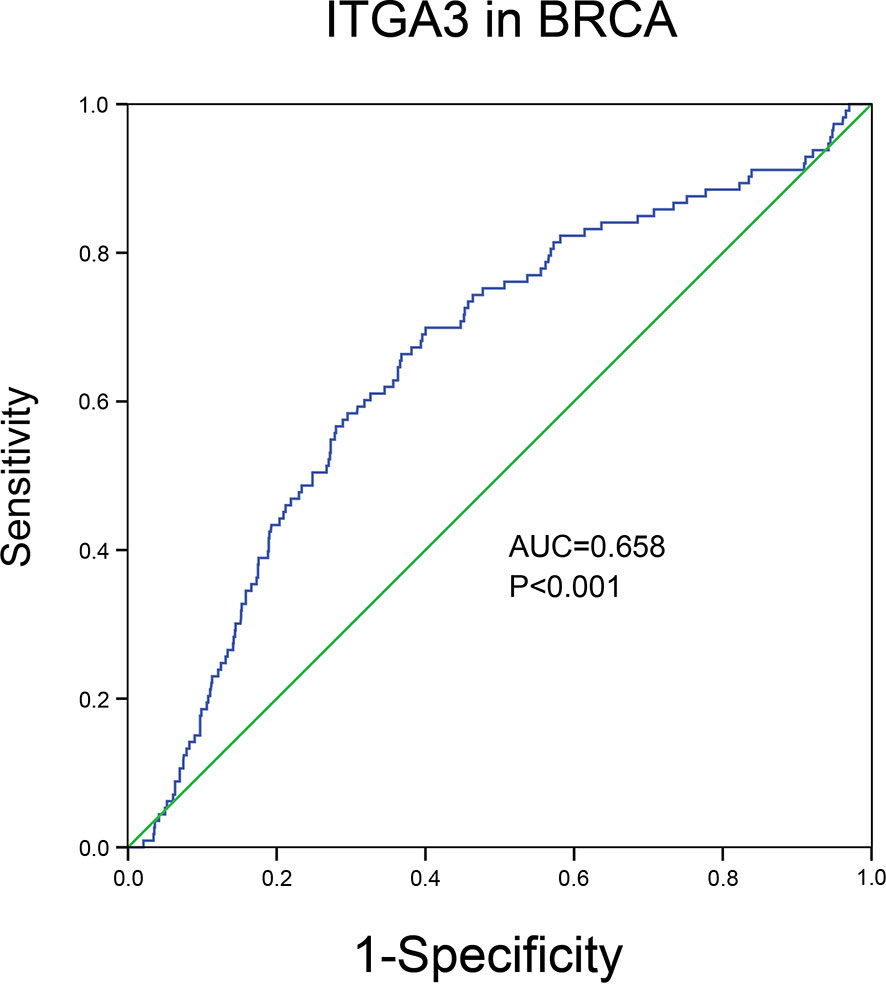
Figure 5 The diagnostic value of ITGA3 in BRCA based on the TCGA data. P-value <0.05 was considered as statistically significant.
Genomic Alterations and Methylation of ITGA3 in BRCA
To further explore the mechanism of differential expression of ITGA3 in breast cancer and normal breast tissue, we used the cBio-Portal tool to analyze the genome of ITGA3. We selected the TCGA (Firehose Legacy) of breast invasive carcinoma for analysis, and in Figure 6A, ITGA3 was altered in 113 of 960 (12%) BRCA patients, including mutation in 1 case (0.1%), amplification (AMP) in 62 cases (6.46%), deep deletion in one case (0.1%), mRNA high in 13 cases (1.35), mRNA low in 23 cases (2.4%), and multiple alterations in 13 cases (1.35%). Thus, AMP is the most common type of ITGA3 copy number variation (CNV) in BRCA. ITGA3 AMP led to high expression of ITGA3 (Figure 6B). However, ITGA3 AMP corresponds to a low methylation level (Figure 6C), which revealed the potential correlation between the ITGA3 mRNA expression level and ITGA3 promoter methylation. Subsequently, we corroborated the correlation, as shown in Figure 6D, that the promoter methylation level of ITGA3 was negatively correlated with the ITGA3 mRNA expression level. Therefore, we speculated that the low expression of ITGA3 in BRCA might be due to promoter methylation, which leads to the inhibition of transcription.
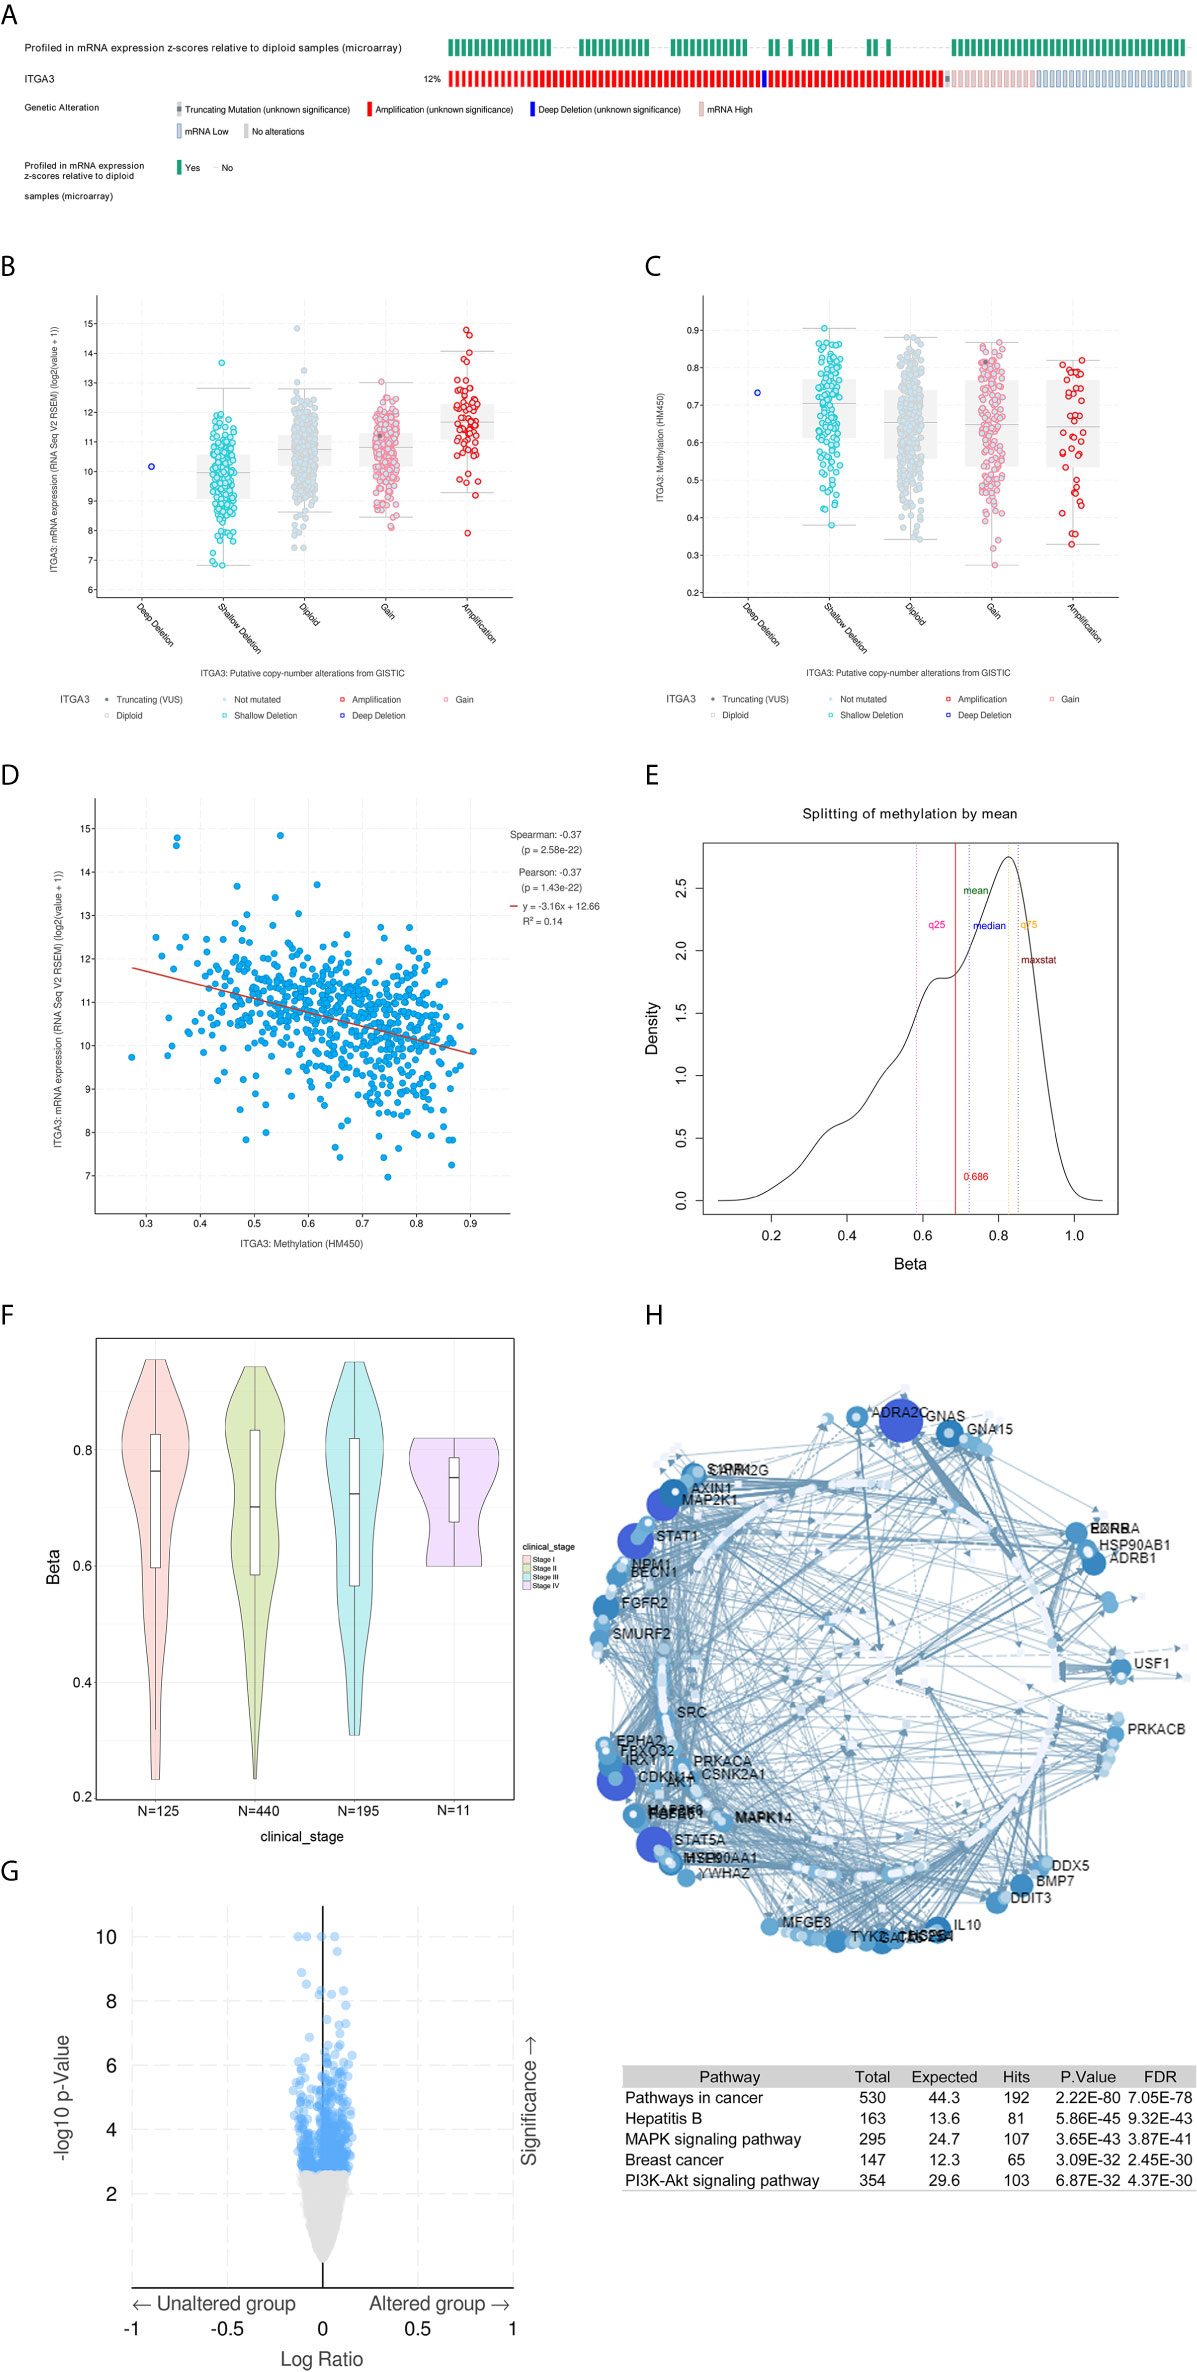
Figure 6 ITGA3 genomic analysis in BRCA. (A) OncoPrint of ITGA3 alterations in BRCA cohort. The different types of genetic alterations are highlighted in different colors. (B) ITGA3 expression in different ITGA3 CNV groups. (C) ITGA3 methylation in different ITGA3 CNV groups. (D) The relationship between ITGA3 promoter methylation level and ITGA3 mRNA expression in BRCA. (E) TSS1500-N_Shore-cg11222053 probe methylation density map. (F) TSS1500-N_Shore-cg11222053 probe methylation profiles based on clinical stage. (G) Volcano plot of methylated genes between unaltered group and altered group. (H) Signaling network of methylated genes with significant differences.
Next, we explored the methylation sites of ITGA3 in BRCA through the Methsurv database. The level of methylation is expressed by β value. A β value ≥0.6 was considered completely methylated, a β value ≤0.2 was considered completely unmethylated, and 0.2–0.6 was considered partially methylated. Finally, it was found that the β value of the TSS1500-N_Shore-cg11222053 probe was more than 0.6 (mean) (Figure 6E), indicating complete methylation. The probe is located in the promoter region, showing that the promoter of ITGA3 is methylated. This was consistent with our above speculation: ITGA3 promoter methylation is one of the mechanisms of ITGA3 downregulation in BRCA. According to different clinical stages, the median β value of stages 1, 2, 3 and 4 was greater than 0.6 (Figure 6F).
DNA methylation belongs to the epigenetic category and is an important mechanism for regulating gene expression. As shown in Figure 6G, the top three genes with significant differences in methylation between altered group and unaltered group were as follows: NPM1 (qValue = 1.73E−10), ASNSD1 (qValue = 20.1E−09), and MAK (qValue = 2.72E−08). Next, the genes with significant differences (FDR ≤0.05) were used to construct the signaling network with NetworkAnalyst, as shown in Figure 6H. The top five genes with a high degree of difference were GNAS, CDKNA1, STAT1, STAT5A and MAP2K1. Enrichment with KEGG pathways revealed that the top five highest enrichment pathways were the following: pathway in cancer, hepatitis, MAPK signaling pathway, breast cancer and PI3K-Akt signaling pathway.
ITGA3 Coexpression Gene and Pathway Enrichment in BRCA
To gain insight into the function of ITGA3, we next enriched the coexpression gene pathways to visualize the connection between ITGA3 and coexpression genes. Initially, we used the LinkedOmics database to exhume the ITGA3 coexpression model in the BRCA cohort. The ITGA3 association volcano map is shown in Figure 7A. ITGA3 was positively correlated with XYLT2 (r = 0.564, P = 9.85E−93), SPATA20 (r = 0.526, P = 1.11E−78), and PDK2 (r = 0.497, P = 3.65E−69). The heat map of the top 50 genes with significant positive and negative correlations with ITGA3 is shown in Figure 7B.
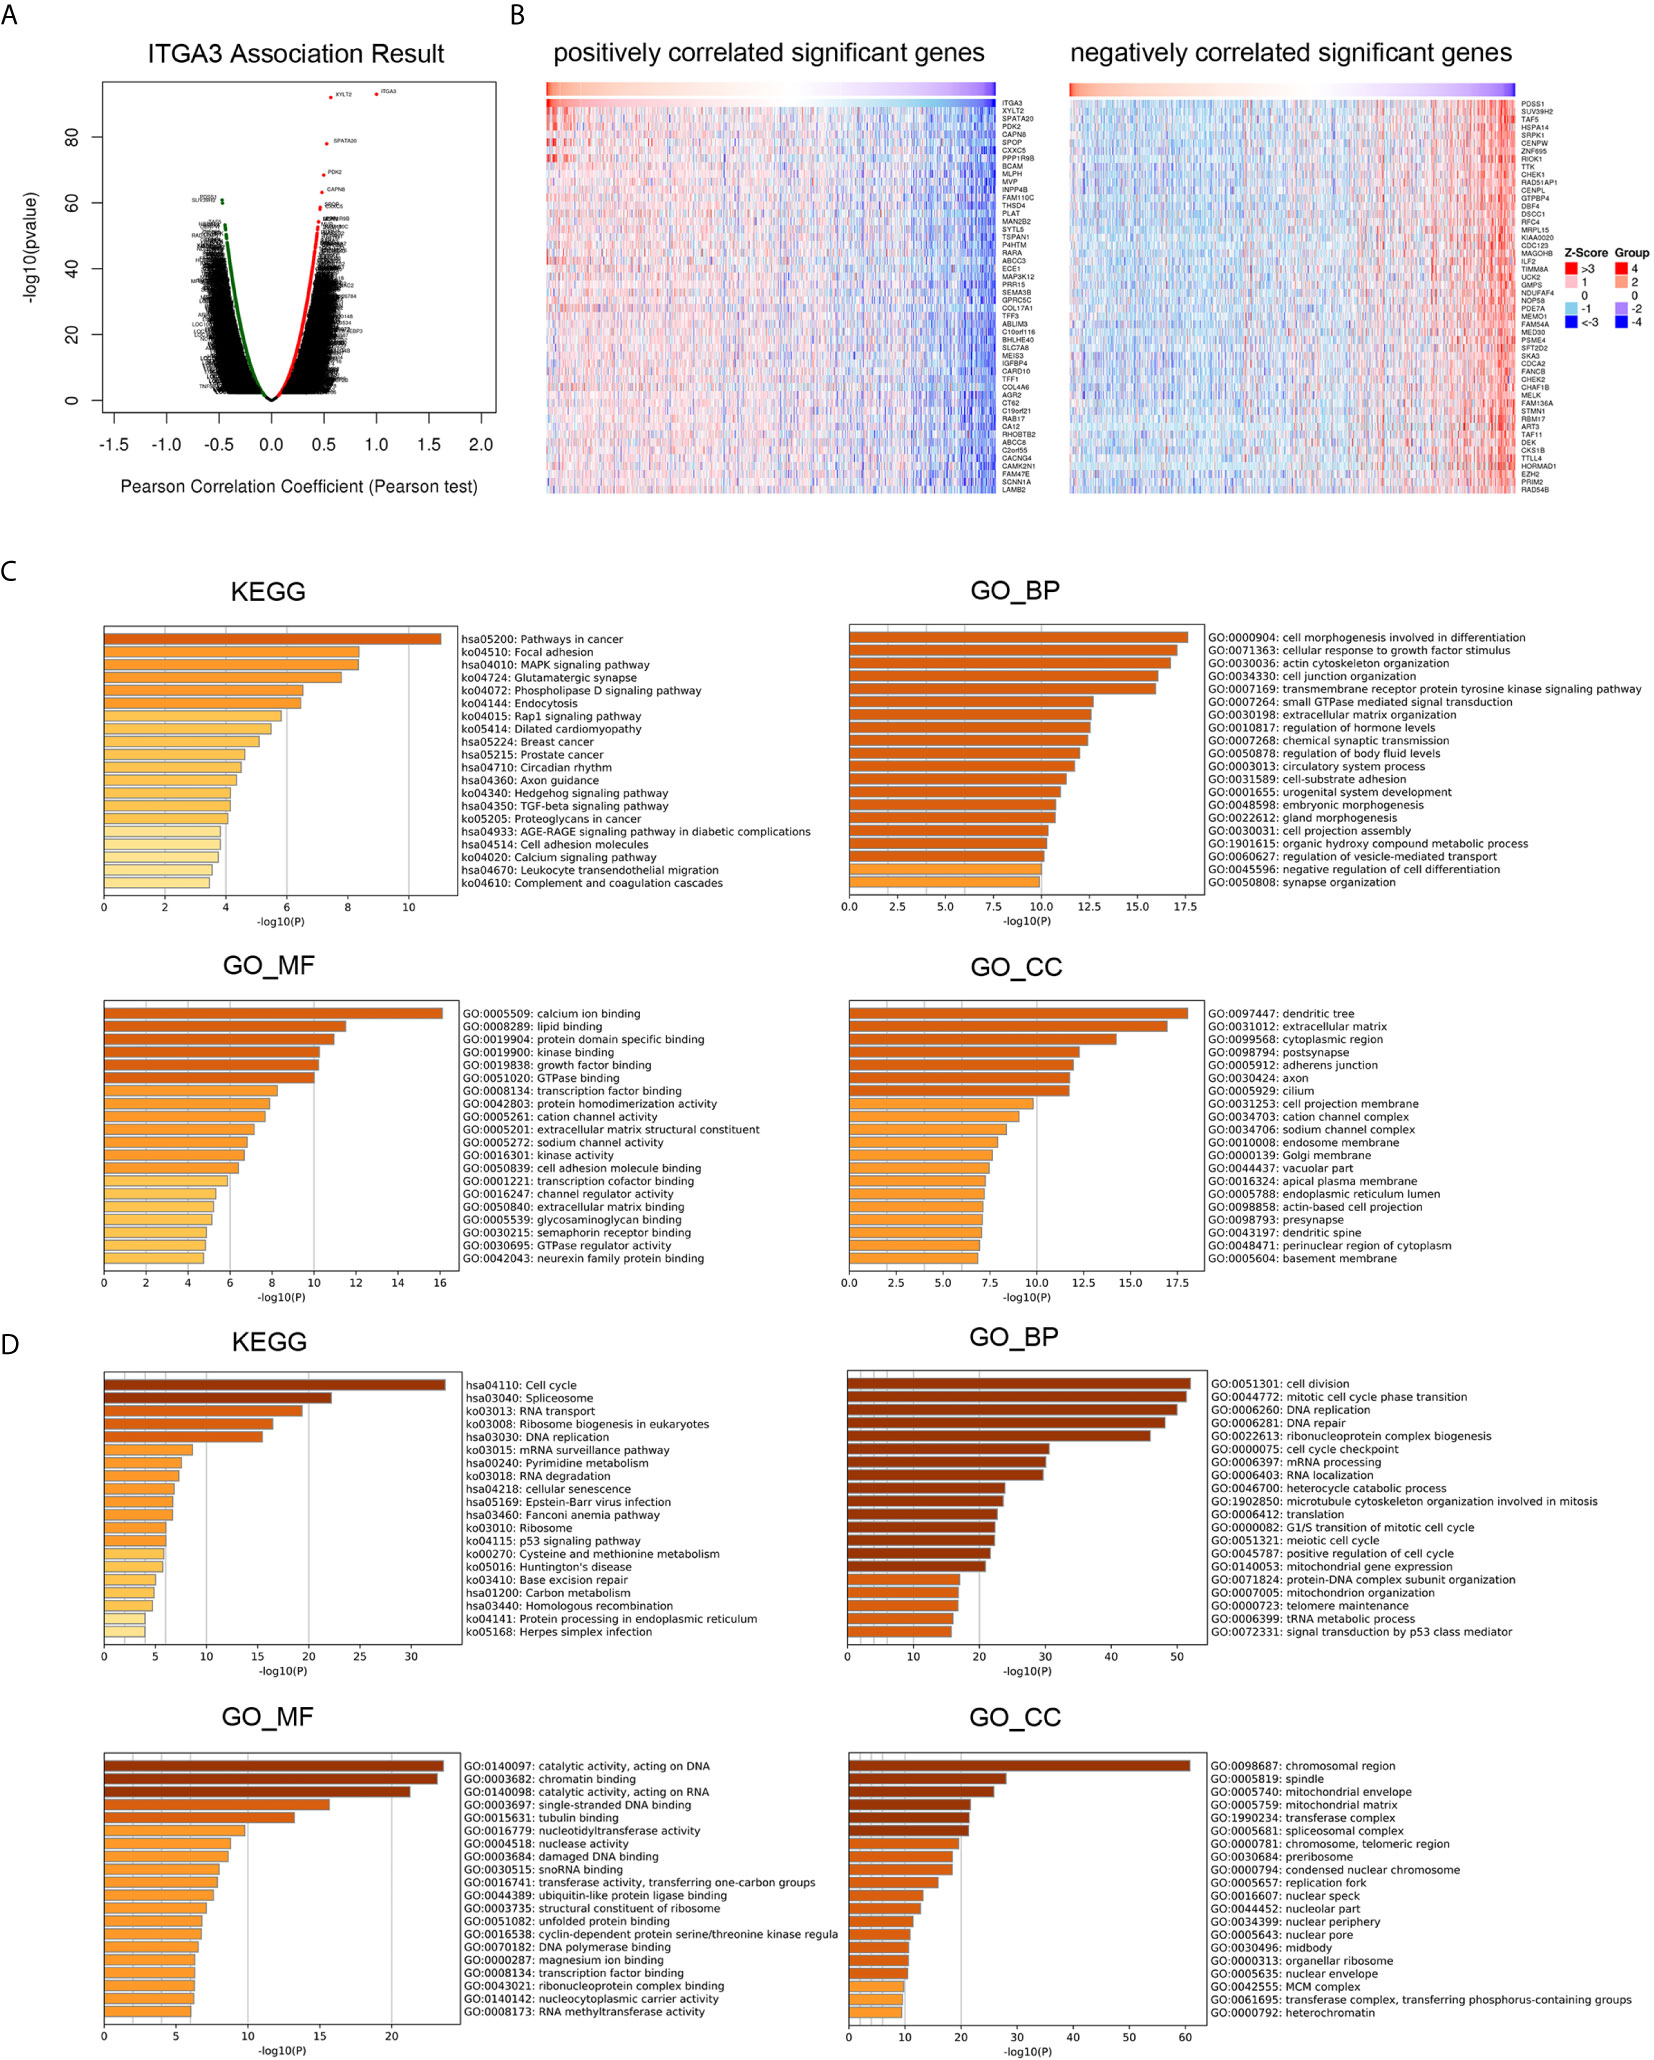
Figure 7 ITGA3 co-expression genes and pathways enrichment in BRCA. (A) Volcano plot of ITGA3 association result. (B) Heat maps showing top 50 genes positively and negatively correlated with ITGA3 in BRCA. Red indicates positively correlated genes and blue indicates negatively correlated genes. (C) KEGG, GO_BP, GO_MF, GO_CC pathway enrichment of positively correlated genes with ITGA3. (D) KEGG, GO_BP, GO_MF, GO_CC pathway enrichment of negatively correlated genes with ITGA3.
Then, Metascape was used to analyze the pathway enrichment of ITGA3 coexpression genes. The pathway enrichment of positively related genes of ITGA3 is shown in Figure 7C, and KEGG pathway analysis showed that positively related genes were involved: pathways in cancer, focal adhesion, MAPK signaling pathway, Rap1 signaling pathway, breast cancer, TGF-β signaling pathway, cell adhesion molecules, and leukocyte transendothelial migration. GO_BP (biological process) was mainly related to differentiation, response to growth factor stimulation, cytoskeleton, ECM adhesion and other biological processes. GO_MF (molecular function) was mainly associated with calcium, kinase, growth factor, transcription factor and cell adhesion molecule. GO_CC (cell component) was mainly expressed in dendrites, ECM, adherens junctions and axons. The pathway enrichment of negatively related genes is shown in Figure 7D. KEGG showed that the pathways were enriched in cell cycle, spliceosome, RNA transport, DNA replication, and RNA degradation. GO_BP was mainly related to cell division, DNA replication and repair, RNA processing, translation and other biological processes. GO_MF was mainly related to catalyzing the activity of DNA and RNA. GO_CC was mainly expressed in chromosomes and mitochondria.
In conclusion, ITGA3 coexpressed genes were mainly involved in tumor formation, regulating cell adhesion, migration, proliferation, apoptosis, and immune response.
Immune Infiltration Analysis of ITGA3 in BRCA
The transformation of breast tissue to breast cancer is usually accompanied by a high level of lymphocyte infiltration. Here, we investigated the relationship between ITGA3 and TILs in breast cancer. As shown in Figure 8A, the expression of ITGA3 was significantly negatively correlated with tumor purity and B cell infiltration and positively correlated with macrophage infiltration. Next, we further analyzed the effect of immune cell infiltration on the prognosis of BRCA. The results showed that the infiltration of B cells, CD8 T cells, CD4 T cells, neutrophils and dendritic cells was significantly correlated with the prognosis of BRCA (Figure 8B). Moreover, the copy number variation of ITGA3 was significantly correlated with the infiltration levels of six kinds of immune cells (Figure 8C), manifesting that the gain or AMP of ITGA3 was correlated with the infiltration of immune cells and that ITGA3 may be involved in the recruitment of immune cells.
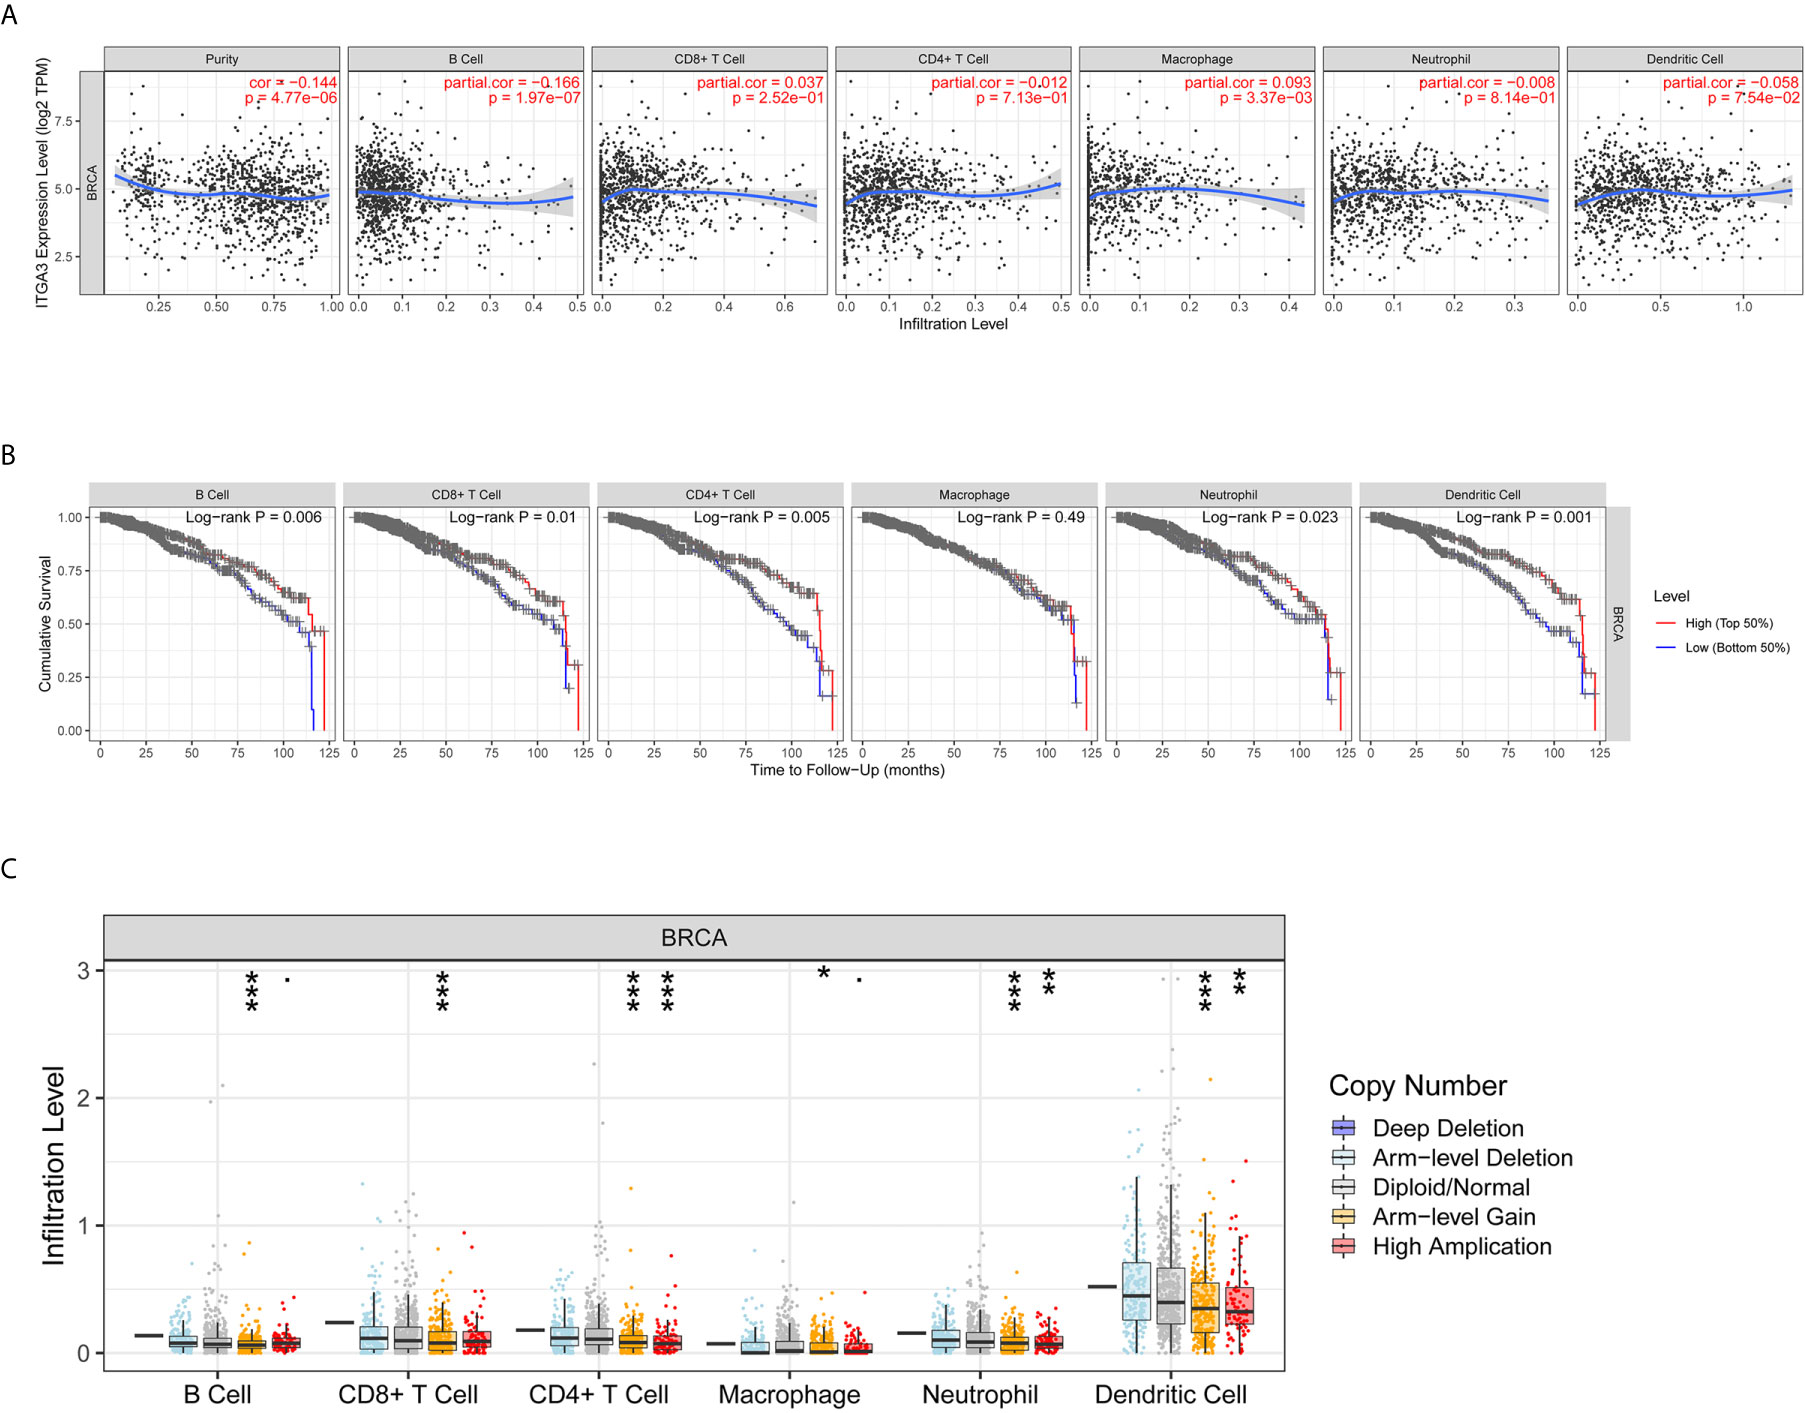
Figure 8 Correlations of ITGA3 with immune infiltration level in BRCA. (A) ITGA3 expression is significantly related to tumor purity and has significant positive correlations with infiltrating levels of macrophages, and significant negative correlations with infiltrating levels of B cells in LIHC. (B) Kaplan–Meier plots of immune infiltration and ITGA3 expression level in BRCA. (C) ITGA3 CNV affects the infiltrating levels of immune cells in BRCA. (P-value Significant Codes: 0 ≤ *** < 0.001 ≤ ** < 0.01 ≤ * < 0.05 ≤ . < 0.1).
Correlation Analysis Between ITGA3 and Immune Markers
To further explore the relationship between ITGA3 and immune infiltration, we used TIMER to analyze the correlation between ITGA3 and multiple immune markers. We selected 16 kinds of common immune cell markers (24, 25) and adjusted the results with tumor purity. As shown in Table 2, except for M1 macrophage markers, ITGA3 was related to most immune markers in BRCA, revealing a significant correlation between ITGA3 expression and CD8 T cell markers (CD8A, CD8B), T cell markers (CD3D, CD3E, CD2), Th1 markers (TBX21, IFNG, TNF), Th2 markers (GATA3, STAT6, STAT5A), Tfh markers (BCL6, IL21), and Th17 markers (STAT3, IL17A), indicating that ITGA3 may be involved in regulating T cell responses. In addition, ITGA3 was negatively correlated with Treg markers (FOXP3 and CCR8) and T cell exhaustion markers (PDCD1, CTLA4, LAG3 and GZMB), suggesting that ITGA3 might be involved in immune escape. ITGA3 was also negatively correlated with B cell markers (CD19 and CD79a), monocyte markers (CD86), TAM markers (CCL2 and IL10), and M2 macrophage markers (CD163 and MS4A4A), suggesting that it might be involved in immunosuppression and the regulation of macrophage polarization. In conclusion, these results indicated that ITGA3 could potentially regulate the recruitment and activation of immune cells in BRCA.
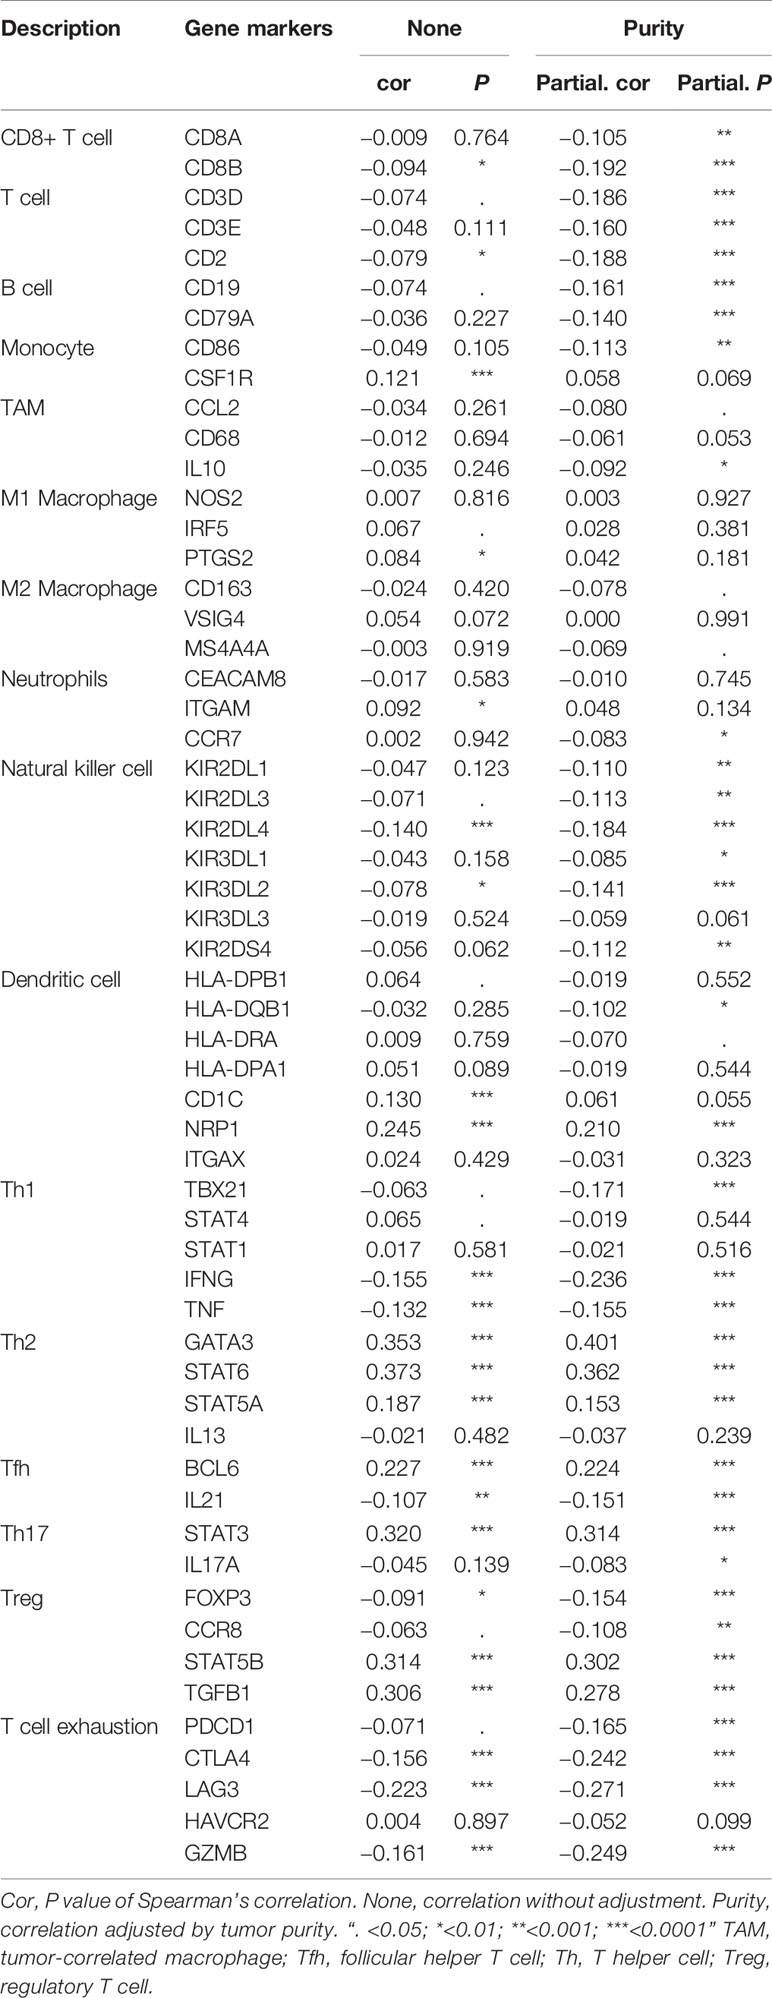
Table 2 Correlation analysis between ITGA3 and gene markers of immune cells in BRCA by TIMER.
Discussion
ITGA3 is a member of the integrin family, which forms transmembrane integrin with the β1 subunit and is the receptor of fibronectin, laminin, collagen, and epithelial protein. A large number of studies have shown that ITGA3 can be used as a prognostic indicator for multiple cancers. However, its prognostic effect on breast cancer is still unclear. In this study, we used a variety of databases to explore the expression, survival, prognosis, genomic analysis, coexpression network and immune infiltration of ITGA3 in BRCA. This study showed that the mRNA and protein levels of ITGA3 in BRCA were lower than those in normal controls. Further survival analysis showed that low expression of ITGA3 was significantly associated with poor RFS in breast cancer patients. In addition, tumor pathological stage showed that lower expression of ITGA3 was associated with poorer OS and RFS in stage 3, indicating that ITGA3 was related to the prognosis of patients with advanced breast cancer. ROC curves showed that ITGA3 had significant diagnostic value for breast cancer, indicating that ITGA3 might be a potential diagnostic biomarker for BRCA. Then, we analyzed the mechanism of ITGA3 in the prognosis of breast cancer patients. Through pathway enrichment analysis of coexpressed genes, we found that ITGA3 is related to immune cell infiltration and ECM adhesion. On the one hand, immune infiltration analysis showed that in breast cancer, low expression of ITGA3 promotes B cell infiltration and M2 polarization. On the other hand, ITGA3 participates in ECM remodeling. All of these processes can lead to tumor growth and metastasis. Therefore, low expression of ITGA3 leads to a poor prognosis for breast cancer patients.
By analyzing the expression level of ITGA3 in breast cancer, we found that the expression of ITGA3 was lower in breast cancer than in normal controls. Next, we further explored the downregulationed mechanism of ITGA3 in breast cancer. We proved that there was a significant negative correlation between ITGA3 mRNA levels and promoter methylation levels through the cBioPortal database. DNA methylation is a kind of chemical modification that can change genetic performance without changing gene sequences and belongs to the epigenetic category (26). DNA methylation is an important mechanism for regulating gene expression, as well as for some genetic diseases and tumorigenesis (27). In mammals, DNA methylation occurs at CpG sites. CpG exists in two forms: one is dispersed in the DNA sequence; the other is found in a highly aggregated state, called a CpG island, which is mainly located in the promoter and 1st exon (28). In normal tissues, most of the scattered CpG is methylated. Except for locations on the inactivated X chromosome, in imprinted genes and in nonexpressing tissue-specific genes, the CpG islands of normal cells are prevented from being methylated (26, 28). The whole genome is divided into four regions: promoter, body, 3UTR and intergenic. The promoter can be subdivided into TSS200, TSS1500, 5UTR and 1st exon (29). Promoter methylation leads to gene silencing and plays a role in carcinogenesis (27, 30). Studies have shown that DNA methylation plays a key role in the development of early gastric cancer, and ITGA3 methylation is related to mixed gastric cancer (31). We verified the methylation sites of ITGA3 in BRCA through the MethSurv database, and the results showed that the cg11222053 probe located in TSS1500 had higher methylation. Furthermore, clinical stages 1, 2, 3 and 4 all showed complete methylation (β value ≥0.6). Here, we proved for the first time that ITGA3 exhibits promoter methylation in breast cancer. In summary, ITGA3 promoter methylation leads to transcriptional silencing, which may be one of the reasons for the downregulation of ITGA3 in BRCA.
Biological processes often require multiple gene interactions. To further understand the function of ITGA3, we constructed pathway enrichment of coexpressed genes, showing that coexpressed genes of ITGA3 were mainly involved in pathways in cancer, focal adhesion, cell proliferation, apoptosis, differentiation and migration, leukocyte transendothelial migration, and activation of inflammatory reactions and other processes. Previous studies have shown that ITGA3, which promotes cells to adhere to the surrounding ECM, initiates the intracellular signaling cascade, and maintains cell survival, proliferation, adhesion and migration (32). ITGA3 can promote the migration of endothelial cells (33). In addition, ITGA3 coexpression genes are involved in the pathway of leukocyte transmembrane migration. Studies have shown that α3β1 can mediate neutrophil chemotaxis through the basement membrane (34). Lerman et al. demonstrated that in addition to promoting migration, integrin α3β1 could also mediate the neutrophil inflammatory response in septicemia by cooperating with TLR2/1 and enhancing the secretion of cytokines downstream of leukocytes (35). High expression of ITGA3 is associated with lymphocyte invasiveness (36). O’Connell et al. proved that ITGA3 mediated lymphocyte adhesion and invasiveness (37). These results all indicated that ITGA3 could promote leukocyte migration and activate inflammation.
The number of TILs is a powerful prognostic factor for breast cancer patients (38, 39). However, the immune system cannot only inhibit the growth of cancer cells but also establish the conditions of the tumor microenvironment to promote tumor growth (40). Different types of immune cells inhibit or promote tumor development. On the one hand, cytotoxic T lymphocytes (CTLs) target tumor cells to exert antitumor immunity. On the other hand, other immune cells are involved in immunosuppression and immune escape. Circulating monocytes are recruited into breast tumors through chemotactic signals and then differentiate into TAMs to promote tumor growth and metastasis (41, 42). Qin et al. demonstrated that B cells suppressed T cell-dependent tumor immunity and the low immunogenicity of tumors was caused by B cells, whose presence in the priming phase results in disabled CD4 T cells that help CTL-mediated tumor immunity (43). We studied the correlation between ITGA3 and immune cell infiltration in breast cancer by immune infiltration analysis, and the results showed that ITGA3 was significantly related to B cell and macrophage infiltration. In addition, further correlation between ITGA3 and immune markers showed that ITGA3 could regulate the tumor infiltrating immune cell pattern in the tumor microenvironment of breast cancer. Our results showed that ITGA3 had a negative correlation with B cell markers (CD19 and CD79a), suggesting that the low expression of ITGA3 in BRCA might promote B cell infiltration and lead to immunosuppression. We further found that ITGA3 was negatively correlated with monocyte markers (CD86), TAM markers (CCL2 and IL10), and M2 macrophage markers (CD163 and MS4A4A), suggesting that ITGA3 could regulate the polarization of TAMs and promote tumor growth and metastasis. In addition, ITGA3 was negatively correlated with Treg markers (Foxp3 and CCR8) and T cell exhaustion markers (PDCD1, CTLA4, LAG3 and GZMB), suggesting that ITGA3 might be involved in immune escape. These results suggested that ITGA3 might regulate the infiltration of immune cells in BRCA, which would have a certain effect on the tumor microenvironment.
The tumor microenvironment (TME) includes ECM components, accessory fibroblasts, and proinflammatory cells (44). Extensive remodeling of the ECM during cancer progression causes alterations in density and composition (45). Collectively, the two important modifications within the ECM are stiffness (rigidity) and degradation, and the two processes are related to one another. The ECM is mainly produced by cancer-associated fibroblasts (CAFs). The interaction between CAFs and cancer cells determines ECM stiffness or degradation, which can produce TGF-β for ECM stiffness and matrix metalloproteinases (MMPs) for ECM degradation; both promote the proliferation, metastasis and angiogenesis of cancer cells. A stiff or rigid ECM is capable of stimulating epithelial cell transformation from normal cells to malignant cancer cells (46). Tumors, by applying physical forces through the stiffened ECM on host tissues, can displace them to enhance cell‐ECM adhesions and disrupt cell–cell junctions, leading to tumor growth and invasiveness (47, 48). In addition, ECM stiffness accelerates tumor progression by blocking the uptake and transportation of drugs into the tumor. ECM stiffness stimulates hypoxic conditions within the TME, which extend the number of leaky vasculatures within tumor microvessels. This leakage structure makes the blood sticky and increases the flow resistance, which makes it difficult for chemotherapy drugs to enter the tumor (49, 50). In addition, an increase in CSC stemness and expansion of the stem cell niche in the TME mediated by ECM stiffness hampers drug penetration into this niche (51). ECM stiffness has been used for initial screening in the diagnosis of breast cancer (45). The integrin content of the subcellular structures acts as a sensor for ECM stiffness, thereby influencing the rate of matrix rigidity (47). Highly stiffened ECM leads to subsequent degradation. Integrin signaling is significant for the formation of invadopodia. Invadopodia release MMPs to mediate ECM degradation, which allows cancer cells to obtain invasive characteristics. Integrin receptors promote ECM contents to adhere to invadopodia structures and further penetrate cancer cells from the basement membrane (52). KEGG analysis indicated that ITGA3 is involved in the MAPK signaling pathway, and ERK1/2 and JNK, which are members of the MAPK family, can induce cancer cells to generate MMPs to degrade the ECM and invade (47).
ITGA3 is as an integrin receptor that can promote the remodeling of the ECM, and changes in the ECM can stimulate integrin signaling to regulate the growth of tumor cells. In addition, ITGA3 can mediate M2 polarization and promote the stiffness of the ECM. Previous studies have shown that the α3β1 integrin-laminin-332 interaction of cancer-associated fibroblasts (CAFs) promotes and sustains the differentiation of CAFs and promotes tumor invasion (53). N Cohen et al. showed that CAF-derived Chi3 L1 mediated MAPK and PI3K signaling pathways, promoting macrophage recruitment and M2 polarization in breast tumors (54). Additionally, studies have shown that CAFs can recruit macrophages by activating the NF-κB signaling pathway (55) and then inducing TAM polarization to M2 macrophages through the PI3K/Akt (56), JAK/STAT (57), JNK (58), and Notch pathways (59). M2 macrophages secrete TGF-β, stimulating the TGF-β signaling pathway in the ECM (60) and inducing ECM deposition, which leads to stiffening of the ECM (61) (Figure 9)
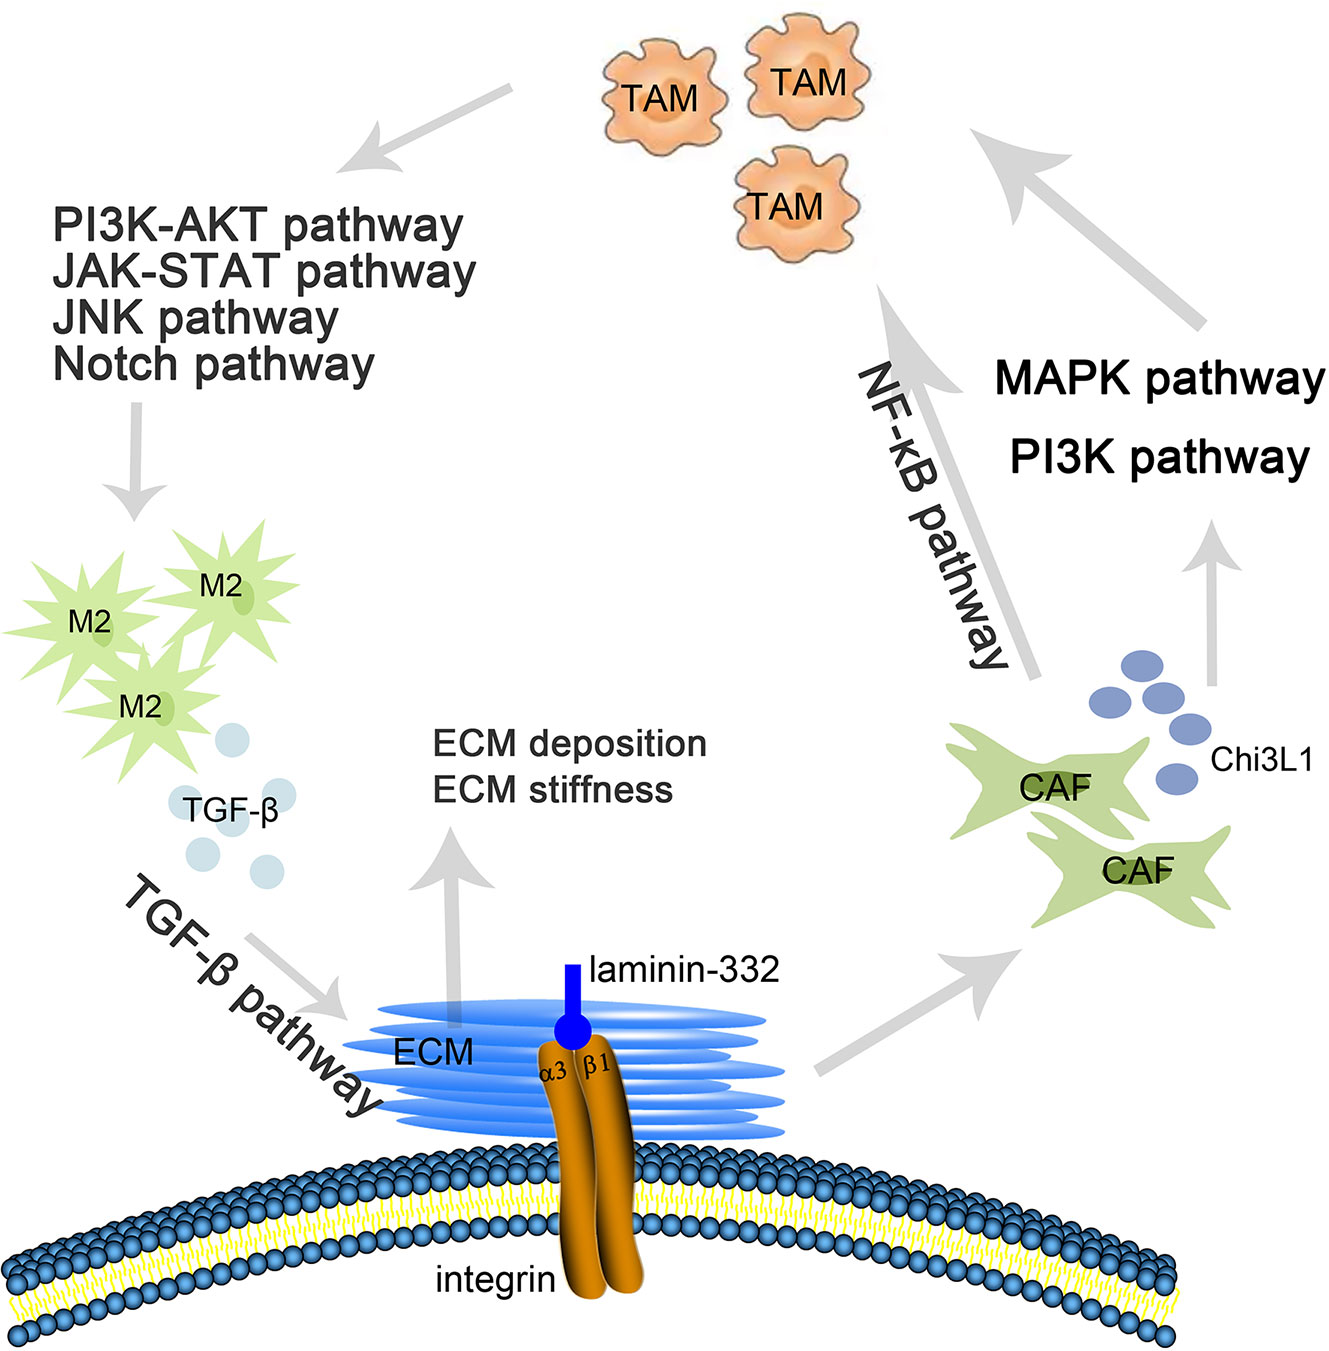
Figure 9 The role of ITGA3 in regulating ECM and TIL infiltration.
In summary, this study provided evidence for the downregulation of ITGA3 in BRCA, which differed from other types of cancers, due to promoter methylation. In addition, we found that ITGA3 had prognostic and diagnostic value for BRCA. Exploration of ITGA3-related pathways provided important clues for its regulatory mechanism in BRCA. Immunocyte infiltration analysis provides new ideas for ECM and TIL in breast cancer. These results need to be further verified by in vitro and in vivo experiments. The research in this article is expected to provide a new direction for clinical diagnosis and treatment.
Data Availability Statement
The original contributions presented in the study are included in the article/supplementary material. Further inquiries can be directed to the corresponding authors.
Author Contributions
YuL: Conceptualization. YuL and FL: methodology. YuL and XB: software. YuL and YaL: data curation. YuL and CN: resources. YuL: writing—original draft preparation. YuL and DZ: writing—review and editing. XZ and DZ: supervision. XZ: project administration. DZ: funding acquisition. All authors contributed to the article and approved the submitted version.
Funding
This study was supported by the project of National Nature Science Foundation of China (Nos. 81773076), the project of Nature Science Foundation of Tianjin (No. 19JCYBJC25600) and the basic research cooperation project of Beijing, Tianjin, and Hebei (NO. 20JCZXJC00160).
Conflict of Interest
The authors declare that the research was conducted in the absence of any commercial or financial relationships that could be construed as a potential conflict of interest.
References
1. Britt KL, Cuzick J, Phillips KA. Key Steps for Effective Breast Cancer Prevention. Nat Rev Cancer (2020) 20(8):417–36. doi: 10.1038/s41568-020-0266-x
2. Huang Y, Tong Z, Chen K, Wang Y, Liu P, Gu L, et al. Interpretation of Breast Cancer Screening Guideline for Chinese Women. Cancer Biol Med (2019) 16(4):825–35. doi: 10.20892/j.issn.2095-3941.2019.0322
3. Liang Y, Zhang H, Song X, Yang Q. Metastatic Heterogeneity of Breast Cancer: Molecular Mechanism and Potential Therapeutic Targets. Semin Cancer Biol (2020) 60:14–27. doi: 10.1016/j.semcancer.2019.08.012
4. Zhao J, Zhang H, Lei T, Liu J, Zhang S, Wu N, et al. Drug Resistance Gene Expression and Chemotherapy Sensitivity Detection in Chinese Women With Different Molecular Subtypes of Breast Cancer. Cancer Biol Med (2020) 17(4):1014–25. doi: 10.20892/j.issn.2095-3941.2020.0157
5. Emens LA. Breast Cancer Immunotherapy: Facts and Hopes. Clin Cancer Res (2018) 24(3):511–20. doi: 10.1158/1078-0432.CCR-16-3001
6. Barczyk M, Carracedo S, Gullberg D. Integrins. Cell Tissue Res (2010) 339(1):269–80. doi: 10.1007/s00441-009-0834-6
7. Jiao Y, Li Y, Liu S, Chen Q, Liu Y. Itga3 Serves as a Diagnostic and Prognostic Biomarker for Pancreatic Cancer. Onco Targets Ther (2019) 12:4141–52. doi: 10.2147/OTT.S201675
8. Koshizuka K, Hanazawa T, Kikkawa N, Arai T, Okato A, Kurozumi A, et al. Regulation of ITGA3 by the Anti-Tumor Mir-199 Family Inhibits Cancer Cell Migration and Invasion in Head and Neck Cancer. Cancer Sci (2017) 108(8):1681–92. doi: 10.1111/cas.13298
9. Kurokawa A, Nagata M, Kitamura N, Noman AA, Ohnishi M, Ohyama T, et al. Diagnostic Value of Integrin Alpha3, Beta4, and Beta5 Gene Expression Levels for the Clinical Outcome of Tongue Squamous Cell Carcinoma. Cancer (2008) 112(6):1272–81. doi: 10.1002/cncr.23295
10. Rhodes DR, Yu J, Shanker K, Deshpande N, Varambally R, Ghosh D, et al. Oncomine: A Cancer Microarray Database and Integrated Data-Mining Platform. Neoplasia (2004) 6(1):1–6. doi: 10.1016/S1476-5586(04)80047-2
11. Li T, Fan J, Wang B, Traugh N, Chen Q, Liu JS, et al. Timer: A Web Server for Comprehensive Analysis of Tumor-Infiltrating Immune Cells. Cancer Res (2017) 77(21):e108–e10. doi: 10.1158/0008-5472.CAN-17-0307
12. Uhlen M, Fagerberg L, Hallstrom BM, Lindskog C, Oksvold P, Mardinoglu A, et al. Proteomics. Tissue-Based Map of the Human Proteome. Science (2015) 347(6220):1260419. doi: 10.1126/science.1260419
13. Chandrashekar DS, Bashel B, Balasubramanya SAH, Creighton CJ, Ponce-Rodriguez I, Chakravarthi B, et al. Ualcan: A Portal for Facilitating Tumor Subgroup Gene Expression and Survival Analyses. Neoplasia (2017) 19(8):649–58. doi: 10.1016/j.neo.2017.05.002
14. Mizuno H, Kitada K, Nakai K, Sarai A. Prognoscan: A New Database for Meta-Analysis of the Prognostic Value of Genes. BMC Med Genomics (2009) 2:18. doi: 10.1186/1755-8794-2-18
15. Tang Z, Li C, Kang B, Gao G, Li C, Zhang Z. Gepia: A Web Server for Cancer and Normal Gene Expression Profiling and Interactive Analyses. Nucleic Acids Res (2017) 45(W1):W98–W102. doi: 10.1093/nar/gkx247
16. Gyorffy B, Lanczky A, Eklund AC, Denkert C, Budczies J, Li Q, et al. An Online Survival Analysis Tool to Rapidly Assess the Effect of 22,277 Genes on Breast Cancer Prognosis Using Microarray Data of 1,809 Patients. Breast Cancer Res Treat (2010) 123(3):725–31. doi: 10.1007/s10549-009-0674-9
17. Pak K, Oh SO, Goh TS, Heo HJ, Han ME, Jeong DC, et al. A User-Friendly, Web-Based Integrative Tool (Esurv) for Survival Analysis: Development and Validation Study. J Med Internet Res (2020) 22(5):e16084. doi: 10.2196/16084
18. Cerami E, Gao J, Dogrusoz U, Gross BE, Sumer SO, Aksoy BA, et al. The Cbio Cancer Genomics Portal: An Open Platform for Exploring Multidimensional Cancer Genomics Data. Cancer Discovery (2012) 2(5):401–4. doi: 10.1158/2159-8290.CD-12-0095
19. Modhukur V, Iljasenko T, Metsalu T, Lokk K, Laisk-Podar T, Vilo J. Methsurv: A Web Tool to Perform Multivariable Survival Analysis Using Dna Methylation Data. Epigenomics (2018) 10(3):277–88. doi: 10.2217/epi-2017-0118
20. Zhou G, Soufan O, Ewald J, Hancock REW, Basu N, Xia J. Networkanalyst 3.0: A Visual Analytics Platform for Comprehensive Gene Expression Profiling and Meta-Analysis. Nucleic Acids Res (2019) 47(W1):W234–41. doi: 10.1093/nar/gkz240
21. Vasaikar SV, Straub P, Wang J, Zhang B. Linkedomics: Analyzing Multi-Omics Data Within and Across 32 Cancer Types. Nucleic Acids Res (2018) 46(D1):D956–D63. doi: 10.1093/nar/gkx1090
22. Zhou Y, Zhou B, Pache L, Chang M, Khodabakhshi AH, Tanaseichuk O, et al. Metascape Provides a Biologist-Oriented Resource for the Analysis of Systems-Level Datasets. Nat Commun (2019) 10(1):1523. doi: 10.1038/s41467-019-09234-6
23. Barroso-Sousa R, Jain E, Cohen O, Kim D, Buendia-Buendia J, Winer E, et al. Prevalence and Mutational Determinants of High Tumor Mutation Burden in Breast Cancer. Ann Oncol (2020) 31(3):387–94. doi: 10.1016/j.annonc.2019.11.010
24. Sousa S, Maatta J. The Role of Tumour-Associated Macrophages in Bone Metastasis. J Bone Oncol (2016) 5(3):135–8. doi: 10.1016/j.jbo.2016.03.004
25. Danaher P, Warren S, Dennis L, D’Amico L, White A, Disis ML, et al. Gene Expression Markers of Tumor Infiltrating Leukocytes. J Immunother Cancer (2017) 5:18. doi: 10.1186/s40425-017-0215-8
26. Jones PA, Baylin SB. The Epigenomics of Cancer. Cell (2007) 128(4):683–92. doi: 10.1016/j.cell.2007.01.029
27. Herman JG, Baylin SB. Gene Silencing in Cancer in Association With Promoter Hypermethylation. N Engl J Med (2003) 349(21):2042–54. doi: 10.1056/NEJMra023075
28. Costello JF, Fruhwald MC, Smiraglia DJ, Rush LJ, Robertson GP, Gao X, et al. Aberrant Cpg-Island Methylation Has non-Random and Tumour-Type-Specific Patterns. Nat Genet (2000) 24(2):132–8. doi: 10.1038/72785
29. Sandoval J, Heyn H, Moran S, Serra-Musach J, Pujana MA, Bibikova M, et al. Validation of a DNA Methylation Microarray for 450,000 Cpg Sites in the Human Genome. Epigenetics (2011) 6(6):692–702. doi: 10.4161/epi.6.6.16196
30. Fang F, Turcan S, Rimner A, Kaufman A, Giri D, Morris LG, et al. Breast Cancer Methylomes Establish an Epigenomic Foundation for Metastasis. Sci Transl Med (2011) 3(75):75ra25. doi: 10.1126/scitranslmed.3001875
31. Chong Y, Mia-Jan K, Ryu H, Abdul-Ghafar J, Munkhdelger J, Lkhagvadorj S, et al. Dna Methylation Status of a Distinctively Different Subset of Genes is Associated With Each Histologic Lauren Classification Subtype in Early Gastric Carcinogenesis. Oncol Rep (2014) 31(6):2535–44. doi: 10.3892/or.2014.3133
32. Guo W, Giancotti FG. Integrin Signalling During Tumour Progression. Nat Rev Mol Cell Biol (2004) 5(10):816–26. doi: 10.1038/nrm1490
33. Mitchell K, Svenson KB, Longmate WM, Gkirtzimanaki K, Sadej R, Wang X, et al. Suppression of Integrin Alpha3beta1 in Breast Cancer Cells Reduces Cyclooxygenase-2 Gene Expression and Inhibits Tumorigenesis, Invasion, and Cross-Talk to Endothelial Cells. Cancer Res (2010) 70(15):6359–67. doi: 10.1158/0008-5472.CAN-09-4283
34. Hyun YM, Sumagin R, Sarangi PP, Lomakina E, Overstreet MG, Baker CM, et al. Uropod Elongation is a Common Final Step in Leukocyte Extravasation Through Inflamed Vessels. J Exp Med (2012) 209(7):1349–62. doi: 10.1084/jem.20111426
35. Lerman YV, Lim K, Hyun YM, Falkner KL, Yang H, Pietropaoli AP, et al. Sepsis Lethality Via Exacerbated Tissue Infiltration and TLR-Induced Cytokine Production by Neutrophils is Integrin Alpha3beta1-Dependent. Blood (2014) 124(24):3515–23. doi: 10.1182/blood-2014-01-552943
36. Kryczek I, Banerjee M, Cheng P, Vatan L, Szeliga W, Wei S, et al. Phenotype, Distribution, Generation, and Functional and Clinical Relevance of Th17 Cells in the Human Tumor Environments. Blood (2009) 114(6):1141–9. doi: 10.1182/blood-2009-03-208249
37. O’Connell GC, Treadway MB, Petrone AB, Tennant CS, Lucke-Wold N, Chantler PD, et al. Peripheral Blood Akap7 Expression as an Early Marker for Lymphocyte-Mediated Post-Stroke Blood Brain Barrier Disruption. Sci Rep (2017) 7(1):1172. doi: 10.1038/s41598-017-01178-5
38. Cao L, Niu Y. Triple Negative Breast Cancer: Special Histological Types and Emerging Therapeutic Methods. Cancer Biol Med (2020) 17(2):293–306. doi: 10.20892/j.issn.2095-3941.2019.0465
39. Savas P, Virassamy B, Ye C, Salim A, Mintoff CP, Caramia F, et al. Single-Cell Profiling of Breast Cancer T Cells Reveals a Tissue-Resident Memory Subset Associated With Improved Prognosis. Nat Med (2018) 24(7):986–93. doi: 10.1038/s41591-018-0078-7
40. Schreiber RD, Old LJ, Smyth MJ. Cancer Immunoediting: Integrating Immunity’s Roles in Cancer Suppression and Promotion. Science (2011) 331(6024):1565–70. doi: 10.1126/science.1203486
41. Shi C, Pamer EG. Monocyte Recruitment During Infection and Inflammation. Nat Rev Immunol (2011) 11(11):762–74. doi: 10.1038/nri3070
42. Cassetta L, Fragkogianni S, Sims AH, Swierczak A, Forrester LM, Zhang H, et al. Human Tumor-Associated Macrophage and Monocyte Transcriptional Landscapes Reveal Cancer-Specific Reprogramming, Biomarkers, and Therapeutic Targets. Cancer Cell (2019) 35(4):588–602.e10. doi: 10.1016/j.ccell.2019.02.009
43. Qin Z, Richter G, Schuler T, Ibe S, Cao X, Blankenstein T. B Cells Inhibit Induction of T Cell-Dependent Tumor Immunity. Nat Med (1998) 4(5):627–30. doi: 10.1038/nm0598-627
44. Taddei ML, Giannoni E, Comito G, Chiarugi P. Microenvironment and Tumor Cell Plasticity: An Easy Way Out. Cancer Lett (2013) 341(1):80–96. doi: 10.1016/j.canlet.2013.01.042
45. Chaudhuri O, Koshy ST, Branco da Cunha C, Shin JW, Verbeke CS, Allison KH, et al. Extracellular Matrix Stiffness and Composition Jointly Regulate the Induction of Malignant Phenotypes in Mammary Epithelium. Nat Mater (2014) 13(10):970–8. doi: 10.1038/nmat4009
46. Katara GK, Kulshrestha A, Mao L, Wang X, Sahoo M, Ibrahim S, et al. Mammary Epithelium-Specific Inactivation of V-Atpase Reduces Stiffness of Extracellular Matrix and Enhances Metastasis of Breast Cancer. Mol Oncol (2018) 12(2):208–23. doi: 10.1002/1878-0261.12159
47. Najafi M, Farhood B, Mortezaee K. Extracellular Matrix (Ecm) Stiffness and Degradation as Cancer Drivers. J Cell Biochem (2019) 120(3):2782–90. doi: 10.1002/jcb.27681
48. Grasset EM, Bertero T, Bozec A, Friard J, Bourget I, Pisano S, et al. Matrix Stiffening and EGFR Cooperate to Promote the Collective Invasion of Cancer Cells. Cancer Res (2018) 78(18):5229–42. doi: 10.1158/0008-5472.CAN-18-0601
49. Qiao Y, Wan J, Zhou L, Ma W, Yang Y, Luo W, et al. Stimuli-Responsive Nanotherapeutics for Precision Drug Delivery and Cancer Therapy. Wiley Interdiscip Rev Nanomed Nanobiotechnol (2019) 11(1):e1527. doi: 10.1002/wnan.1527
50. Ahirwar DK, Nasser MW, Ouseph MM, Elbaz M, Cuitino MC, Kladney RD, et al. Fibroblast-Derived CXCL12 Promotes Breast Cancer Metastasis by Facilitating Tumor Cell Intravasation. Oncogene (2018) 37(32):4428–42. doi: 10.1038/s41388-018-0263-7
51. Yu Q, Xue Y, Liu J, Xi Z, Li Z, Liu Y. Fibronectin Promotes the Malignancy of Glioma Stem-Like Cells Via Modulation of Cell Adhesion, Differentiation, Proliferation and Chemoresistance. Front Mol Neurosci (2018) 11:130. doi: 10.3389/fnmol.2018.00130
52. Martin-Villar E, Borda-d’Agua B, Carrasco-Ramirez P, Renart J, Parsons M, Quintanilla M, et al. Podoplanin Mediates Ecm Degradation by Squamous Carcinoma Cells Through Control of Invadopodia Stability. Oncogene (2015) 34(34):4531–44. doi: 10.1038/onc.2014.388
53. Cavaco ACM, Rezaei M, Caliandro MF, Lima AM, Stehling M, Dhayat SA, et al. The Interaction Between Laminin-332 and Alpha3beta1 Integrin Determines Differentiation and Maintenance of Cafs, and Supports Invasion of Pancreatic Duct Adenocarcinoma Cells. Cancers (Basel) (2018) 11(1):14. doi: 10.3390/cancers11010014
54. Cohen N, Shani O, Raz Y, Sharon Y, Hoffman D, Abramovitz L, et al. Fibroblasts Drive an Immunosuppressive and Growth-Promoting Microenvironment in Breast Cancer Via Secretion of Chitinase 3-Like 1. Oncogene (2017) 36(31):4457–68. doi: 10.1038/onc.2017.65
55. Erez N, Truitt M, Olson P, Arron ST, Hanahan D. Cancer-Associated Fibroblasts are Activated in Incipient Neoplasia to Orchestrate Tumor-Promoting Inflammation in an NF-Kappab-Dependent Manner. Cancer Cell (2010) 17(2):135–47. doi: 10.1016/j.ccr.2009.12.041
56. Vergadi E, Ieronymaki E, Lyroni K, Vaporidi K, Tsatsanis C. Akt Signaling Pathway in Macrophage Activation and M1/M2 Polarization. J Immunol (2017) 198(3):1006–14. doi: 10.4049/jimmunol.1601515
57. Qin H, Yeh WI, De Sarno P, Holdbrooks AT, Liu Y, Muldowney MT, et al. Signal Transducer and Activator of Transcription-3/Suppressor of Cytokine Signaling-3 (Stat3/Socs3) Axis in Myeloid Cells Regulates Neuroinflammation. Proc Natl Acad Sci U S A (2012) 109(13):5004–9. doi: 10.1073/pnas.1117218109
58. Hao J, Hu Y, Li Y, Zhou Q, Lv X. Involvement of JNK Signaling in IL4-Induced M2 Macrophage Polarization. Exp Cell Res (2017) 357(2):155–62. doi: 10.1016/j.yexcr.2017.05.010
59. Lin Y, Zhao JL, Zheng QJ, Jiang X, Tian J, Liang SQ, et al. Notch Signaling Modulates Macrophage Polarization and Phagocytosis Through Direct Suppression of Signal Regulatory Protein Alpha Expression. Front Immunol (2018) 9:1744. doi: 10.3389/fimmu.2018.01744
60. Acerbi I, Cassereau L, Dean I, Shi Q, Au A, Park C, et al. Human Breast Cancer Invasion and Aggression Correlates With Ecm Stiffening and Immune Cell Infiltration. Integr Biol (Camb) (2015) 7(10):1120–34. doi: 10.1039/c5ib00040h
Keywords: ITGA3, breast cancer, methylation, extracellular matrix, tumor infiltrating lymphocyte, prognosis, diagnosis
Citation: Li Y, Li F, Bai X, Li Y, Ni C, Zhao X and Zhang D (2021) ITGA3 Is Associated With Immune Cell Infiltration and Serves as a Favorable Prognostic Biomarker for Breast Cancer. Front. Oncol. 11:658547. doi: 10.3389/fonc.2021.658547
Received: 26 January 2021; Accepted: 21 April 2021;
Published: 20 May 2021.
Edited by:
Yi-Zhou Jiang, Fudan University, ChinaReviewed by:
Yunlong Yang, Fudan University, ChinaYun Hak Kim, Pusan National University, South Korea
Copyright © 2021 Li, Li, Bai, Li, Ni, Zhao and Zhang. This is an open-access article distributed under the terms of the Creative Commons Attribution License (CC BY). The use, distribution or reproduction in other forums is permitted, provided the original author(s) and the copyright owner(s) are credited and that the original publication in this journal is cited, in accordance with accepted academic practice. No use, distribution or reproduction is permitted which does not comply with these terms.
*Correspondence: Danfang Zhang, emhhbmdkZkB0bXUuZWR1LmNu
Xiulan Zhao, emhhb3hpdWxhbkB0bXUuZWR1LmNu
†These authors have contributed equally to this work and share first authorship