 Hua Chen1,2Yan Shao1,2Xiaohua Gu2Zhijie Zheng2Hao Wang1,2Hengle Gu2Yanhua Duan2Aihui Feng2Ying Huang2Wutian Gan3Chongyang Chen1*
 Zhiyong Xu2*
- 1Institute of Modern Physics, Fudan Univerisity, Shanghai, China
- 2Shanghai Chest Hospital, Shanghai Jiaotong University, Shanghai, China
- 3School of Physical Science and Technology, Wuhan University, Wuhan, China
Background and Purpose: This article retrospectively characterized the geometric and dosimetric changes in target and normal tissues during radiotherapy for lung cancer patients with atelectasis.
Materials and Methods: A total of 270 cone beam computed tomography (CBCT) scans of 18 lung patients with atelectasis were collected. The degree and time of resolution or expansion of the atelectasis were recorded. The geometric, dosimetric, and biological changes in the target and lung tissue were also quantified.
Results: There were two patients with expansion, four patients with complete regression, six patients with partial regression, and six patients with no change. The time of resolution or expansion varied. The tumor volume increased by 3.8% in the first seven fractions, then decreased from the 9th fraction, and by 33.4% at the last CBCT. In the LR direction, the average center of mass (COM), boundaries of the tumors gradually shifted mediastinally. In the AP direction, the COM of the tumors was shifted slightly in the posterior direction and then gradually shifted to the anterior direction; the boundaries of the tumors all moved mediastinally. In the SI direction, the COM of the tumors on the right side of the body was substantially shifted toward the head direction. The boundaries of the tumors varied greatly. D2, D98, Dmean, V95, V107, and TCP of the PTV were reduced during radiotherapy and were reduced to their lowest values during the last two fractions. The volume of the ipsilateral lung tended to increase gradually. The V5, V10, V20, V30, V40, and NTCP of the total lung gradually increased with the fraction.
Conclusions: For most patients, regression of the atelectasis occurred, and the volume of the ipsilateral lung tended to increase while the tumor volume decreased, and the COM and boundary of the tumors shifted toward mediastinum, which caused an insufficient dose to the target and an overdose to the lungs. Regression or expansion may occur for any fraction, and it is therefore recommended that CBCT be performed at least every other day.
Introduction
Lung cancer is one of the most common malignant cancers, with high rates of morbidity and mortality around the world, and non-small cell lung cancer makes up the majority of lung cancer cases (1, 2). Some studies have indicated a 10–40% incidence of atelectasis being present at the beginning of lung cancer radiotherapy treatment (3–7). Atelectasis is a primary malignant change of the bronchial mucosa epithelium, which forms a polypoid mass in the lumen, blocking the lumen directly or indirectly by compression of external lesions, resulting in a reduction in lung capacity, thus inducing atelectasis. Atelectasis often occurs in central lung cancer (8–10).
The regression or progression of lung tumors during radiotherapy may lead to the regression or expansion of atelectasis, and this anatomical change will cause deviations in the tumor location and dosimetric changes not reflected in the planning CT (3–6, 11–13), which cannot be solved by increasing the safety margin (14, 15) so a more individualized adaptive strategy is needed. Additionally, the dose to the target volume and the normal tissue are also altered, so the introduction of image-guided radiotherapy technology is very important for lung cancer patients with atelectasis (16, 17).
At present, there are few reports on atelectasis during radiotherapy course. Nathan Tennyson et al. studied the variation in atelectasis volumes and the effect of atelectasis volume changes on the primary tumor position during radiation therapy (12), but the dosimetric effects on the target volume or surrounding organs were not considered. Some data showed that the changes in the mass and density of atelectasis during radiotherapy could also cause dosimetric effects on the normal tissue structure (11). Moller et al. (5), based on weekly cone beam computed tomography (CBCT), found that 70% of 24 patients with atelectasis need adaptive radiotherapy due to geometric shifts and/or dosimetric changes of the tumor caused by atelectasis and that atelectasis appeared/disappeared in 22% of the patients at the first treatment. The above studies provide important data about the changes of atelectasis volumes and the effect on the geometric and dosimetric changes to the tumor and surrounding normal tissues during radiotherapy. However, the geometric (volume and location) changes in the tumor and lung tissue caused by the regression or expansion of atelectasis during radiotherapy have not been well defined, and the dosimetric effect of the target and lung has not been clarified.
In this paper, we studied lung cancer patients with atelectasis who underwent CBCT before radiotherapy to evaluate the regularity of geometric and dosimetric changes in the target volume and lung tissue during radiotherapy and to perform preliminary clinical data analysis for a study of adaptive radiotherapy in patients with atelectasis.
Methods and Materials
Patient Information
Twenty-five patients with lung cancer stages IIA to IIIB who were treated with thoracic radiotherapy between January 2019 and December 2019 at our center were included in this study. All patients were found to have atelectasis before radiotherapy. Among them, five patients had to be excluded due to early termination of radiotherapy, and two patients were excluded because of incomplete data. A total of 18 patients were included in this study. The patient characteristics are shown in Table 1.
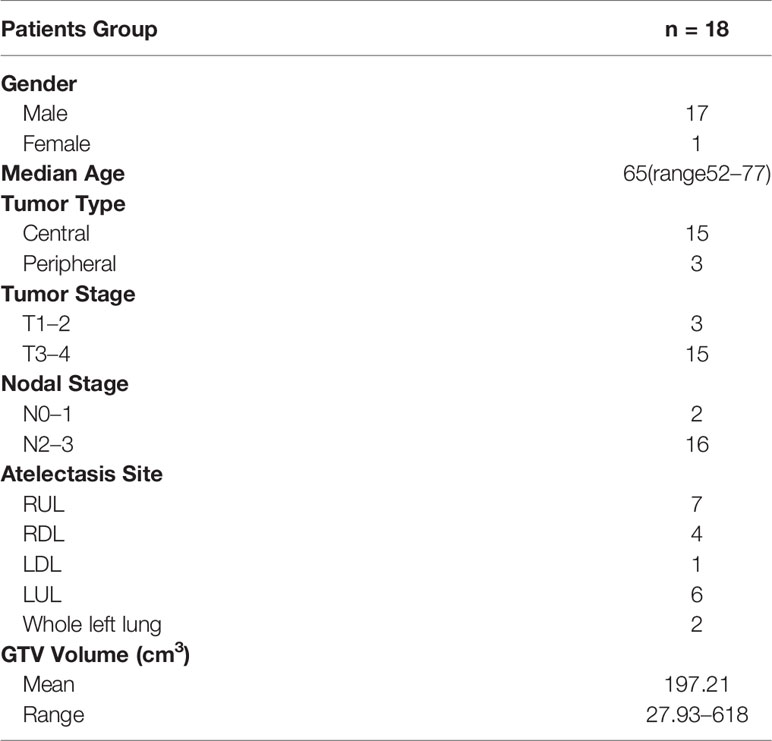
Table 1 Patient characteristics.
Contouring and Treatment Planning
Patient simulation occurred after the patient was immobilized with a thermoplastic mask or vacuum cushion in the supine position. CT scans were performed using a Siemens Somatom Definition AS CT Scanner System (Siemens Healthcare, Erlangen, Germany) under free breathing conditions. The patient was scanned from cervical vertebrae C3 to the lower edge of the liver, including the entire lung, with a slice thickness of 3 mm. The CT data of each patient were transferred to the Pinnacle3 treatment planning system v9.10 (Philips Healthy, Fitchburg, WI).
The target volumes and organs at risk (OARs) of each patient were delineated on the Pinnacle3 treatment planning system. The gross tumor volume (GTV) included both the primary tumor and pathologically proven lymph nodes. When available, contrast-enhanced CT scans and 18-FDG positron emission tomography (PET)-CT scans were used to distinguish GTV from atelectasis during contouring. The planning target volume (PTV) expanded an isotropic 5 mm margin on GTV to account for set-up uncertainties and respiratory motion. All contours for the tumors were peer reviewed to ensure accuracy and reproducibility. OARs included the total lung, bronchi, spinal cord, and heart. Total lung was defined as the lung volume minus the GTV.
Treatment plans were performed on the Pinnacle treatment planning system with four to eight 6 MV photon beams, and the dose was delivered using a Synergy linear accelerator (Elekta, Crawley, UK), which had an MLCi2 with 80 leaves. A total of 60 Gy in 30 fractions was prescribed for PTV. The optimization goals were to deliver the prescription dose to at least 95% of the PTV.
CBCT Scans and CT Scans
CBCT scans were performed for every two fractions for each patient, and a total of 15 CBCT scans were obtained at the end of radiotherapy. A rigid registration was performed online based on the bony anatomy of the spine visible on the initial planning CT scan to correct for daily setup errors at each treatment fraction. If obvious visible regression or expansion of the atelectasis was found, a 3D-CT scan and a contrast-enhanced CT scan were performed, and then dosimetric evaluation was performed to create adaptive treatment plans if needed. The patients underwent a median of three CT scans (including conventional CT scans and contrast-enhanced CT scans) ranging from two to four during the radiation therapy.
The geometric and dosimetric changes of each CBCT image relative to the planning CT were assessed offline. All CBCT and CT scans were transferred to commercial radiation oncology software MIM (MIM Maestro v6.6.4, Cleveland, OH, USA), and rigid registration was performed with the planning CT based on the bony anatomy of the spine. The tumor, atelectasis, and ipsilateral lung were contoured with lung and soft tissue windows in each CBCT image. All contours were drawn by an experienced radiation oncologist and reviewed by another radiation oncologist for accuracy and consistency.
To evaluate the geometric change of atelectasis (regression or expansion) and its effect on the tumor and volume, center of mass (COM) and boundary shift changes of the tumor were recorded, and the volume changes of the ipsilateral lung were also noted. The fraction number of atelectasis regressions or progression was also recorded. The boundary change is defined as the six border position changes compared with the initial planning CT scan and calculated in the left–right (LR), anterior–posterior (AP), and superior–inferior (SI) directions.
As the resolution of CBCT images is limited, only a change in volume of more than 10% is considered significant. Compared to the planning CT, if the atelectasis volume reduction on CBCT was less than 10%, it was labeled as no regression; if a decrease in volume was between 10 and 90%, it was labeled as partial regression; if the reduction was more than 90%, it was labeled as complete regression; if the increased atelectasis volume was more than 10%, it was labeled as expansion.
Dosimetric Evaluation
The regression or expansion of atelectasis may change the density, size, and anatomical position of the lung tissue and the anatomical position of the tumor during the treatment course, which will lead to insufficient target coverage or an overdose to the lung tissue. The dosimetric change was evaluated between the CBCT/CT scan and the planning CT scan.
The contours of the tumor and ipsilateral lung were drawn on the CBCT scans, and then the structures were cropped to the initial planning CT scan. The Hounsfield unit (HU) of the lung with density changes was set to lung (HU = −738 corresponding to 0.26 g/cm3) or water (HU = 0) on the planning CT scan according to whether the density change of the lung structure disappeared or reappeared on the CBCT image (5). We assumed that the contralateral lung volume remained constant during treatment; therefore, the total lung volume was defined as the new ipsilateral lung volume plus the contralateral lung volume, which was drawn on the initial planning CT scan. The dose was recalculated at the planning CT with alteration of the HU.
For the CT scans, the contours of the tumor and ipsilateral and contralateral lungs were drawn. The dose was recalculated based on the CT scan instead of the planning CT scan.
The dose distribution obtained from the altered CT scan was compared with the planned dose distribution of the planning CT scan. The dosimetric evaluation parameters included D2, D98, Dmean, V95, and V107 of the PTV and V5, V10, V20, V30, and V40 of the total lung.
Biological Evaluation
The tumor control probability (TCP) of the PTV and normal tissue complication probability (NTCP) of total lung were calculated. Both the TCP and NTCP calculations were performed on MATLAB R2019a (The MathWorks Inc., MA, USA). Based on the following equations (18), the TCP were calculated as follows:
where TCD50 was the tumor dose required to produce a 50% TCP, γ50 was the change in TCP expected because of a 1% change in TCD50. Di was a uniform dose of partial volume Vi (19). The values of TCD50, γ50 and α were 51.24 Gy, 0.83 and 0.30, respectively.
The NTCP was calculated basing on the Lyman–Kutcher–Burman model (20). The equations were as follows:
For pneumonia, the TD50, n and m published by Semenko (21) were 29.9 Gy, 1 and 0.41, respectively.
Statistical Analysis
All of the parameters are reported as the mean ± standard deviation. The statistical analysis was performed using SPSS Statistics v22.0 software (IBM Corp., Armonk, NY, USA). A paired, two-sided Wilcoxon signed-rank test was used to evaluate the differences in volume, COM, boundary shifts of the tumor, volume of the ipsilateral lung, dosimetric parameters of the PTV, and total lung between the CBCT/CT scans and the planning CT scan. Statistical results were considered statistically significant at p <0.05.
Results
The degree and fraction number of atelectasis regressions or expansions that occurred during radiotherapy were recorded. Four of the 18 patients had complete regression during radiotherapy, two patients had progression, six patients had partial regression and were not fully regressed at the end of radiotherapy, and the remaining six had almost no change. As shown in Figure 1, the time of regression or expansion varied for each patient. Thus, the results of the analysis of the 270 CBCT images acquired in this study showed that in addition to two patients with atelectasis progression and four patients with no change, the remaining twelve patients with atelectasis underwent regression.
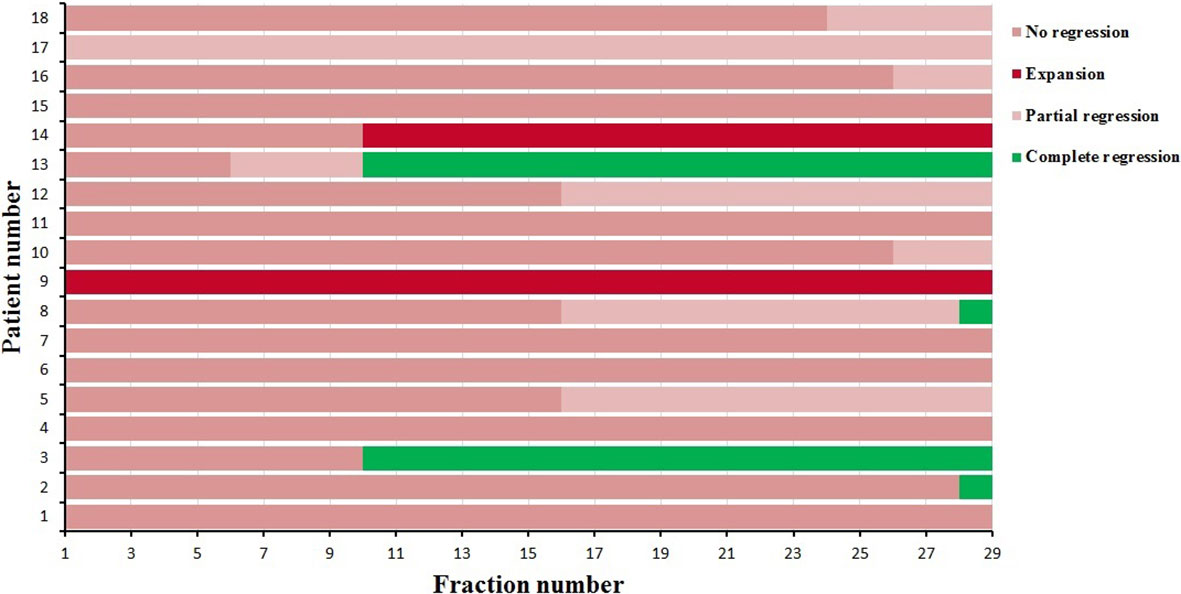
Figure 1 The degree and time atelectasis regression or expansion for 18 patients during radiotherapy.
The Volume Changes of the GTV
The initial mean volume of the GTV was 197.29 cm3 (27.93–618 cm3). During the treatment course, the volume of the GTV increased slowly in the first seven fractions and gradually decreased from the ninth fraction (see Table 2).
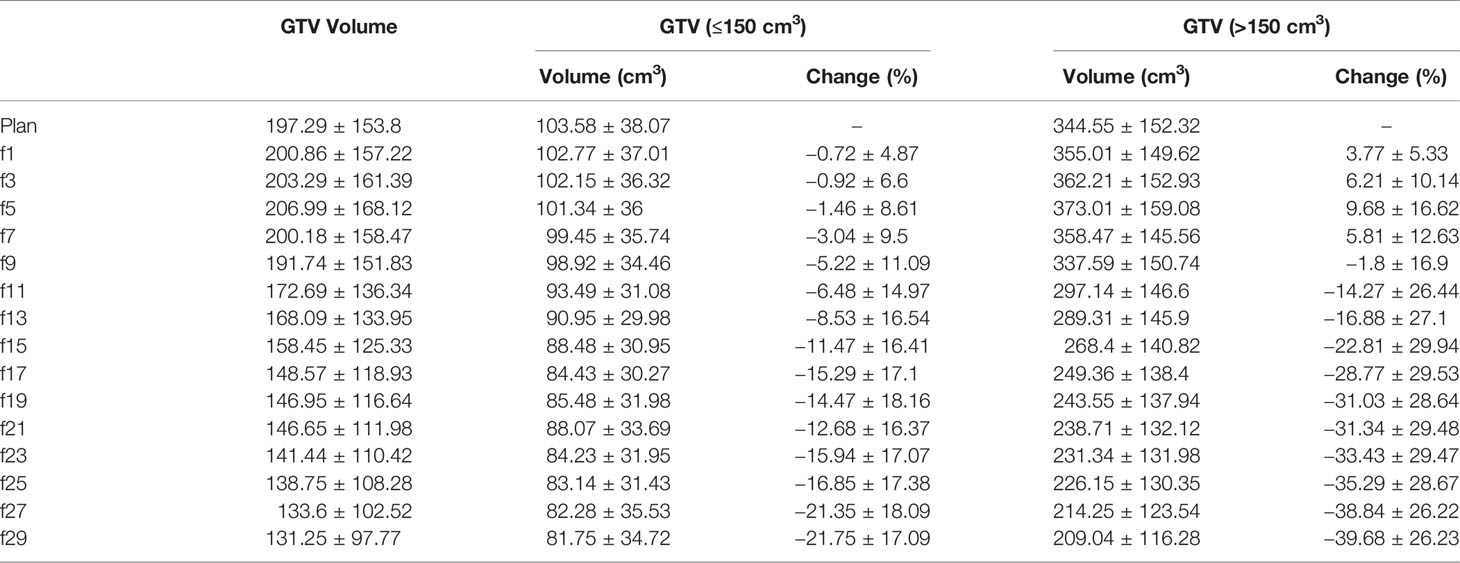
Table 2 The volume changes of GTV.
For the eleven patients with an initial GTV volume less than 150 cm3, the mean GTV volume tended to gradually decrease during the course of radiotherapy, reaching a 5.22% reduction in GTV volume at the 7th fraction and a 21.75% reduction in GTV volume at the end of treatment. As shown in Figure 2A, the GTV volume continued to decrease in five patients and became larger in one patient, but in five patients, the GTV volume first gradually increased and then slowly decreased.
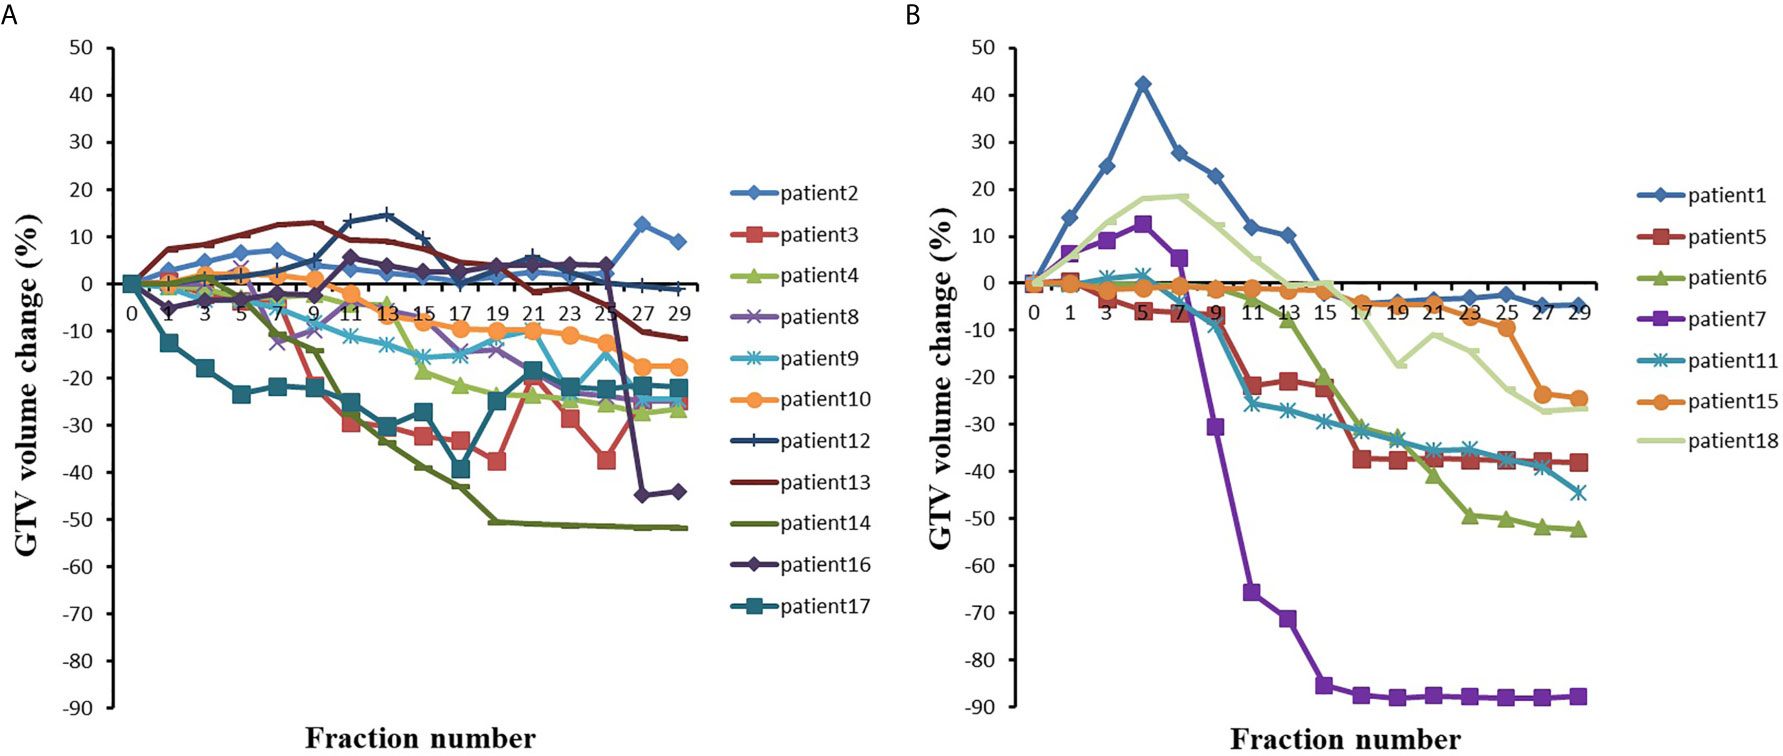
Figure 2 The GTV volumes changes with the fraction for (A) 11 patients with initial GTV volume less than 150 cm3 and (B) 7 patients with initial GTV volume greater than 150 cm3.
For the seven patients with an initial GTV volume greater than 150 cm3, the mean GTV volume gradually increased to 5.81% during the first seven fractions and began to decrease by the 9th fraction, and the mean GTV volume had decreased by 39.68% at the end of radiotherapy. In three of these seven patients, the GTV volume gradually increased during the first seven fractions (see Figure 2) and essentially decreased from the ninth fraction. The remaining four patients showed a gradual decrease in the GTV.
As shown in Figure 2 and Table 2, the GTV volume changed greatly during radiotherapy, regardless of whether the volume decreased or increased. Most of these changes were caused by atelectasis regression or expansion. If change of GTV volume was large, the collected CBCT image and the original CT may not be registered, which indicated the necessity of adaptive radiotherapy.
The COM Changes of the GTV
The COM of the GTV was located on the right side of the body in nine of the 18 patients, and the COM of the GTV was located on the left side of the body in nine of the patients.
In the LR direction, the mean COM of the GTV on the right side of the body was not shifted more than 0.5 cm during the treatment course (see Table 3). The COM was shifted slightly to the right during the first few treatment fractions and then gradually shifted to the left (i.e., toward the mediastinal direction). The COM of the GTV on the left side of the body was gradually shifted to the right (mediastinal direction), and the shift exceeded 0.5 cm at the 11th treatment fraction and reached the maximum average shift (1 cm) at the 27th treatment fraction. In general, the COM of the GTVs gradually shifted toward the mediastinum, as shown in Figure 3, and the COM shifts of the GTV on the right side of the body were much smaller than those of the GTV on the left side of the body throughout the entire radiotherapy process.
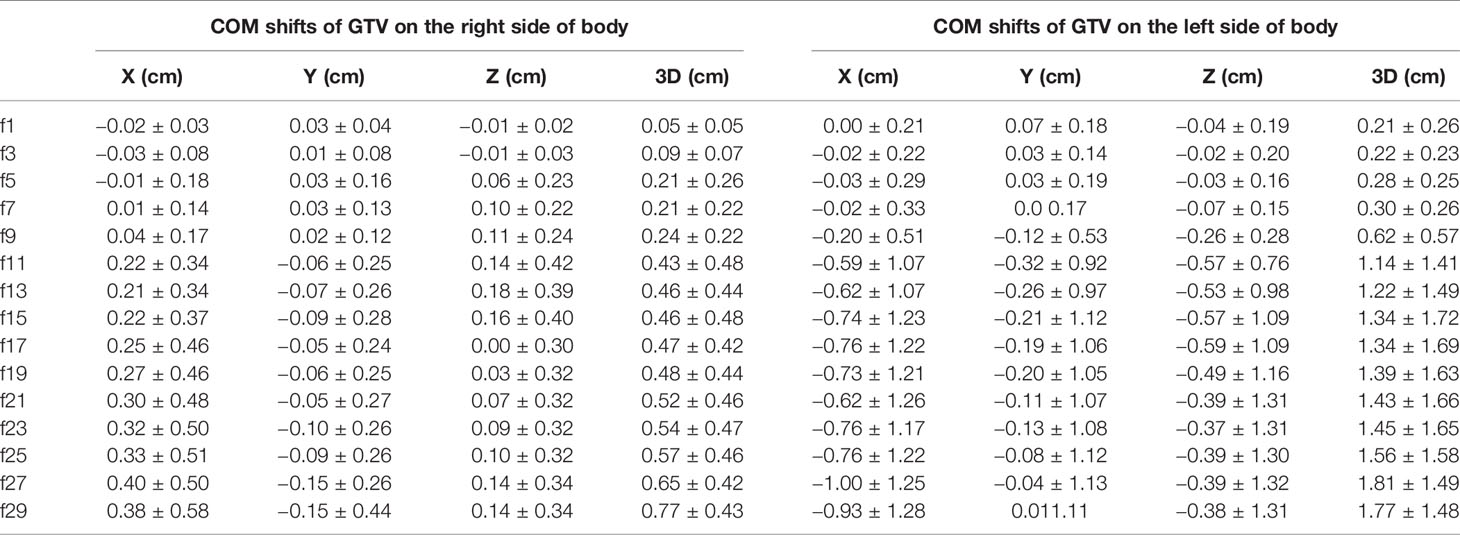
Table 3 The COM shifts of GTV.
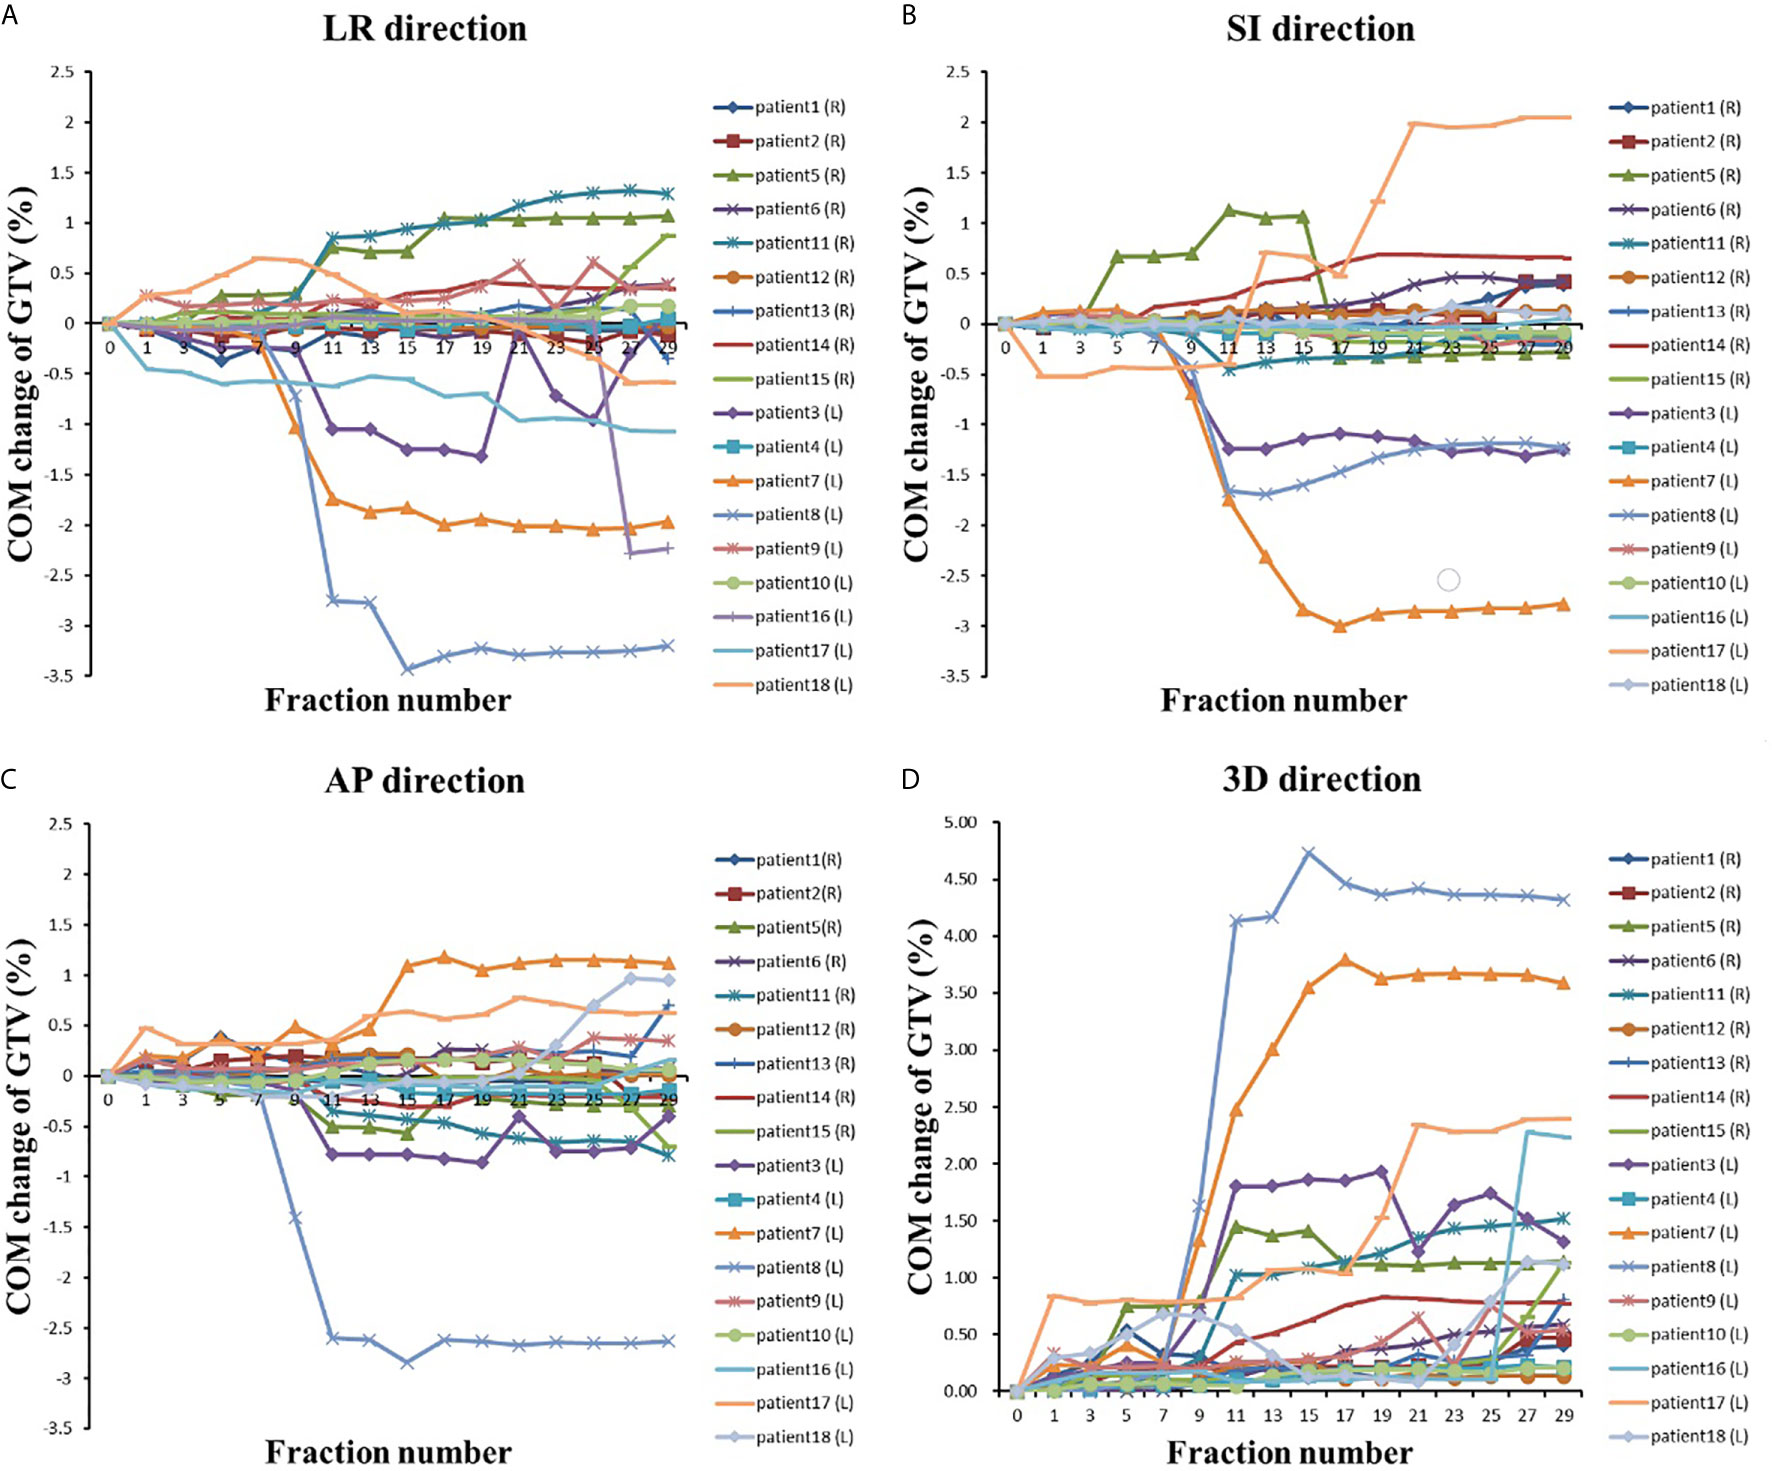
Figure 3 The COM changes with the fraction in (A) LR direction, (B) AP direction, (C) LR direction and (D) 3D direction.
The COM shifts of the GTVs in the AP direction are shown in Table 3. The mean COM of the GTV on the right side of the body was first slightly shifted backward during radiotherapy and then gradually shifted forward, and the maximum shift was 0.15 cm by the last treatment fraction. As shown in Figure 3, the COM shift of the GTV on the right side of the body exceeded 0.5 cm in four patients. Among them, two patients also had a shift of more than 0.5 cm in the LR direction, and the other two patients had a shift of more than 0.5 cm in the COM only during the last treatment fraction. The mean COM of the GTV on the left side of the body also shifted slightly backward in the first seven treatment fractions, with the largest shift (0.32 cm) in the 11th radiotherapy session, after which the forward shift gradually decreased. As shown in Figure 3, similar to the COM shift in the LR direction, the COM shifts of GTV on the right side of body were smaller than that of the GTV on the left side of the body throughout the radiotherapy, and the COM shifts of the GTV on the left side of body exceeded 0.5 cm in five patients. All of them also had a shift of more than 0.5 cm in the LR direction at the same time.
The mean COM of the GTV on the right side of the body was basically shifted toward the head in the SI direction during the treatment course, and the shifts were small, no more than 0.2 cm. The mean COM position of the GTV on the left side of the body was shifted toward the foot, and the maximum shift was 0.59 cm. There were six patients with COM shifts exceeding 0.5 cm during radiotherapy, including four patients with GTV on the left side of the body and two patients with GTV on the right side of the body.
We also analyzed the mean COM shift of the GTV in the 3-D direction. As shown in Table 3, the COM shifts of all of the GTVs gradually increased during radiotherapy and almost reached a maximum by the last treatment fraction, which was 0.77 cm for the GTV on the right side and 1.81 cm for the GTV on the left side, 2.34 times more than that on the right side. The GTV with the COM shift was located on the left side of the body, and the shift was as high as 4.73 cm by the seventh treatment fraction. A total of 77.8% (14 patients) of the patients had a shift >0.5 cm, and 50% (nine patients) of the patients had a shift >1 cm.
The Boundary Changes of the GTV
The changes in the GTV boundary position are shown in Table 4. In the LR direction, both the left and right boundaries of the GTV on the right side of the body were gradually shifted to the left, i.e., toward the mediastinum, which was consistent with the direction of the GTV COM shift, and the average shift of the left boundary was larger than that of the right boundary, with a maximum of 0.86 cm. Similarly, the left and right boundaries of the GTV on the left side of the body were also shifted toward the mediastinal region, with a maximum shift of 1.29 cm.
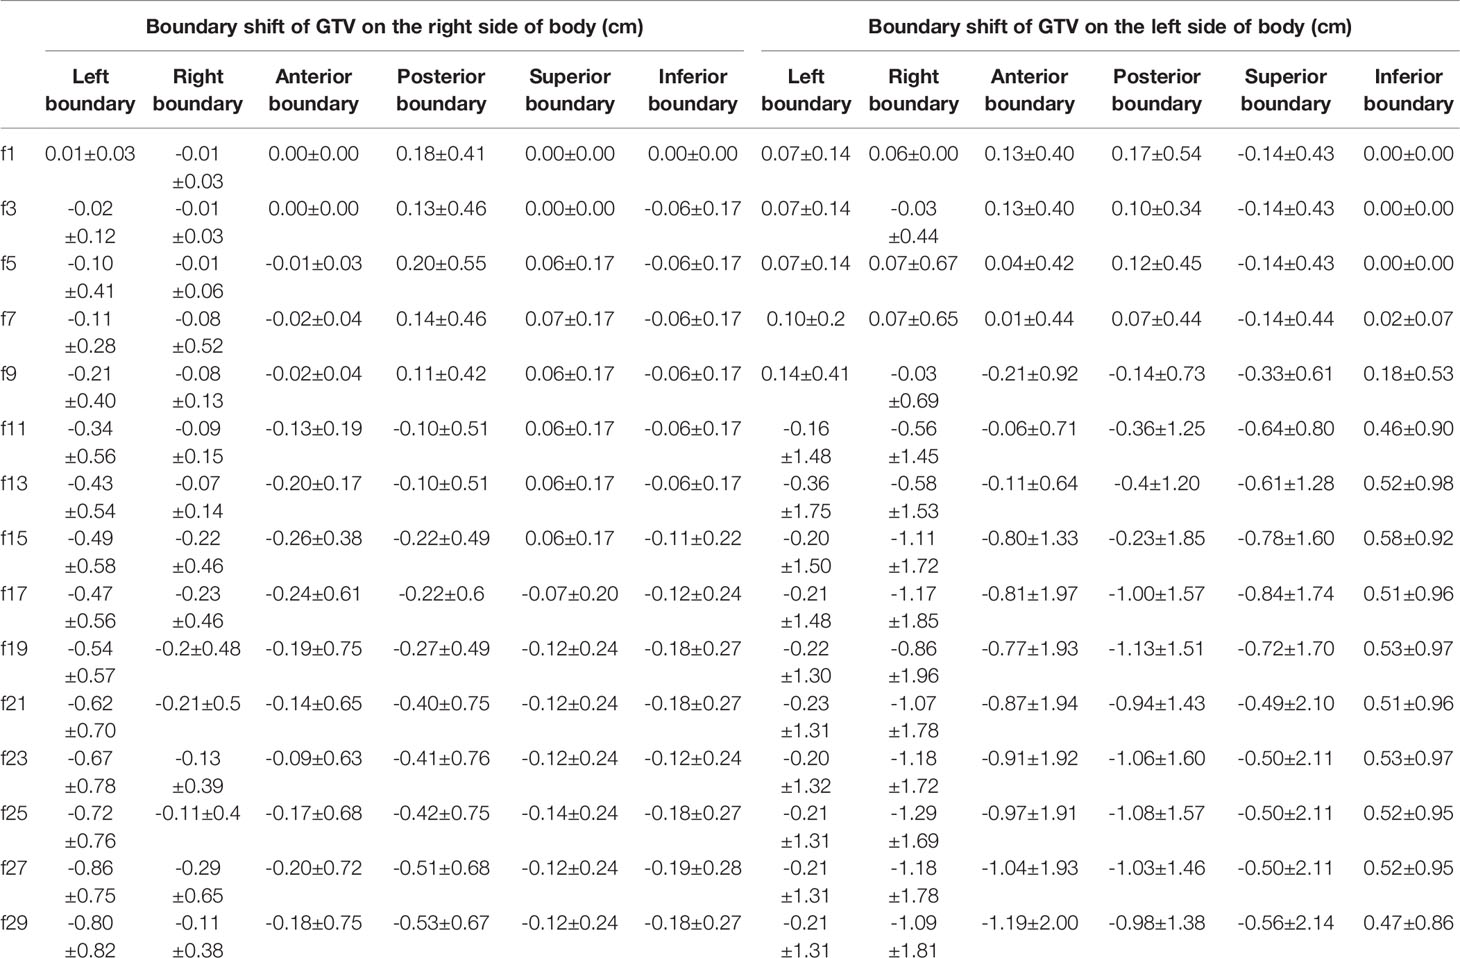
Table 4 The boundary shifts of GTV on the left and right sides of body.
In the AP direction, the anterior boundary of the GTV on the right side of the body gradually shifted to the posterior; the posterior boundary had a tendency to shift to the anterior, and the shifts of both the anterior and posterior boundaries were not very large, with a maximum of 0.53 cm. The anterior boundary of the GTV on the left side of the body shifted to the anterior during the first seven fractions and gradually shifted to the posterior by the 9th fraction, while the posterior boundary shifted to the posterior during the first seven fractions and then gradually shifted to the anterior, and the shift of both boundaries was more than 1 cm by the end of radiotherapy. Therefore, the anterior and posterior boundaries of all of the GTVs had a tendency to shift toward the mediastinal region.
In the SI direction, the upper boundary of the GTV on the right side of the body was first shifted toward the head during the first 15 treatment fractions and then toward the foot. The lower boundary was gradually shifted toward the head throughout the treatment course. For the GTV on the right side of the body, both the upper and lower boundaries were shifted by no more than 0.2 cm. For the GTV on the left side of the body, both the anterior and posterior boundaries were gradually shifted toward the foot, and the shift of the upper boundary was slightly greater than that of the lower boundary.
The Volume Changes of the Ipsilateral Lung
For the patients with the right lung as the ipsilateral lung, the initial mean volume of the ipsilateral lung was 1,296.71 cm3 (1,013.36–1,612.4 cm3), and the ipsilateral lung volume decreased during the first seven treatment fractions and then gradually increased from the 9th treatment fraction (see Table 5), with a maximum magnitude of no more than 10%. For the patients with the left lung as the ipsilateral lung, the initial mean volume of the ipsilateral lung was 593.4 cm3, ranging from 0 to 957.64 cm3. The mean lung volume of the ipsilateral lung tended to increase gradually during the course of treatment, and the magnitude of the increase was greater than that of the patients with the right lung as the ipsilateral lung, with a maximum of 25.83%.
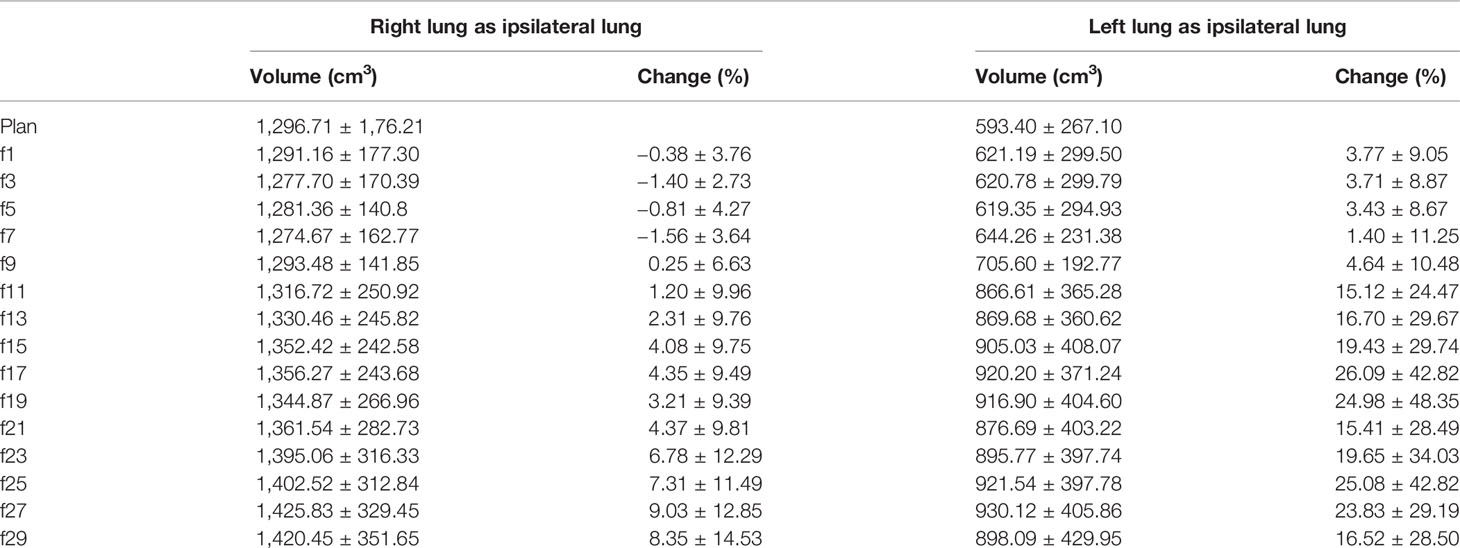
Table 5 The volume changes of the ipsilateral lung.
The Dose Changes of PTV
All D2, D98, Dmean, V95, and V107 of PTV decreased during the treatment course and decreased to the lowest value during the last two radiotherapy fractions (see Table 6). However, compared to the original plan, the magnitude of reduction of each indicator varied greatly. The reduction in D2 and Dmean was small during the course of radiotherapy, with the maximum reduction in D2 not exceeding 1% and the maximum reduction in Dmean reaching 3% by the 21st radiotherapy fraction and 3.61% by the end of radiotherapy. For V95, the reduction was greater than that of D2, reaching 4.01% by the 11th fraction and a maximum reduction of more than 8% at the end of radiotherapy. D98 and V107 showed the greatest reduction, both exceeding 3% at the 5th fraction, with maximum reductions of 25.33 and 16.91%, respectively. The TCP of the PTV reduced during the course of treatment and decreased to the lowest value at the last fraction.
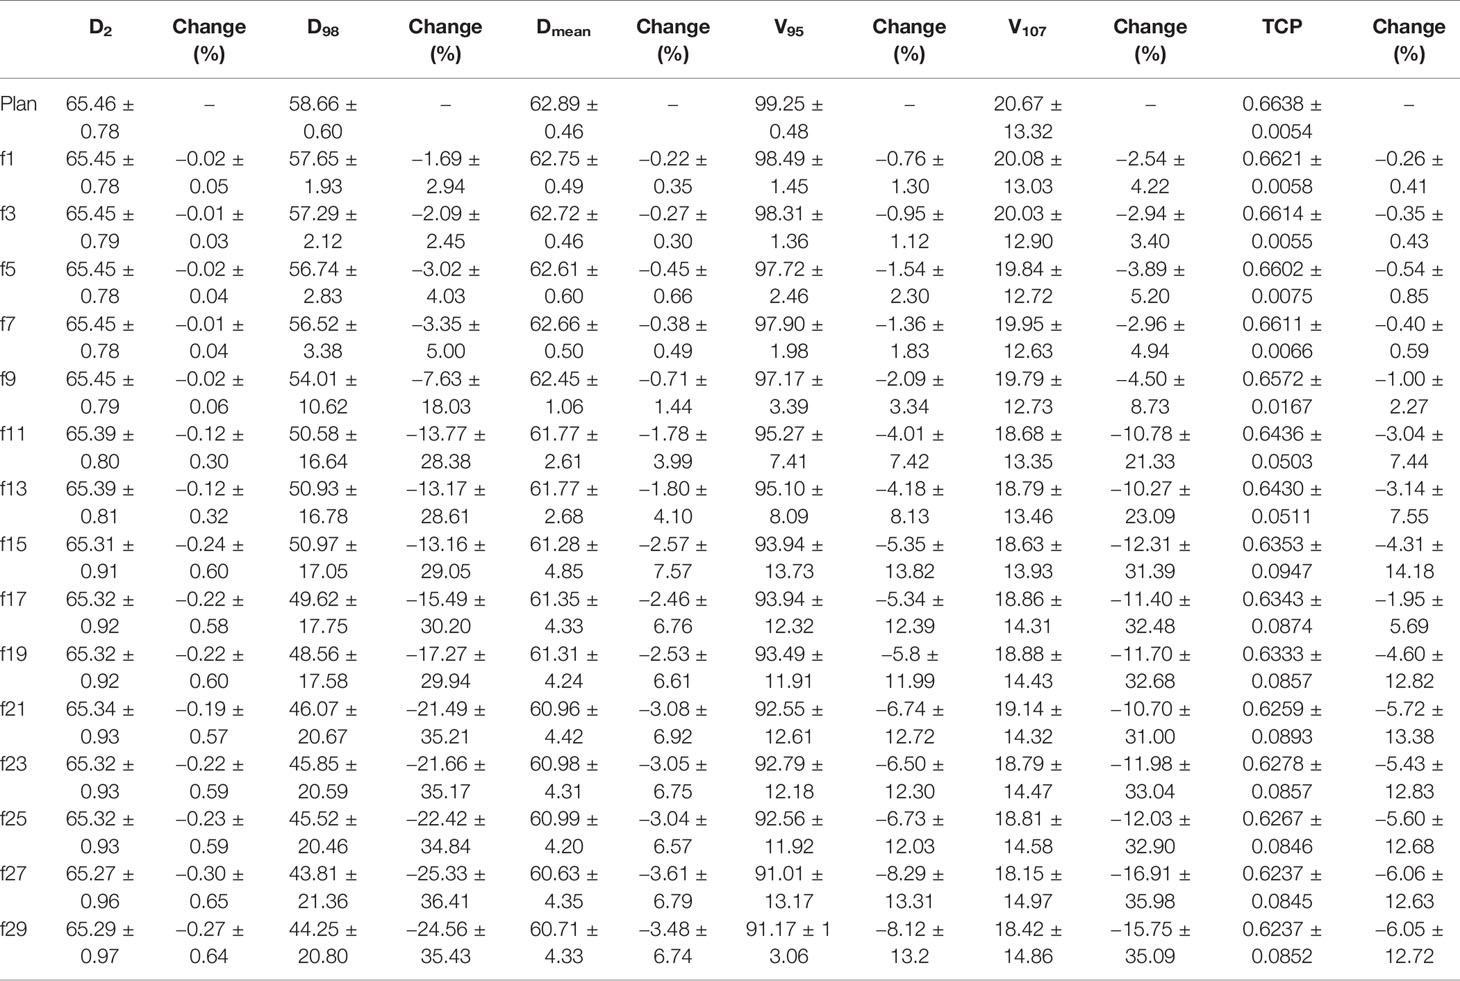
Table 6 The dosimetry and biological changes of PTV.
Change in Total Lung Dose With Treatment Fractions
The V5, V10, V20, V30, and V40 of the total lung increased gradually during the treatment course and increased to the highest value at the end of radiotherapy. As shown in Table 7, for the same fraction, the increase in each parameter increased sequentially, from V5, V10, V20, V30 to V40, and compared to the original plan, the magnitude of the increase in each parameter was large. All of the parameters increased by more than 4% by the 1st fraction, and essentially the maximum magnitude exceeded 20% by the last fraction. Similarly, the NTCP of total lung increased also gradually during the treatment course and increased from 0.0941 to the highest value 0.1302 at the end of radiotherapy.
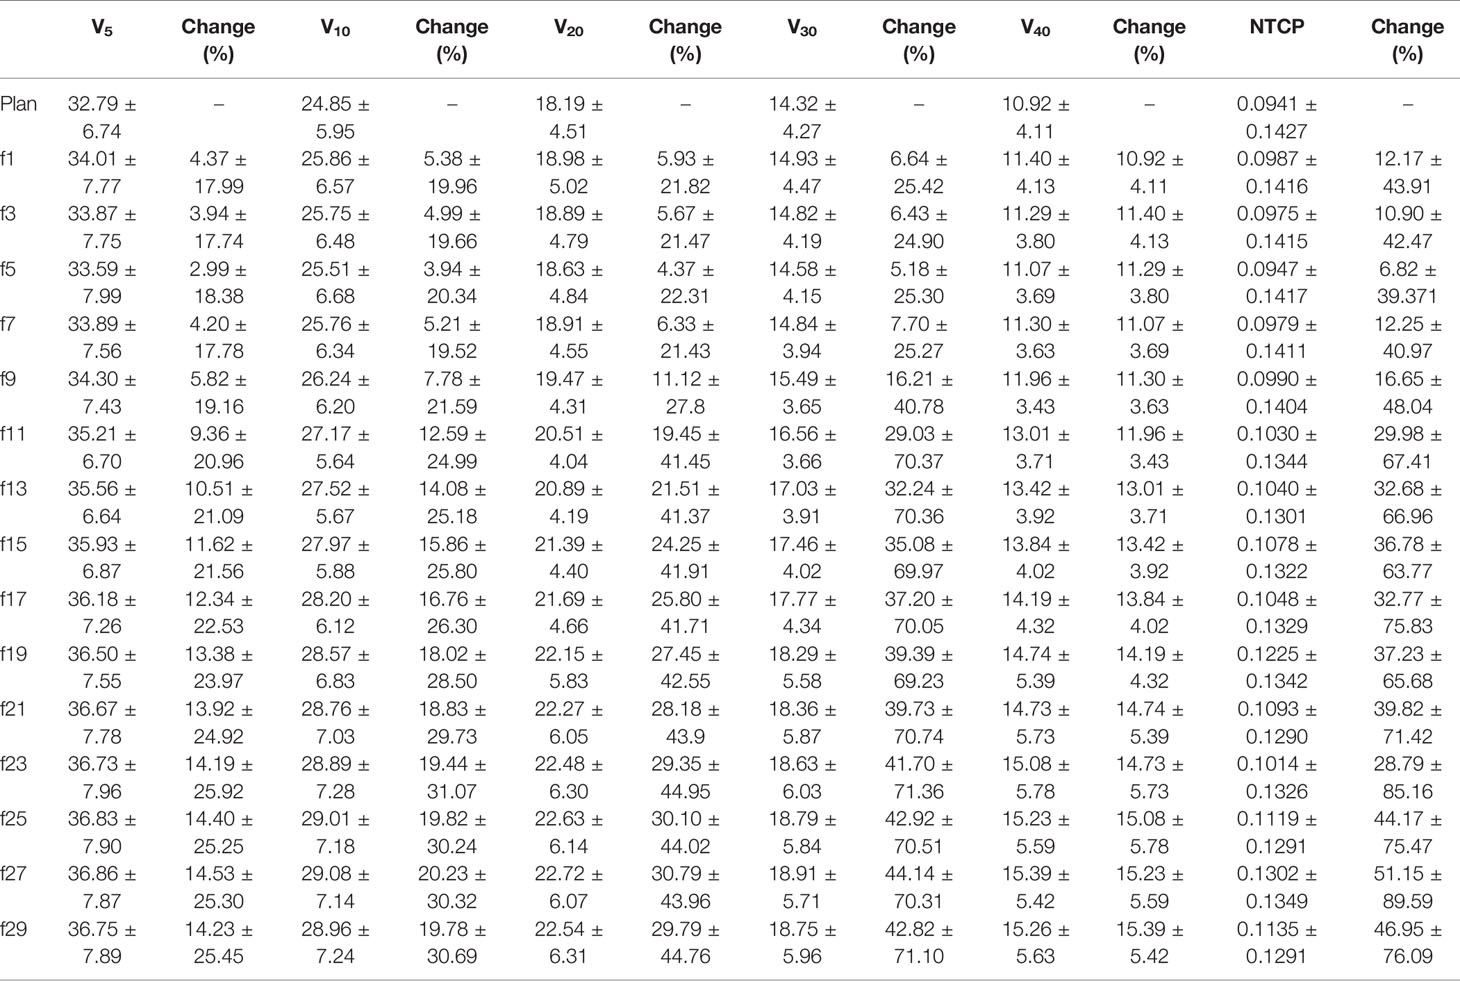
Table 7 The dosimetry and biological changes of total lung.
Summary of Changes in Dosimetry and Geometry
As shown in Tables 2, 3, the GTV tended to gradually decrease, and the COM of the GTV shifted mediastinally during the course of radiotherapy. Therefore, D2, D98, and Dmean of the PTV decreased gradually (Table 6). Figure 1 shows that four patients had complete regression, six patients had partial regression, and six patients had almost no change during radiotherapy, which meant that the atelectasis regressed in half of the patients, which increased the volume of the ipsilateral lungs. Since most of the lung cancer patients in this study had central lung cancer, the atelectasis was located next to the tumor, so the increased lung volume was also located adjacent to the tumors, which increased the dose to lung tissue.
Discussion
In this paper, we retrospectively studied lung cancer patients with atelectasis during radiotherapy to explore geometric and dosimetric changes in the target and lung tissues. To our knowledge, this is the first comprehensive study of targets and lung tissue in patients with atelectasis. Currently, studies on atelectasis radiotherapy are few and are generally retrospective (5, 11, 12), mainly due to the limited number of patients with atelectasis and the large number of images to be acquired.
Usually, central lung cancer is accompanied by atelectasis and obstructive inflammation. Due to tracheal obstruction, ventilation and drainage disorders, reduced effective lung volume and local inflammation, patients often experience severe asthma, chest tightness, dyspnea, fever, and other symptoms. Therefore, the risk of radiotherapy for these patients with atelectasis is higher than that for patients with non-atelectasis lung cancer, and the complications were also more. Atelectasis may undergo regression or expansion during radiotherapy, which may cause major anatomical changes in the tumor. Therefore, image guidance radiotherapy technology and adaptive radiotherapy are necessary. At present, there is currently a lack of guidelines for adaptive radiotherapy for atelectasis. From some of the few studies related to atelectasis, it is known that the density and quality of atelectasis will change, and this change will generate a dosimetry effect on the surrounding normal tissues (5, 11, 12). However, it is not clear how much the regression or expansion of atelectasis affected the geometry and dosimetry of the tumor and lung. Also, the time of the regression or expansion of atelectasis is still unknown. These are the main reasons for this study. To our knowledge, this is the first comprehensive study of targets and lung tissues in patients with atelectasis.
Most of the patients studied in this paper had central lung cancer, and the primary tumor was located near the hilar, so this may be the main reason why the COM and the boundary of the GTV moved to the center of the mediastinum in this study. Other reasons may be related to the location of the atelectasis. The location of atelectasis in this study was mainly in the upper and lower lung lobes (17/18 patients). For the three patients with peripheral lung cancer, the location of the tumor was very different, but the degree of atelectasis regression did not vary and had little influence on the statistical results of this paper. Therefore, we did not explore the differences between the central and peripheral lung cancer groups in this study, but further study of this issue will be conducted.
Table 2 shows that the volume of GTV during radiotherapy gradually decreased, and the larger the volume was, the greater the reduction. However, there were eight patients whose volume increased slightly during the first fractions. Through the observation of CBCT/CT images, it was hypothesized that the increase in GTV volume might be related to tumor inflammation and edema.
Previous results showed that, compared with the shifts of GTV in patients without atelectasis, the shifts of GTV in patients with atelectasis were larger, and for 58% of patients they were more than 1 cm (12). Similar results were observed in this study; 50% of patients (8/18) with a shift of more than 1 cm were also found.
The regression or expansion of the atelectasis reduced the dose coverage rate of the target, but the change in the dose index of the target was very different. D2 and Dmean decreased slightly (0.3 and 3.48%), and D98 (25.33%) and V107 (16.91%) decreased significantly (25.33 and 16.91%, respectively). This meant that due to the shift of the GTV, 25.33% of the target dose would be seriously insufficient when using the original plan, and 16.91% of the high doses were delivered outside of the tumors; as a result, the TCP also reduced. For patient 4, patient 10 and patient 22, the degree of atelectasis regression was larger, resulting in a larger GTV shift in the three-dimensional direction, up to 4.73 cm. As a result, D98 decreased by more than 50%, and V107 decreased by more than 25%. According to Christopher et al. (11), midtreatment alignment based on the carina, rather than on the bone, led to a smaller dose difference during the follow-up than at baseline. In this study, the subject was aligned via bone; if registration based on carina or soft tissue is adopted, the COM, boundary offset, and dosimetric changes for the target may be smaller.
Generally, the regression or expansion of atelectasis may cause an increase or decrease in lung volume. The larger the amount of regression or expansion, the larger the increase or decrease in lung volume. As shown in Table 5, the volume of the ipsilateral lung increased gradually throughout the radiotherapy course. One of the reasons may be tumor regression, but the main reason may be that most patients with atelectasis had regression (12 cases). For one patient in this study with left whole atelectasis, the atelectasis gradually regressed, the dose to the total lung increased, and the NTCP of total lung decreased gradually throughout the whole course of radiotherapy.
Central lung cancer is close to the spinal cord, large blood vessels, and bronchi, and other important organs are at risk. If high doses are delivered to these organs at risk, the risk of complications may be increased. Adaptive planning may benefit these patients (5, 22–24). In our center, each CBCT image collected by every patient with atelectasis was evaluated. At present, there are no corresponding adaptive planning guidelines, and we are conducting relevant adaptive research for atelectasis radiotherapy. The results showed that the resolution or expansion of atelectasis may occur during any fraction of radiotherapy. Therefore, we suggest that CBCT should be collected at least every other day for evaluation. This paper focused on the geometric and dosimetric changes in the target and lung tissue in patients with atelectasis during radiotherapy. Hierarchical research is needed to determine the relevant changes in different types of atelectasis, which could provide a more accurate reference for future adaptive treatment clinical applications.
Although atelectasis often occurs in central lung cancer (8), few atelectasis cases occur in peripheral lung cancer (25). As seen from the results of this paper, we found that there are significant differences between the two types of lung cancer and their effects on the geometry and dose to the tumors and the OARs. Even for central lung cancer, the location of atelectasis varies. The COM and boundary shift of the tumor are also different when regression or expansion occurs. Thus, stratifying patients with atelectasis warrants further investigation.
Considering that atelectasis is usually located near the GTV, CBCT images cannot completely distinguish atelectasis and GTV, and other clearer imaging methods (such as CT or MRI) are needed to distinguish atelectasis from GTV (26). Therefore, the volume or boundary changes of atelectasis were not included in this paper.
This study also had some limitations. One limitation of this study was the low number of patients. The main reason is that fewer than 35% of atelectasis cases present at the start of lung cancer radiotherapy treatment (3–7), and some patients terminate radiotherapy because of radiation reactions. Our center will continue to enroll patients with atelectasis for further study. Second, the contrast resolution of the CBCT images was poor, and the electron density was inaccurate (5, 7, 13), which made it challenging to clearly identify tumors from the atelectatic regions. Frequent CBCT scans may also increase the risk of secondary cancer, and magnetic resonance imaging may be a better choice.
Conclusions
In conclusion, for most patients with atelectasis, atelectasis gradually regressed, and the GTV gradually shifted to the center of the mediastinum, resulting in a lower dose in the target volume. The volume of the ipsilateral lung increased, and the dose to the lung tissue increased. Since resolution or expansion of atelectasis may occur during any fraction during radiotherapy, we propose an evaluation with CBCT at least every two fractions.
Data Availability Statement
The raw data supporting the conclusions of this article will be made available by the authors, without undue reservation.
Ethics Statement
The studies involving human participants were reviewed and approved by the ethics committee in the Shanghai chest hospital. The patients provided written informed consent to participate in this study.
Author Contributions
HC analyzed the data and wrote the manuscript. All authors participated in the design of the presented study, reviewed the manuscript prior to its publication. All authors contributed to the article and approved the submitted version.
Funding
This work was sponsored by the Interdisciplinary Program of Shanghai Jiao Tong University (Grant No. YG2019ZDB07) and Nurture projects for basic research of Shanghai Chest Hospital (Grant No. 2019YNJCM05).
Conflict of Interest
The authors declare that the research was conducted in the absence of any commercial or financial relationships that could be construed as a potential conflict of interest.
Abbreviations
CBCT, cone beam computed tomography; COM, center of mass; TCP, tumor control probability; NTCP, normal tissue complication probability; GTV, gross tumor volume; OAR, organ at risk; PET, positron emission tomography; PTV, planning target volume; LR, left-right; AP, anterior–posterior; SI, superior–inferior; HU, Hounsfield unit.
References
1. Miller KD, Nogueira L, Mariotto AB, Rowland JH, Siegel RL. Cancer Treatment and Survivorship Statistics, 2019. CA Cancer J Clin (2019) 69(5):363–85. doi: 10.3322/caac.21565
2. Dong Z, Zhao L, Lu S, Xiong J, Geng Z. Overexpression of TSPAN8 Promotes Tumor Cell Viability and Proliferation in Nonsmall Cell Lung Cancer. Cancer Biother Radiopharm (2016) 31(10):353–9. doi: 10.1089/cbr.2016.2108
3. Vaaler AK, Forrester JM, Lesar M, Edison M, Venzon D, Johnson BE. Obstructive Atelectasis in Patients With Small Cell Lung Cancer. Incidence response to Treat Chest (1997) 111(1):115–20. doi: 10.1378/chest.111.1.115
4. Karlsson K, Nyman J, Baumann P, Wersall P, Drugge N, Gagliardi G, et al. Retrospective Cohort Study of Bronchial Doses and Radiation-Induced Atelectasis After Stereotactic Body Radiation Therapy of Lung Tumors Located Close to the Bronchial Tree. Int J Radiat Oncol Biol Phys (2013) 87(3):590–5. doi: 10.1016/j.ijrobp.2013.06.2055
5. Møller DS, Khalil AA, Knap MM, Hoffmann L. Adaptive Radiotherapy of Lung Cancer Patients With Pleural Effusion or Atelectasis. Radiother Oncol (2014) 110(3):517–22. doi: 10.1016/j.radonc.2013.10.013
6. Wurstbauer K, Deutschmann H, Kopp P, Kranzinger M, Merz F, Nairz O, et al. Nonresected Non-Small-Cell Lung Cancer in Stages I Through IIIB: Accelerated, Twice-Daily, High-Dose Radiotherapy–A Prospective Phase I/II Trial With Long-Term Follow-Up. Int J Radiat Oncol Biol Phys (2010) 77(5):1345–51. doi: 10.1016/j.ijrobp.2009.06.060
7. Belderbos J, Beek S, Kranen S, Rasch C, Herk M, Sonke J. Anatomical Changes During Radiotherapy of Lung Cancer Patients. Int J Radiat Oncol Biol Phys (2007) 69(3):S508. doi: 10.1016/j.ijrobp.2007.07.1727
8. Qi LP, Zhang XP, Tang L, Li J, Sun YS, Zhu GY. Using Diffusion-Weighted MR Imaging for Tumor Detection in the Collapsed Lung: A Preliminary Study. Eur Radiol (2009) 819(2):333–41. doi: 10.1007/s00330-008-1134-3
9. Yang RM, Li L, Wei XH, Guo YM, Huang YH, Lai LS, et al. Differentiation of Central Lung Cancer From Atelectasis: Comparison of Diffusion-Weighted MRI With PET/CT. PloS One (2013) 8(4):e60279. doi: 10.1371/journal.pone.0060279
10. Zhang X, Fu Z, Gong G, Wei H, Duan J, Chen Z, et al. Implementation of Diffusion-Weighted Magnetic Resonance Imaging in Target Delineation of Central Lung Cancer Accompanied With Atelectasis in Precision Radiotherapy. Oncol Lett (2017) 14(3):2677–82. doi: 10.3892/ol.2017.6479
11. Guy CL, Weiss E, Jan N, Reshko LB, Christensen GE, Hugo GD. Effect of Atelectasis Changes on Tissue Mass and Dose During Lung Radiotherapy. Med Phys (2016) 43(11):6109. doi: 10.1118/1.4965807
12. Tennyson N, Weiss E, Sleeman W, Rosu M, Jan N, Hugo GD. Effect of Variations in Atelectasis on Tumor Displacement During Radiation Therapy for Locally Advanced Lung Cancer. Adv Radiat Oncol (2016) 2(1):19–26. doi: 10.1016/j.adro.2016.12.001
13. Kwint M, Conijn S, Schaake E, Knegjens J, Rossi M, Remeijer P, et al. Intra Thoracic Anatomical Changes in Lung Cancer Patients During the Course of Radiotherapy. Radiother Oncol (2014) 113(3):392–7. doi: 10.1016/j.radonc.2014.10.009
14. Weiss E, Robertson SP, Mukhopadhyay N, Hugo GD. Tumor, Lymph Node, and Lymph Node-to-Tumor Displacements Over a Radiotherapy Series: Analysis of Interfraction and Intrafraction Variations Using Active Breathing Control (ABC) in Lung Cancer. Int J Radiat Oncol Biol Phys (2012) 82(4):e639–45. doi: 10.1016/j.ijrobp.2011.08.021
15. Bradley JD, Moughan J, Graham MV, Byhardt R, Govindan R, Fowler J, et al. A Phase I/II Radiation Dose Escalation Study With Concurrent Chemotherapy for Patients With Inoperable Stages I to III Non-Small-Cell Lung Cancer: Phase I Results of RTOG 0117. Int J Radiat Oncol Biol Phys (2010) 77(2):367–72. doi: 10.1016/j.ijrobp.2009.04.029
16. Huang W, Fan M, Liu B, Fu Z, Zhou T, Zhang ZC, et al. Value of Metabolic Tumor Volume on Repeated 18F-FDG PET/CT for Early Prediction of Survival in Locally Advanced None-Small Cell Lung Cancer Treated With Concurrent Chemoradiotherapy. J Nucl Med (2014) 55(10):1584–90. doi: 10.2967/jnumed.114.142919
17. Huang W, Liu B, Fan M, Zhou T, Fu Z, Zhang ZC, et al. The Early Predictive Value of a Decrease of Metabolic Tumor Volume in Repeated (18)F-FDG PET/CT for Recurrence of Locally Advanced Nonesmall Cell Lung Cancer With Concurrent Radiochemotherapy. Eur J Radiol (2015) 84(3):482–8. doi: 10.1016/j.ejrad.2014.11.020
18. Gay HA, Niemierko A. A Free Program for Calculating EUD-based NTCP and TCP in External Beam Radiotherapy. Phys Med (2007) 23(3-4):115–25. doi: 10.1016/j.ejmp.2007.07.001
19. Huang BT, Lu JY, Lin PX, Chen JZ, Li DR, Chen CZ. Radiobiological Modeling Analysis of the Optimal Fraction Scheme in Patients With Peripheral Non-Small Cell Lung Cancer Undergoing Stereotactic Body Radiotherapy. Sci Rep (2015) 5:18010. doi: 10.1038/srep18010
20. Mohan R, Mageras GS, Baldwin B, Brewster LJ, Kutcher GJ, Leibel S, et al. Clinically Relevant Optimization of 3-D Conformal Treatments. Med Phys (1992) 19(4):933–44. doi: 10.1118/1.596781
21. Semenenko VA, Li XA. Lyman-Kutcher-Burman NTCP Model Parameters for Radiation Pneumonitis and Xerostomia Based on Combined Analysis of Published Clinical Data. Phys Med Biol (2008) 53(3):737–55. doi: 10.1088/0031-9155/53/3/014
22. Meng Y, Luo W, Xu H, Wang W, Zhou S, Tang X, et al. Adaptive Intensity-Modulated Radiotherapy With Simultaneous Integrated Boost for Stage III Non-Small Cell Lung Cancer: Is a Routine Adaptation Beneficial? Radiother Oncol (2021) 158:118–24. doi: 10.1016/j.radonc.2021.02.019
23. Tvilum M, Khalil AA, Møller DS, Hoffmann L, Knap MM. Clinical Outcome of Image-Guided Adaptive Radiotherapy in the Treatment of Lung Cancer Patients. Acta Oncol (2015) 54(9):1430–7. doi: 10.3109/0284186X.2015.1062544
24. Kim M, Philips MH. A Feasibility Study of Dynamic Adaptive Radiotherapy for Nonsmall Cell Lung Cancer. Med Phys (2016) 43(5):2153. doi: 10.1118/1.4945023
25. Gurney JW. Atypical Manifestations of Pulmonary Atelectasis. J Thorac Imaging (1996) 11(3):165–75. doi: 10.1097/00005382-199622000-00001
Keywords: atelectasis, lung cancer, cone beam computed tomography (CBCT), center of mass, radiotherapy, regression, dosimetry comparison
Citation: Chen H, Shao Y, Gu X, Zheng Z, Wang H, Gu H, Duan Y, Feng A, Huang Y, Gan W, Chen C and Xu Z (2021) Geometric and Dosimetric Changes in Tumor and Lung Tissue During Radiotherapy for Lung Cancer With Atelectasis. Front. Oncol. 11:690278. doi: 10.3389/fonc.2021.690278
Received: 02 April 2021; Accepted: 21 June 2021;
Published: 22 July 2021.
Edited by:
Wenyin Shi, Thomas Jefferson University, United StatesReviewed by:
James Chow, University of Toronto, CanadaRuijie Yang, Peking University Third Hospital, China
Copyright © 2021 Chen, Shao, Gu, Zheng, Wang, Gu, Duan, Feng, Huang, Gan, Chen and Xu. This is an open-access article distributed under the terms of the Creative Commons Attribution License (CC BY). The use, distribution or reproduction in other forums is permitted, provided the original author(s) and the copyright owner(s) are credited and that the original publication in this journal is cited, in accordance with accepted academic practice. No use, distribution or reproduction is permitted which does not comply with these terms.
*Correspondence: Chongyang Chen, chychen@fudan.edu.cn; Zhiyong Xu, xzyong12vip@sina.com