Corrigendum: Prediction of EGFR Mutation Status Based on 18F-FDG PET/CT Imaging Using Deep Learning-Based Model in Lung Adenocarcinoma
 Guotao Yin1†Ziyang Wang1†
 Yingchao Song2†Xiaofeng Li1Yiwen Chen1Lei Zhu1
 Qian Su1
 Dong Dai1*
 Wengui Xu1*
- 1Department of Molecular Imaging and Nuclear Medicine, Tianjin Medical University Cancer Institute and Hospital, National Clinical Research Center for Cancer, Tianjin Key Laboratory of Cancer Prevention and Therapy, Tianjin’s Clinical Research Center for China, Tianjin, China
- 2School of Medical Imaging and Tianjin Key Laboratory of Functional Imaging, Tianjin Medical University, Tianjin, China
Objective: The purpose of this study was to develop a deep learning-based system to automatically predict epidermal growth factor receptor (EGFR) mutant lung adenocarcinoma in 18F-fluorodeoxyglucose (FDG) positron emission tomography/computed tomography (PET/CT).
Methods: Three hundred and one lung adenocarcinoma patients with EGFR mutation status were enrolled in this study. Two deep learning models (SECT and SEPET) were developed with Squeeze-and-Excitation Residual Network (SE-ResNet) module for the prediction of EGFR mutation with CT and PET images, respectively. The deep learning models were trained with a training data set of 198 patients and tested with a testing data set of 103 patients. Stacked generalization was used to integrate the results of SECT and SEPET.
Results: The AUCs of the SECT and SEPET were 0.72 (95% CI, 0.62–0.80) and 0.74 (95% CI, 0.65–0.82) in the testing data set, respectively. After integrating SECT and SEPET with stacked generalization, the AUC was further improved to 0.84 (95% CI, 0.75–0.90), significantly higher than SECT (p<0.05).
Conclusion: The stacking model based on 18F-FDG PET/CT images is capable to predict EGFR mutation status of patients with lung adenocarcinoma automatically and non-invasively. The proposed model in this study showed the potential to help clinicians identify suitable advanced patients with lung adenocarcinoma for EGFR‐targeted therapy.
Introduction
Lung cancer is one of the leading causes of cancer-related death around the world (1, 2). Non-small cell lung cancer (NSCLC) account for more than 80% of the total number of lung cancer cases, among which the adenocarcinoma is the most common histological subtype (3). As the development of the molecular biology, the discovery of epidermal growth factor receptor (EGFR) and the emergence of small molecular tyrosine kinase inhibitors (TKIs) targeting EGFR mutations, such as gefitinib and erlotinib, have revolutionized the treatment of advanced NSCLC (4). Compared with traditional chemotherapy, EGFR-TKI has fewer side effects and has been proven to more significantly improve the prognosis of NSCLC patients with EGFR mutations (5). However, for the patients without EGFR mutations, EGFR-TKI not only has no effect, but may cause worse prognosis than platinum‐based chemotherapy (6), suggesting the importance of EGFR mutation detection.
Mutation profiling of the biopsies from advanced patients or surgically removed samples from early-stage patients have become the golden standard of mutation detection. However, difficulty of accessing sufficient tumor tissue samples and poor DNA quality partly limit the application of mutation profiling (7). Furthermore, because of the poor physical fitness, invasive examinations, such as biopsy, were not suitable for advanced patients with lung cancer. Therefore, there is an urgent need for a non-invasive way to predict EGFR mutations.
18F-FDG PET/CT is a widely used imaging modality in clinical practice and has been proven to play an important role in the diagnosis, staging, and prognostic evaluation of lung cancer (8–10). Recent researches have shown that EGFR signaling regulates the glucose metabolic pathway, which could be reflected by the uptake of 18F-FDG, indicating the potential of predicting EGFR mutation status by 18F-FDG PET images (11, 12). Some researchers also found that the radiomic features of PET images were associated to EGFR mutation (13). Besides, previous study has also demonstrated that radiomic features derived from CT images also showed predicting value to EGFR mutation status (14). However, the extraction of radiomic features required the precise delineation of the lesions, which is time-consuming (15). Also, the radiomic features may be affected by the imaging parameters and delineation accuracy, causing poor repeatability of some of them (16).
As the continuous development of computer technology, one of the deep learning algorithms, convolutional neural networks (CNNs), has shown a promising performance in lesion detection, segmentation, and classification (17–19). Compared with the feature engineering-based radiomic methods, CNNs do not require the precise delineation of tumor (20). Moreover, CNNs could automatically learn the features, which were more specific to the clinical outcome (19). Nowadays, some researchers focused on predicting EGFR mutation status with deep learning models. Zhao et al. constructed a DenseNet on CT images to predict EGFR mutation, and the AUC of the model was 0.75 (21). Wang et al. further improved the predictive performance by training models with contrast-enhanced CT images (19). Mu et al. built a deep learning model to predict EGFR mutation by registering and fusing PET/CT images at the image level, and the results showed that the AUC of model trained with fused images has been significantly improved to 0.85 than trained with PET or CT image alone (22). These suggest that integrating multiple information could improve the prediction accuracy of the model to a certain extent. In the clinical practice, the pulmonary function of patients with advanced lung cancer was relatively poor, and the amplitude of respiratory movement was larger than other early-stage patients. It may be more challenging in registering PET and CT imaging in this situation (23).
Considering the abovementioned situation, we develop a deep learning-based model in 18F-FDG PET/CT images to predict the EGFR mutant status in patients with pulmonary adenocarcinoma. We first separately built and trained the deep learning models based on CT and PET images, and then used another model to synthesize the predictive results of the CT model and the PET model to give the final prediction of EGFR mutation. The proposed deep learning-based model could help clinicians identify suitable advanced patients with lung adenocarcinoma for EGFR-targeted therapy, facilitating implementation of precise medicine with an efficient and convenient way.
Materials and Methods
Creation of Data Set
This retrospective study used the local data collected in Tianjin Medical University Cancer Hospital. Patients between June 2016 and July 2019 who meet the following inclusion criteria were included in this study. 1) patients performed 18F-FDG PET/CT imaging before surgery or aspiration biopsy and the image data could be obtained; 2) the pathological reports of the specimens confirmed primary pulmonary adenocarcinoma; 3) the specimens obtained by surgical resection or aspiration biopsy have been tested for EGFR mutation. Patients were excluded if 1) neo-adjuvant chemotherapy/radiotherapy was received before 18F-FDG PET/CT imaging; 2) the duration between surgery/biopsy and 18F-FDG PET/CT imaging exceed 2 weeks. Finally, 301 patients were included in this study, and patients were split into training and testing data set. Figure 1 showed the process of the creation of data set. All procedures in studies involving human participants were conducted in accordance with the 1964 Helsinki declaration and its later amendments or comparable ethical standards.
FIGURE 1
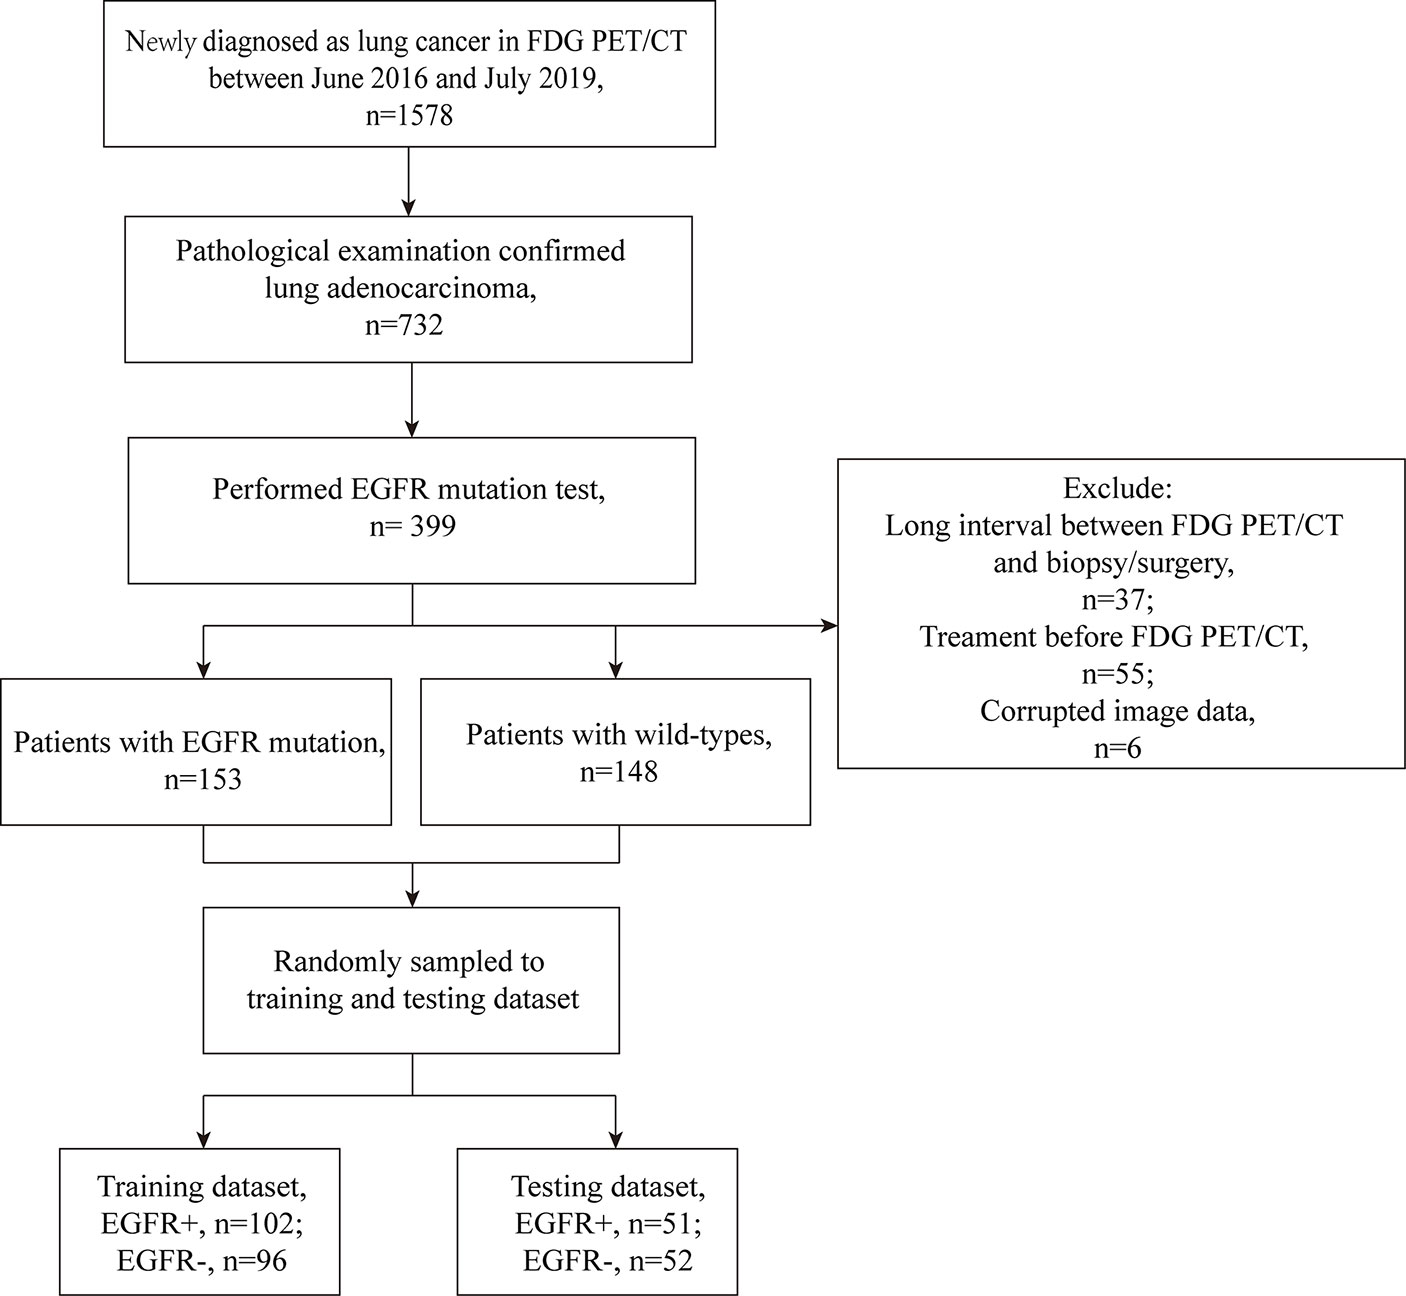
Figure 1 The process of the data set establishment. Long interval: exceeding 2 weeks. Corrupted image data: the CT or PET data that cannot open.
EGFR Mutation Profiling
EGFR mutations were identified on exons 18, 19, 20, and 21, which were the main drug target-associated mutations. For the surgical resected specimens, the EGFR mutations were examined using quantitative real-time polymerase chain reaction. For the aspiration biopsied specimens, the EGFR mutations were examined by high-performance capillary electrophoresis. All specimens were taken from the primary lung tumor masses. If the mutation of any of the above exons were detected, the lesion was defined as EGFR-mutant; otherwise, the lesion was defined as EGFR-wild type.
18F-FDG PET/CT Procedure
Images were obtained using GE Discovery Elite PET/CT scanner (GE Medical Systems). Patients fasted for approximately 6 h with a serum glucose level <11.1mmol/L before PET/CT imaging. Images were started to acquire 50 to 60 min after injection of 4.2 MBq/kg 18F-FDG. A spiral CT scan (80 mAs, 120 kVp, 5-mm slice thickness) was first acquired for precise anatomical localization and attenuation correction, and a PET emission scan (3D mode) was subsequently followed from the distal femur to the top of the skull. PET images were reconstructed using iterative algorithms ordered-subset expectation maximization (OSEM) to a final pixel size of 5.3 × 5.3 × 2.5 mm. A 6-mm full-width at half maximum Gaussian filter was applied after the reconstruction.
Data Preprocessing
The spacing of 18F-FDG PET and CT images were first resampled to 1×1×1 mm3 by third-order spline interpolation to avoid the image distortion. Then, the regions of interest (ROIs) with size of 64 mm × 64 mm, which centered on primary lung tumor were manually selected for PET and CT images by two radiologists with 3- and 4-year experience in 18F-FDG PET/CT diagnosis using medical image processing software 3D Slicer (version 4.10.2), and subsequently confirmed by a 10-year experienced nuclear medicine physician. To reduce the influence of the difference between the middle level slices and the peripheral level slices on the performance of models, only 80% of all tumor slices centered on the largest slice were selected as ROIs. After the segmentation, the ROIs were exported as NII format for further analysis. Before feed into the models, the ROIs were normalized according to the following methods: the CT ROIs were converted into Hounsfield units with the range of −1,000 to 200, and the values were transformed to [−1, 1); the PET ROIs were converted into standard uptake values with the range of 0 to 40 and transformed to [−1, 1). The ROIs were labeled as EGFR mutant (Mut) or wild type (WT) according to the corresponding EGFR mutation testing report. No image augmentation was used in this study.
Model Architecture
To use the information in the limited data more effectively, we adopted the powerful deep convolutional neural network structure SE-ResNet module (24), which integrates residual learning for feature reuse and squeeze-and-excitation operations for adaptive feature recalibration, for PET and CT images, respectively (25). SE-ResNets have achieved great success in natural images recognition tasks. In the SE-ResNet module, the shortcut connection could enhance information flow over feature propagation and mitigate the phenomenon of vanishing/exploding gradients and network degradation in deeper networks (25). Also, the SE block could selectively emphasize informative channel features and suppress less useful ones by feature recalibration process. The SE-residual module can be formulated as below [The following formula and explanation refer to (24–27)]:
Here X represents the input feature. Fres consisted of three consecutive convolution-batch normalization-leaky ReLU layers. Xres is the residual feature which is calculated from X by Fres In the first squeezing step, the channel-wised parameter s = [s1, s2, … , sc] ∈ ℝC is generated by squeezing through plane dimensions H×W, where
C represented the number of channels of the residual feature.
To make use of the information aggregated in the squeeze operation, the second step, which aims to fully capture channel-wise dependencies, is adopted. Two fully connected layers were used to automatically identify the importance of different channels. The output of these fully connected layers can be defined as
Here δ is the Leaky ReLU function with negative slope = 0.5, σ is the Sigmoid function, , and is the weights of two fully connected layers. The reduction ratio r is set to 8 to reduce the costs of computation.
The output of the last convolution layer in SE-Residual module is defined as , where
Here and refers to channel-wise multiplication between the feature map and the learned scale value . The scale value represents the importance degree of cth channel. Considering the shortcut connection which could propagate gradients further by skipping one or more layers in deep nets, the final output of SE-Residual module is defined as
where δ refers to the Leaky ReLU function with negative slope = 0.5. The basic SE-Residual module and the structure of SEPET and SECT are illustrated in Figure 2.
FIGURE 2
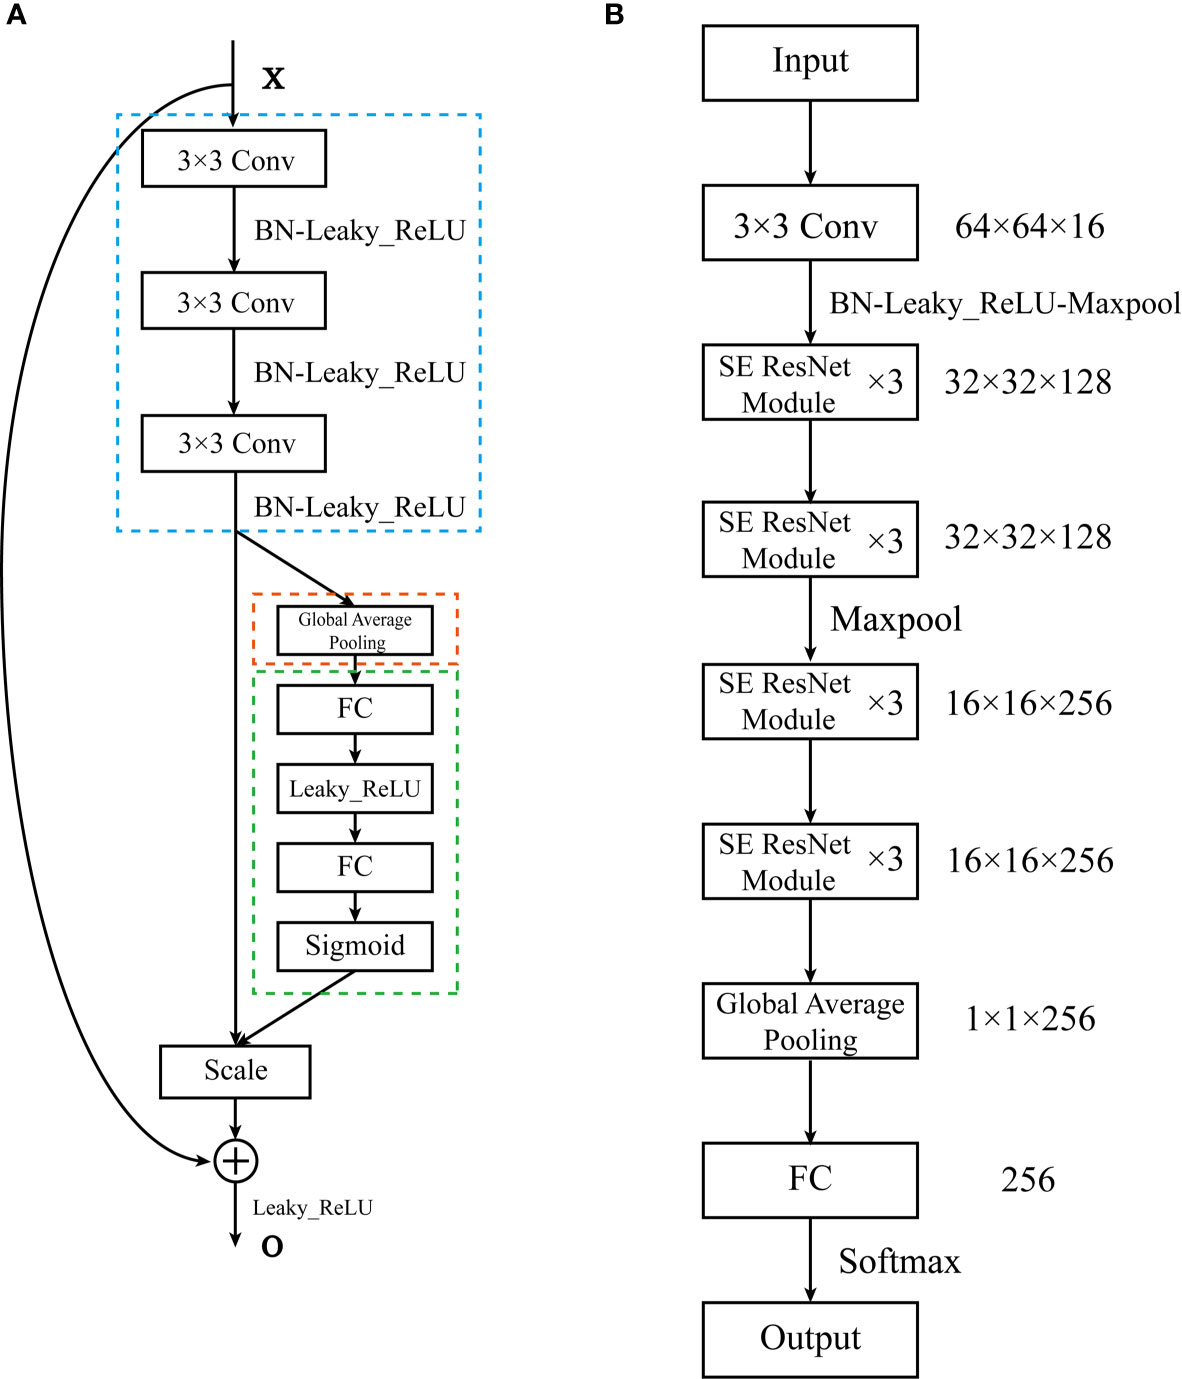
Figure 2 The architecture of the SE-ResNet. (A) The structure of the SE-Residual module. The structure in the blue dashed line is Fres, the structure in the orange dashed line is the squeezing step, the structure in the green dashed line is the excitation step. (B) The composition of the SE-ResNet. The SE-ResNet consists of 4 basic modules. Each basic module is composed of 3 SE-Residual modules. A fully connected layer was attached to the end of the model.
Then we used stacked generalization (StackPET-CT) to integrate SECT and SEPET to further improve the accuracy of prediction. Stacked generalization or stacking is a model fusion method of using a high-level model to combine lower-level models to achieve greater predictive accuracy (28). The higher-level model, called “meta-classifier,” could discover the best way of how to combine the outputs of the base classifiers (29). In this study, SECT and SEPET served as base classifiers. And the support vector machine (SVM) with radius-basis kernel served as the meta-classifier. We implemented the neural networks and SVM with Pytorch 1.6.0 and scikit-learn 0.23.2 based on Python 3.7.6 (30, 31).
Model Training
For the deep learning models, the training data set was used to fit and tune models via fivefold cross-validation, and the testing data set was used to evaluate the predictive and generalization ability of the models. The SECT and SEPET were initialized by MRSA method (32). During training, the study sampled the training data with a ratio of 1: 1 for the Mut and WT with a batch size of 128. Adam optimizer was used to update the deep learning models parameters (33). The initial learning rate was set to 5 × 10⁻⁶ and decayed by a factor of 1/10 at the end of epoch = 40. Weight decay of 10−4 was also used in the optimizer of SECT to avoid overfitting. We early stop the training after 80 epochs. The training of deep learning models was performed with an Nvidia RTX 2060 graphics processing unit (GPU).
For the StackPET-CT, the meta-classifier, SVM, was trained as follows: suppose the training data set as , where are tensors representing the attribute values of the CT and PET images, and yn is the class value. Then, Dprimary was randomly partitioned into five almost equal size parts D1, … , D5, and define D–i = Dprimary – Di, where i=1, …,5. Di and D–i are used as validation set and training set for the ith fold of the 5-fold cross-validation, respectively. The SECT and SEPET are trained using instances of the training set D–i to output the hypothesis . For each pairs of instances in Di, the validation set of the ith cross-validation fold, let denote the Mut probabilities of the hypothesis on , respectively. By processing the whole 5-fold cross-validation, the secondary training set is assembled from the outputs of the two hypotheses. Then, the SVM that we call the meta-classifier is used to derive a hypothesis Hsecondary from the secondary training set Dsecondary. The development of StackPET-CT was shown in Figure 3. The probability of EGFR mutation at the patient level was calculated as averaging the EGFR mutation probabilities of slices that included tumor mass.
FIGURE 3
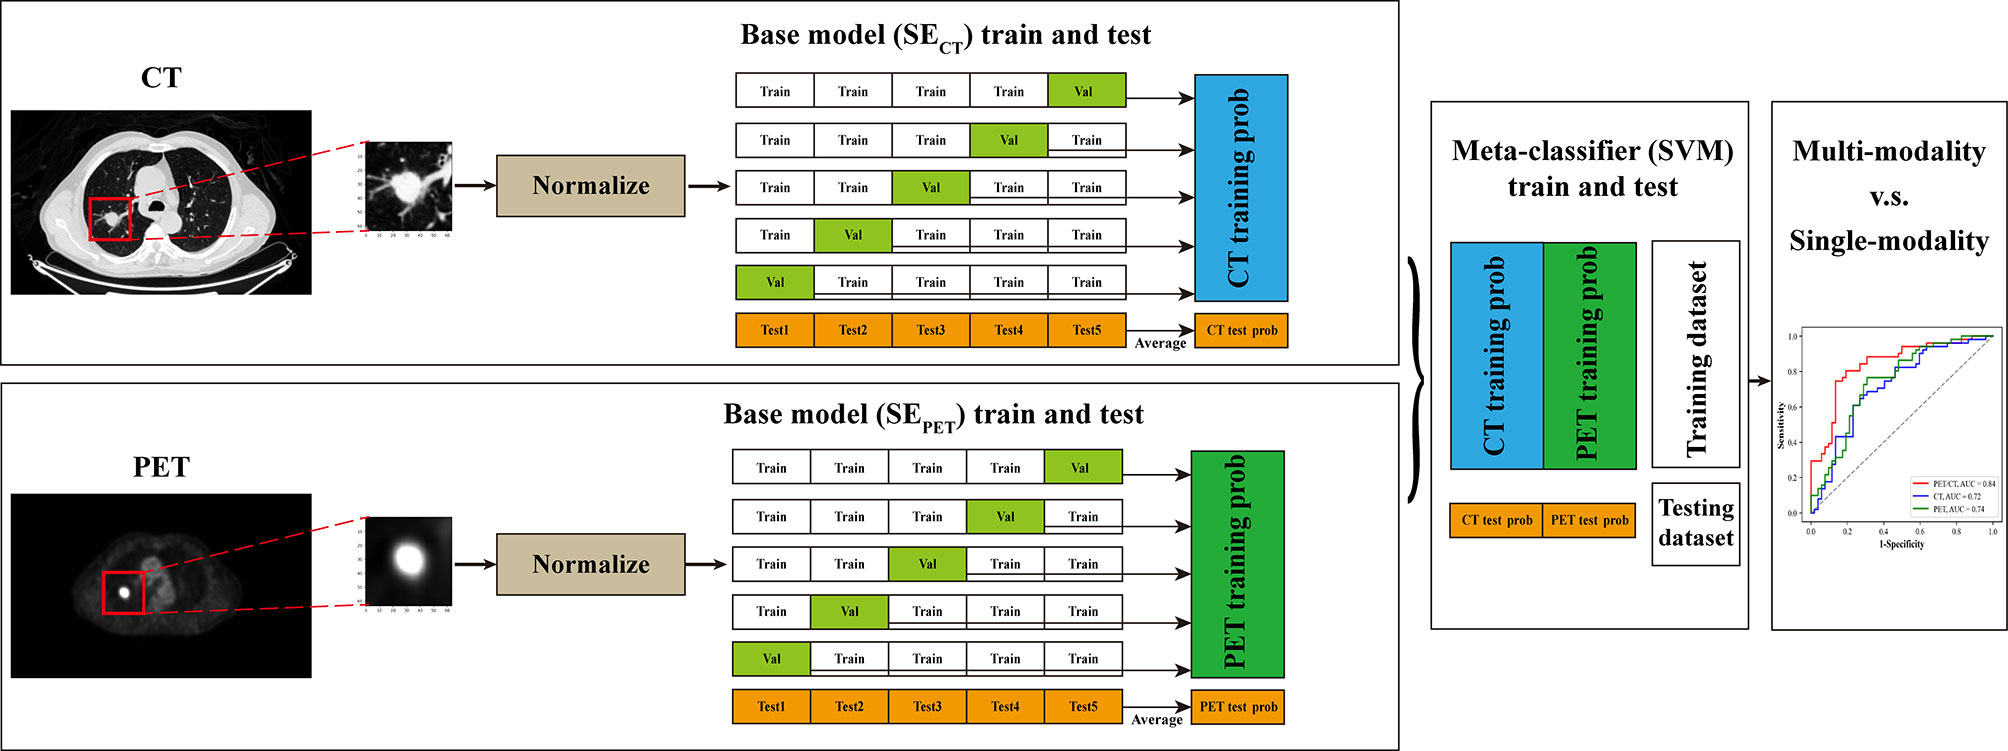
Figure 3 The pipeline of this study. The CT and PET images were first resampled, and the ROIs centered the primary lung tumor were manually selected and normalized. Then SECT and SEPET served as base classifiers and were trained on training data set through fivefold cross-validation to get the EGFR mutation probabilities of training data set. Simultaneously, these models were tested on testing data set for five times. The predictive probabilities of SECT and SEPET for training data set were combined and used for the training of SVM, which served as meta-classifier. And the five times predictive probabilities of SECT and SEPET for testing data set was averaged respectively and combined for the testing of SVM. Finally, the performance of multi-modal stacking model and single-modal deep learning models was compared through ROC curve analysis.
The Interpretability of Deep Learning Models
The visualization method named Grad-CAM was used to explain the predictive process of SECT and SEPET (34). The Grad-CAM algorithm could generate the attention map on the input image. The attention map can reflect the discriminative area that the deep learning models mainly focuses on in the classifying process.
Statistical Analysis
Statistical analysis was performed using Medcalc 19.0.4 and the machine learning module scikit-learn 0.23.2 basing on Python3.7.6. The Mann-Whitney U test was used to assess the significance of the ages between Mut and WT groups. The independent-samples t-test was used to assess the significance of the mean value on tumor size between Mut and WT groups. The Chi-squared test was used to evaluate the difference of sex, tumor location, smoking history, and stage in all the patients. DeLong test was used to evaluate the difference of the receiver operating characteristic (ROC) curves between various models. A p-value <0.05 was treated as significant.
Results
Clinical Characteristic of Patients
The clinical characteristics of patients enrolled in this study were present in Table 1. In the training data set, 1.01% (2/198) patients had exon 18 mutation, 17.17% (34/198) patients had exon 19 mutation, 3.03% (6/198) patients had exon 20 mutation, and 30.30% (60/198) patients had exon 21 mutation. In the testing data set, 0.97% (1/103) patients had exon 18 mutation, 19.42% (20/103) patients had exon 19 mutation, 2.91% (3/103) patients had exon 20 mutation, 26.21% (27/103) had exon 21 mutations. The differences of sex and smoking history between Mut and WT were significant in both training and testing data set.
TABLE 1
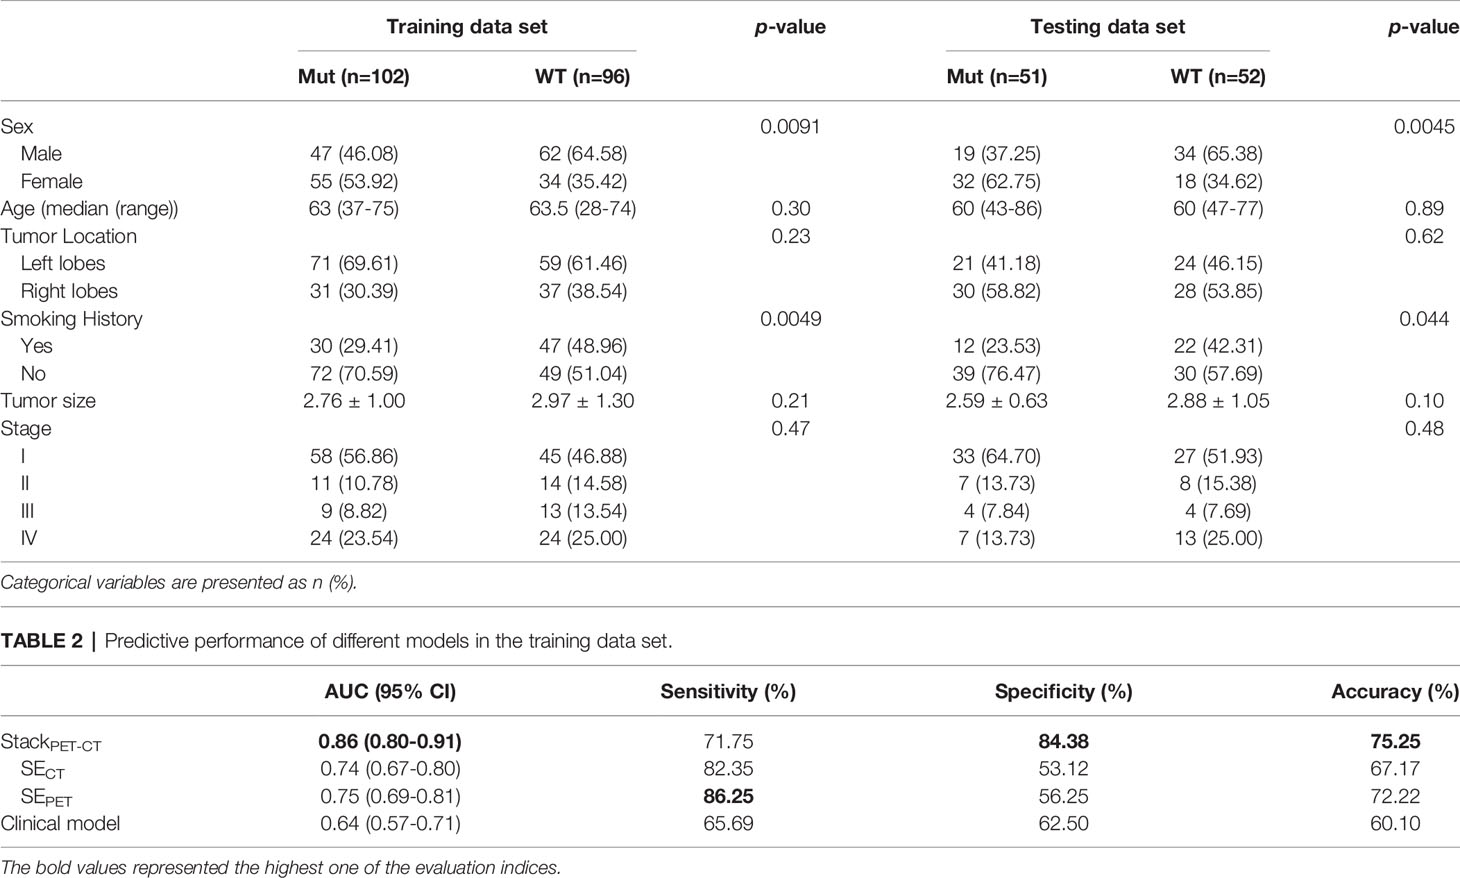
Table 1 Clinical characteristics of patients.
The Performance of Deep Learning Models
The predictive performance of deep learning models was evaluated through the area under ROC curve (AUC), sensitivity, specificity, and accuracy. The AUC ranges from 0.5 to 1.0. The performance of model is improving as the AUC increases. Sensitivity is the numerical ratio of true EGFR mutant ones to the predicted EGFR mutant ones according to the model. It reflects the ability of find EGFR mutation. Specificity is the numerical ratio of true wild type ones to the predicted wild type ones by the model. It reflects the ability of model to identify non-EGFR mutation. Accuracy was used to evaluate the correct proportion of the model on all samples. The StackPET-CT had the highest AUC and significantly outperformed SECT and SEPET in the training data set (StackPET-CT vs. SECT: p<0.0001; StackPET-CT vs. SEPET: p<0.0001) (Table 2). There was the same trend in the testing data set, but the differences between StackPET-CT and SEPET were not significant (StackPET-CT vs. SECT: p=0.0056<0.05; StackPET-CT vs. SEPET: p=0.061) (Table 3). The StackPET-CT also had the highest specificity, accuracy, and a relatively high and stable sensitivity in both training and testing data set. There was no difference between the predictive performance of SECT and SEPET in training data set (p=0.70) and testing data set (p=0.74).
TABLE 2
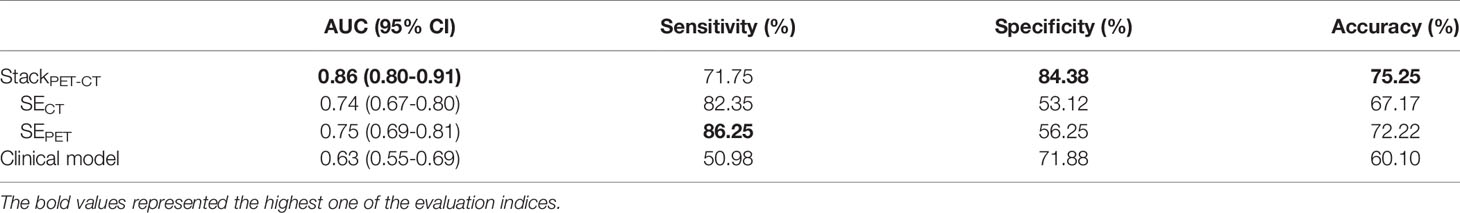
Table 2 Predictive performance of different models in the training data set.
TABLE 3
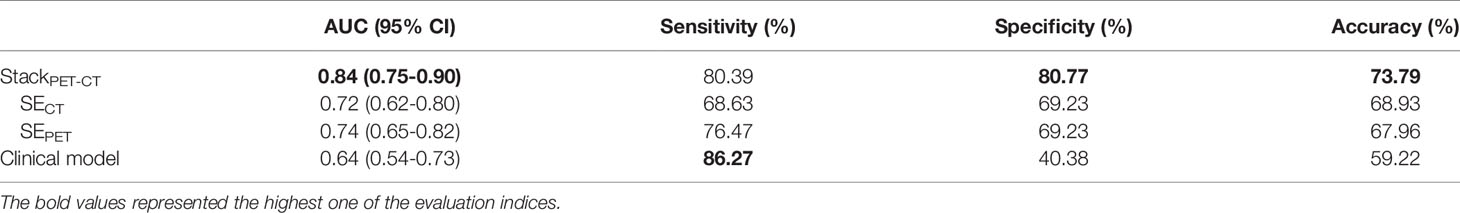
Table 3 Predictive performance of different models in the testing data set.
Comparison Between the Deep Learning Models and Clinical Model
An SVM model with linear kernel was used to build the clinical model. The clinical model included sex and smoking history, which were significantly different between Mut and WT group in training and testing data set. The StackPET-CT outperformed clinical model in both training and testing data set (Train: StackPET-CT vs. clinical model: p<0.0001; Test: StackPET-CT vs. clinical model: p=0.0022<0.05). The performance of SECT and SEPET was higher than the clinical model in both training and testing data set. However, only the differences between SECT and clinical model, SEPET and clinical model in training data set were significant (Train: SECT vs. clinical model: p=0.019<0.05; SEPET vs. clinical model: p=0.0044<0.05; Test: SECT vs. clinical model: p=0.32; SEPET vs. clinical model: p=0.13). We also build a stacking model (StackPET-CT-Clinical) that combines the SECT, SEPET, and clinical model with SVM. However, the performance of this model was not significantly improved compared with the StackPET-CT (Training AUC: 0.85, 95% CI 0.79-0.90; Testing AUC: 0.83, 95% CI 0.75-0.90). Figure 4 shows the ROC curve of StackPET-CT, SECT, SEPET, and clinical model in the training and testing data set.
FIGURE 4
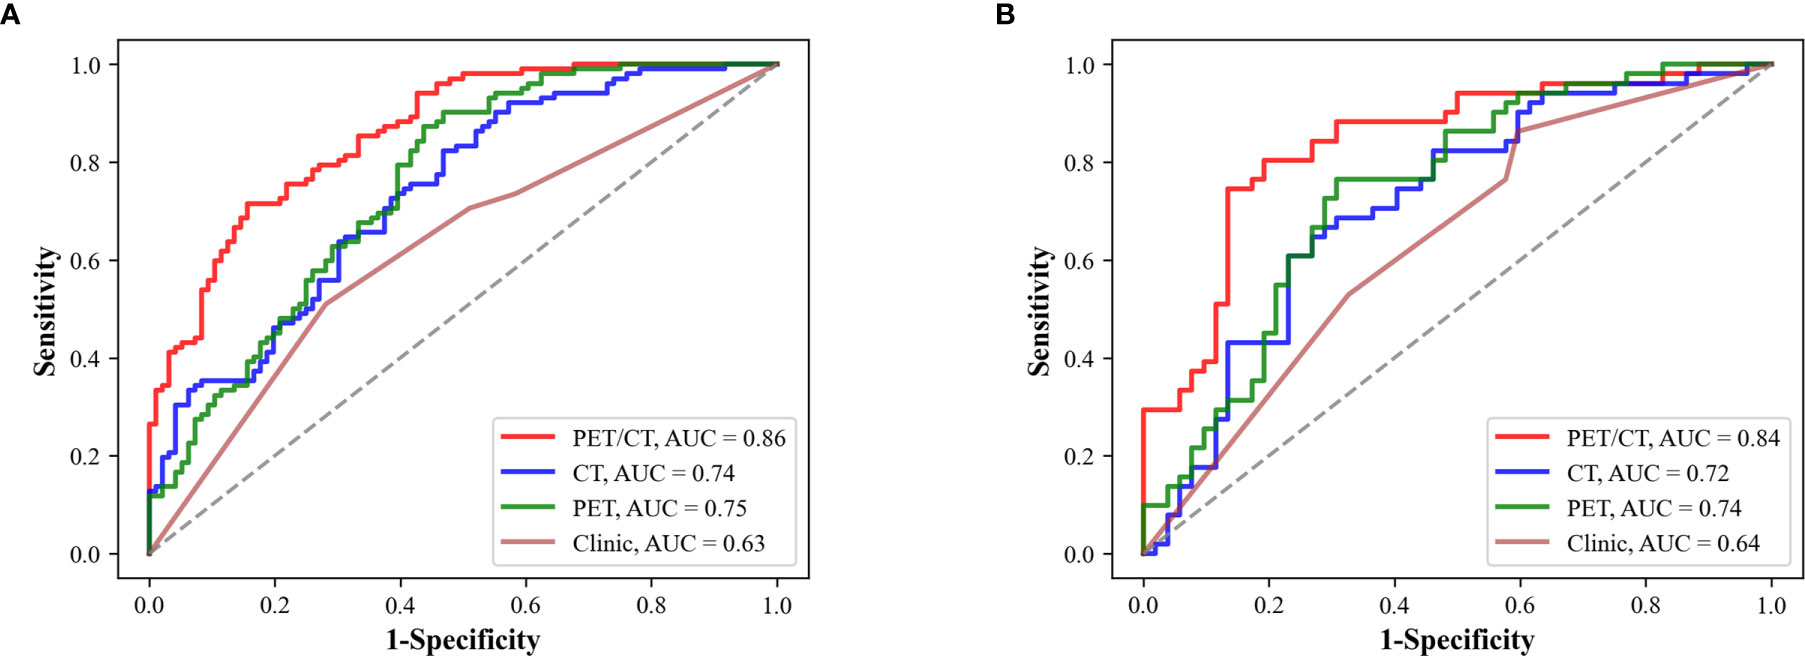
Figure 4 Predictive performance of SECT, SEPET, StackPET-CT, and clinical model. (A) The performance of different models in the training data set. (B) The performance of the models in the testing data set. StackPET-CT had the highest AUC in the training and testing data set.
Suspicious Area Discovered by Deep Learning Models
Figure 5 showed the predictive process of SECT and SEPET. Red area is the suspicious areas that deep learning models mainly focused on in the process of predicting EGFR mutation status. The suspicious areas were various among different tumors. In Figure 5A, SECT considered these tumors as EGFR mutant ones by the patterns of areas near the edge of the tumor and the ground-glass area. While in Figure 5B, SECT explains these tumors as wild-type ones based on the pattern of central areas. Similarly, SEPET could determine whether the tumor was EGFR mutant or wild-type based on the pattern of suspicious area with high or low FDG uptake. In addition, some lung tissues in CT images also attracted the attention of SECT, but the main focus was still on the tumor area.
FIGURE 5
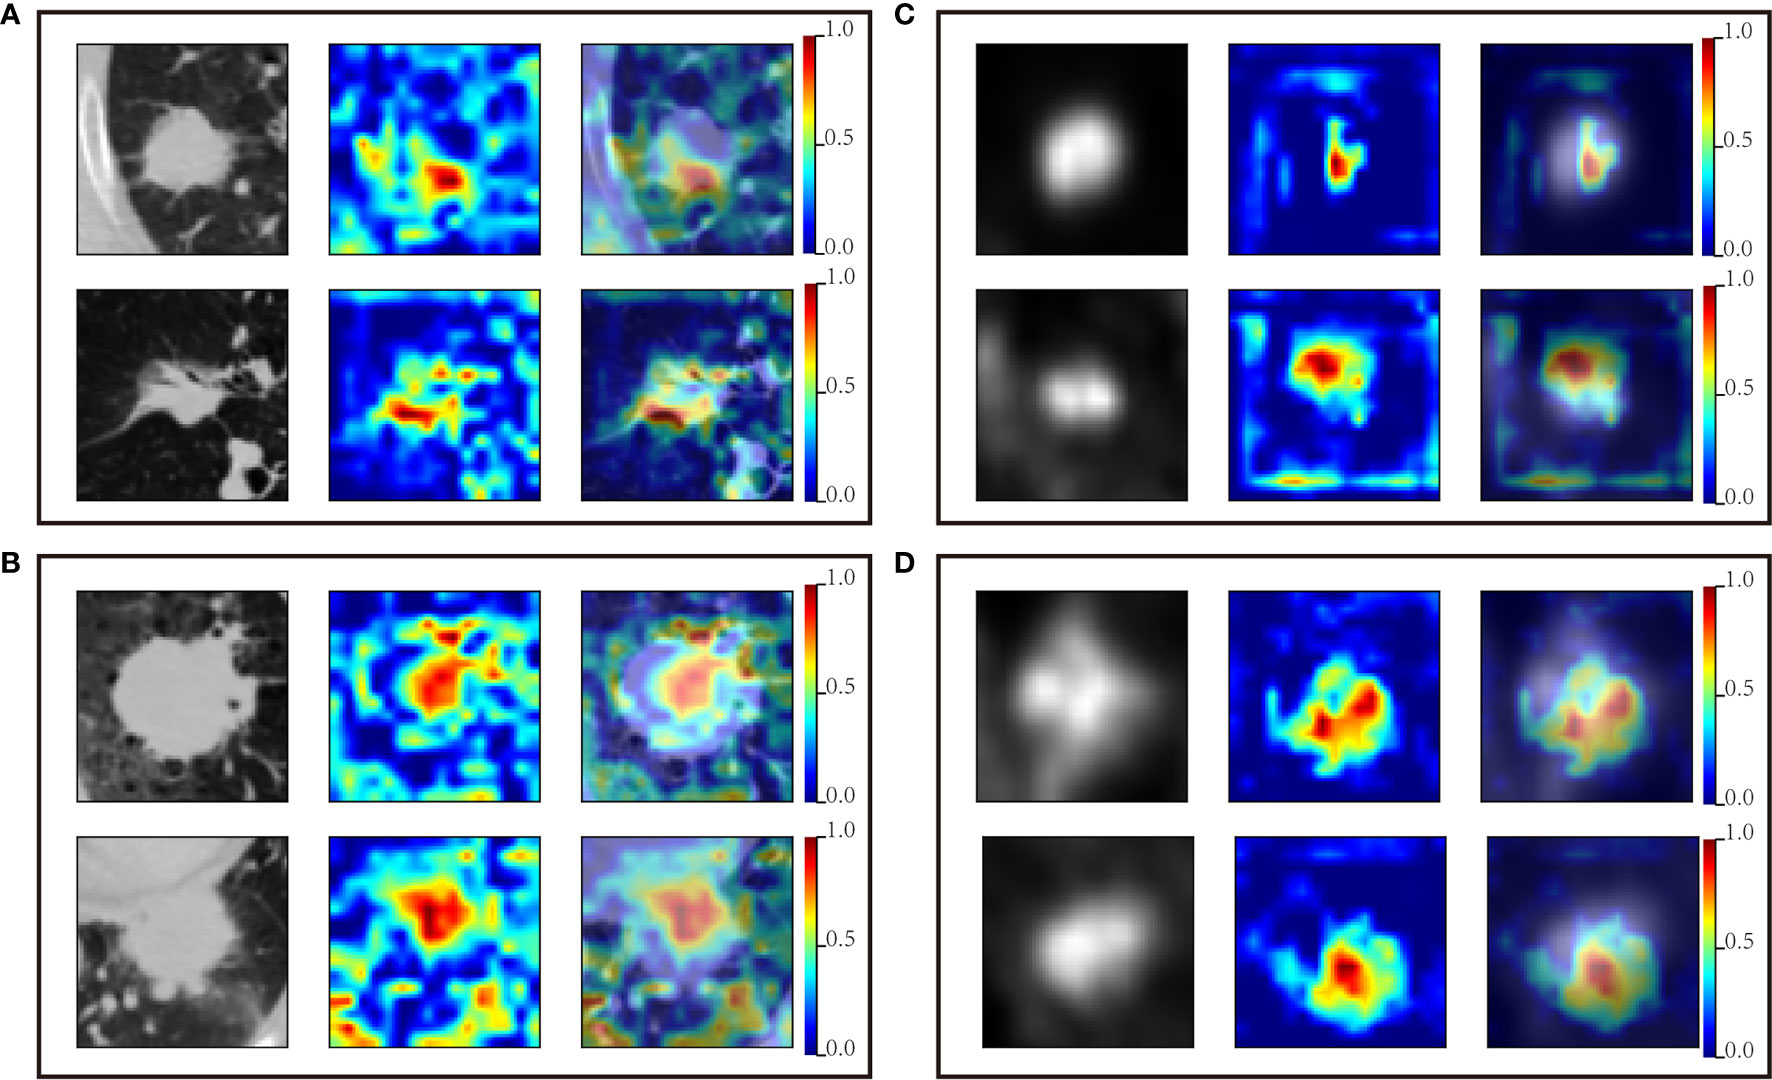
Figure 5 Suspicious areas generated by SECT and SEPET. The first column is the original PET or CT image; the second column is the attention map for classifying EGFR mutation status; the third column is the image fusing original image and the attention map. (A) CT images predicted as EGFR mutation by the SECT. (B) CT images predicted as wild-type EGFR by the SECT. (C) PET images predicted as EGFR mutation by the SEPET. (D) PET images predicted as wild-type EGFR by the SEPET.
Discussion
For the patients with advanced pulmonary adenocarcinoma, platinum-based chemotherapy supplemented with local radiotherapy remains the major treatment. Compared with traditional treatment, molecule-targeted drugs represented by EGFR-TKI have significantly improved the prognosis of patients with advanced lung cancer. EGFR mutation status is critical to the efficacy of EGFR-TKI. In this study, we developed a stacking model based on SE-ResNet using non-invasive 18F-FDG PET/CT images to predict EGFR mutation status for patients with lung adenocarcinoma. After the integration of PET and CT image information with stacked generalization, the performance has been obviously improved than single modality model.
Previous studies mainly used the clinical characteristics, conventional metabolic parameters, and radiomics features of 18F-FDG PET/CT to predict EGFR mutation status in patients with lung cancer, such as tumor margin, CEA level, smoking history, and SUVmax (35). However, the clinical features and metabolic parameters could only reflect few information of the tumors. And the differences of conventional metabolic parameters between EGFR mutation and wild-types were controversial, leading to the unsatisfactory predictive performance (35–37). With the advent of radiomic method, the utilization of information in images has been significantly improved. Radiomic method could obtain more and quantified information of tumors by extracting features from the images. Zhang et al. combined the clinical and radiomic features with machine learning algorithms to predict EGFR mutation status, and AUC reached 0.827 (38). They also found that the radiomic features of EGFR mutation representing tumor heterogeneity were higher than wild-types, similar to the result of Zhang et al. (39). Although radiomic method has significantly improved the predictive performance, precise manual delineation of tumor required rich clinic experience, and a lot of time, which increase the pressure of radiologists.
With the emergency of deep learning algorithm, this problem has been solved to a large extent. Deep learning algorithm could predict EGFR mutations by automatically extracting and integrating features, which only requires the users to define an approximate location of tumors. It could provide more information, which was highly related to EGFR mutation than radiomic method and clinical features with an end-to-end training process (19, 21). In this study, the prediction of EGFR mutation status was mainly based on the tumor area, similar to the result of previous studies (19, 22). For CT images, because of the similar density of some tumor tissue and the lung structure, such as pulmonary blood vessels, the lung tissue surrounding the tumor also attracted the attention of the SECT to a certain extent. It may be the reason that the performance of SECT was inferior to Wang et al. model, which was trained with contrast-enhanced CT images. Nevertheless, SECT could still mainly focus on the tumor. This phenomenon was relative rare in PET images because of the obvious difference between the FDG uptake of tumor lesion and surrounding lung tissue. This may also be the reason that the performance of SEPET was better than SECT.
Previous studies have shown that integrating multi-modal information could significantly improve predictive performance (22, 40). Considering that the registration of PET and CT images has certain difficulties in advanced lung cancer patients with poor lung function, we performed stacked generalization to integrate the information in PET and CT images. Stacked generalization can be viewed as a means of collectively using several classifiers to estimate their own generalizing biases, and then filter out those biases (28). Traditional stacking is a model with hierarchical structures that is generally built for a same data set. Previous studies have proven that the stacking model could perform at least as well as the best based classifier included in the ensemble (41, 42). And the performance of stacking model will be gradually improved at the increase of the diversity of the based classifiers. In this study, we focused on another form to implement stacked generalization that integrate two base models trained with different data sets, which were different aspects of the same object. After integrating the information of PET and CT images in this method, the AUC was improved from 0.72 and 0.74 to 0.84, similar to the results of Mu et al, further proving that multi-modal fusion could further improve the predicting performance. This result also indicated that stacking strategy is also suitable for the combination of models built with different aspects of the same object.
There was still some limitation in our study. First, because of the random sampling error, the lesions in the training data set are mainly located in left lobes, and most of the lesions in the test data set are located in the right lobe. Nevertheless, the error will not significantly impact the performance of the deep learning models, because the deep learning model uses the local primary lung tumor images as the data, which does not contain the location information of lesions. Second, the performance of StackPET-CT-Clinical has not been further improved compared to StackPET-CT. The reason is that in this strategy, a significant improvement of the meta-classifier performance requires the relatively good and consistent performance of the base models, whereas the clinical model was not as good as SECT and SEPET, resulting in no further improvement in the performance of StackPET-CT-Clinical. Building clinical models with more and effective clinical features may solve this problem. Third, the deep learning models were trained with 2D axial images. Training the model with 3D imaging data through multi-view may further improve the predicting performance. Besides, the CT and PET images used in this study are thick-slice, and the blood supply of the tumor is not considered. Further study with thin-slice enhanced CT may further improve the performance of deep learning models. Lastly, it was a single-center study with a small sample size, which only included Asian population with a relatively high percentage of EGFR mutation. The limited sample size may be the reason of insignificant difference between the performance of clinical model and SECT, SEPET in testing data set. The deep learning models require larger and more diverse data set to be fine-tuned and needs to be further tested in larger cohorts. A further multi-center study with a large sample size and multiple races may improve the generalization of the model to a certain extent.
In conclusion, we developed a deep learning-based model using 18F-FDG PET/CT images to predict the EGFR mutation status in patients with lung adenocarcinoma. The stacking strategy could effectively integrate the information which was extracted from CT and PET images by the SE-ResNet. The stacking model showed the potential to help clinicians making decision automatically and non-invasively by identifying suitable advanced patients with lung adenocarcinoma for EGFR‐TKI therapy.
Data Availability Statement
The data sets analyzed during the current study are not publicly available for patient privacy purposes but are available from the corresponding author on reasonable request.
Ethics Statement
The studies involving human participants were reviewed and approved by Tianjin Medical University Cancer Hospital Institutional Ethics Committee. The patients/participants provided their written informed consent to participate in this study.
Author Contributions
DD, WX, and GY together designed the study. GY programmed the deep-learning based model and wrote the manuscript. ZW prepared the data samples and conducted research on CNN. YS conducted the statistical analysis. XL, YC, LZ, and QS collected the patient images, made the doctor diagnosis, conducted the pathology analysis, and performed image segmentation. WX also critically reviewed the manuscript. All authors contributed to the article and approved the submitted version.
Funding
This work was supported by grants from the National Natural Science Foundation of China (Grant Nos. 81601377, 81501984, and 2018ZX09201015) and the Tianjin Natural Science Fund (Grant Nos. 16JCZDJC35200, 17JCYBJC25100, 18PTZWHZ00100, and H2018206600).
Conflict of Interest
The authors declare that the research was conducted in the absence of any commercial or financial relationships that could be construed as a potential conflict of interest.
Acknowledgments
The authors would like to thank Wengui Xu for the study design and editing the draft of the manuscript.
Abbreviations
SECT, Squeeze-and-Excitation Residual Network trained with CT images; SEPET, Squeeze-and-Excitation Residual Network trained with PET images; StackPET-CT, the model integrating the results of Squeeze-and-Excitation Residual Network trained with CT images and Squeeze-and-Excitation Residual Network trained with PET images in decision level; StackPET-CT-Clinical, the model integrating the results of clinical model, Squeeze-and-Excitation Residual Network trained with CT images and Squeeze-and-Excitation Residual Network trained with PET images in decision level.
References
1. Torre LA, Siegel RL, Jemal A. Lung Cancer Statistics. Adv Exp Med Biol (2016) 893:1–19. doi: 10.1007/978-3-319-24223-1_1
2. Bray F, Ferlay J, Soerjomataram I, Siegel RL, Torre LA, Jemal A. Global Cancer Statistics 2018: GLOBOCAN Estimates of Incidence and Mortality Worldwide for 36 Cancers in 185 Countries. CA Cancer J Clin (2018) 68:394–424. doi: 10.3322/caac.21492
3. Ettinger DS, Aisner DL, Wood DE, Akerley W, Bauman J, Chang JY, et al. NCCN Guidelines Insights: Non-Small Cell Lung Cancer, Version 5.2018. J Natl Compr Canc Netw (2018) 16:807–21. doi: 10.6004/jnccn.2018.0062
4. Maemondo M, Inoue A, Kobayashi K, Sugawara S, Oizumi S, Isobe H, et al. Gefitinib or Chemotherapy for Non-Small-Cell Lung Cancer With Mutated EGFR. N Engl J Med (2010) 362:2380–8. doi: 10.1056/NEJMoa0909530
5. Sequist LV, Yang JC, Yamamoto N, O'Byrne K, Hirsh V, Mok T, et al. Phase III Study of Afatinib or Cisplatin Plus Pemetrexed in Patients With Metastatic Lung Adenocarcinoma With EGFR Mutations. J Clin Oncol (2013) 31:3327–34. doi: 10.1200/JCO.2012.44.2806
6. Mok TS, Wu YL, Thongprasert S, Yang CH, Chu DT, Saijo N, et al. Gefitinib or Carboplatin-Paclitaxel in Pulmonary Adenocarcinoma. N Engl J Med (2009) 361:947–57. doi: 10.1056/NEJMoa0810699
7. Loughran CF, Keeling CR. Seeding of Tumour Cells Following Breast Biopsy: A Literature Review. Br J Radiol (2011) 84:869–74. doi: 10.1259/bjr/77245199
8. Kwon W, Howard BA, Herndon JE, Patz EF Jr. FDG Uptake on Positron Emission Tomography Correlates With Survival and Time to Recurrence in Patients With Stage I Non-Small-Cell Lung Cancer. J Thorac Oncol (2015) 10:897–902. doi: 10.1097/JTO.0000000000000534
9. Higashi K, Ueda Y, Arisaka Y, Sakuma T, Nambu Y, Oguchi M, et al. 18f-FDG Uptake as a Biologic Prognostic Factor for Recurrence in Patients With Surgically Resected Non-Small Cell Lung Cancer. J Nucl Med (2002) 43:39–45.
10. Xu N, Wang M, Zhu Z, Zhang Y, Jiao Y, Fang W. Integrated Positron Emission Tomography and Computed Tomography in Preoperative Lymph Node Staging of non-Small Cell Lung Cancer. Chin Med J (Engl) (2014) 127:607–13. doi: 10.3760/cma.j.issn.0366-6999.20131691
11. Makinoshima H, Takita M, Matsumoto S, Yagishita A, Owada S, Esumi H, et al. Epidermal Growth Factor Receptor (EGFR) Signaling Regulates Global Metabolic Pathways in EGFR-Mutated Lung Adenocarcinoma. J Biol Chem (2014) 289:20813–23. doi: 10.1074/jbc.M114.575464
12. Makinoshima H, Takita M, Saruwatari K, Umemura S, Obata Y, Ishii G, et al. Signaling Through the Phosphatidylinositol 3-Kinase (PI3K)/Mammalian Target of Rapamycin (mTOR) Axis Is Responsible for Aerobic Glycolysis Mediated by Glucose Transporter in Epidermal Growth Factor Receptor (EGFR)-Mutated Lung Adenocarcinoma. J Biol Chem (2015) 290:17495–504. doi: 10.1074/jbc.M115.660498
13. Yip SS, Kim J, Coroller TP, Parmar C, Velazquez ER, Huynh E, et al. Associations Between Somatic Mutations and Metabolic Imaging Phenotypes in Non-Small Cell Lung Cancer. J Nucl Med (2017) 58:569–76. doi: 10.2967/jnumed.116.181826
14. Rios Velazquez E, Parmar C, Liu Y, Coroller TP, Cruz G, Stringfield O, et al. Somatic Mutations Drive Distinct Imaging Phenotypes in Lung Cancer. Cancer Res (2017) 77:3922–30. doi: 10.1158/0008-5472.CAN-17-0122
15. Aerts HJ. The Potential of Radiomic-Based Phenotyping in Precision Medicine: A Review. JAMA Oncol (2016) 2:1636–42. doi: 10.1001/jamaoncol.2016.2631
16. Orlhac F, Soussan M, Maisonobe JA, Garcia CA, Vanderlinden B, Buvat I. Tumor Texture Analysis in 18F-FDG PET: Relationships Between Texture Parameters, Histogram Indices, Standardized Uptake Values, Metabolic Volumes, and Total Lesion Glycolysis. J Nucl Med (2014) 55:414–22. doi: 10.2967/jnumed.113.129858
17. Jemaa S, Fredrickson J, Carano RAD, Nielsen T, de Crespigny A, Bengtsson T. Tumor Segmentation and Feature Extraction From Whole-Body FDG-PET/CT Using Cascaded 2D and 3D Convolutional Neural Networks. J Digit Imaging (2020). doi: 10.1007/s10278-020-00341-1
18. Singadkar G, Mahajan A, Thakur M, Talbar S. Deep Deconvolutional Residual Network Based Automatic Lung Nodule Segmentation. J Digit Imaging (2020) 33:678–84. doi: 10.1007/s10278-019-00301-4
19. Wang S, Shi J, Ye Z, Dong D, Yu D, Zhou M, et al. Predicting EGFR Mutation Status in Lung Adenocarcinoma on Computed Tomography Image Using Deep Learning. Eur Respir J (2019) 53. doi: 10.1183/13993003.00986-2018
20. Wang S, Liu Z, Rong Y, Zhou B, Bai Y, Wei W, et al. Deep Learning Provides a New Computed Tomography-Based Prognostic Biomarker for Recurrence Prediction in High-Grade Serous Ovarian Cancer. Radiother Oncol (2019) 132:171–7. doi: 10.1016/j.radonc.2018.10.019
21. Zhao W, Yang J, Ni B, Bi D, Sun Y, Xu M, et al. Toward Automatic Prediction of EGFR Mutation Status in Pulmonary Adenocarcinoma With 3D Deep Learning. Cancer Med (2019) 8:3532–43. doi: 10.1002/cam4.2233
22. Mu W, Jiang L, Zhang J, Shi Y, Gray JE, Tunali I, et al. Non-Invasive Decision Support for NSCLC Treatment Using PET/CT Radiomics. Nat Commun (2020) 11:5228. doi: 10.1038/s41467-020-19116-x
23. Kang SY, Moon BS, Kim HO, Yoon HJ, Kim BS. The Impact of Data-Driven Respiratory Gating in Clinical F-18 FDG PET/CT: Comparison of Free Breathing and Deep-Expiration Breath-Hold CT Protocol. Ann Nucl Med (2021) 35:328–37. doi: 10.1007/s12149-020-01574-4
24. Hu J, Shen L, Sun G, Albanie S. Squeeze-And-Excitation Networks, in: IEEE Transactions on Pattern Analysis and Machine Intelligence. (2019). doi: 10.1109/TPAMI.2019.2913372
25. Gong L, Jiang S, Yang Z, Zhang G, Wang L. Automated Pulmonary Nodule Detection in CT Images Using 3D Deep Squeeze-and-Excitation Networks. Int J Comput Assist Radiol Surg (2019) 14:1969–79. doi: 10.1007/s11548-019-01979-1
26. He K, Zhang X, Ren S, Sun J. eds. Deep Residual Learning for Image Recognition, in: 2016 IEEE Conference on Computer Vision & Pattern Recognition (CVPR). (2016) 27–30. doi: 10.1109/CVPR.2016.90
27. Jiang Y, Chen L, Zhang H, Xiao X. Breast Cancer Histopathological Image Classification Using Convolutional Neural Networks With Small SE-ResNet Module. PloS One (2019) 14:e0214587. doi: 10.1371/journal.pone.0214587
28. Wolpert DH. Stacked Generalization. Neural Networks (1992) 5:241–59. doi: 10.1016/S0893-6080(05)80023-1
29. Eibe IW, Witten IH, Frank E, Trigg L, Hall M, Holmes G, et al. Weka: Practical Machine Learning Tools and Techniques With Java Implementations. Acm Sigmod Record (2000) 31:76–7. doi: 10.1145/507338.507355
30. Paszke A, Gross S, Massa F, Lerer A, Bradbury J, Chanan G, et al. PyTorch: An Imperative Style, High-Performance Deep Learning Library arXiv [Preprint]. (2019). Available at: https://arxiv.org/abs/1912.01703.
32. He K, Zhang X, Ren S, Sun J. Delving Deep Into Rectifiers: Surpassing Human-Level Performance on ImageNet Classification. CVPR (2015). doi: 10.1109/ICCV.2015.123
33. Kingma D, Ba J. Adam: A Method for Stochastic Optimization, in: International Conference on Learning Representations. (2014). Available at: https://arxiv.org/abs/1412.6980.
34. Selvaraju RR, Cogswell M, Das A, Vedantam R, Parikh D, Batra D. (2017). Grad-CAM: Visual Explanations from Deep Networks via Gradient-Based Localization. Int J Comput Vis (2020) 128:336–59. doi: 10.1007/s11263-019-01228-7
35. Ko KH, Hsu HH, Huang TW, Gao HW, Shen DH, Chang WC, et al. Value of ¹⁸F-FDG Uptake on PET/CT and CEA Level to Predict Epidermal Growth Factor Receptor Mutations in Pulmonary Adenocarcinoma. Eur J Nucl Med Mol Imaging (2014) 41:1889–97. doi: 10.1007/s00259-014-2802-y
36. Cho A, Hur J, Moon YW, Hong SR, Suh YJ, Kim YJ, et al. Correlation Between EGFR Gene Mutation, Cytologic Tumor Markers, 18F-FDG Uptake in non-Small Cell Lung Cancer. BMC Cancer (2016) 16:224. doi: 10.1186/s12885-016-2251-z
37. Choi YJ, Cho BC, Jeong YH, Seo HJ, Kim HJ, Cho A, et al. Correlation Between (18)F-Fluorodeoxyglucose Uptake and Epidermal Growth Factor Receptor Mutations in Advanced Lung Cancer. Nucl Med Mol Imaging (2012) 46:169–75. doi: 10.1007/s13139-012-0142-z
38. Zhang M, Bao Y, Rui W, Shangguan C, Liu J, Xu J, et al. Performance of (18)F-FDG PET/CT Radiomics for Predicting EGFR Mutation Status in Patients With Non-Small Cell Lung Cancer. Front Oncol (2020) 10:568857. doi: 10.3389/fonc.2020.568857
39. Zhang J, Zhao X, Zhao Y, Zhang J, Zhang Z, Wang J, et al. Value of Pre-Therapy (18)F-FDG PET/CT Radiomics in Predicting EGFR Mutation Status in Patients With non-Small Cell Lung Cancer. Eur J Nucl Med Mol Imaging (2020) 47:1137–46. doi: 10.1007/s00259-019-04592-1
40. Song Z, Liu T, Shi L, Yu Z, Shen Q, Xu M, et al. The Deep Learning Model Combining CT Image and Clinicopathological Information for Predicting ALK Fusion Status and Response to ALK-TKI Therapy in non-Small Cell Lung Cancer Patients. Eur J Nucl Med Mol Imaging (2021) 48:361–71. doi: 10.1007/s00259-020-04986-6
41. Laan M, Dudoit S. Unified Cross-Validation Methodology For Selection Among Estimators and a General Cross-Validated Adaptive Epsilon-Net Estimator: Finite Sample Oracle Inequalities and Examples. UC Berkeley Division Biostatistics Working Paper Ser (2003).
Keywords: adenocarcinoma of lung, fluorodeoxyglucose F18, positron emission tomography computed tomography, deep learning, epidermal growth factor receptor
Citation: Yin G, Wang Z, Song Y, Li X, Chen Y, Zhu L, Su Q, Dai D and Xu W (2021) Prediction of EGFR Mutation Status Based on 18F-FDG PET/CT Imaging Using Deep Learning-Based Model in Lung Adenocarcinoma. Front. Oncol. 11:709137. doi: 10.3389/fonc.2021.709137
Received: 13 May 2021; Accepted: 01 July 2021;
Published: 22 July 2021.
Edited by:
Pasquale Pisapia, University of Naples Federico II, ItalyReviewed by:
Keith Eaton, University of Washington, United StatesElham Sajjadi, University of Milan, Italy
Copyright © 2021 Yin, Wang, Song, Li, Chen, Zhu, Su, Dai and Xu. This is an open-access article distributed under the terms of the Creative Commons Attribution License (CC BY). The use, distribution or reproduction in other forums is permitted, provided the original author(s) and the copyright owner(s) are credited and that the original publication in this journal is cited, in accordance with accepted academic practice. No use, distribution or reproduction is permitted which does not comply with these terms.
*Correspondence: Dong Dai, tjdaidong@163.com; Wengui Xu, wenguixy@yeah.net
†These authors have contributed equally to this work and share first authorship