 Ryoma Osumi
 Kengo Sugihara
 Makoto Yoshimoto1
 Kazuya Tokumura
 Eiichi Hinoi
- 1Department of Bioactive Molecules, Pharmacology, Gifu Pharmaceutical University, Gifu, Japan
- 2United Graduate School of Drug Discovery and Medical Information Sciences, Gifu University, Gifu, Japan
- 3Center for One Medicine Innovative Translational Research, Division of Innovative Modality Development, Gifu University, Gifu, Japan
Osteosarcoma stem cells (OSCs) contribute to the pathogenesis of osteosarcoma (OS), which is the most common malignant primary bone tumor. The significance and underlying mechanisms of action of proteoglycans (PGs) and glycosaminoglycans (GAGs) in OSC phenotypes and OS malignancy are largely unknown. This study aimed to investigate the role of PG/GAG biosynthesis and the corresponding candidate genes in OSCs and poor clinical outcomes in OS using scRNA-seq and bulk RNA-seq datasets of clinical OS specimens, accompanied by biological validation by in vitro genetic and pharmacological analyses. The expression of β-1,3-glucuronyltransferase 3 (B3GAT3), one of the genes responsible for the biosynthesis of the common core tetrasaccharide linker region of PGs, was significantly upregulated in both OSC populations and OS tissues and was associated with poor survival in patients with OS with high stem cell properties. Moreover, the genetic inactivation of B3GAT3 by RNA interference and pharmacological inhibition of PG biosynthesis abrogated the self-renewal potential of OSCs. Collectively, these findings suggest a pivotal role for B3GAT3 and PG/GAG biosynthesis in the regulation of OSC phenotypes and OS malignancy, thereby providing a potential target for OSC-directed therapy.
1 Introduction
Osteosarcoma (OS) is the most common primary malignant bone tumor with a high risk of bone and lung metastases (1–4). The incidence of OS shows a bimodal age distribution, peaking in adolescents and young adults, and adults older than 65 years, and is slightly more common in men than in women (5, 6). OS is characterized by marked malignancy, strong invasiveness, rapid disease progression, and a high mortality rate (7, 8). OS commonly occurs in the knee joint (the metaphysis of the long tubular bones: the distal femur and the proximal tibia) (9, 10). The 5-year survival rate of OS stands at approximately 70% in the absence of metastases and decreases to 30% in patients with metastatic disease (11, 12). The exact cell origin of OS remains to be defined; however, it is believed to be cells of the osteoblast lineage, ranging from mesenchymal stem cells (MSCs) to osteoblast progenitors (13, 14). Osteosarcoma stem cells (OSCs) are functionally delineated based on their intrinsic properties, including self-renewal potential and multilineage differentiation capacity (15). OSCs also play a pivotal role in tumor initiation, recurrence, metastasis, and chemoresistance (16). Accumulating evidence suggests that targeting OSCs is an efficacious strategy for improving OS treatment (17, 18). Therefore, understanding the underlying molecular mechanisms governing the function of OSCs is necessary for developing novel therapeutic strategies for OS.
All mammalian glycosaminoglycans (GAGs), except hyaluronan (HA), attach to core proteins to form proteoglycans (PGs) (19–21). PGs/GAGs are abundantly distributed on the cell surface and in the extracellular matrix (22). GAGs have various biological functions and play important roles in numerous physiological and pathological conditions (23–25). Among them, the biosynthesis of chondroitin sulfate (CS); dermatan sulfate (DS), which is derived from CS by C5-epimerization of the β-D-glucuronic acid residue; and heparan sulfate (HS) begins with the formation of a common tetrasaccharide linker region to the core protein, followed by repeated addition of disaccharide units (26–28). The biosynthesis of the tetrasaccharide linker region in CS, DS, and HS is initiated by the enzymatic transfer of xylose to specific serine residues located in the core proteins of PGs within the endoplasmic reticulum by xylosyltransferase-I (XylT-I) and -II (XylT-II), encoded by xylosyltransferase 1 (XYLT1) and XYLT2, respectively (29–31). Subsequently, two galactoses and a glucuronic acid are successively added to the xylose residues within the Golgi apparatus through the concerted actions of galactosyltransferase-I (GalT-I), galactosyltransferase-II (GalT-II), and glucuronyltransferase-I (GlcAT-I), which are encoded by β-1,4-galactosyltransferase 7 (B4GALT7), β-1,3-galactosyltransferase 6 (B3GALT6), and β-1,3-glucuronyltransferase 3 (B3GAT3), respectively (32, 33).
PGs/GAGs not only play fundamental and diverse roles in the progression, malignancy, metastasis, and refractoriness of various types of cancer, but are also implicated in the cellular properties of cancer stem cells (CSCs) in some cancers, including glioblastoma, triple-negative breast cancer, and colorectal cancer (34, 35). Although some studies have been conducted to understand the role of PGs/GAGs in the pathogenesis of OS, limited data are available on the significance of enzymes related to PG/GAG biosynthesis in OSCs and OS malignancy. This study aimed to investigate the role of PG/GAG biosynthesis and corresponding candidate genes in OSCs and poor clinical outcomes in OS by combining bioinformatics analysis of clinical OS specimens with independent cohorts and in vitro genetic and pharmacological analyses.
2 Materials and methods
2.1 scRNA-seq data analysis
We analyzed two scRNA-seq datasets (GSE152048 and GSE162454) (36, 37). The GSE152048 dataset included 11 patients (five men and six women, 11–38 years). The data of five patients with primary osteoblastic OS lesions were used in subsequent analyses. The GSE162454 dataset included six primary OS patients (four men and two women, 13–45 years). The data of all six patients were used in subsequent analyses.
Data were analyzed using the “Seurat” package (version 4.3.0.1) in R (version 4.3.0) (38–40). First, the data were read using the Read10X function. In the preprocessing of each dataset, cells with > 6,000 and < 300 expressed genes with more than 10% mitochondrial RNA counts were considered low-quality and filtered out. The gene expression levels of the remained cells were normalized by regressing mitochondrial mapping rates on glmGamPoi using the SCTransform function. To remove batch effects, integration of the five sample datasets in GSE152048, and the six sample datasets in GSE152048, was performed using the SelectIntegrationFeatures, PrepSCTIntegration, RunPCA, FindIntegrationAnchors, and IntegrateData functions. Accordingly, 59,738 cells in GSE152048 and 32,681 cells in GSE162454 were used for downstream analysis, respectively. For dimensional reduction, principal component analysis (PCA) and t-distributed stochastic neighbor embedding (t-SNE) were performed using the RunPCA and RunTSNE functions. To cluster cell populations, k.param nearest neighbors were calculated using the FindNeighbors function using the first 50 principal components. Clusters were identified using theFindClusters function at a resolution of 0.2. Each cluster was manually annotated based on violin plots of the expression of established cell-specific marker genes. Detailed information on these marker genes is provided in Figure 1C and Supplementary Figure 1B. Osteoblasts, proliferating cells, and MSCs were extracted as OS cells from the identified clusters (n = 26,249 in GSE152048, n = 7,650 in GSE162454).
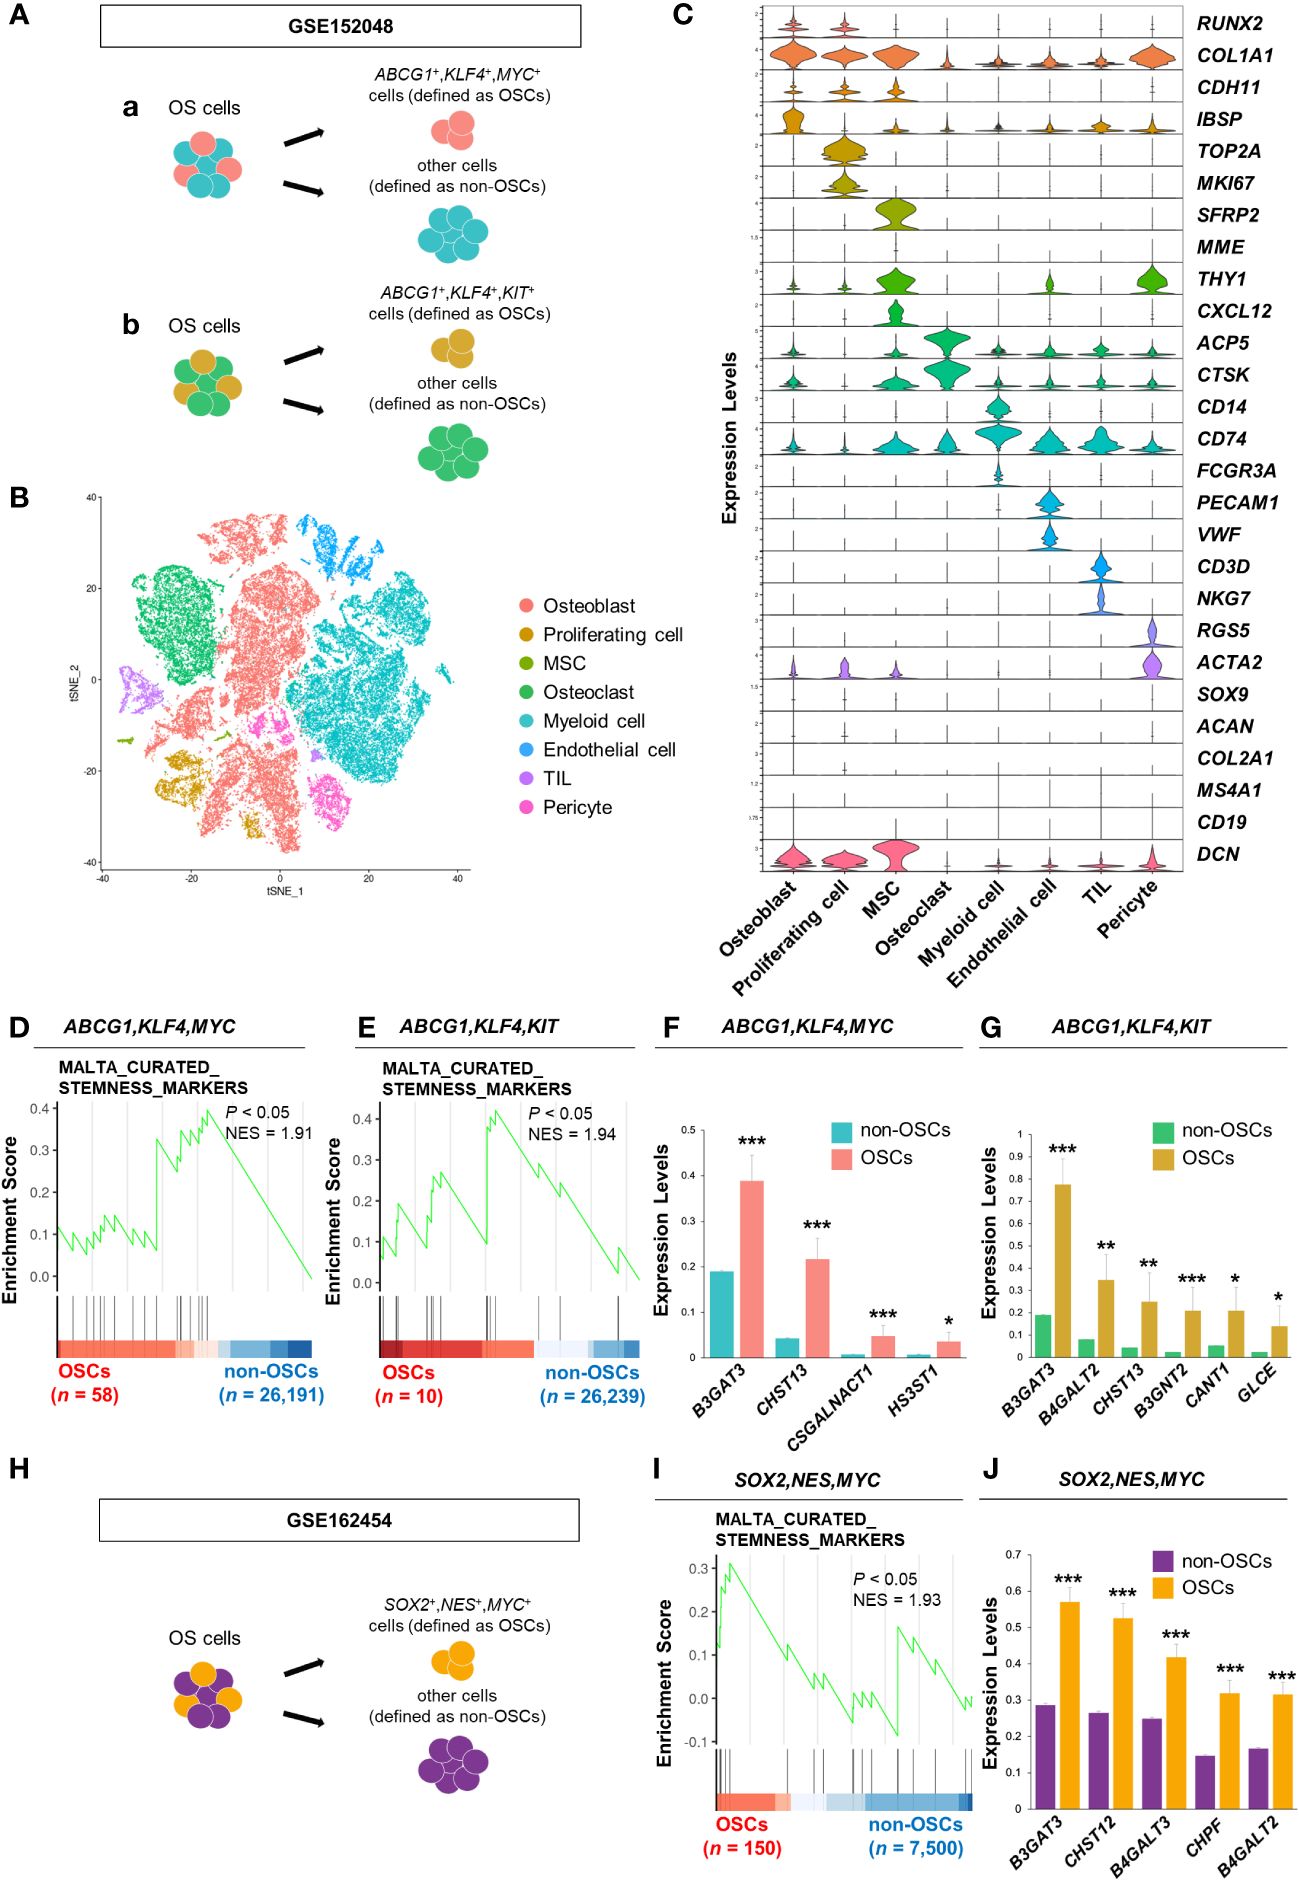
Figure 1 B3GAT3 is upregulated in the OSC population of patients with OS. (A) Schematic of the identification of the OSC population in GSE152048. (a) ABCG1, KLF4, and MYC co-expressing cells or (b) ABCG1, KLF4, and KIT co-expressing cells were defined as OSCs, respectively. (B) t-SNE plot of cell clusters classified in OS tissues. (C) Violin plots showing the normalized expression levels of 27 representative marker genes across 8 clusters. (D, E) Enrichment plot for a gene set related to “stemness” between OSCs ([D] ABCG1, KLF4, and MYC or [E] ABCG1, KLF4, and KIT co-expressing cells) and non-OSCs. (F, G) Barplot showing the expression levels of PG/GAG biosynthesis genes between OSCs ([F] ABCG1, KLF4, and MYC or [G] ABCG1, KLF4, and KIT co-expressing cells) and non-OSCs. (*P < 0.05, **P < 0.01, ***P < 0.001). (H) Schematic of the identification of the OSC population in GSE162454. SOX2, NES, and MYC co-expressing cells were defined as OSCs. (I) Enrichment plot for a gene set related to “stemness” between OSCs and non-OSCs. (J) Barplot showing the expression levels of PG/GAG biosynthesis genes between OSCs and non-OSCs. The top five most highly expressed genes in OSCs are shown (***P < 0.001).
OS cells were divided into two groups, OSCs and non-OSCs, for downstream analysis. In GSE152048, ABCG1, KLF4, and MYC co-expressing cells were defined as OSCs (n = 58) and others as non-OSCs (n = 26,191). Similarly, ABCG1, KLF4, and MYC co-expressing cells were defined as OSCs (n = 10) and others as non-OSCs (n = 26,239). In GSE162454, SOX2, NES, and MYC co-expressing cells were defined as OSCs (n = 150) and others as non-OSCs (n = 7,500).
Sixty-three human PG/GAG biosynthesis-related genes were obtained by integrating four gene sets (KEGG_GLYCOSAMINOGLYCAN_BIOSYNTHESIS_CHONDROITIN_SULFATE, KEGG_GLYCOSAMINOGLYCAN_BIOSYNTHESIS_HEPARAN_SULFATE, KEGG_GLYCOSAMINOGLYCAN_BIOSYNTHESIS_KERATAN_SULFATE, and WP_PROTEOGLYCAN_BIOSYNTHESIS) registered in the MSigDB database (http://gsea-msigdb.org/gsea/msigdb/index.jsp). Differentially expressed genes (DEGs) were identified among these 63 genes using Wilcoxon’s rank-sum test (P < 0.05) using the wilcoxauc function in the “presto” package (version 1.0.0). Gene Set Enrichment Analysis (GSEA) was performed using the GSEA function (minGSsize, 5; maxGSsize, 500; eps, 0; pvalueCutoff, 0.05) in the “clusterProfiler” package (version 4.8.3). The gene sets used in GSEA were obtained from the C2 and C5 collections in the MSigDB database using the msigdbr function in the “msigdbr” package (version 7.5.1). Gene sets with NES > 0 and P < 0.05 were considered significantly enriched. Visualization was performed using the gseaplot2 function in the “enrichplot” package (version 1.20.1).
2.2 Bulk RNA-seq data analysis
We analyzed the RNA-seq dataset (PRJNA539828) obtained from OS (n = 16) and non-tumor (n = 4) tissues from patients with OS (41). Fastq files were downloaded using “SRA Toolkit” (version 3.0.1). Trimming was performed using “Trim_Galore” (version 0.6.7). Quality control after trimming was performed using “FASTQC” (version 0.12.1). Mapping to the hg38 human genome assembly was performed using “STAR” (version 2.7.10b). Expression levels were calculated from the bam files generated by mapping using “RSEM” (version 1.3.3). GSEA was performed using the “clusterProfiler” package (version 4.8.3) in R (version 4.3.0). Visualization of the GSEA results was performed using the “enrichplot” package (version 1.20.3).
2.3 Survival analysis
Clinical data from patients with OS were downloaded from the TARGET-OS database. Patients were divided into high and low expression groups based on median gene expression values. Survival analysis was conducted with the log-rank test using the “survival” package (version 4.8.3). Kaplan–Meier curves were plotted using the “survminer” package (version 0.4.9).
2.4 Cell culture
HEK293T cells were obtained from the RIKEN Cell Bank (Saitama, Japan) and cultured in DMEM (FUJIFILM Wako Pure Chemical) supplemented with 10% FBS (Hyclone) and 1% penicillin/streptomycin (Thermo Fisher Scientific) at 37°C in 5% CO2 (42). The patient-derived OS cell line 143B was obtained from the ATCC (Manassas, USA) and cultured in adherent medium containing DMEM supplemented with 10% FBS, 110 μg/mL sodium pyruvate (FUJIFILM Wako Pure Chemical), and 1% penicillin/streptomycin. Both cell types were cultured in tissue culture dishes (SARSTEDT) to ensure optimal adherence and expansion. To enrich stem-like cells, 143B cells were harvested using trypsin (BD Bioscience) and EDTA (FUJIFILM Wako Pure Chemical), then cultured in osteosphere medium containing DMEM/F12 (FUJIFILM Wako Pure Chemical) supplemented with 20 ng/mL recombinant human EGF (FUJIFILM Wako Pure Chemical), 20 ng/mL recombinant human basic FGF (FUJIFILM Wako Pure Chemical), B27 supplement without vitamin A (Gibco), GlutaMAX (Thermo Fisher Scientific), and 1% penicillin/streptomycin. Under these conditions, the cells were incubated in Ultra-Low Attachment Surface culture dishes (Corning). To assess the differentiation potential of OSCs, the cells were transferred from osteosphere to adherent medium, and from Ultra-Low Attachment Surface to tissue culture dishes, to promote adherence and differentiation.
2.5 Lentiviral transfection
To introduce vectors into HEK293T cells, the calcium phosphate method was employed (43). Lentiviral vectors containing expression constructs, pRRE and pREV packaging plasmids, and VSVG envelope plasmids were transfected into HEK293T cells for packaging. After 48 h of transfection, viral supernatants were harvested and subsequently incubated with 143B cells for 24 h. Following this, 143B cells were selected by culturing them for 4 days in the presence of 0.5 μg/mL puromycin prior to their use in experiments. Plasmid pLKO.1-shB3GAT3 (TRCN0000035610) was purchased from Sigma-Aldrich; pLKO.1 puro plasmid (#8453) was purchased from Addgene.
2.6 Sphere formation and limiting dilution assay
For sphere formation assay, 143B cells (1,000 cells) were seeded in ultra-low attachment 96-well plates (Corning) and cultured in osteosphere medium supplemented with 1% methylcellulose (FUJIFILM Wako Pure Chemical). The number of spheres was calculated on the fifth day using a BZ-X800 microscope (KEYENCE). Sphere formation ability was assessed by enumerating the quantity of spheres with a diameter > 30 μm (44). For limiting dilution assay, cells were seeded in 96-well plates at a density of 1, 5, 10, 20, 40, or 80 cells/well with five replicates per density. The presence of spheres in each well was determined after 5 days. Wells containing spheres with a diameter > 50 μm were considered positive, while those without spheres were considered negative. The frequency of sphere formation was assessed using an extreme limiting dilution algorithm (ELDA software; http://bioinf.wehi.edu.au/software/elda/).
2.7 Reverse transcription quantitative PCR
Total cellular RNA was isolated. cDNA was synthesized using reverse transcriptase and oligo-dT primers (45). RT-qPCR analysis was performed using gene-specific primers and THUNDERBIRD SYBR qPCR Mix (TOYOBO) on an MX3000P instrument (Agilent Technologies). mRNA expression levels were standardized using GAPDH as an internal control (46). The primer sequences used in this study are listed in the Supplementary Table.
2.8 Flow cytometry
143B cells (1,000,000 cells) were incubated with Fixable Viability Stain 780 (1:1000, #565388, BD) for 10 minutes at room temperature in the dark, followed by incubation with APC-CD133 (1:50, #566597, BD) for 30 minutes at 4°C in the dark. Samples were analyzed using a CytoFLEX S (Beckman).
2.9 Xenograft model of OS
Animal experiments were performed in accordance with the Guidelines for the Care and Use of Laboratory Animals of Gifu Pharmaceutical University. Four-week-old female BALB/c nu/nu mice were obtained from Japan SLC (Hamamatsu, Japan). Mice were injected subcutaneously with 5 × 10⁶ 143B cells. Tumor length and width were measured with calipers. Tumor volume was calculated as (length × width2)/2. Mice were euthanized before the tumor length exceeded 20 mm.
2.10 Statistical analysis
Unless otherwise specified, data are expressed as mean ± SE. Statistical significance was assessed using Student’s t-test. A P < 0.05 was considered statistically significant.
3 Results
3.1 B3GAT3 is upregulated in the OSC population of OS patient specimens
First, we analyzed a scRNA-seq dataset of clinical OS specimens deposited in the GEO database (GSE152048), to profile the properties of OSCs (Figure 1A). Eight clusters were identified through t-SNE analysis based on the genetic profiles of the cells (Figure 1B). Canonical markers were used to annotate the different cell types: osteoblasts (RUNX2+,COL1A1+,CDH11+,IBSP+), proliferating cells (TOP2A+,MKI67+), MSCs (SFRP2+,MME+,THY1+,CXCL12+), osteoclasts (ACP5+,CTSK+), myeloid cells (CD14+,CD74+,FCGR3A+), endothelial cells (PECAM1+,VWF+), tumor infiltrating lymphocytes (TILs; CD3D+,NKG7+), and pericytes (RGS5+,ACTA2+) (Figure 1C). Malignant cells were distinguished from non-malignant cells using CNV inference (data not shown). The OS cell population was further divided into two groups, OSCs and non-OSCs, based on the co-expression of three stem cell markers, ABCG1, KLF4, and MYC (Figure 1Aa). The enrichment of the gene set involved in “stemness” in OSCs was confirmed by GSEA (Figure 1D). Consistent results were obtained when another cell population with co-expression of stem cell markers (ABCG1, KLF4, and KIT) was defined as OSCs (Figures 1Ab, E), allowing us to define these cells as the OSC population. Under these experimental conditions, we identified DEGs related to the biosynthesis of PGs/GAGs between OSCs and non-OSCs. Sixty-three DEGs related to the biosynthesis of PGs/GAGs were screened, with four and six significantly upregulated genes in OSCs defined by co-expression of ABCG1/KLF4/MYC, and ABCG1/KLF4/KIT, respectively (Figures 1F, G). Among the significantly upregulated genes, B3GAT3, one of the genes responsible for the biosynthesis of the common core tetrasaccharide linker region of PGs (47), was the most highly expressed gene in both ABCG1/KLF4/MYC and ABCG1/KLF4/KIT OSC populations (Figures 1F, G).
To confirm the results obtained from GSE152048, we analyzed a different scRNA-seq dataset (GSE162454) (Supplementary Figures 1A, B). The OS cell population was divided into two groups, OSCs and non-OSCs, based on the co-expression of three stem cell markers, SOX2, NES, and MYC (Figure 1H). The enrichment of the gene set involved in “stemness” in OSCs was confirmed by GSEA (Figure 1I). Among the 63 genes related to the biosynthesis of PGs/GAGs, B3GAT3 was significantly upregulated in OSCs defined by co-expression of SOX2/NES/MYC (Figure 1J, Supplementary Figure 1C), with consistent results from two independent cohorts of clinical specimens.
3.2 B3GAT3 is associated with poor prognosis in patients with OS with high stem cell properties
Next, we determined the expression levels of genes related to the biosynthesis of the common core tetrasaccharide linker region of PGs in clinical OS tissues. The expression levels of B3GAT3, XYLT1, XYLT2, B4GALT7, and B3GALT6 were significantly upregulated in OS tissues compared to those in non-tumor tissues, according to the analysis of the bulk RNA-seq dataset (PRJNA539828) (Figure 2A). GSEA revealed significant enrichment of gene sets related to the “PG metabolic process”, “PG biosynthetic process”, and “GAG biosynthesis (HS)” (Figure 2B), which contain the above five PG biosynthesis genes. Contrary to the significant upregulation of B3GAT3 in OSC populations (Figures 1F, G, J), the expression levels of XYLT1, XYLT2, B4GALT7, and B3GALT6 did not differ significantly between OSCs and non-OSCs, even when OSC populations were defined under three different conditions (Figure 2C).
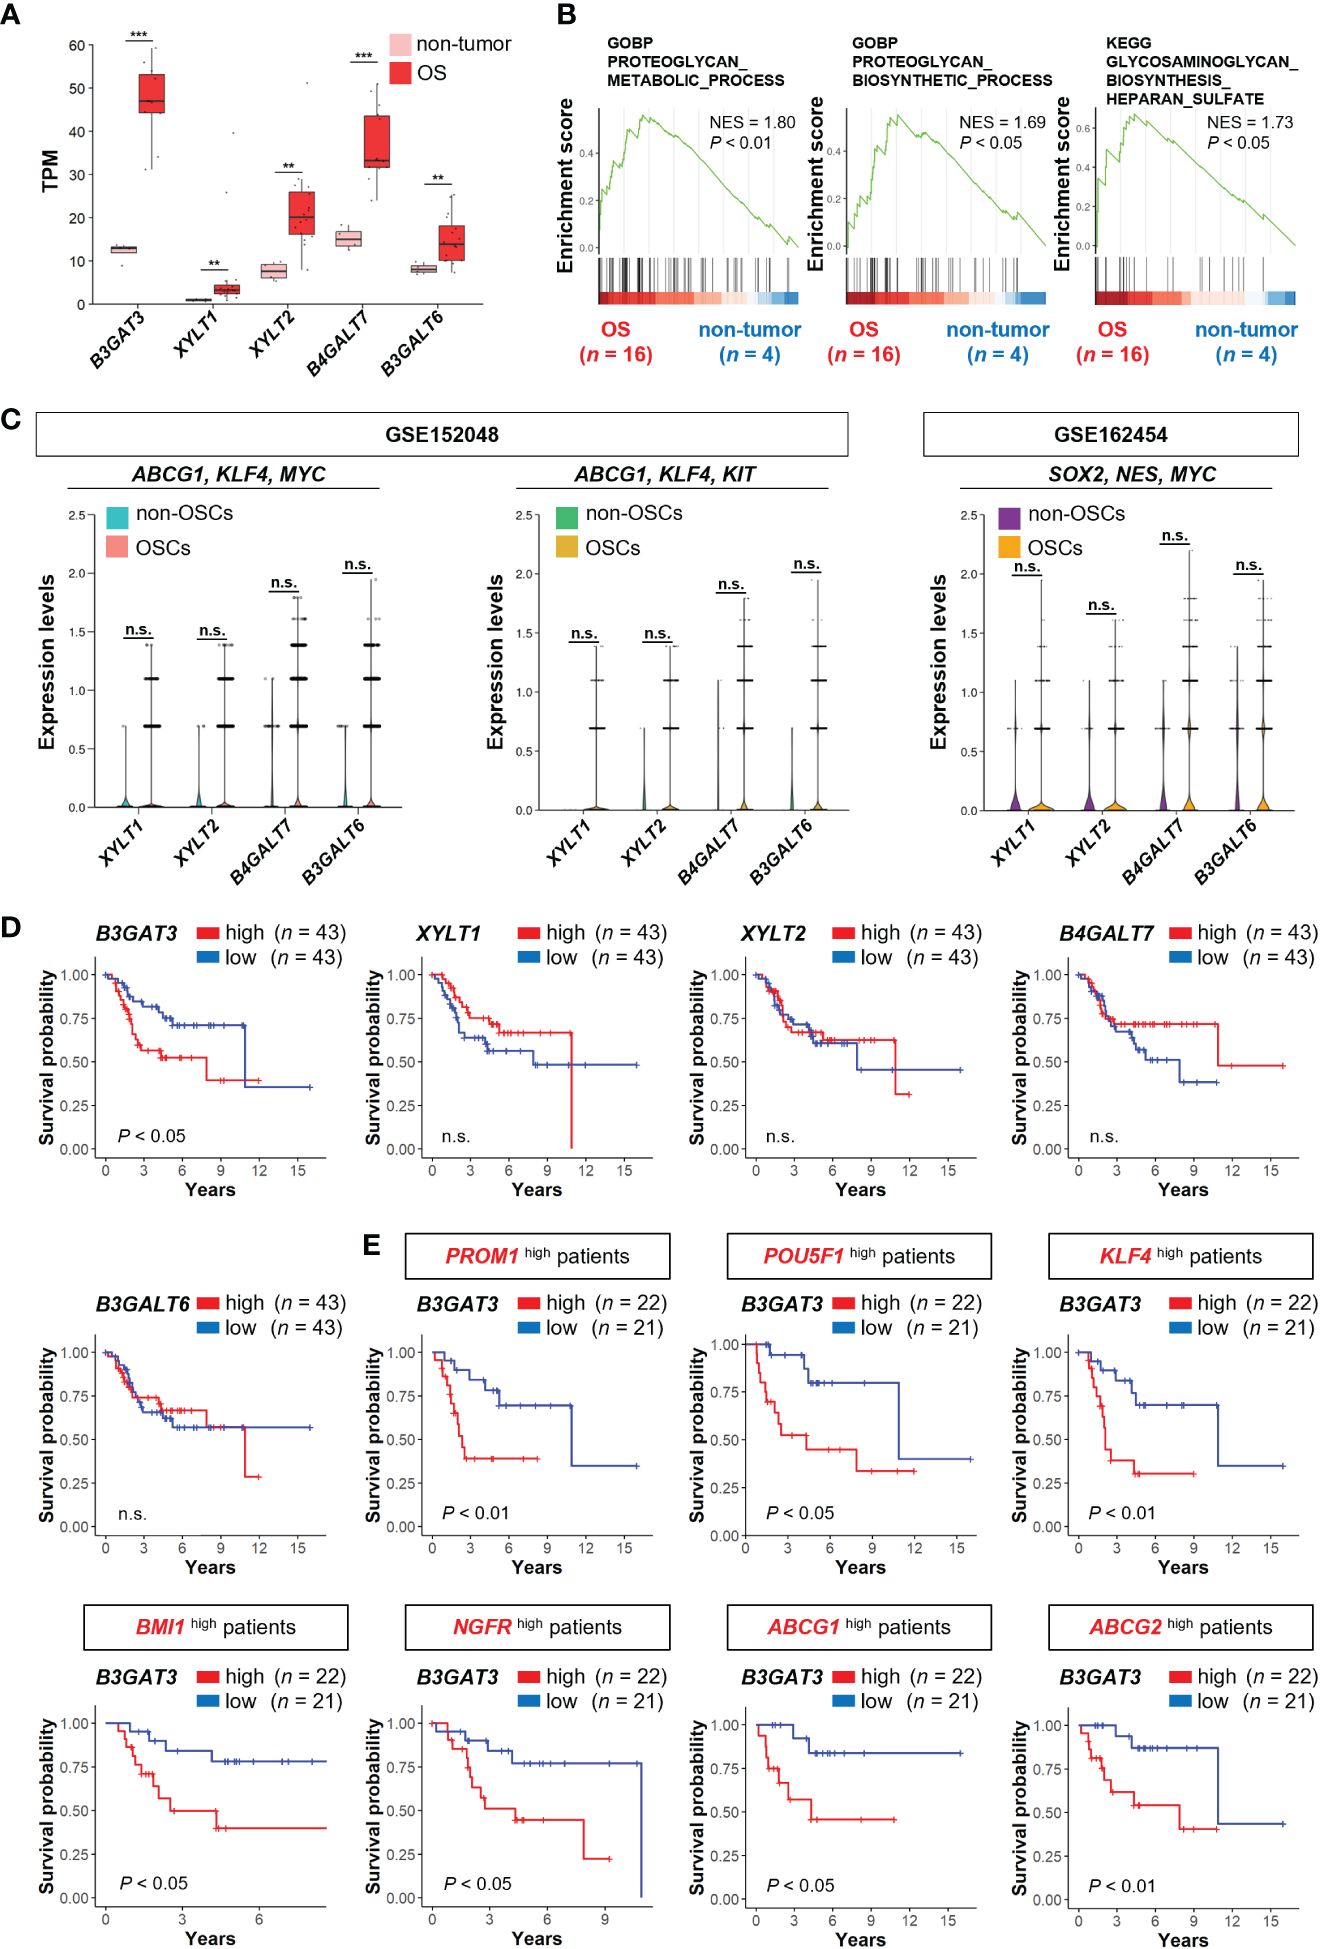
Figure 2 B3GAT3 is associated with poor prognosis in OS patients with high stemness. (A) The expression levels of B3GAT3, XYLT1, XYLT2, B4GALT7, and B3GALT6 in OS (n = 16) and non-tumor (n = 4) tissues using bulk RNA-seq dataset (PRJNA539828) (**P < 0.01, ***P < 0.001). (B) The enrichment plots for gene sets related to “PG metabolic process”, “PG biosynthetic process”, and “GAG biosynthesis” in OS (n = 16) and non-tumor (n = 4) tissues. (C) The expression levels of XYLT1, XYLT2, B4GALT7, and B3GALT6 in OSCs and non-OSCs using scRNA-seq datasets (GSE152048 and GSE162454). (D) Kaplan–Meier curves comparing patients with OS with high (n = 43) and low (n = 43) expression levels of B3GAT3, XYLT1, XYLT2, B4GALT7, and B3GALT6 respectively. (E) Kaplan–Meier curves comparing high (n = 22) and low (n = 21) B3GAT3 expression levels in patients with OS with high stemness. n.s., not significant.
Next, we assessed whether the expression levels of B3GAT3, XYLT1, XYLT2, B4GALT7, and B3GALT6 affected the survival of patients with OS using the TARGET-OS database. Kaplan–Meier analysis revealed that patients with OS with higher B3GAT3 expression had significantly shorter survival than those with lower B3GAT3 expression (Figure 2D). In contrast, the expression levels of XYLT1, XYLT2, B4GALT7, and B3GALT6 were not significantly correlated with the prognosis of patients with OS (Figure 2D). Given that only B3GAT3 expression was correlated with poor prognosis in patients with OS, we next assessed whether B3GAT3 expression was associated with poor prognosis in patients with OS harboring higher stem cell properties. Kaplan–Meier analysis demonstrated that high B3GAT3 expression was significantly associated with poor prognosis in patients with high expression of stemness markers, such as PROM1, POU5F1, KLF4, BMI1, NGFR, ABCG1, and ABCG2 (Figure 2E).
3.3 Targeting B3GAT3 impairs the self-renewal potential of 143B OS cells in vitro
To validate the results of the bioinformatics analysis, 143B cells were cultured under floating or adherent conditions, followed by determination of B3GAT3 expression (Figure 3A). First, we confirmed the stemness and tumorigenicity of 143B cells in vitro and in vivo as previously demonstrated (48, 49). Under floating condition, 143B cells formed tumorspheres and exhibited self-renewal potential in the sphere formation and limited dilution assays, respectively (Supplementary Figures 2A, B), along with higher expression levels of the stem cell markers, KLF4, ABCG1, SOX2, and BMI1 (Figure 3B). The proportion of CD133+ cells were markedly increased in 143B tumorspheres (Supplementary Figure 2C). 143B tumorspheres differentiated into 143B cells under adherent conditions (Supplementary Figure 2D). The tumorigenicity of 143B cells was confirmed in an orthotopic xenograft mouse model (Supplementary Figure 2E). Under these conditions, B3GAT3 expression was significantly upregulated in 143B tumorspheres compared to differentiated 143B cells (Figure 3C).
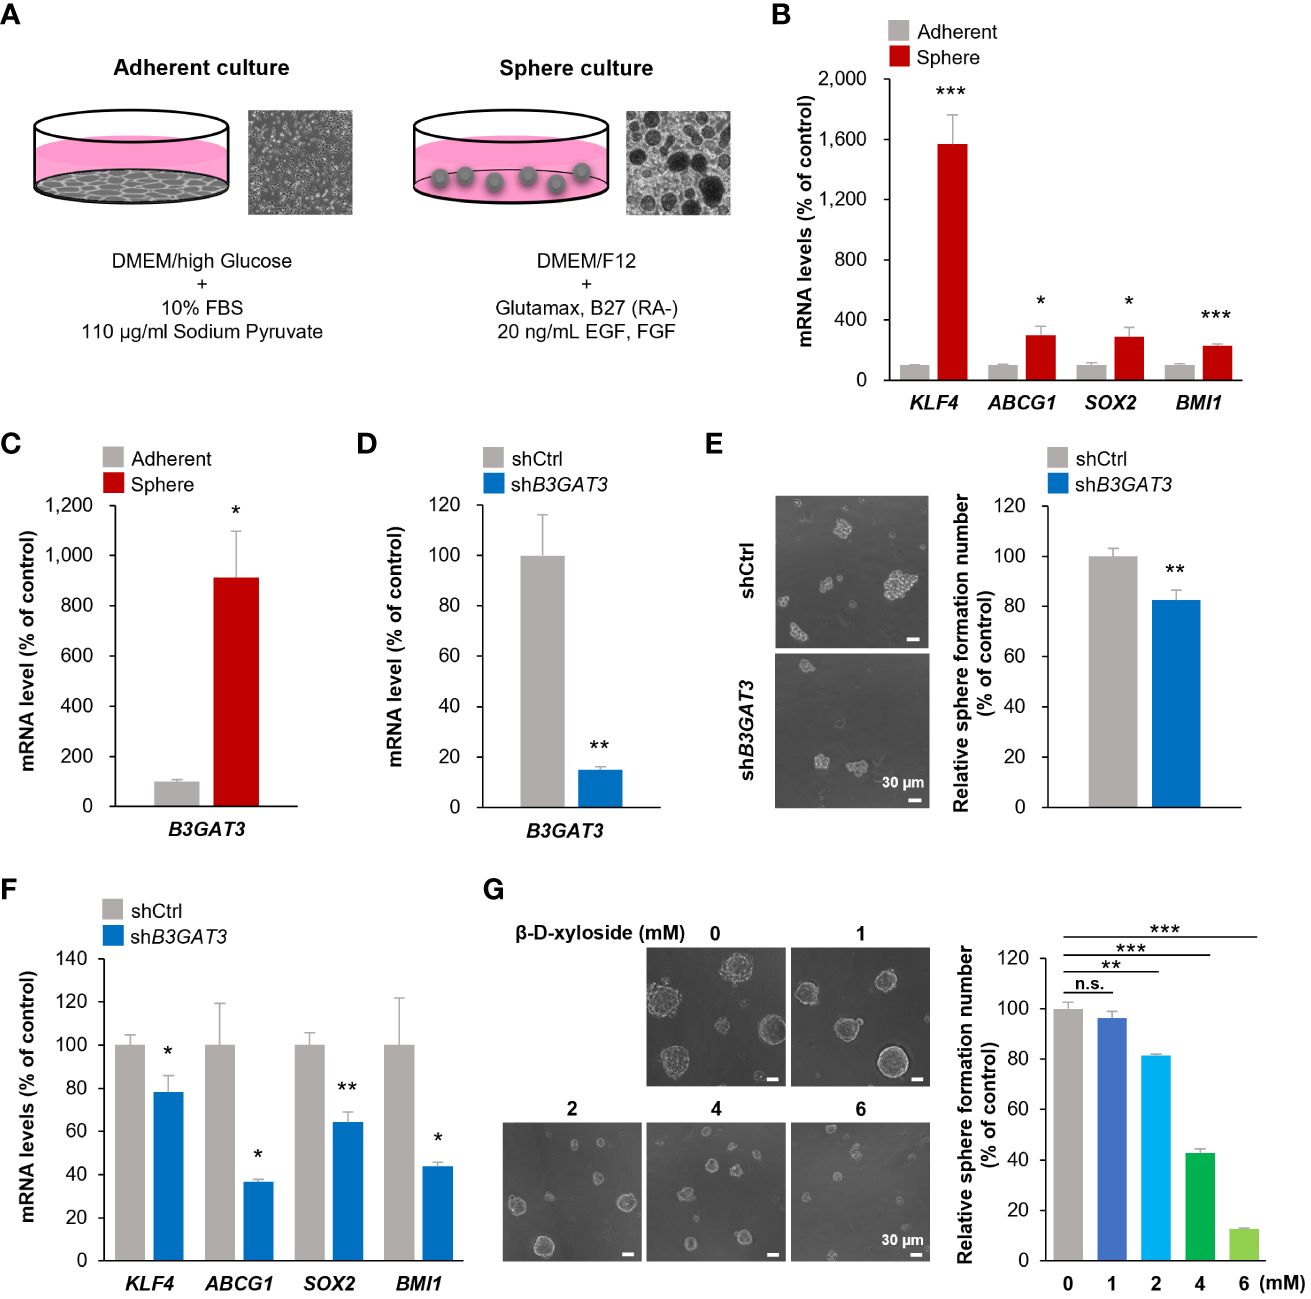
Figure 3 Inhibition of B3GAT3 suppresses the self-renewal ability of 143B OS cells in vitro. (A) 143B cells were cultured under sphere or adherent conditions. (B) The mRNA expression levels of KLF4, ABCG1, SOX2, and BMI1 were determined in sphere and adherent cells using RT-qPCR (n = 4. *P < 0.05, ***P < 0.001). (C) The mRNA expression level of B3GAT3 was determined in sphere and adherent cells using RT-qPCR (n = 4. *P < 0.05). (D) B3GAT3 knockdown was verified via RT-qPCR (n = 5. **P < 0.01). (E) The sphere formation ability of 143B cells was assessed following B3GAT3 knockdown. Representative images are presented (left, scale bar = 30 μm). The number of spheres was counted (right, n = 8. **P < 0.01). (F) The mRNA expression levels of KLF4, ABCG1, SOX2, and BMI1 were determined in B3GAT3 knockdown 143B cells (n = 4. *P < 0.05, **P < 0.01). (G) 143B cells were treated with β-D-xyloside (0, 1, 2, 4, 6 mM), and sphere formation ability was assessed. Representative images are presented (left, scale bar = 30 μm). The number of spheres was counted (right, n = 5. **P < 0.01, ***P < 0.001 using Student’s t-test with Holm-Sidak correction for multiple comparisons). The mRNA expression level (normalized to GAPDH) is presented relative to that in (B, C) adherent cells and (D, F) cells treated with shCtrl. n.s., not significant.
Next, we elucidated the functional significance of GlcAT-I/B3GAT3 in 143B cells in vitro by targeting B3GAT3 expression using lentiviral shRNA. B3GAT3 mRNA levels were markedly reduced by shB3GAT3 in 143B cells (Figure 3D). Disruption of B3GAT3 with shRNA significantly decreased tumorsphere formation ability of 143B cells (Figure 3E). Furthermore, B3GAT3 knockdown resulted in a significant downregulation of the stem cell markers, KLF4, ABCG1, SOX2, and BMI1 in 143B tumorspheres (Figure 3F). Next, we determined whether the pharmacological inhibition of PG biosynthesis by 4-nitrophenyl β-D-xylopyranoside (β-D-xyloside), an inhibitor of GAG chain attachment to the core protein (50), could confirm the genetic inhibition of B3GAT3 in 143B cells. β-D-xyloside significantly decreased the tumorsphere formation ability of 143B cells at concentrations > 2 mM in a concentration-dependent manner (Figure 3G). Although further studies should be performed to demonstrate the pivotal role of B3GAT3 on OSC properties by purifying stem cells from 143B tumorspheres because of their heterogeneous population including a subset exhibiting OSC markers, these genetic and pharmacological analyses indicate that B3GAT3 and PG/GAG biosynthesis could be implicated in the regulation of stem cell properties of 143B in vitro.
4 Discussion
PGs/GAGs are widely recognized as important regulators of stem cell function in embryonic development and tissue regeneration (51, 52). Moreover, the aberrant functions of PGs/GAGs have recently been shown to contribute to CSC phenotypes, tumor initiation, recurrence, metastasis, and chemoresistance (35). The assembly of HS, CS, and DS is initiated by the formation of a common tetrasaccharide structure (Xyl-Gal-Gal-GlcA), catalyzed by XylT-I, XylT-II, GalT-I, GalT-II, and GlcAT-I, encoded by XYLT1, XYLT2, B4GALT7, B3GALT6, and B3GAT3, respectively (26–28). Mutations in these genes can cause inherited diseases that result in various bone, skin, and connective tissue abnormalities (53, 54). For instance, mutations in B3GAT3 have been implicated in multiple joint dislocations, short stature, and craniofacial dysmorphism, with or without congenital heart defects (47). However, the importance of PG/GAG biosynthesis and the functional roles of the corresponding genes (XYLT1, XYLT2, B4GALT7, B3GALT6, and B3GAT3) in OSC properties and OS pathogenesis are largely unknown. Although further in vivo analyses should be performed to validate our findings, to our knowledge, this is the first study to reveal, using integrated bioinformatics analysis and in vitro genetic and pharmacological studies, that the PG/GAG biosynthesis pathway and corresponding enzyme, GlcAT-I/B3GAT3, may be associated with the maintenance of OSC characteristics and OS malignancy.
Notably, the expression analysis of DEGs related to the biosynthesis of PGs/GAGs revealed the potential involvement of alternative candidate genes in OSC properties. Carbohydrate sulfotransferase 13 (CHST13), which catalyzes the transfer of sulfate to position 4 of the GalNAc residue of chondroitin (55), was the commonly significantly upregulated gene in all three OSC populations defined by the co-expression of ABCG1/KLF4/MYC, and ABCG1/KLF4/KIT, and SOX2/NES/MYC (Figures 1F, G, J, Supplementary Figure 1C). In addition to B3GAT3 and CHST13, there were several significantly upregulated genes in each OSC population without overlap, indicating that these additional genes require further exploration. OS is highly heterogeneous in terms of molecular pathogenesis, which is at least in part due to the genetic and phenotypic variation in OSCs, suggesting that optimal biomarkers vary slightly between patients and cancer types (56, 57). For that reason, different OSC markers were used for each of the datasets: GSE152048 and GSE162454. It is also noteworthy that there were discrepancies in the expression of PG biosynthesis genes between OSC populations and OS tissues. Only B3GAT3 was significantly upregulated in OSC populations (Figures 1F, G, J, 2C). However, all five PG biosynthesis genes (XYLT1, XYLT2, B4GALT7, B3GALT6, and B3GAT3) were significantly upregulated in OS tissues (Figure 2A), in which the proportion of OSC is small. Therefore, it can be speculated that XylT-I/XYLT1, XylT-II/XYLT2, GalT-I/B4GALT7, and GalT-II/B3GALT6 may have functional roles in differentiated OS cell properties rather than in OSC properties, providing an incentive to pursue further research to determine their roles in OS pathogenesis in cell culture studies.
The primary therapeutic approach for OS is a combination of surgical intervention and chemotherapy. Effective treatments for OS have not improved over the past four decades (3, 4). Although accumulating evidence suggests that mutations in the tumor suppressor genes, RB1 and TP53, are associated with the development of OS, cytogenetic analysis suggests that genomic profiles differ significantly among patients with OS, without specific patterns, resulting in difficulties in the development of new and effective drugs and innovative treatment strategies (58–62). Our findings contribute to the improvement of our understanding of the molecular mechanisms underlying OS development and progression, as well as OSC properties, and suggest that PG/GAG biosynthesis and the corresponding genes expressed by OSCs may represent novel and effective targets for drug development to treat OS in humans.
Data availability statement
The datasets presented in this study can be found in online repositories. The names of the repository/repositories and accession number(s) can be found in the article/Supplementary Material.
Ethics statement
Ethical approval was not required for the studies on humans in accordance with the local legislation and institutional requirements because only commercially available established cell lines were used.
Author contributions
EH: Writing – original draft, Writing – review & editing, Conceptualization, Funding acquisition, Supervision. RO: Writing – original draft, Writing – review & editing, Conceptualization, Formal analysis, Investigation, Visualization. KS: Writing – original draft, Writing – review & editing, Conceptualization, Formal analysis, Investigation, Visualization. MY: Writing – original draft, Writing – review & editing, Formal analysis, Investigation, Methodology, Validation, Visualization. KT: Writing – original draft, Writing – review & editing, Formal analysis, Investigation, Methodology, Validation, Visualization. YT: Writing – original draft, Formal analysis, Investigation, Methodology, Validation.
Funding
The author(s) declare financial support was received for the research, authorship, and/or publication of this article. This work was partly supported by the Japan Society for the Promotion of Science (20H03407 to EH).
Acknowledgments
Bioinformatics analyses were performed using the super-computing resource provided by the Human Genome Center, Institute of Medical Science, University of Tokyo.
Conflict of interest
EH received grants from the Japan Society for the Promotion of Science for this study.
The remaining authors declare that the research was conducted in the absence of any commercial or financial relationships that could be constructed as a potential conflict of interest.
Publisher’s note
All claims expressed in this article are solely those of the authors and do not necessarily represent those of their affiliated organizations, or those of the publisher, the editors and the reviewers. Any product that may be evaluated in this article, or claim that may be made by its manufacturer, is not guaranteed or endorsed by the publisher.
Supplementary material
The Supplementary Material for this article can be found online at: https://www.frontiersin.org/articles/10.3389/fonc.2024.1325794/full#supplementary-material
References
1. Panez-Toro I, Muñoz-García J, Vargas-Franco JW, Renodon-Cornière A, Heymann MF, Lézot F, et al. Advances in osteosarcoma. Curr osteoporosis Rep. (2023) 21:330–43. doi: 10.1007/s11914-023-00803-9
2. Rickel K, Fang F, Tao J. Molecular genetics of osteosarcoma. Bone. (2017) 102:69–79. doi: 10.1016/j.bone.2016.10.017
3. Beird HC, Bielack SS, Flanagan AM, Gill J, Heymann D, Janeway KA, et al. Osteosarcoma. Nat Rev Dis Primers. (2022) 8:77. doi: 10.1038/s41572-022-00409-y
4. Gill J, Gorlick R. Advancing therapy for osteosarcoma. Nat Rev Clin Oncol. (2021) 18:609–24. doi: 10.1038/s41571-021-00519-8
5. Brown HK, Schiavone K, Gouin F, Heymann MF, Heymann D. Biology of bone sarcomas and new therapeutic developments. Calcified Tissue Int. (2018) 102:174–95. doi: 10.1007/s00223-017-0372-2
6. Xie D, Wang Z, Li J, Guo DA, Lu A, Liang C. Targeted delivery of chemotherapeutic agents for osteosarcoma treatment. Front Oncol. (2022) 12:843345. doi: 10.3389/fonc.2022.843345
7. Berner K, Johannesen TB, Berner A, Haugland HK, Bjerkehagen B, Bøhler PJ, et al. Time-trends on incidence and survival in a nationwide and unselected cohort of patients with skeletal osteosarcoma. Acta Oncol (Stockholm Sweden). (2015) 54:25–33. doi: 10.3109/0284186x.2014.923934
8. Ji Z, Shen J, Lan Y, Yi Q, Liu H. Targeting signaling pathways in osteosarcoma: Mechanisms and clinical studies. MedComm. (2023) 4:e308. doi: 10.1002/mco2.308
9. Yang Z, Li X, Yang Y, He Z, Qu X, Zhang Y. Long noncoding RNAs in the progression, metastasis, and prognosis of osteosarcoma. Cell Death Dis. (2016) 7:e2389. doi: 10.1038/cddis.2016.272
10. Pang H, Wu T, Peng Z, Tan Q, Peng X, Zhan Z, et al. Baicalin induces apoptosis and autophagy in human osteosarcoma cells by increasing ROS to inhibit PI3K/Akt/mTOR, ERK1/2 and β-catenin signaling pathways. J Bone Oncol. (2022) 33:100415. doi: 10.1016/j.jbo.2022.100415
11. Zhao X, Wu Q, Gong X, Liu J, Ma Y. Osteosarcoma: a review of current and future therapeutic approaches. Biomed Eng Online. (2021) 20:24. doi: 10.1186/s12938-021-00860-0
12. Kansara M, Teng MW, Smyth MJ, Thomas DM. Translational biology of osteosarcoma. Nat Rev Cancer. (2014) 14:722–35. doi: 10.1038/nrc3838
13. Mutsaers AJ, Walkley CR. Cells of origin in osteosarcoma: mesenchymal stem cells or osteoblast committed cells? Bone. (2014) 62:56–63. doi: 10.1016/j.bone.2014.02.003
14. Franceschini N, Verbruggen B, Tryfonidou MA, Kruisselbrink AB, Baelde H, de Visser KE, et al. Transformed canine and murine mesenchymal stem cells as a model for sarcoma with complex genomics. Cancers. (2021) 13:1126. doi: 10.3390/cancers13051126
15. Yan GN, Lv YF, Guo QN. Advances in osteosarcoma stem cell research and opportunities for novel therapeutic targets. Cancer Lett. (2016) 370:268–74. doi: 10.1016/j.canlet.2015.11.003
16. Fujiwara S, Kawamoto T, Kawakami Y, Koterazawa Y, Hara H, Takemori T, et al. Acquisition of cancer stem cell properties in osteosarcoma cells by defined factors. Stem Cell Res Ther. (2020) 11:429. doi: 10.1186/s13287-020-01944-9
17. Abarrategi A, Tornin J, Martinez-Cruzado L, Hamilton A, Martinez-Campos E, Rodrigo JP, et al. Osteosarcoma: cells-of-origin, cancer stem cells, and targeted therapies. Stem Cells Int. (2016) 2016:3631764. doi: 10.1155/2016/3631764
18. Menéndez ST, Gallego B, Murillo D, Rodríguez A, Rodríguez R. Cancer stem cells as a source of drug resistance in bone sarcomas. J Clin Med. (2021) 10. doi: 10.3390/jcm10122621
19. Muir H. Proteoglycans of cartilage. J Clin Pathol. (1978) 31:67–81. doi: 10.1136/jcp.31.Suppl_12.67
20. Kjellén L, Lindahl U. Proteoglycans: structures and interactions. Annu Rev Biochem. (1991) 60:443–75. doi: 10.1146/annurev.bi.60.070191.002303
21. Couchman JR. Transmembrane signaling proteoglycans. Annu Rev Cell Dev Biol. (2010) 26:89–114. doi: 10.1146/annurev-cellbio-100109-104126
22. Esko JD, Kimata K, Lindahl U. Proteoglycans and sulfated glycosaminoglycans. In: Varki A, Cummings RD, Esko JD, Freeze HH, Stanley P, Bertozzi CR, et al, editors. Essentials of glycobiology. Cold Spring Harbor Laboratory Press Copyright © 2009, The Consortium of Glycobiology Editors, La Jolla, California, Cold Spring Harbor (NY (2009).
23. Mizumoto S, Yamada S, Sugahara K. Molecular interactions between chondroitin-dermatan sulfate and growth factors/receptors/matrix proteins. Curr Opin Struct Biol. (2015) 34:35–42. doi: 10.1016/j.sbi.2015.06.004
24. Miller GM, Hsieh-Wilson LC. Sugar-dependent modulation of neuronal development, regeneration, and plasticity by chondroitin sulfate proteoglycans. Exp Neurol. (2015) 274:115–25. doi: 10.1016/j.expneurol.2015.08.015
25. Soares da Costa D, Reis RL, Pashkuleva I. Sulfation of glycosaminoglycans and its implications in human health and disorders. Annu Rev Biomed Eng. (2017) 19:1–26. doi: 10.1146/annurev-bioeng-071516-044610
26. Kreuger J, Kjellén L. Heparan sulfate biosynthesis: regulation and variability. J Histochem cytochemistry: Off J Histochem Soc. (2012) 60:898–907. doi: 10.1369/0022155412464972
27. Mikami T, Kitagawa H. Biosynthesis and function of chondroitin sulfate. Biochim Biophys Acta. (2013) 1830:4719–33. doi: 10.1016/j.bbagen.2013.06.006
28. Sugahara K, Kitagawa H. Recent advances in the study of the biosynthesis and functions of sulfated glycosaminoglycans. Curr Opin Struct Biol. (2000) 10:518–27. doi: 10.1016/s0959-440x(00)00125-1
29. Götting C, Kuhn J, Brinkmann T, Kleesiek K. Xylosylation of alternatively spliced isoforms of Alzheimer APP by xylosyltransferase. J Protein Chem. (1998) 17:295–302. doi: 10.1023/a:1022549121672
30. Hinsdale ME. Xylosyltransferase I, II (XYLT1,2). In: Taniguchi N, Honke K, Fukuda M, Narimatsu H, Yamaguchi Y, Angata T, editors. Handbook of glycosyltransferases and related genes. Springer Japan, Tokyo (2014). p. 873–83.
31. Briggs DC, Hohenester E. Structural basis for the initiation of glycosaminoglycan biosynthesis by human xylosyltransferase 1. Structure (London England: 1993). (2018) 26:801–9.e3. doi: 10.1016/j.str.2018.03.014
32. Wen J, Xiao J, Rahdar M, Choudhury BP, Cui J, Taylor GS, et al. Xylose phosphorylation functions as a molecular switch to regulate proteoglycan biosynthesis. Proc Natl Acad Sci United States America. (2014) 111:15723–8. doi: 10.1073/pnas.1417993111
33. Koike T, Izumikawa T, Tamura J, Kitagawa H. FAM20B is a kinase that phosphorylates xylose in the glycosaminoglycan-protein linkage region. Biochem J. (2009) 421:157–62. doi: 10.1042/bj20090474
34. Ibrahim SA, Hassan H, Vilardo L, Kumar SK, Kumar AV, Kelsch R, et al. Syndecan-1 (CD138) modulates triple-negative breast cancer stem cell properties via regulation of LRP-6 and IL-6-mediated STAT3 signaling. PloS One. (2013) 8:e85737. doi: 10.1371/journal.pone.0085737
35. Vitale D, Kumar Katakam S, Greve B, Jang B, Oh ES, Alaniz L, et al. Proteoglycans and glycosaminoglycans as regulators of cancer stem cell function and therapeutic resistance. FEBS J. (2019) 286:2870–82. doi: 10.1111/febs.14967
36. Zhou Y, Yang D, Yang Q, Lv X, Huang W, Zhou Z, et al. Single-cell RNA landscape of intratumoral heterogeneity and immunosuppressive microenvironment in advanced osteosarcoma. Nat Commun. (2020) 11:6322. doi: 10.1038/s41467-020-20059-6
37. Liu Y, Feng W, Dai Y, Bao M, Yuan Z, He M, et al. Single-cell transcriptomics reveals the complexity of the tumor microenvironment of treatment-naive osteosarcoma. Front Oncol. (2021) 11:709210. doi: 10.3389/fonc.2021.709210
38. Horie T, Fukasawa K, Yamada T, Mizuno S, Iezaki T, Tokumura K, et al. Erk5 in bone marrow mesenchymal stem cells regulates bone homeostasis by preventing osteogenesis in adulthood. Stem Cells (Dayton Ohio). (2022) 40:411–22. doi: 10.1093/stmcls/sxac011
39. Yoshimoto M, Sadamori K, Tokumura K, Tanaka Y, Fukasawa K, Hinoi E. Bioinformatic analysis reveals potential relationship between chondrocyte senescence and protein glycosylation in osteoarthritis pathogenesis. Front Endocrinol. (2023) 14:1153689. doi: 10.3389/fendo.2023.1153689
40. Tokumura K, Sadamori K, Yoshimoto M, Tomizawa A, Tanaka Y, Fukasawa K, et al. The bioinformatics identification of potential protein glycosylation genes associated with a glioma stem cell signature. BioMedInformatics. (2024) 4:75–88. doi: 10.3390/biomedinformatics4010005
41. Wang X, Qin G, Liang X, Wang W, Wang Z, Liao D, et al. Targeting the CK1α/CBX4 axis for metastasis in osteosarcoma. Nat Commun. (2020) 11:1141. doi: 10.1038/s41467-020-14870-4
42. Fukasawa K, Lyu J, Kubo T, Tanaka Y, Suzuki A, Horie T, et al. MEK5-ERK5 axis promotes self-renewal and tumorigenicity of glioma stem cells. Cancer Res Commun. (2023) 3:148–59. doi: 10.1158/2767-9764.crc-22-0243
43. Hiraiwa M, Fukasawa K, Iezaki T, Sabit H, Horie T, Tokumura K, et al. SMURF2 phosphorylation at Thr249 modifies glioma stemness and tumorigenicity by regulating TGF-β receptor stability. Commun Biol. (2022) 5:22. doi: 10.1038/s42003-021-02950-0
44. Fukasawa K, Kadota T, Horie T, Tokumura K, Terada R, Kitaguchi Y, et al. CDK8 maintains stemness and tumorigenicity of glioma stem cells by regulating the c-MYC pathway. Oncogene. (2021) 40:2803–15. doi: 10.1038/s41388-021-01745-1
45. Hinoi E, Iezaki T, Ozaki K, Yoneda Y. Nuclear factor-κB is a common upstream signal for growth differentiation factor-5 expression in brown adipocytes exposed to pro-inflammatory cytokines and palmitate. Biochem Biophys Res Commun. (2014) 452:974–9. doi: 10.1016/j.bbrc.2014.09.022
46. Nakamura Y, Hinoi E, Iezaki T, Takada S, Hashizume S, Takahata Y, et al. Repression of adipogenesis through promotion of Wnt/β-catenin signaling by TIS7 up-regulated in adipocytes under hypoxia. Biochim Biophys Acta. (2013) 1832:1117–28. doi: 10.1016/j.bbadis.2013.03.010
47. Yauy K, Tran Mau-Them F, Willems M, Coubes C, Blanchet P, Herlin C, et al. B3GAT3-related disorder with craniosynostosis and bone fragility due to a unique mutation. Genet medicine: Off J Am Coll Med Genet. (2018) 20:269–74. doi: 10.1038/gim.2017.109
48. Gibbs CP, Kukekov VG, Reith JD, Tchigrinova O, Suslov ON, Scott EW, et al. Stem-like cells in bone sarcomas: implications for tumorigenesis. Neoplasia (New York NY). (2005) 7:967–76. doi: 10.1593/neo.05394
49. Rainusso N, Man TK, Lau CC, Hicks J, Shen JJ, Yu A, et al. Identification and gene expression profiling of tumor-initiating cells isolated from human osteosarcoma cell lines in an orthotopic mouse model. Cancer Biol Ther. (2011) 12:278–87. doi: 10.4161/cbt.12.4.15951
50. Stevens RL, Austen KF. Effect of p-nitrophenyl-beta-D-xyloside on proteoglycan and glycosaminoglycan biosynthesis in rat serosal mast cell cultures. J Biol Chem. (1982) 257:253–9. doi: 10.1016/S0021-9258(19)68354-7
51. Kraushaar DC, Yamaguchi Y, Wang L. Heparan sulfate is required for embryonic stem cells to exit from self-renewal. J Biol Chem. (2010) 285:5907–16. doi: 10.1074/jbc.M109.066837
52. Chen J, Sun T, You Y, Wu B, Wang X, Wu J. Proteoglycans and glycosaminoglycans in stem cell homeostasis and bone tissue regeneration. Front Cell Dev Biol. (2021) 9:760532. doi: 10.3389/fcell.2021.760532
53. Mizumoto S, Ikegawa S, Sugahara K. Human genetic disorders caused by mutations in genes encoding biosynthetic enzymes for sulfated glycosaminoglycans. J Biol Chem. (2013) 288:10953–61. doi: 10.1074/jbc.R112.437038
54. Taylan F, Mäkitie O. Abnormal proteoglycan synthesis due to gene defects causes skeletal diseases with overlapping phenotypes. Hormone Metab Res = Hormon- und Stoffwechselforschung = Hormones metabolisme. (2016) 48:745–54. doi: 10.1055/s-0042-118706
55. Kang HG, Evers MR, Xia G, Baenziger JU, Schachner M. Molecular cloning and characterization of chondroitin-4-O-sulfotransferase-3. A novel member of the HNK-1 family of sulfotransferases. J Biol Chem. (2002) 277:34766–72. doi: 10.1074/jbc.M204907200
56. Nassar D, Blanpain C. Cancer stem cells: basic concepts and therapeutic implications. Annu Rev Pathol. (2016) 11:47–76. doi: 10.1146/annurev-pathol-012615-044438
57. Lindsey BA, Markel JE, Kleinerman ES. Osteosarcoma overview. Rheumatol Ther. (2017) 4:25–43. doi: 10.1007/s40744-016-0050-2
58. Toguchida J, Ishizaki K, Sasaki MS, Nakamura Y, Ikenaga M, Kato M, et al. Preferential mutation of paternally derived RB gene as the initial event in sporadic osteosarcoma. Nature. (1989) 338:156–8. doi: 10.1038/338156a0
59. Wunder JS, Gokgoz N, Parkes R, Bull SB, Eskandarian S, Davis AM, et al. TP53 mutations and outcome in osteosarcoma: a prospective, multicenter study. J Clin oncology: Off J Am Soc Clin Oncol. (2005) 23:1483–90. doi: 10.1200/jco.2005.04.074
60. Stephens PJ, Greenman CD, Fu B, Yang F, Bignell GR, Mudie LJ, et al. Massive genomic rearrangement acquired in a single catastrophic event during cancer development. Cell. (2011) 144:27–40. doi: 10.1016/j.cell.2010.11.055
61. Savage SA, Mirabello L, Wang Z, Gastier-Foster JM, Gorlick R, Khanna C, et al. Genome-wide association study identifies two susceptibility loci for osteosarcoma. Nat Genet. (2013) 45:799–803. doi: 10.1038/ng.2645
Keywords: osteosarcoma, osteosarcoma stem cell, proteoglycan, glycosaminoglycan, β-1, 3glucuronyltransferase 3
Citation: Osumi R, Sugihara K, Yoshimoto M, Tokumura K, Tanaka Y and Hinoi E (2024) Role of proteoglycan synthesis genes in osteosarcoma stem cells. Front. Oncol. 14:1325794. doi: 10.3389/fonc.2024.1325794
Received: 22 October 2023; Accepted: 03 April 2024;
Published: 16 April 2024.
Edited by:
Zhiyu Zhang, Fourth Affiliated Hospital of China Medical University, ChinaReviewed by:
Fiona E. Freeman, University College Dublin, IrelandFanyuan Yu, Sichuan University, China
Copyright © 2024 Osumi, Sugihara, Yoshimoto, Tokumura, Tanaka and Hinoi. This is an open-access article distributed under the terms of the Creative Commons Attribution License (CC BY). The use, distribution or reproduction in other forums is permitted, provided the original author(s) and the copyright owner(s) are credited and that the original publication in this journal is cited, in accordance with accepted academic practice. No use, distribution or reproduction is permitted which does not comply with these terms.
*Correspondence: Eiichi Hinoi, hinoi-e@gifu-pu.ac.jp
†These authors have contributed equally to this work and share first authorship