 Haiqin Xie1
 Yudi Zhang2Licong Dong1Heng Lv1
 Xuechen Li3
 Chenyang Zhao1Yun Tian1Lu Xie1Wangjie Wu1Qi Yang1Li Liu1
 Desheng Sun1Li Qiu4
 Linlin Shen2*
 Yusen Zhang1*
- 1Shenzhen Hospital, Peking University, Shenzhen, China
- 2College of Computer Science and Software Engineering, Shenzhen University, Shenzhen, Guangdong, China
- 3National Engineering Laboratory for Big Data System Computing Technology, Shenzhen University, Shenzhen, China
- 4West China Hospital, Sichuan University, Chengdu, Sichuan, China
Background: Soft tissue tumors (STTs) are benign or malignant superficial neoplasms arising from soft tissues throughout the body with versatile pathological types. Although Ultrasonography (US) is one of the most common imaging tools to diagnose malignant STTs, it still has several drawbacks in STT diagnosis that need improving.
Objectives: The study aims to establish this deep learning (DL) driven Artificial intelligence (AI) system for predicting malignant STTs based on US images and clinical indexes of the patients.
Methods: We retrospectively enrolled 271 malignant and 462 benign masses to build the AI system using 5-fold validation. A prospective dataset of 44 malignant masses and 101 benign masses was used to validate the accuracy of system. A multi-data fusion convolutional neural network, named ultrasound clinical soft tissue tumor net (UC-STTNet), was developed to combine gray scale and color Doppler US images and clinic features for malignant STTs diagnosis. Six radiologists (R1-R6) with three experience levels were invited for reader study.
Results: The AI system achieved an area under receiver operating curve (AUC) value of 0.89 in the retrospective dataset. The diagnostic performance of the AI system was higher than that of one of the senior radiologists (AUC of AI vs R2: 0.89 vs. 0.84, p=0.022) and all of the intermediate and junior radiologists (AUC of AI vs R3, R4, R5, R6: 0.89 vs 0.75, 0.81, 0.80, 0.63; p <0.01). The AI system also achieved an AUC of 0.85 in the prospective dataset. With the assistance of the system, the diagnostic performances and inter-observer agreement of the radiologists was improved (AUC of R3, R5, R6: 0.75 to 0.83, 0.80 to 0.85, 0.63 to 0.69; p<0.01).
Conclusion: The AI system could be a useful tool in diagnosing malignant STTs, and could also help radiologists improve diagnostic performance.
Highlights
● The deep-learning driven system has a high accuracy in diagnosing malignant soft tissue tumors.
● The deep-learning system showed superior performance than junior radiologists.
● The system is a useful tool for radiologists in discerning malignant soft tissue tumors.
Introduction
Soft tissue tumors (STTs) are a group of superficial neoplasms with heterogeneous clinical manifestations and diverse pathological types. The ratio of benign to malignant is close to 100:1 (1). Soft tissue sarcomas are the most common malignant STTs, accounting for only 1% of all adult cancers (2). Despite the rarity of malignant STTs compared with other malignant entities, their hazards cannot be ignored due to the substantial mortality and morbidity (3, 4). The overall five-year survival rate of malignant STTs is about 50% (1). They also present high metastasis and postoperative recurrence rates, up to 39% for soft tissue sarcomas (5). Soft tissue sarcoma is one of the leading causes of death for young adults, particularly for certain subtypes (6). As a result, accurate diagnosis and timely treatment for malignant STTs is crucial to improve the prognosis of the patients. However, as STTs substantially vary in clinical manifestations, morphological changes, and biological behaviors, it is difficult to make precise classification of malignant STTs, which might lead to delayed diagnosis. It is reported that the diagnosis of soft tissue sarcoma was usually delayed for up to 94.6 weeks (7), which might cause disastrous consequences on patients’ outcome, such as a shorter survival time (8, 9).
Ultrasonography (US) is considered to be the first-line imaging method for STTs, due to its fast speed, high resolution, lower cost, availability, dynamic observation, and no contraindications (2). Gray-scale US can map the locations and morphological changes of STTs, including size, margin, shape, and internal components. The mobility, compressibility, and its anatomical associations with adjacent structures can also be confirmed by dynamic US. Color Doppler US can further display the distribution of intra-tumoral and peri-tumoral blood vessels (10–14). However, US presented an unstable and relatively low diagnostic performance for classifying benign and malignant STTs. The reported accuracy rate of US varied among studies, ranging from 69% to 93% (10–12, 15, 16). And most of the previous studies only involved a small number of cases for evaluation, compromising their reliability. Meanwhile, conventional US is characterized by high operator-dependence and relatively low inter-observer agreement, which also degrade its performance in classifying malignant STTs. How to improve the diagnosis accuracy of US for malignant STTs, at the same time decrease operator dependence, is a very important research topic.
Advanced techniques like Artificial intelligence (AI), especially deep learning (DL) algorithms, possess an excellent ability in image recognition tasks. DL is emerging as a promising tool to resolve various radiology tasks using US images, including screening breast cancer (17, 18), classifying thyroid nodules (19–21), diagnosing liver diseases (22–24), and assessing musculoskeletal abnormality (25). Apart from showing good diagnostic performances in some diseases, DL can also assist radiologists in enhancing their accuracy and reliability in reading US images (26). Currently, AI-based malignant STTs diagnosis based on US images is still in the initial stage (27–29). These studies applied non-DL methods to develop assistant tools for malignant STTs diagnosis, with limited enrolled STTs cases. And clinical indexes were not fully utilized for the model construction in the previous studies.
To overcome the barrier of US diagnosis of malignant STTs, we established this DL-driven AI system, named ultrasound clinical soft tissue tumor net (UC-STTNet), for predicting STTs based on US images and clinical indexes of the patients. First, one of the highlights of the study is the application of two modalities of US imaging, gray-scale US and color-Doppler US, in model construction, which could provide more morphological information of STTs masses. And basic clinical indexes were also incorporated in the system for a more comprehensive diagnosis of the tumors. Also, we used 5-fold cross validation method in the model building based on a large database. The AI system could also provide heatmaps of US images illustrating the features relevant to model predictions for radiologists to make diagnosis. The AI system could successfully improve the performances and stability of the radiologists in classifying malignant STTs. To the best of our knowledge, our work is the first one applying DL technology for US diagnosis of malignant STTs.
Materials and methods
Ethical approval
The study was designed as a retrospective study and approved by the ethics committee of Peking University Shenzhen Hospital (Approval number: 202200901). The informed content was not waived since the retrospective study was observational and did not involve any interventional procedures. And all the information of the patients is anonymized throughout the study. The ethics committee approved the omission of informed content.
Study participants enrollment
In this work we employed five-fold cross validation for network evaluation. Among 5 folds, 4 and 1 folds were employed for training and testing, respectively. To build the training and testing dataset, we retrospectively reviewed the clinical and imaging data of the patients with STTs from July 2013 to December 2021. The patients with dual-modal US images and pathological results from surgical resections or biopsies were enrolled. To further evaluate the performance of the AI system, we collected a prospective testing dataset from April 2022 to September 2022 in our hospital. Tumors that occurred in superficial organs, including thyroid gland, breast, salivary gland, and lymph nodes, were excluded in both of the retrospective and prospective workflows.
US imaging and clinical data collection
All US images were derived from US imaging database at Peking University Shenzhen Hospital. The US examinations were performed by radiologists with over five-year experiences of US using commercial US equipment with 5-15MHz probes. Two representative pictures of each patient, one gray scale image showing the largest section of tumor and one color Doppler flow image with the most abundant blood vessels, were selected for model building. The US images of STTs were reviewed and selected from the patients by two radiologists with five-year experiences in US together for image quality control. When disagreement occurred between the two radiologists, they would refer to a third radiologist with over 10-year experiences for the final decision. Two clinicians collected the clinical data for the enrolled patients, including sex, age, duration, locations, layer, the maximum and minimum diameter of lesions, depth from skin, history of malignancy, and surgical history.
DL architecture development
We designed a multi-data fusion convolutional neural network, named as UC-STTNet, to combine gray scale and color Doppler US images and clinic features for malignant STTs diagnosis. Detailed descriptions about UC-STTNet are shown in Supplementary materials (Supplementary 1; Supplementary Figure 1; Supplementary Table 1).
The image feature extraction consisted of a tumor area enhancement block and a tumor feature extraction block. The tumor area enhancement block was an encoder-decoder network, which employed ResNet18 as backbone and with five down- and up-sample layers. The encoder was employed to extract the region of interest (ROI) feature of STTs, and the decoder was used to generate a ROI feature map which represented the possibility of tumor area (abbr. ROI-map).
The clinical data was directly digitized as a feature vector, which was then processed by a multi-layer perceptron and directly input into the multi-data fusion block. The multi-data fusion block consisted of feature concatenation and attention mechanism. The segmentation and tumor area features were concatenated together, and then the combined features were input into an attention block.
Global average pooling was used to align the image features to linear space and then concatenated with the features of clinic data to generate a multi-data fusion feature for the final STTs classification. Gradient-weighted Class Activation Mapping (Grad-CAM) was adopted in the classification tasks on deep learning to explain the performance of the proposed UC-STTNet. And we used a weighted combination for the forward activation map and activated the result by Rectified Linear Activation function (ReLU) to get the visualization heatmap.
Reader study and AI-assisted reader study
Six radiologists with three experience levels were invited to review the dual-modal US images and clinical manifestations independently and make diagnosis. The six radiologists participated the reader study included two senior radiologists with 21 and 24 years of experience (R1 and R2), two intermediate radiologists with 10 and 12 years of experience (R3 and R4), and two junior radiologists with 4 and 7 years of experience (R5 and R6). The radiologists were blind to the pathologic results of the tumors. One month after the original reader study, the same STTs cases were re-presented to the six radiologists for a second diagnosis, along with the AI-predicted results and heatmaps as reference. The radiologists were blind to their first-time results and pathological results of the tumors.
Statistical analysis
The 5-fold cross validation was used for model training and testing. The split was randomly repeated for five times and the average performances were recorded. The receiver operating curve (ROC), area under ROC curve (AUC), accuracy, sensitivity, specificity, positive predictive value (PPV) and negative predictive value (NPV) with 95% confidence interval (CI) were used to evaluate the diagnostic performance of the model, the radiologists, and the radiologists with AI assistance. AUC values of the same dataset and different datasets were compared to use the methods reported by DeLong et al (30) and Hanley and McNeil (31), respectively. We further calculated the intra-class correlation (ICC) with 95% CI to evaluate the inter-observer variability of the six radiologists before and after the assistance of AI results. P < 0.05 was considered as statistically significant. The statistical analyses were performed by using Medcalc (Version 20.0, MedCalc Software Ltd, Belgium).
Results
In this study, we developed and presented UC-STTNet, an AI system based on a deep-learning architecture for malignant STTs diagnosis. The study flow of the construction and validation of UC-STTNet is shown in Figure 1.
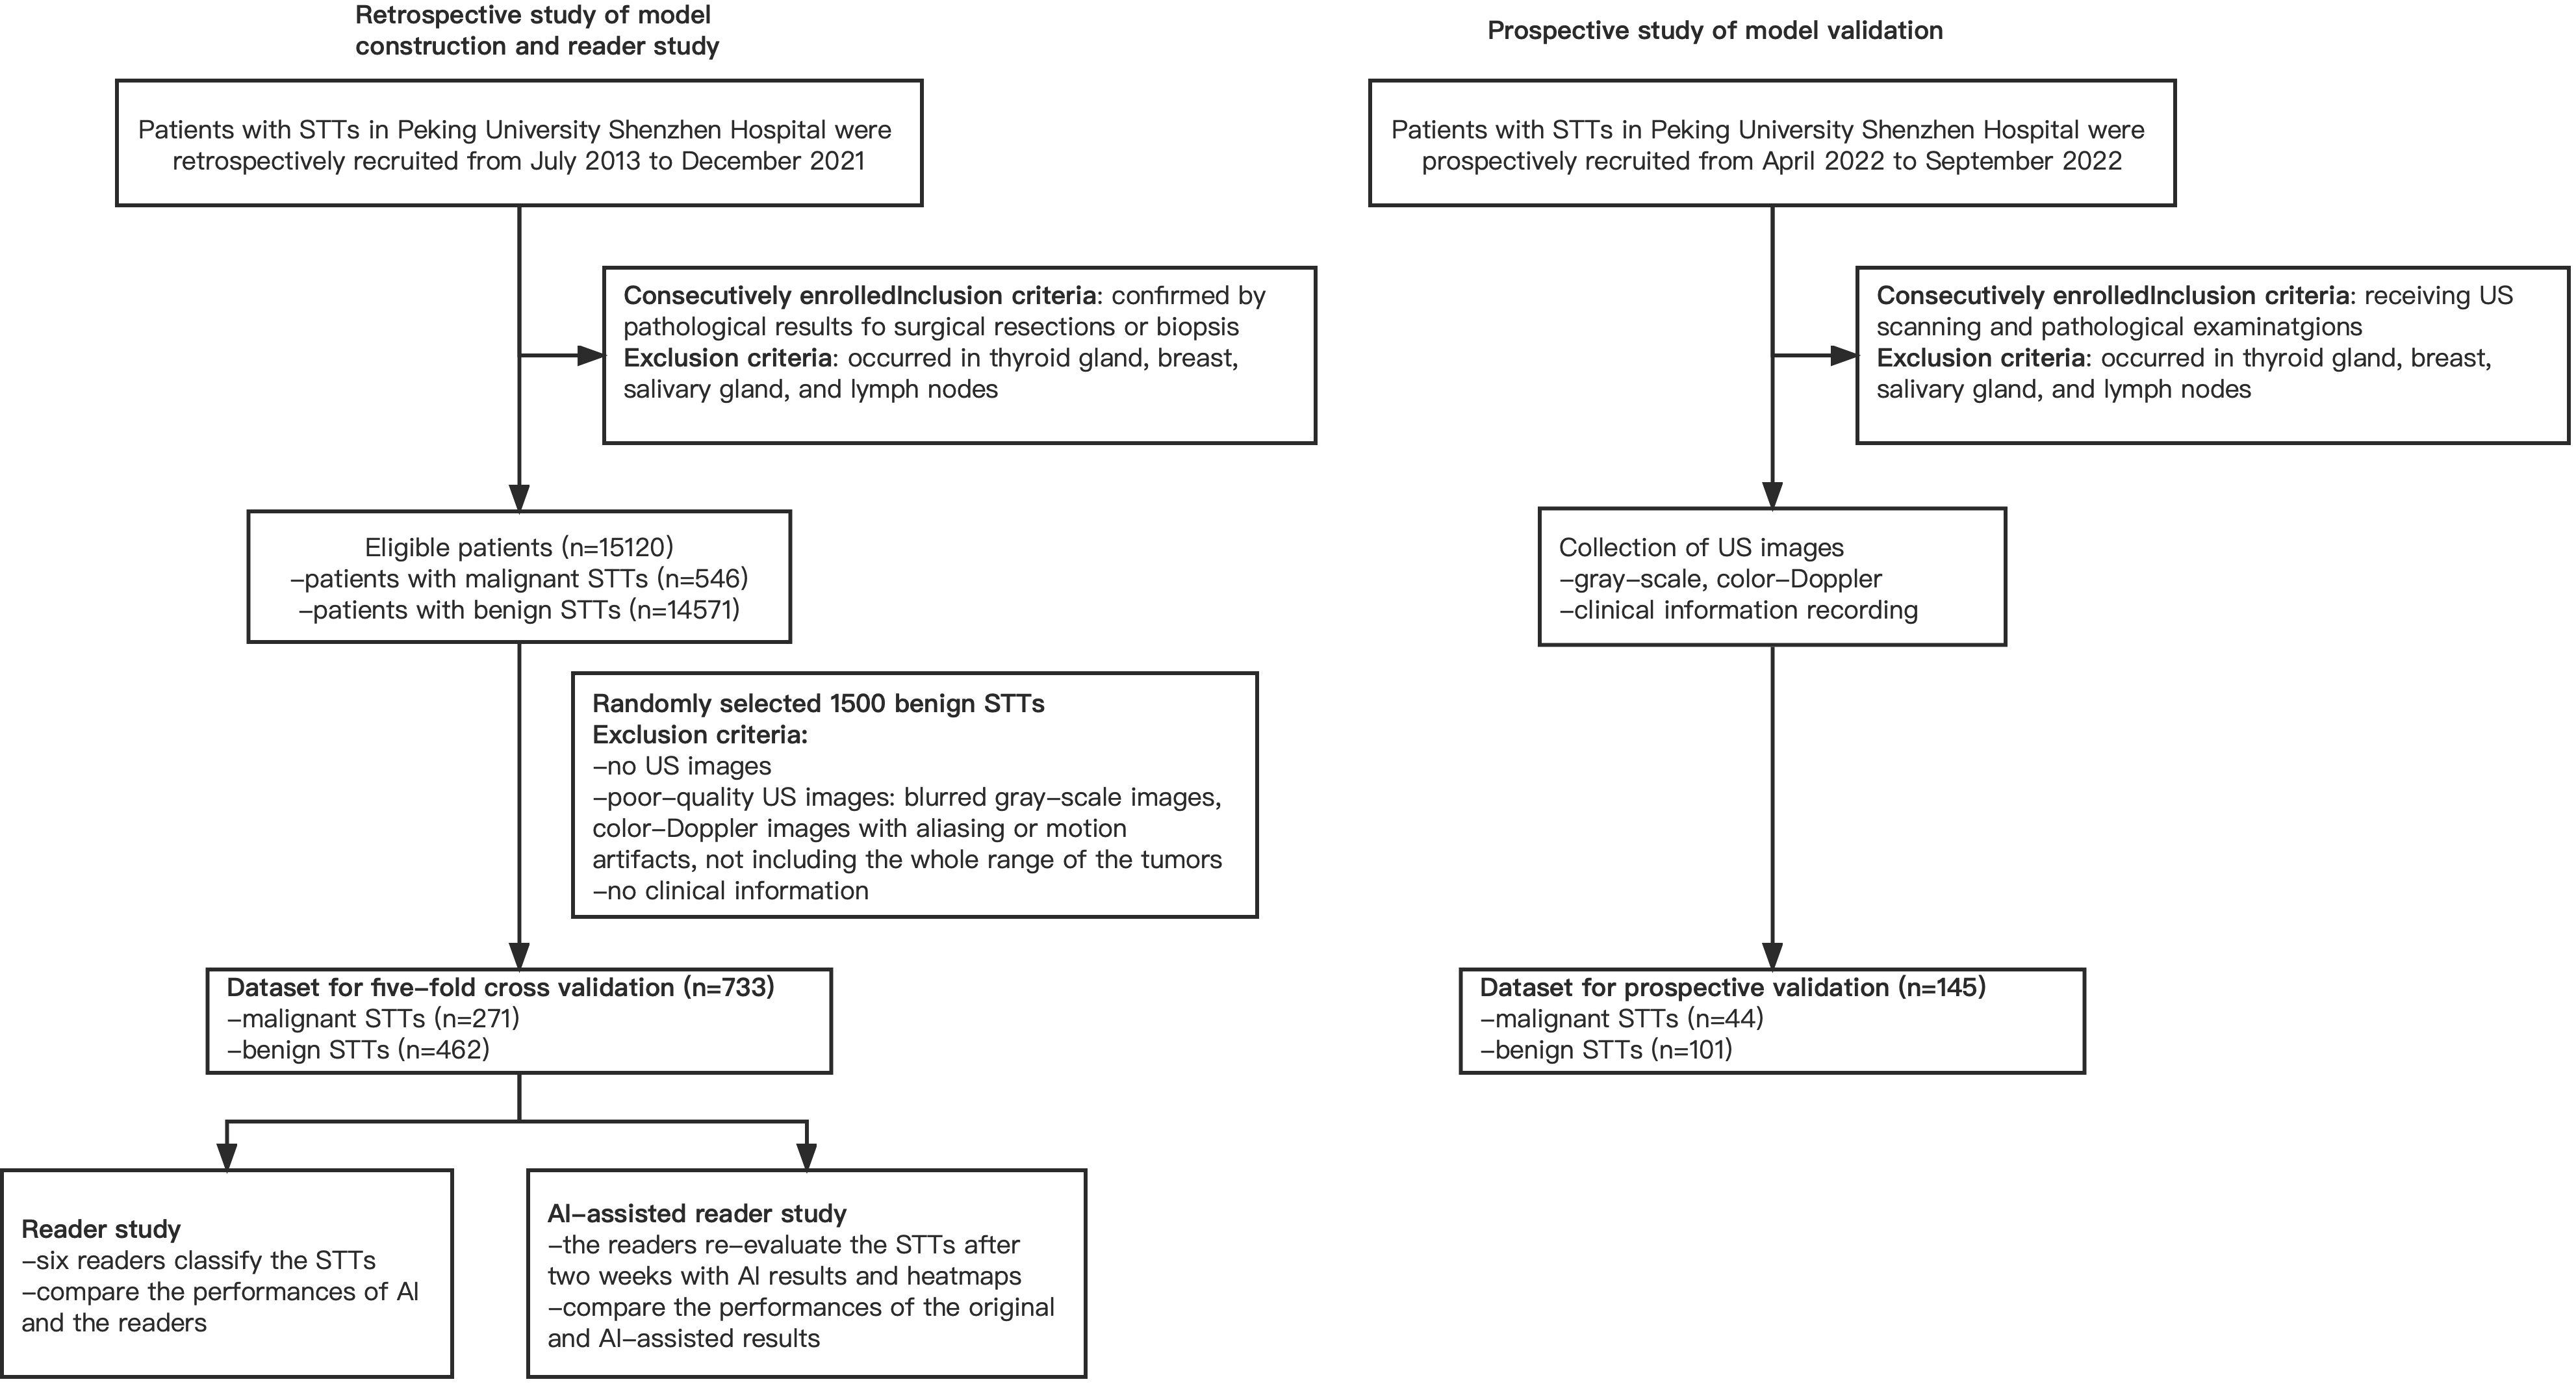
Figure 1 Overall study flow of UC-STTNet, the AI system for STTs diagnosis. The AI system was developed on a deep learning frame work using the tumor information from both dual-modal US images, including gray-scale US and color-Doppler US, and clinical features. The AI system could help radiologists in clinical decision-making by providing prediction results of STTs and heatmaps of US images as reference.
From July 2013 to December 2021, a total of 15120 adult patients with STTs were received from pathology data, which came from core biopsy or surgery. There were 546 patients with malignancy and 14574 patients with benign. Finally, 733 masses of 693 patients, including 271 malignant masses of 231 patients and 462 benign masses of 462 patients, were enrolled in this study to build the model. For the prospective validation of the model, we recruited 145 masses of 145 patients, including 44 malignant masses of 44 patients and 101 benign masses of 101 patients from April 2022 to September 2022. The workflow of the retrospective and prospective patient recruitment is shown in Figure 2.
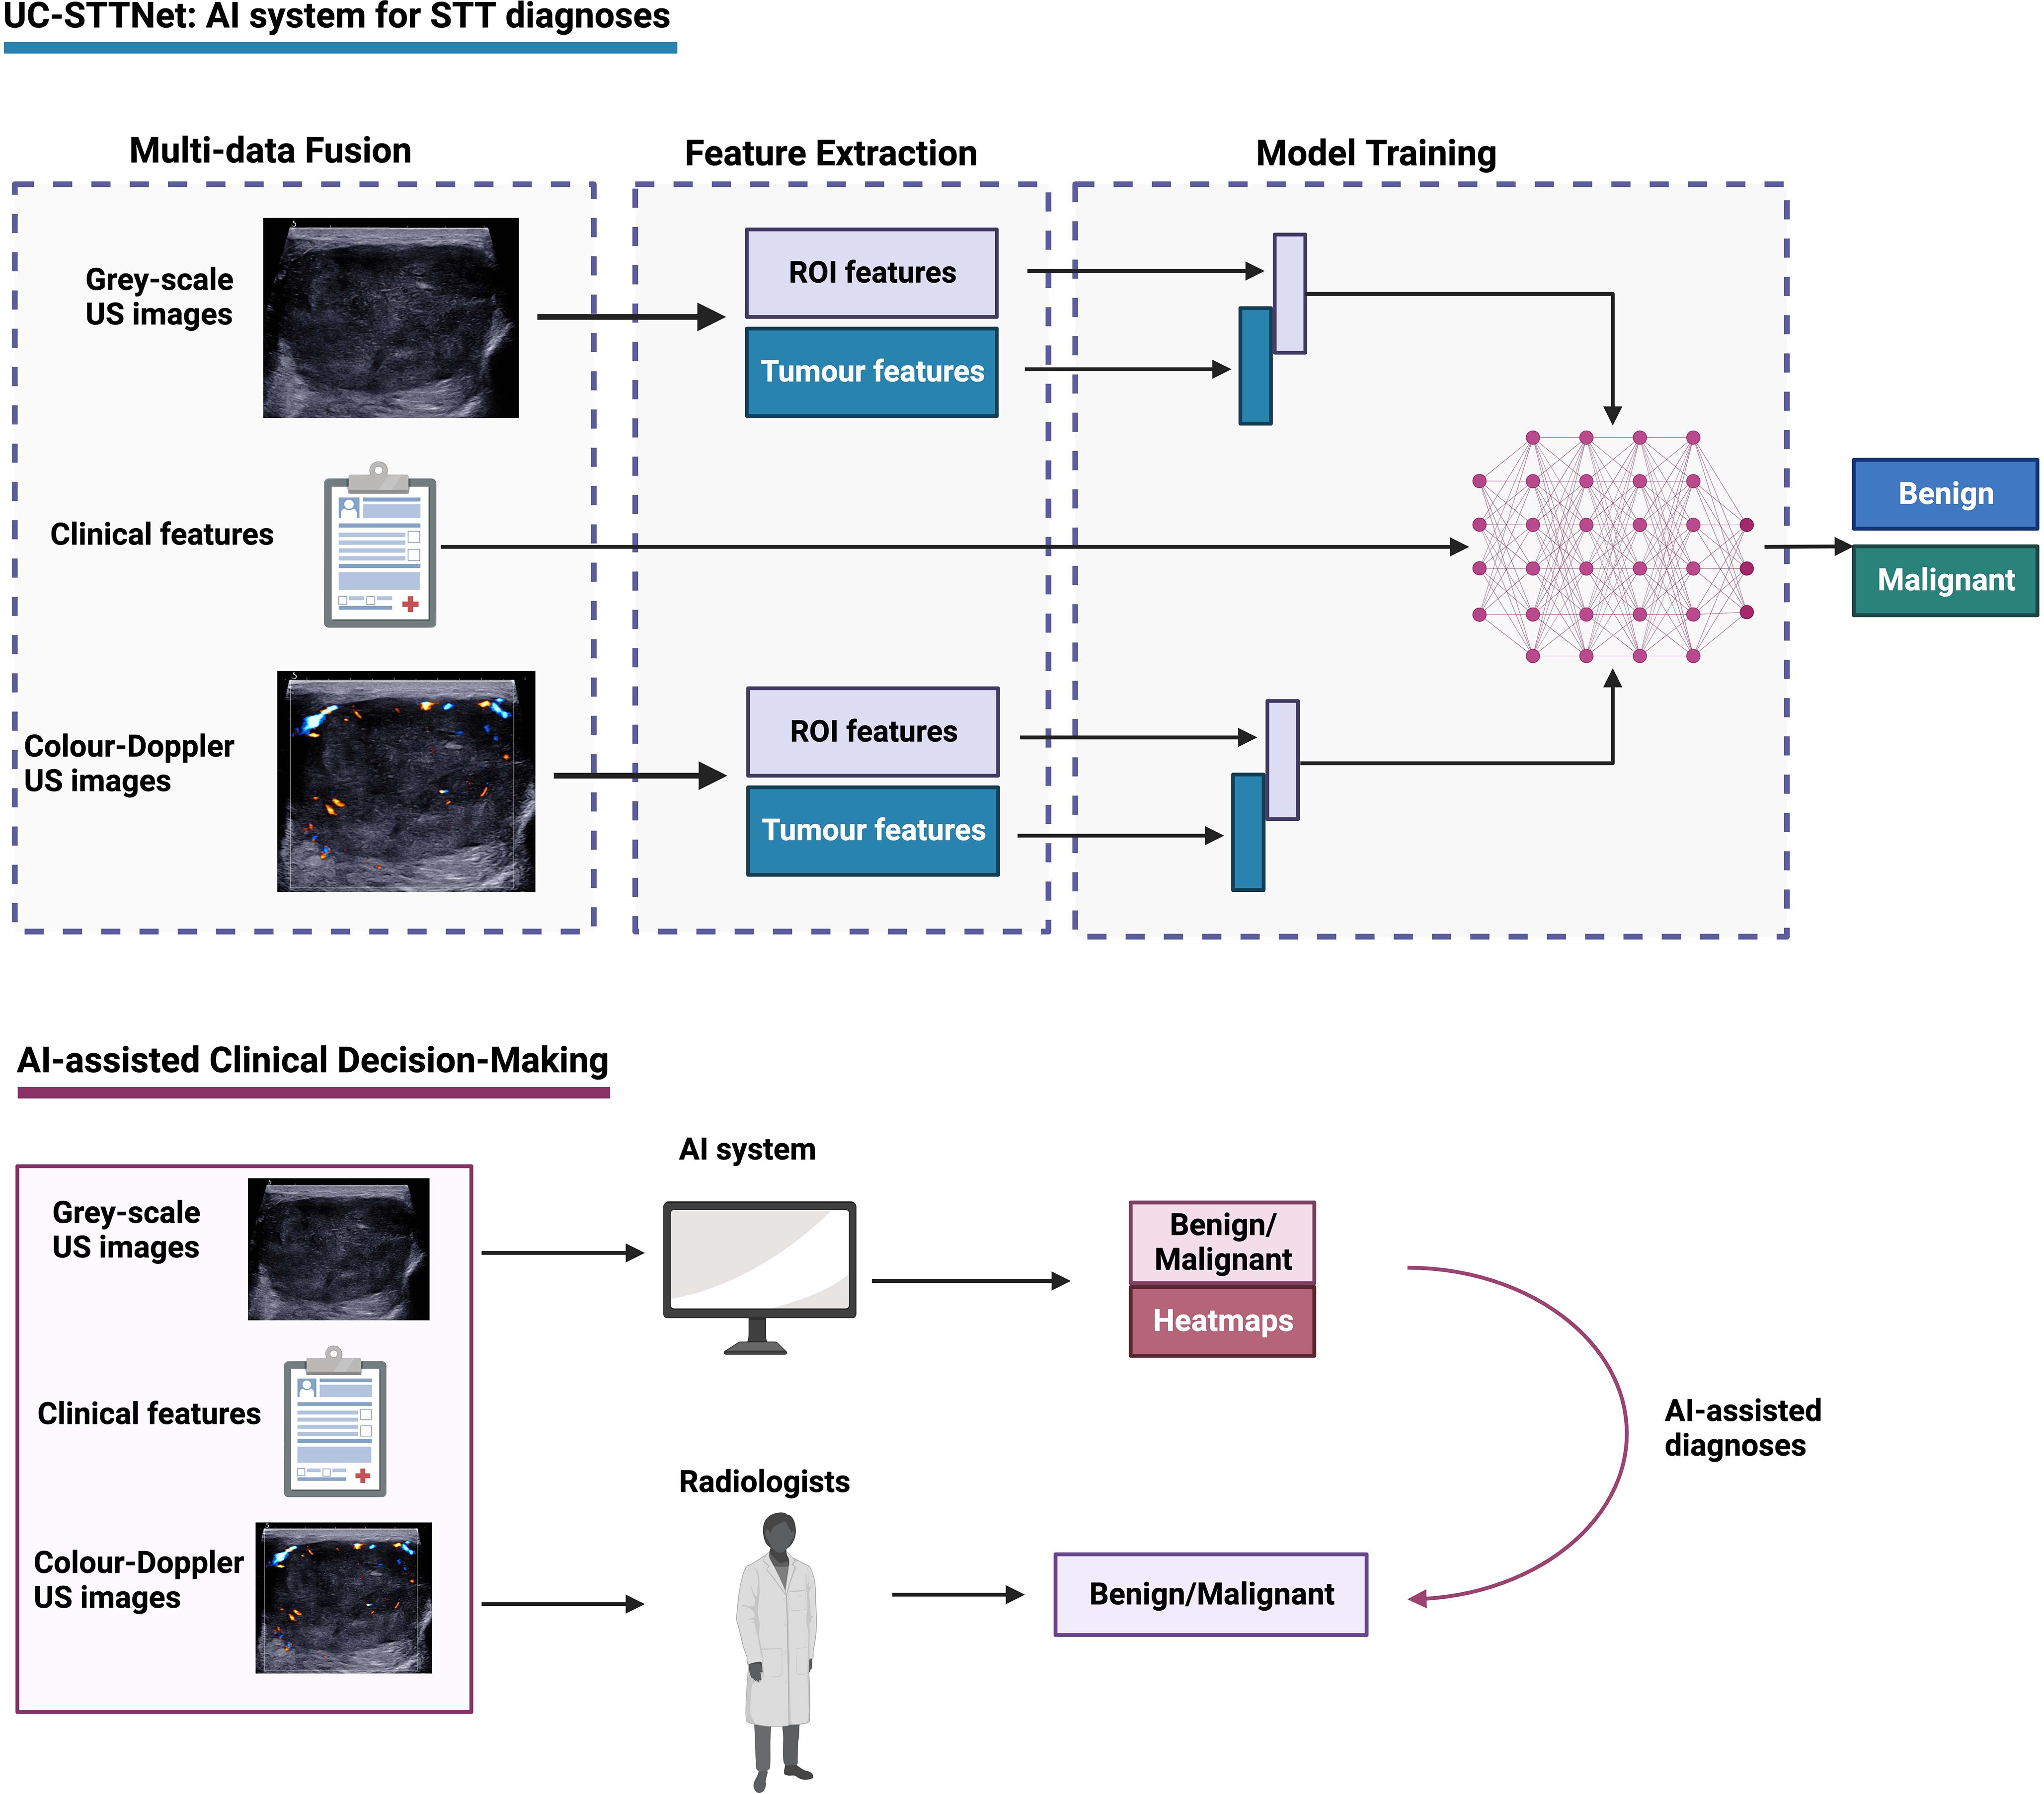
Figure 2 Flow chart of the retrospective and prospective patients’ recruitment.
Clinical data and pathological results
The clinical features and pathological results of the retrospectively enrolled and prospectively enrolled STTs were listed in Table 1. Except sex, the other clinical characteristics between benign and malignant masses, were significantly different.
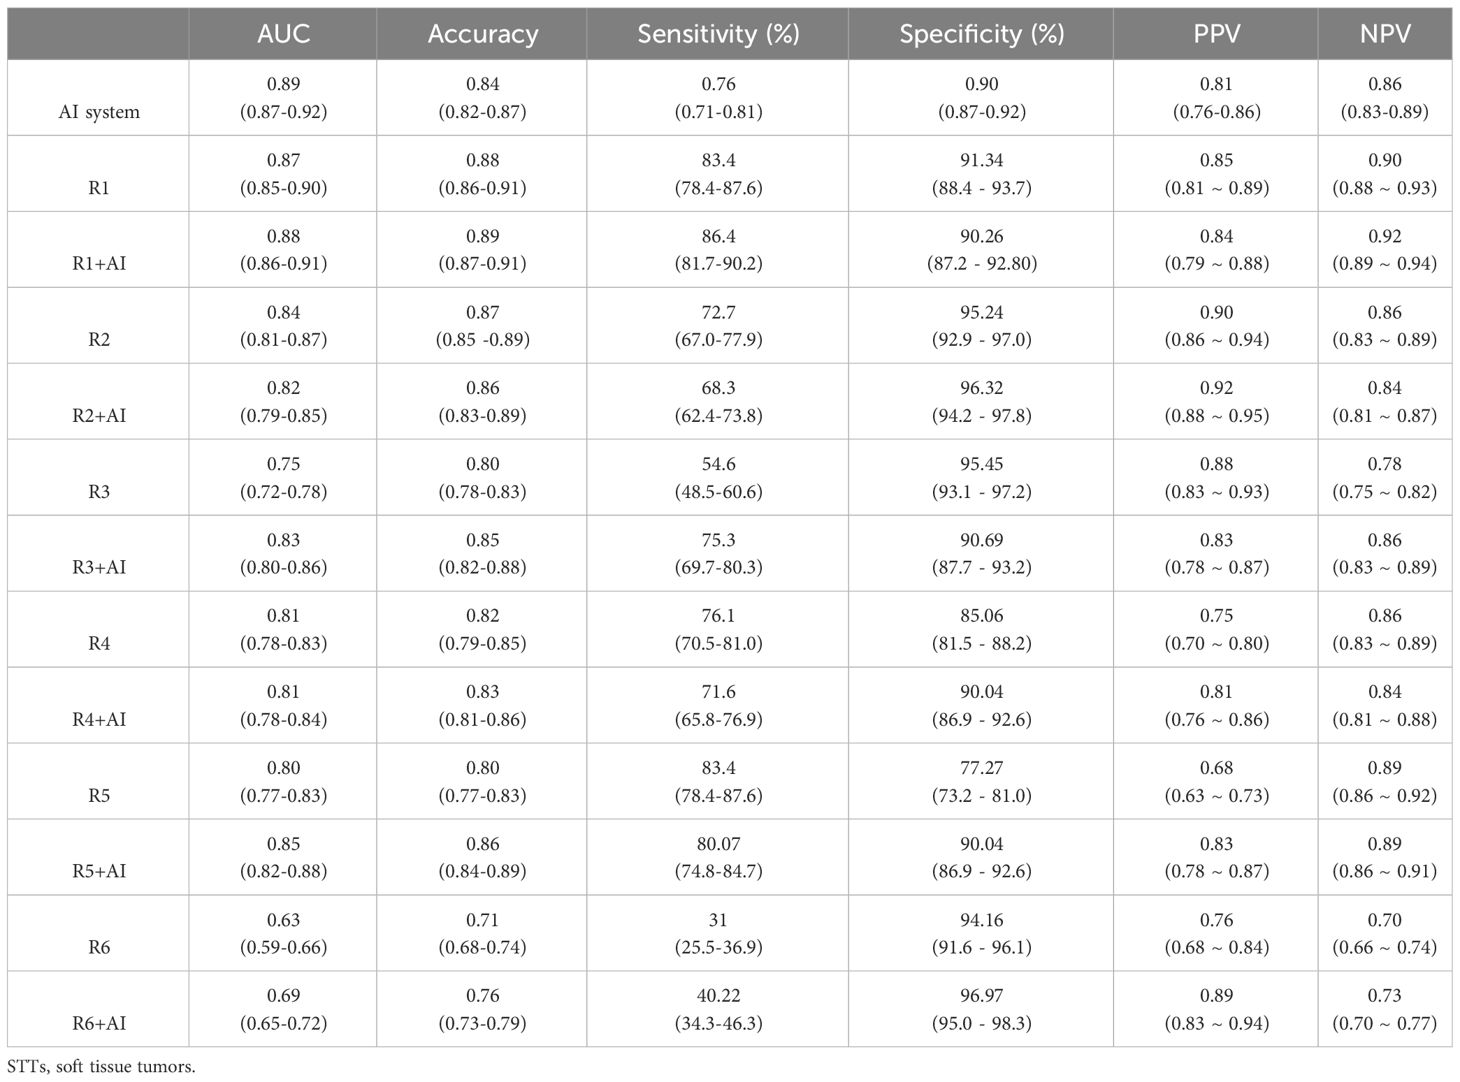
Table 1 Clinical characteristics of 733 retrospective STTs masses and 145 prospective STTs masses.
Performance of the AI system on the retrospective dataset for model building
The performance of the AI system was evaluated using 5-fold cross validation. Of the five validation sets, the highest AUC was 0.91 (95% CI: 0.84, 0.95), with accuracy of 0.89 (95% CI: 0.84, 0.94), sensitivity of 0.82 (95% CI: 0.72, 0.82), specificity of 0.93 (95% CI: 0.88, 0.98), PPV of 0.88 (95% CI: 0.79, 0.97), NPV of 0.90 (95% CI: 0.84, 0.96), respectively. The average AUC, accuracy, sensitivity, specificity, PPV and NPV of the model in the five validations were 0.89 (95% CI: 0.87, 0.92), 0.84 (95% CI: 0.82, 0.87), 0.76 (95% CI: 0.71, 0.81), 0.90 (95% CI: 0.87, 0.92), 0.81 (95% CI: 0. 76, 0.86) and 0.86 (95% CI: 0.83, 0.89), respectively. The AI system showed higher specificity than sensitivity, indicating that the majority of the benign cases (above 90%) were accurately recognized. While there were around 20% of the malignant cases mistakenly classified as benign. Similarly, the NPV value of the model was slightly higher than the PPV value, indicating that the AI system had more confidence (around 3%) in predicting benign cases.
Figure 3A presents the ROCs of all five folds. According to the figure, UC-STTNet appears to be robust and stable when trained and tested with different folds of data. The AUC values of the AI system in the five validations ranged from 0.84 to 0.91, with the standard deviation 0.028. Figure 3B depicted the performances of radiologists with three different experience levels. The diagnostic performance of UC-STTNet was higher than that of one of the senior radiologists (AUC of UC-STTNet vs AUC of R2: 0.89 vs. 0.84, p=0.022) and all the intermediate and junior radiologists (AUC of UC-STTNet vs AUC of R3, R4, R5, and R6: 0.89 vs 0.75, 0.81, 0.80, 0.63; p <0.01), and was comparable to one of the high-level radiologists (AUC of UC-STTNet vs AUC of R1: 0.89 vs 0.87, p=0.30). And there were no significant differences in accuracy, specificity and PPV between the AI system and the intermediated-level radiologists (p=0.09, 0.96, and 0.72, respectively). And the AI system showed better sensitivity and NPV than the intermediated-level radiologists (p=0.01 and 0.04, respectively).
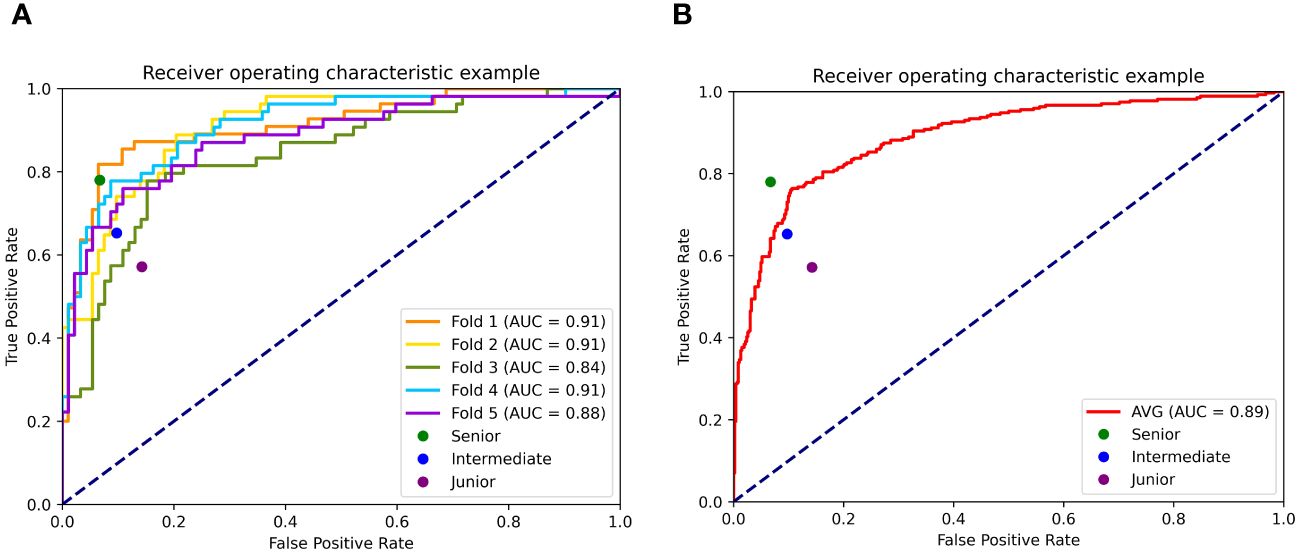
Figure 3 Receiver operating characteristic curves (ROC) of UC-STTNet assessed by 5-fold cross validations and comparing the different level radiologists. 3 (A). ROC of each fold of the AI system and three different levels of radiologists; 3 (B). the average performance of the AI system compared with three levels radiologists.
Assistant role of the AI system for radiologists
. The change in diagnostic performance of each radiologist after the assistance from the AI system was displayed in Figure 4l Table 2. For junior radiologists (R5 and R6) and one of the intermediate radiologists (R3), the AUC values after the AI assistance were significantly improved (R3: 0.75 to 0.83, p<0.01; R5: 0.80 to 0.85, p<0.01; R6: 0.63 to 0.69, p<0.01), indicating that the diagnostic performances of the radiologists could be enhanced via the aid of the AI system.
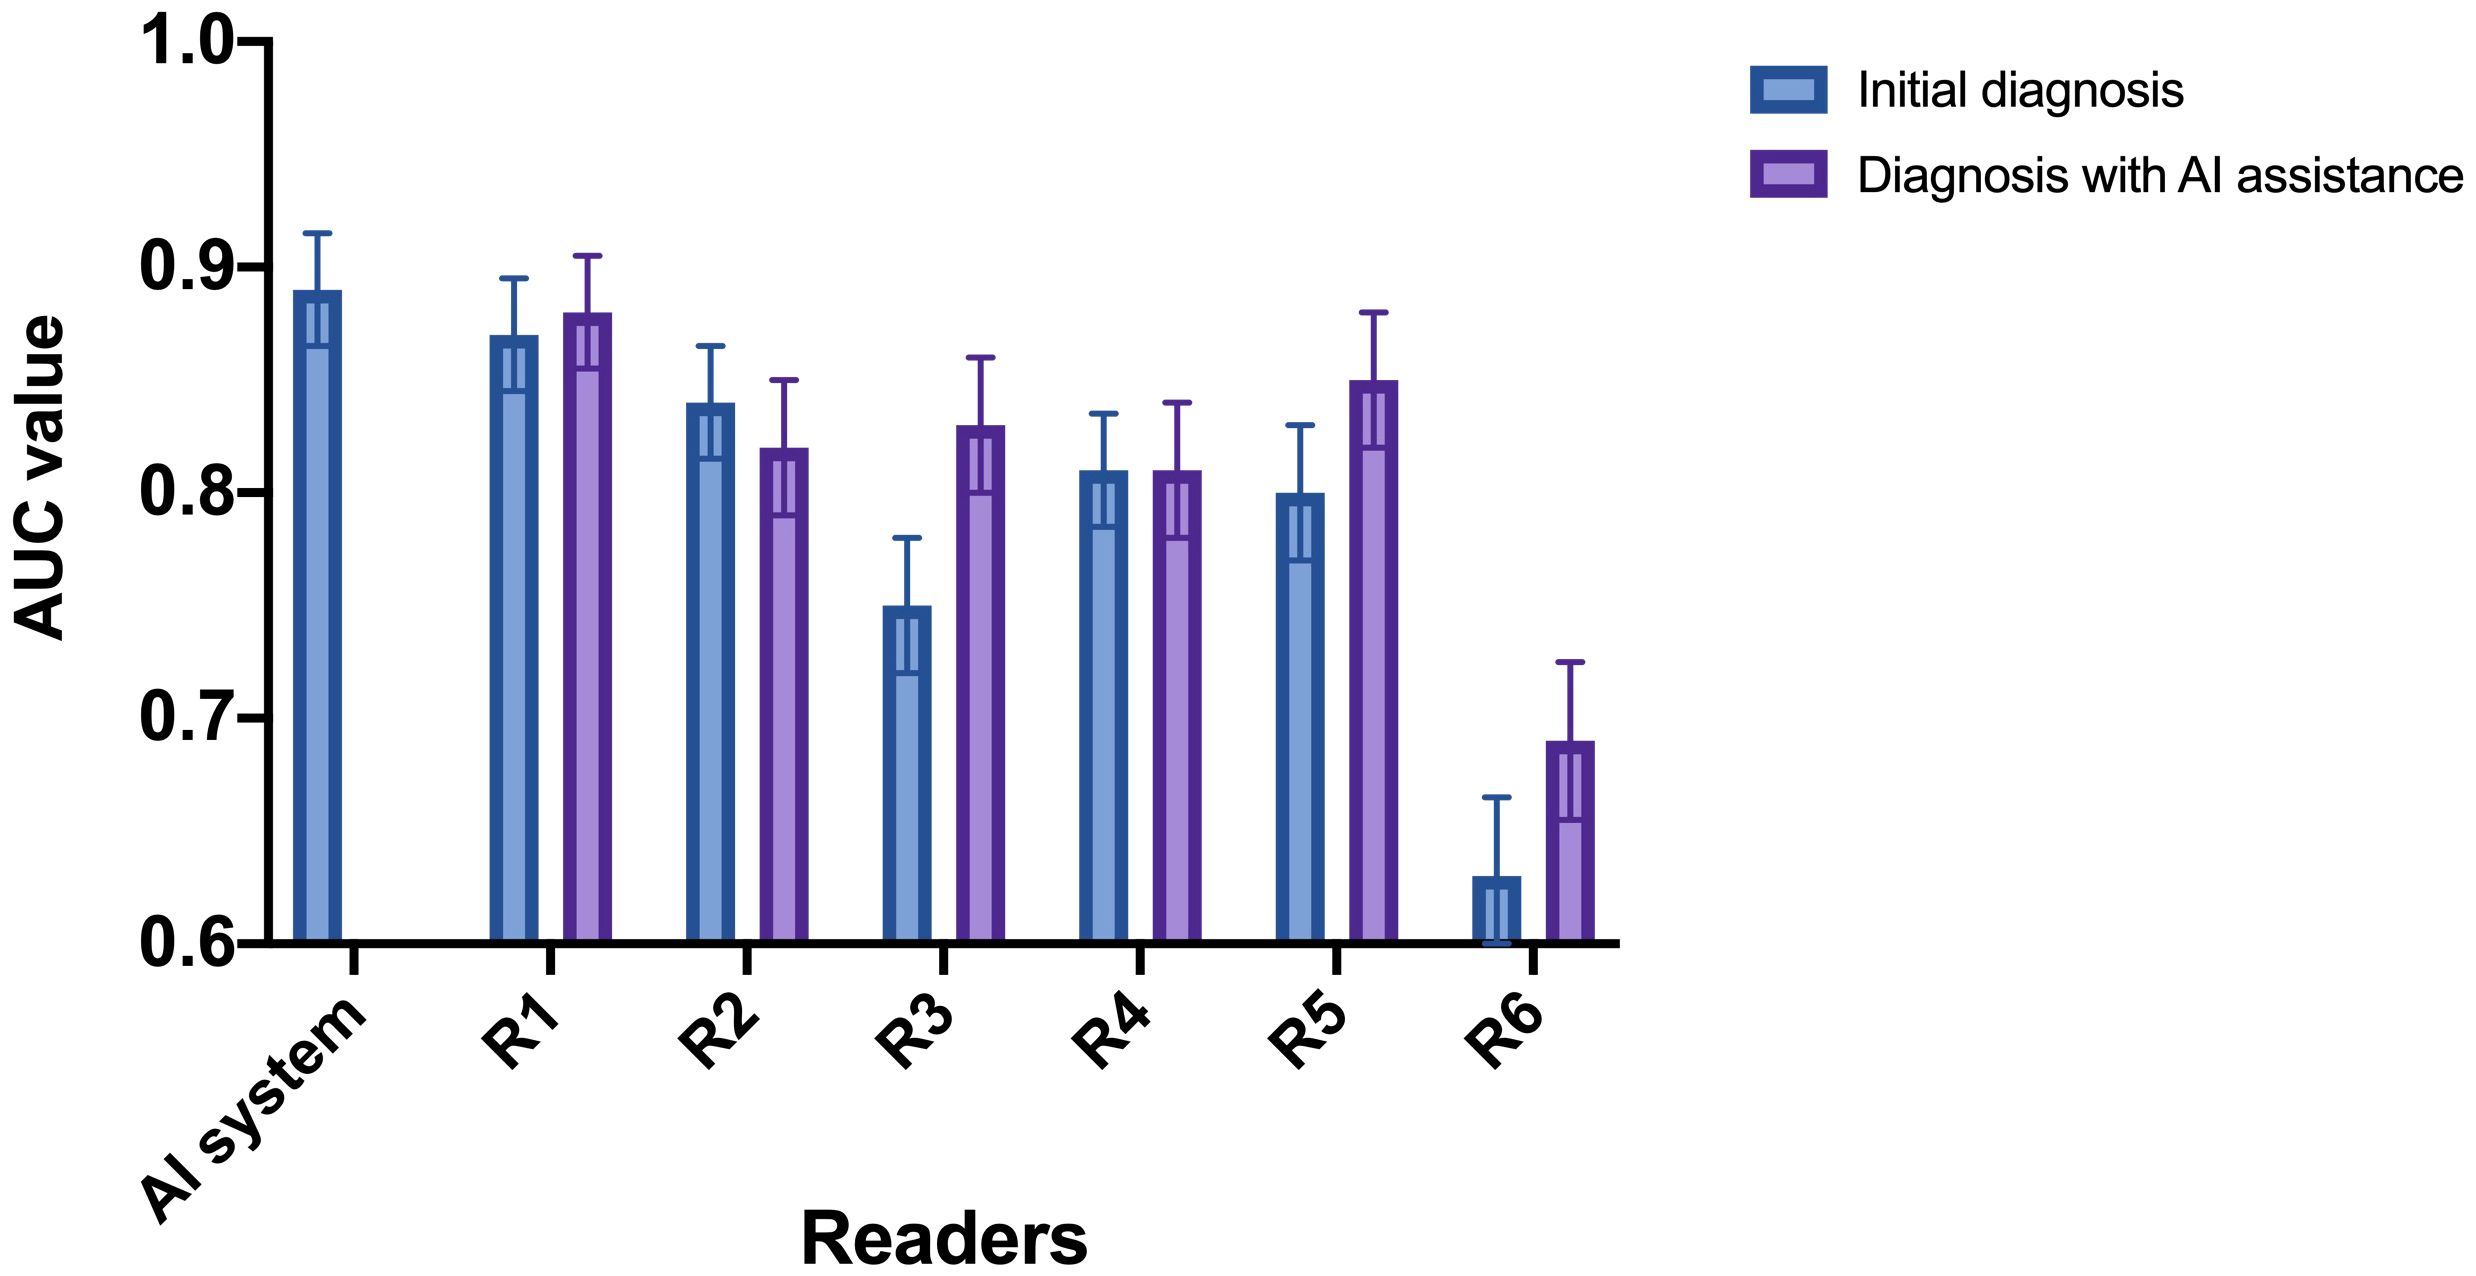
Figure 4 AUC of the radiologists with and without referring to the AI system. R1 and R2: senior radiologists; R3 and R4: intermediate radiologists; R5 and R6: junior radiologists. For junior radiologist (R5 and R6) and one of the intermediate radiologists (R3), the AUC after the AI assistance were significantly improved.
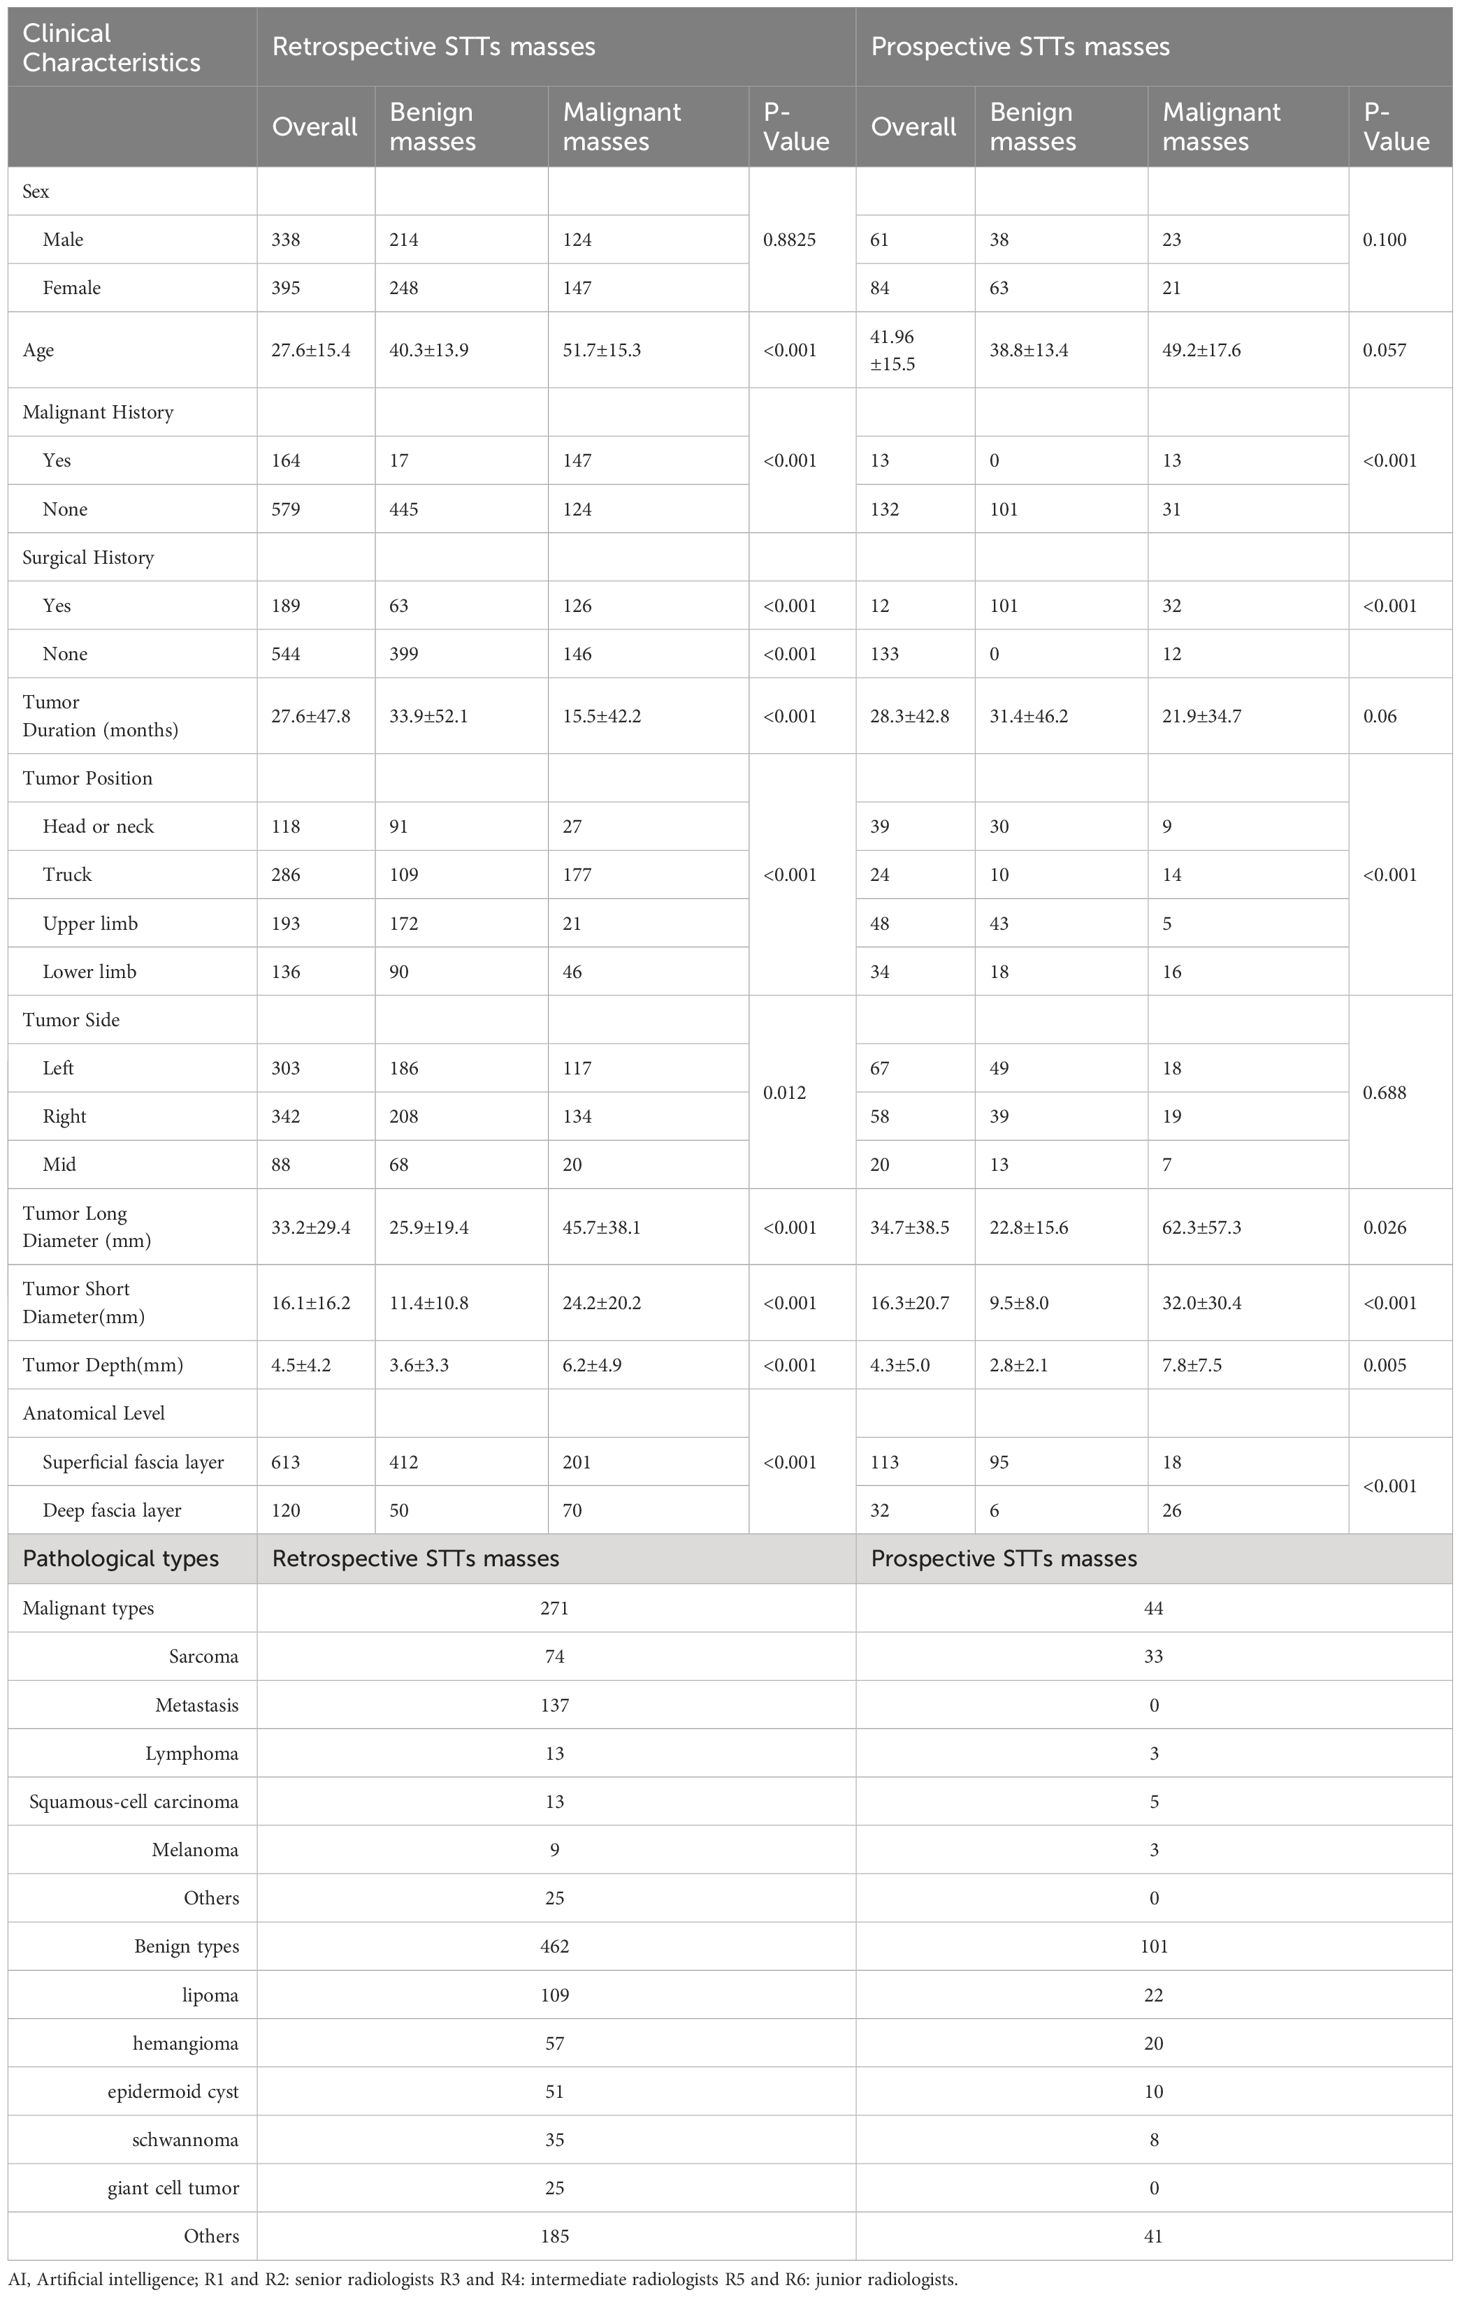
Table 2 Performance of the AI system, the radiologists with three experience levels, and AI-assisted radiologists.
Subsequently, we calculated the ICC value among the six radiologists in classifying the malignant STTs. The original ICC value of the radiologists before referring to the AI system was 0.87 (0.84-0.89), which increased to 0.92 (0.91-0.93) after AI assistance, indicating the diagnostic agreement of the radiologists could be improved via the aid of the AI system.
Explainability of the AI system
Explainability of UC-STTNet was demonstrated as heatmaps that highlights the significant areas attended by the model for malignant STTs diagnosis. The examples of the AI prediction of malignant STTs were illustrated in Figure 5. UC-STTNet gave the prediction result of a malignant STTs mass based on its dual modal US images and clinical indexes. The heatmap of the mass was generated by the AI system and used as reference for radiologists.
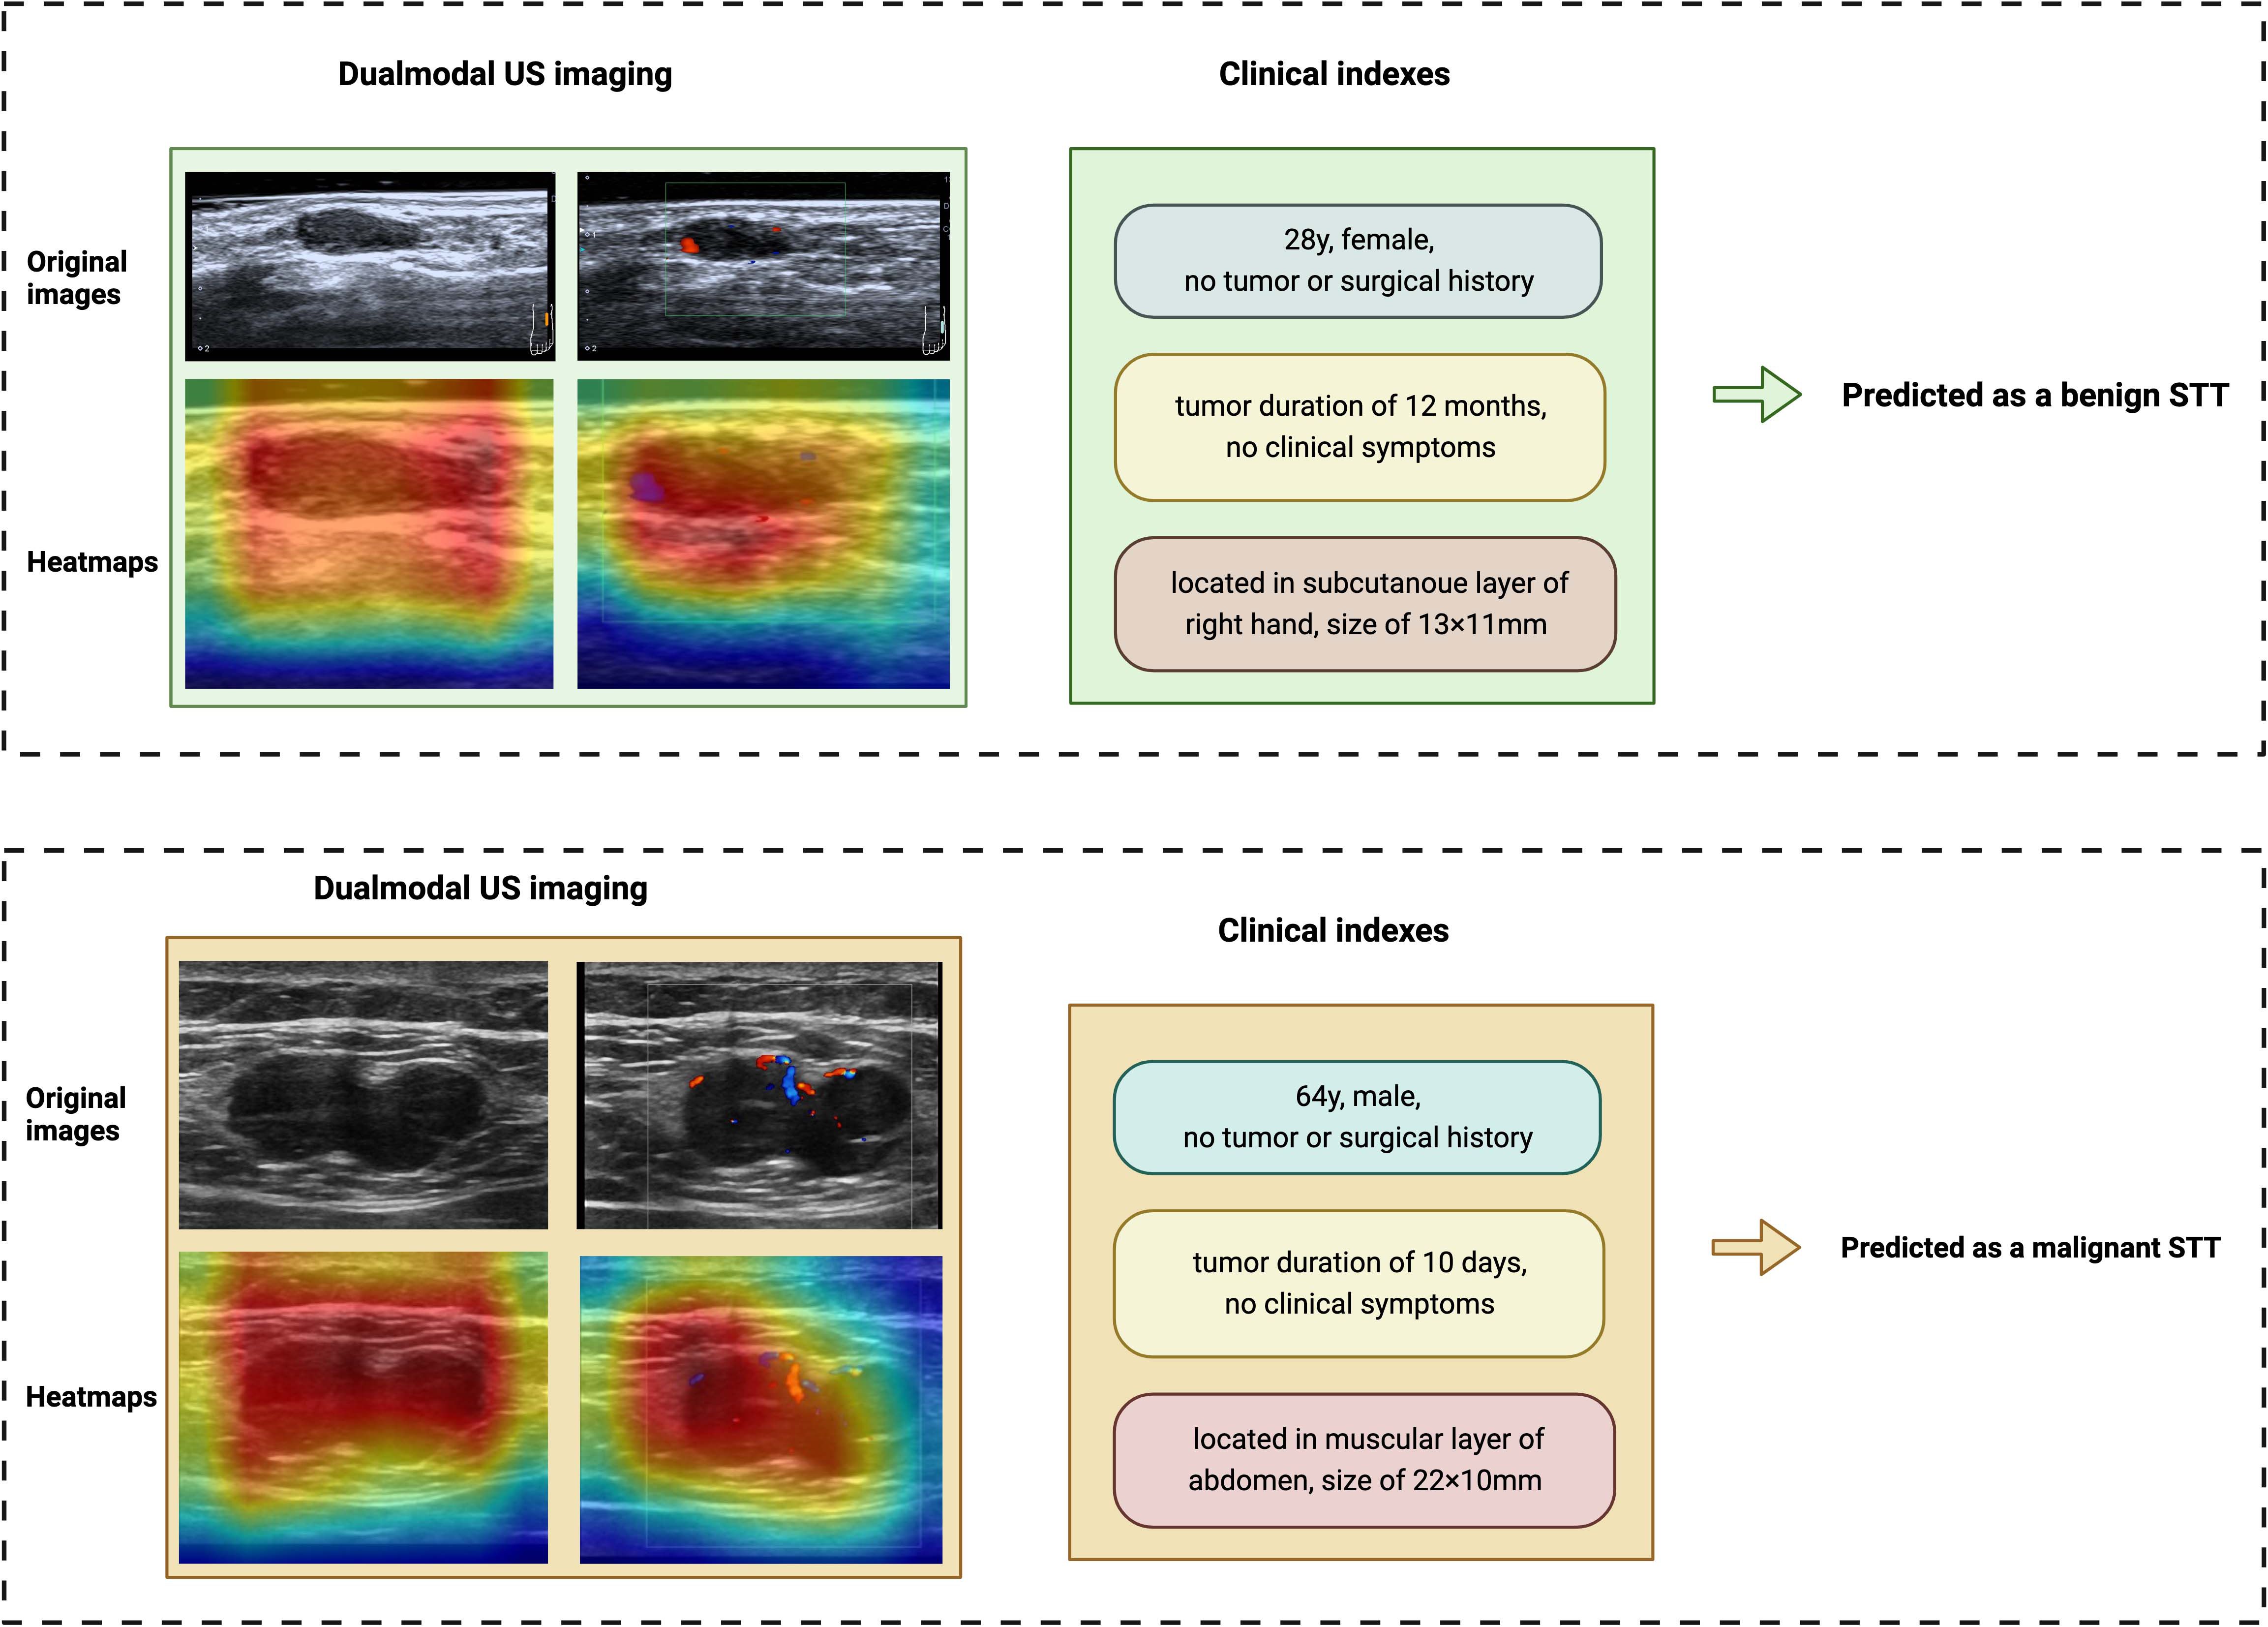
Figure 5 Examples of the AI system classifying benign and malignant STTs. The AI system diagnosed STTs based on dual-modal US images and clinical features. Heatmaps of the two modalities of US were also provided by the system. The above case is a 28-year-old female with a STTs mass on the subcutaneous layer of the right hand. She had no tumor or surgical history. The tumor was found 12 months ago and had a size of 13×11mm. The AI system diagnosed it as a benign tumor, which was identified as a benign schwannoma by pathology. The other case is a 64-year-old male with a STTs mass on the muscular layer of abdomen. The patient also reported no tumor or surgical history. The tumor was found 10 days ago and had a size of 22×11mm. The AI system diagnosed it as a malignant STTs tumor, which was identified as a metastatic malignant melanoma by pathology.
Performance of the AI system on the prospective dataset
The AUC, accuracy, sensitivity, specificity, PPV and NPV of the AI system on the prospective dataset were 0.85 (95% CI: 0.82, 0.89), 0.83 (95% CI: 0.77, 0.90), 0.63 (95% CI: 0.49, 0.78), 0.91 (95% CI: 0.86, 0.97), 0.75 (95% CI: 0.62, 0.90) and 0.85 (95% CI: 0.79, 0.92), respectively. The AUC value of the AI system on the prospective dataset had no statistical difference with the average AUC value on the model-building dataset (0.89 vs 0.85, p=0.282). The diagnostic performance of the AI system in the prospective dataset is shown in Figure 6.
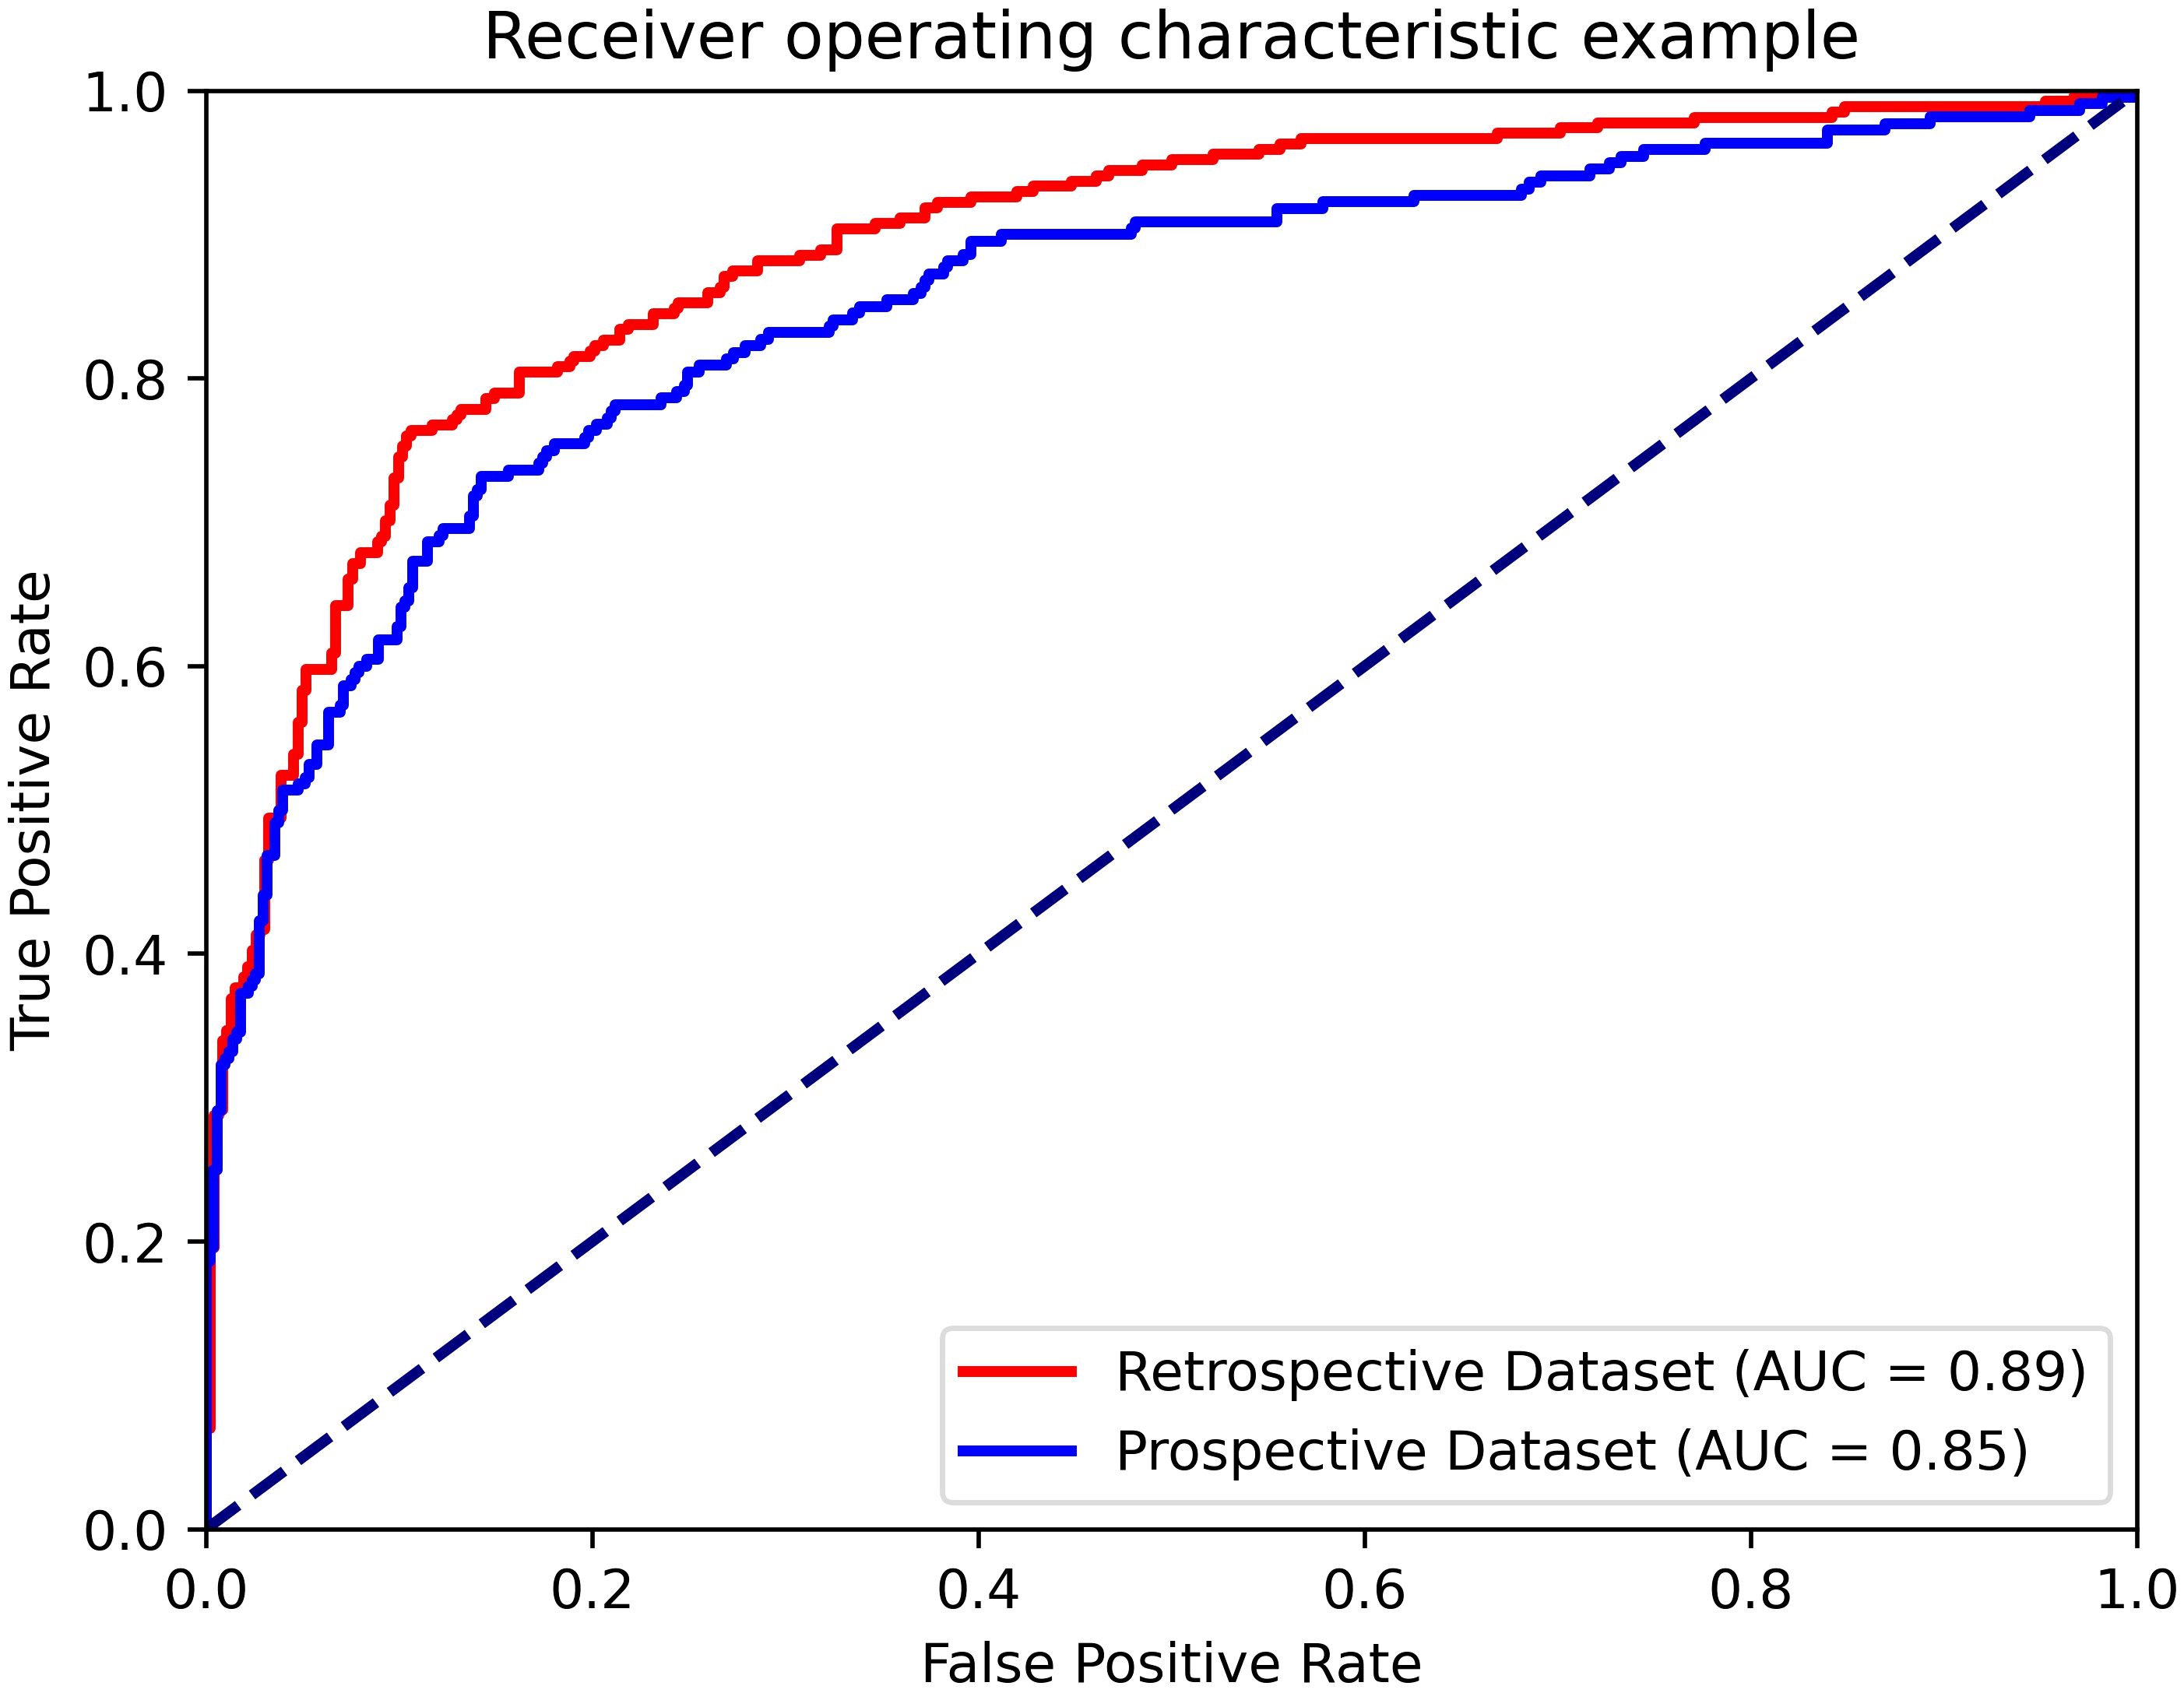
Figure 6 ROC curves of the AI system on the retrospective and prospective datasets.
Discussion
In this study, a total of 733 and 145 masses were collected retrospectively and prospectively. We successfully built a DL-driven AI system, named UC-STTNet, for distinguishing the malignant STTs from benign ones based on dual modal US images and clinical manifestations. The AI system achieved the average AUC value of 0.89 in the retrospective dataset, showing a diagnostic performance comparable to high-level radiologists, superior to intermediate and junior radiologists. With the assistance of the system, the diagnostic performances and inter-observer agreement of the radiologists could be further enhanced. To note, the number of STTs patients and cases involved in our study is so far the largest, among all available literature works.
Diagnostic models for classifying malignant STTs based on US images have been developed by several studies. Despite of their high accuracy, the previous models have some disadvantages and are not suitable for clinical promotion. Chen et al. developed a computer-aid-diagnosis (CAD) system using US images to improve the accuracy of 89.5% for malignant STTs (27). However, manual identifications of lesions were required in their CAD system, which is time-consuming and not convenient for clinical application. Wu MJ et al. established a STTs diagnostic nomogram integrating ultrasound and clinical features via multivariable regression analysis, which achieved an AUC value of 0.896 (29). The sample size for model building was also relatively small. Compared with previous studies, our study has the following strengths. Firstly, we used deep learning algorithm to develop the AI system for diagnosis, which was more intelligent and robust than the hand-crafted systems, and could made automatic diagnosis of the masses. Secondly, the AI system utilized the imaging data of two US modalities, the gray scale and color Doppler US, as well as clinical information, to make a more comprehensive diagnosis of the tumors. Also, the AI system was built on a relatively large number of cases, and its accuracy and robustness were validated on a prospective dataset. The diagnostic performance of UC-STTNet was comparable with a meta-analysis of elastography in assessment of malignant STTs (16). The average AUC and accuracy of our system were 0.89 and 0.84, demonstrating a better performance than the contrast-enhanced ultrasound (CEUS) for predicting the malignancy of STTs, whose AUC and accuracy were 0.86 and 0.81, respectively (32).
We also verified the assistant role of the AI system for radiologists in making diagnosis of malignant STTs. While our results showed that UC-STTNet was superior to the performance of intermediate and junior radiologists, our AI system could help these less experience radiologists make more accurate diagnosis. Meanwhile, the inter-observer agreement of the radiologists was also improved when they referred to the diagnostic results of the AI system. UC-STTNet not only provided the final predictive results of the masses, but also generated heatmaps representing the active areas for diagnosis for the radiologists. Therefore, the AI system could be utilized as an assistant tool for the radiologists to enhance their diagnostic performance and stability in STTs, as well as to decrease operator dependence. To note, compared with other models for diagnosing STTs, including the model based on hand-crafted ultrasound features and the model based on radiomics, the process of using our AI system is more clinical applicable. The AI system can directly generate the result for prediction and does not need lesion delineation and feature extraction. For further clinical promotion of the AI system in the future, we will attempt to integrate the DL architecture into commercial US devices as an on-board software to help to improve the diagnosis performance and decrease workforce for radiologists.
The AI system tends to misdiagnose the benign masses with large size, usually more than 30mm in longitude. The benign STTs that possessing abundant blood vessels on color Doppler US imaging, such as glomangioma, could also be misdiagnosed by the system. On the other hand, the malignant tumors with small size and scarce vasculature might be classified as benign ones. In addition, a total of 6 cases of dermatofibrosarcoma protuberans (DFSP) were predicted as benign by the AI system. For DFSPs, skin changes should also be taken into account during diagnosis. Additionally, misdiagnosis often occurs in patients with a history of malignancy. To prevent the aforementioned misdiagnosis scenarios, more cases should be supplied for model development in the future study. Supplementary Figure 2 demonstrated the examples of the misdiagnosed STTs cases of the AI system.
Our study has several limitations. First, it was a single center research. The AI system was not verified by external validation from multi-center datasets. The sensitivity of the AI system was relatively low in the prospective validation dataset. which should be improved by enrolling more malignant cases in the training dataset in further studies. Also, we only used two modalities of US images to build the model, and other available US modalities, including US elastography and CEUS, were not incorporated in our study. The two US modalities will be added to the system in our future study to improve its diagnostic accuracy. Moreover, we compared the performance of the DL model with the radiologists on the retrospective dataset due to its relatively large sample size. In the future study, the accuracy of the model will be further explored on a large prospective data.
Conclusions
A DL-driven AI system based on dual-modal US images and clinical features for malignant STTs diagnosis was developed on a retrospective dataset of STTs. It achieved a high accuracy in predicting malignant STTs on both retrospective and prospective datasets. The performance of the AI system was comparable to senior radiologists, and better than junior and intermediate radiologists. The developed AI system could also assist radiologists in improving their diagnostic accuracy and stability in classifying malignant STTs.
Data availability statement
The raw data supporting the conclusions of this article will be made available by the authors, without undue reservation.
Ethics statement
The studies involving humans were approved by the ethics committee of Peking University Shenzhen Hospital. The studies were conducted in accordance with the local legislation and institutional requirements. Written informed consent for participation was not required from the participants or the participants’ legal guardians/next of kin in accordance with the national legislation and institutional requirements.
Author contributions
HX: Writing – review & editing, Supervision, Project administration. YZ: Writing – original draft, Software, Formal analysis. LD: Writing – original draft, Software, Methodology, Data curation. HL: Writing – original draft, Software, Formal analysis, Data curation. XL: Writing – original draft, Software, Methodology, Formal analysis. CZ: Writing – original draft, Software, Formal analysis, Data curation. YT: Writing – original draft, Data curation. LX: Writing – original draft, Data curation. WW: Writing – original draft, Data curation. QY: Writing – original draft, Data curation. LL: Writing – review & editing, Supervision. DS: Writing – review & editing, Supervision. LQ: Writing – review & editing, Supervision. LS: Writing – review & editing, Supervision, Project administration. YZ: Writing – original draft, Data curation.
Funding
The author(s) declare that financial support was received for the research, authorship, and/or publication of this article. This work was supported by the General Program for Clinical Research at Peking University Shenzhen Hospital (LCYJ2021003), the Science Technology and Innovation Commission of Shenzhen Municipality in China (JCYJ20210324110015040), Research Foundation of Peking University Shenzhen Hospital (JCYJ2020012), Shenzhen Key Medical Discipline Construction Fund (SZXK051), Sanming Project of Medicine in Shenzhen (SZSM202111011), National Key Research and Development Program of China (2023YFC3402605), the National Natural Science Foundation of China (82261138629), Guangdong Basic and Applied Basic Research Foundation (2023A1515010688), Shenzhen Municipal Science and Technology Innovation Council (JCYJ20220531101412030).
Conflict of interest
The authors declare that the research was conducted in the absence of any commercial or financial relationships that could be construed as a potential conflict of interest.
Publisher’s note
All claims expressed in this article are solely those of the authors and do not necessarily represent those of their affiliated organizations, or those of the publisher, the editors and the reviewers. Any product that may be evaluated in this article, or claim that may be made by its manufacturer, is not guaranteed or endorsed by the publisher.
Supplementary material
The Supplementary Material for this article can be found online at: https://www.frontiersin.org/articles/10.3389/fonc.2024.1361694/full#supplementary-material
Abbreviations
deep learning (DL), ultrasonography (US), soft tissue tumors (STTs), ultrasound clinical soft tissue tumor net (UC-STTNet).
References
1. Jo VY, Doyle LA. Refinements in sarcoma classification in the current 2013 world health organization classification of tumours of soft tissue and bone. Surg Oncol Clin N Am. (2016) 25:621–43. doi: 10.1016/j.soc.2016.05.001
2. Colleran G, Madewell J, Foran P, Shelly M, O’Sullivan PJ. Imaging of soft tissue and osseous sarcomas of the extremities. Semin Ultrasound CT MR. (2011) 32:442–55. doi: 10.1053/j.sult.2011.05.001
3. Siegel RL, Miller KD, Jemal A. Cancer statistics, 2018. CA Cancer J Clin. (2018) 68:7–30. doi: 10.3322/caac.21442
4. Toro JR, Travis LB, Wu HJ, Zhu K, Fletcher CD, Devesa SS. Incidence patterns of soft tissue sarcomas, regardless of primary site, in the surveillance, epidemiology and end results program, 1978-2001: An analysis of 26,758 cases. Int J Cancer. (2006) 119:2922–30. doi: 10.1002/ijc.22239
5. Tan MC, Brennan MF, Kuk D, Agaram NP, Antonescu CR, Qin LX, et al. Histology-based classification predicts pattern of recurrence and improves risk stratification in primary retroperitoneal sarcoma. Ann Surg. (2016) 263:593–600. doi: 10.1097/SLA.0000000000001149
6. Pastore G, Peris-Bonet R, Carli M, Martinez-Garcia C, Sanchez de Toledo J, Steliarova-Foucher E. Childhood soft tissue sarcomas incidence and survival in European children (1978-1997): report from the Automated Childhood Cancer Information System project. Eur J Cancer. (2006) 42:2136–49. doi: 10.1016/j.ejca.2006.05.016
7. Soomers V, Husson O, Young R, Desar I, van der Graaf W. The sarcoma diagnostic interval: a systematic review on length, contributing factors and patient outcomes. ESMO Open. (2020) 5(1):e000592. doi: 10.1136/esmoopen-2019-000592
8. Ferrari A, Miceli R, Casanova M, Meazza C, Favini F, Luksch R, et al. The symptom interval in children and adolescents with soft tissue sarcomas. Cancer. (2010) 116:177–83. doi: 10.1002/cncr.24695
9. Nakamura T, Matsumine A, Matsubara T, Asanuma K, Uchida A, Sudo A. The symptom-to-diagnosis delay in soft tissue sarcoma influence the overall survival and the development of distant metastasis. J Surg Oncol. (2011) 104:771–5. doi: 10.1002/jso.22006
10. Hung EHY, Griffith JF, Yip SWY, Ivory M, Lee JCH, Ng AWH, et al. Accuracy of ultrasound in the characterization of superficial soft tissue tumors: a prospective study. Skeletal Radiol. (2020) 49:883–92. doi: 10.1007/s00256-019-03365-z
11. Nagano S, Yahiro Y, Yokouchi M, Setoguchi T, Ishidou Y, Sasaki H, et al. Doppler ultrasound for diagnosis of soft tissue sarcoma: efficacy of ultrasound-based screening score. Radiol Oncol. (2015) 49:135–40. doi: 10.1515/raon-2015-0011
12. Ozturk M, Selcuk MB, Polat AV, Ozbalci AB, Baris YS. The diagnostic value of ultrasound and shear wave elastography in the differentiation of benign and Malignant soft tissue tumors. Skeletal Radiol. (2020) 49:1795–805. doi: 10.1007/s00256-020-03492-y
13. Woo T, Lalam R, Cassar-Pullicino V, Degrieck B, Verstraete K, Donati DM, et al. Imaging of upper limb tumors and tumorlike pathology. Radiol Clin North Am. (2019) 57:1035–50. doi: 10.1016/j.rcl.2019.03.008
14. Rimondi E, Benassi MS, Bazzocchi A, Balladelli A, Facchini G, Rossi G, et al. Translational research in diagnosis and management of soft tissue tumours. Cancer Imaging. (2016) 16:13. doi: 10.1186/s40644-016-0071-7
15. De Marchi A, Pozza S, Charrier L, Cannone F, Cavallo F, Linari A, et al. Small subcutaneous soft tissue tumors (<5 cm) can be sarcomas and contrast-enhanced ultrasound (CEUS) is useful to identify potentially Malignant masses. Int J Environ Res Public Health. (2020) 17(23):8868. doi: 10.3390/ijerph17238868
16. Wu M, Ren A, Xu D, Peng X, Ye X, Li A. Diagnostic performance of elastography in Malignant soft tissue tumors: A systematic review and meta-analysis. Ultrasound Med Biol. (2021) 47:855–68. doi: 10.1016/j.ultrasmedbio.2020.12.017
17. Jiang M, Li CL, Luo XM, Chuan ZR, Lv WZ, Li X, et al. Ultrasound-based deep learning radiomics in the assessment of pathological complete response to neoadjuvant chemotherapy in locally advanced breast cancer. Eur J Cancer. (2021) 147:95–105. doi: 10.1016/j.ejca.2021.01.028
18. Zheng X, Yao Z, Huang Y, Yu Y, Wang Y, Liu Y, et al. Deep learning radiomics can predict axillary lymph node status in early-stage breast cancer. Nat Commun. (2020) 11:1236. doi: 10.1038/s41467-020-15027-z
19. Bai Z, Chang L, Yu R, Li X, Wei X, Yu M, et al. Thyroid nodules risk stratification through deep learning based on ultrasound images. Med Phys. (2020) 47:6355–65. doi: 10.1002/mp.14543
20. Lee JH, Chai YJ. A deep-learning model to assist thyroid nodule diagnosis and management. Lancet Digit Health. (2021) 3:e409. doi: 10.1016/S2589-7500(21)00114-X
21. Peng S, Liu Y, Lv W, Liu L, Zhou Q, Yang H, et al. Deep learning-based artificial intelligence model to assist thyroid nodule diagnosis and management: a multicentre diagnostic study. Lancet Digit Health. (2021) 3:e250–9. doi: 10.1016/S2589-7500(21)00041-8
22. Chaudhary K, Poirion OB, Lu L, Garmire LX. Deep learning-based multi-omics integration robustly predicts survival in liver cancer. Clin Cancer Res. (2018) 24:1248–59. doi: 10.1158/1078-0432.CCR-17-0853
23. Wang K, Lu X, Zhou H, Gao Y, Zheng J, Tong M, et al. Deep learning Radiomics of shear wave elastography significantly improved diagnostic performance for assessing liver fibrosis in chronic hepatitis B: a prospective multicentre study. Gut. (2019) 68:729–41. doi: 10.1136/gutjnl-2018-316204
24. Xi IL, Wu J, Guan J, Zhang PJ, Horii SC, Soulen MC, et al. Deep learning for differentiation of benign and Malignant solid liver lesions on ultrasonography. Abdom Radiol (NY). (2021) 46:534–43. doi: 10.1007/s00261-020-02564-w
25. Christensen ABH, Just SA, Andersen JKH, Savarimuthu TR. Applying cascaded convolutional neural network design further enhances automatic scoring of arthritis disease activity on ultrasound images from rheumatoid arthritis patients. Ann Rheum Dis. (2020) 79:1189–93. doi: 10.1136/annrheumdis-2019-216636
26. Zhao C, Xiao M, Jiang Y, Liu H, Wang M, Wang H, et al. Feasibility of computer-assisted diagnosis for breast ultrasound: the results of the diagnostic performance of S-detect from a single center in China. Cancer Manag Res. (2019) 11:921–30. doi: 10.2147/CMAR
27. Chen CY, Chiou HJ, Chou SY, Chiou SY, Wang HK, Chou YH, et al. Computer-aided diagnosis of soft-tissue tumors using sonographic morphologic and texture features. Acad Radiol. (2009) 16:1531–8. doi: 10.1016/j.acra.2009.07.024
28. Chen CY, Chiou HJ, Chou YH, Chiou SY, Wang HK, Chou SY, et al. Computer-aided diagnosis of soft tissue tumors on high-resolution ultrasonography with geometrical and morphological features. Acad Radiol. (2009) 16:618–26. doi: 10.1016/j.acra.2008.12.016
29. Wu M, Hu Y, Ren A, Peng X, Ma Q, Mao C, et al. Nomogram based on ultrasonography and clinical features for predicting Malignancy in soft tissue tumors. Cancer Manag Res. (2021) 13:2143–52. doi: 10.2147/CMAR.S296972
30. DeLong ER, DeLong DM, Clarke-Pearson DL. Comparing the areas under two or more correlated receiver operating characteristic curves: a nonparametric approach. Biometrics. (1988) 44:837–45. doi: 10.2307/2531595
31. Hanley JA, McNeil BJ. A method of comparing the areas under receiver operating characteristic curves derived from the same cases. Radiology. (1983) 148:839–43. doi: 10.1148/radiology.148.3.6878708
Keywords: deep learning, artificial intelligence, ultrasound, soft tissue tumor, malignant tumor
Citation: Xie H, Zhang Y, Dong L, Lv H, Li X, Zhao C, Tian Y, Xie L, Wu W, Yang Q, Liu L, Sun D, Qiu L, Shen L and Zhang Y (2024) Deep learning driven diagnosis of malignant soft tissue tumors based on dual-modal ultrasound images and clinical indexes. Front. Oncol. 14:1361694. doi: 10.3389/fonc.2024.1361694
Received: 26 December 2023; Accepted: 08 May 2024;
Published: 23 May 2024.
Edited by:
Poonam Yadav, Northwestern University, United StatesReviewed by:
Aurel Ottlakan, University of Szeged, HungaryJaya Lakshmi Thangaraj, University of California, San Diego, United States
Copyright © 2024 Xie, Zhang, Dong, Lv, Li, Zhao, Tian, Xie, Wu, Yang, Liu, Sun, Qiu, Shen and Zhang. This is an open-access article distributed under the terms of the Creative Commons Attribution License (CC BY). The use, distribution or reproduction in other forums is permitted, provided the original author(s) and the copyright owner(s) are credited and that the original publication in this journal is cited, in accordance with accepted academic practice. No use, distribution or reproduction is permitted which does not comply with these terms.
*Correspondence: Linlin Shen, llshen@szu.edu.cn; Yusen Zhang, 395041386@qq.com