 Zesi Liu
 Chunli Jing2†
 Fandou Kong
- 1Department of Gynecology and Obstetrics, The First Affiliated Hospital of Dalian Medical University, Dalian, Liaoning, China
- 2Department of Gynecology and Obstetrics, The Second Affiliated Hospital of Dalian Medical University, Dalian, Liaoning, China
Background: Ovarian clear cell carcinoma (OCCC) is one of the special histologic subtypes of ovarian cancer. This study aimed to construct and validate log odds of positive lymph nodes (LODDS)-based nomograms for predicting the overall survival (OS) and cancer-specific survival (CSS) in patients with OCCC.
Methods: Patients who underwent surgical treatment between 2010 and 2016 were extracted from the Surveillance Epidemiology and End Results (SEER) database and the data of OCCC patients from the First Affiliated Hospital of Dalian Medical University were used as the external validation group to test the validity of the prognostic model. The best-fitting models were selected by stepwise Cox regression analysis. Survival probability was calculated by the Kaplan–Meier method, and the differences in survival time between subgroups were compared using the log-rank test. Each nomogram’s performance was assessed by the calibration plots, decision curve analysis (DCA), and receiver operating characteristics (ROC) curves.
Results: T stage, distant metastasis, marital status, and LODDS were identified as significant risk factors for OS. A model with four risk factors (age, T stage, stage, and LODDS value) was obtained for CSS. Nomograms were constructed by incorporating the prognostic factors to predict 1-, 3- and 5-year OS and CSS for OCCC patients, respectively. The area under the curve (AUC) range of our nomogram model for OS and CSS prediction ranged from 0.738-0.771 and 0.769-0.794, respectively, in the training cohort. The performance of this model was verified in the internal and external validation cohorts. Calibration plots illustrated nomograms have good prognostic reliability.
Conclusion: Predictive nomograms were constructed and validated to evaluate the OS and CSS of OCCC patients. These nomograms may provide valuable prognostic information and guide postoperative personalized care in OCCC.
1 Introduction
Ovarian cancer is one of the most common malignancies of the female reproductive tract, of which 90% are epithelial ovarian cancer (EOC) (1). Approximately 230,000 people are diagnosed with EOC each year, resulting in 150,000 deaths annually (2).Ovarian clear cell carcinoma (OCCC) is one of the special histologic subtypes of EOC, accounting for about 5% of EOC in western countries, and approximately 20% in Asian countries (3). Compared with EOC, OCCC is more refractory to platinum-based first-line chemotherapy, with the response rate in OCCC being 11.56% (4, 5). Although early-stage OCCC has a relatively good prognosis, with a 5-year survival rate of 90%, the median overall survival time in advanced-stage OCCC is significantly shorter than that in high-grade serous ovarian cancer (HGSOC) (6, 7). Lymph node (LN) metastasis is one of the main metastasis modes of OCCC (8). The status of regional lymph nodes (LNs) retrieved during surgery appears to be not only an independent prognostic factor but also an essential factor in assessing the risk of recurrence of patients with OCCC (9). The American Joint Committee on Cancer/International Union Against Cancer (AJCC/UICC) tumor-node-metastasis (TNM) classification is widely used to predict prognosis but may lead to an underestimation of N-stage due to its calculation only based on the absolute number of positive LNs. Therefore, many novel LNs staging systems have been proposed to improve the assessment of prognosis in OCCC.
Log odds of positive lymph nodes (LODDS) comprehensively considers the effect of the number of positive lymph nodes (PLNs) and resected lymph nodes (RLNs) on the prognosis for tumor patients and has been widely proven as an effective prognosis prediction tool and a novel lymph node staging system in various malignancies (10). LODDS is calculated with the following expression:
In addition, compared with the AJCC N stage, LODDS showed better discrimination abilities and well-fitting in predicting survival in patients with stage IV rectal cancer (11).
Based on entropy, the Akaike Information Criterion (AIC) statistic calculates the tradeoff between overfitting and poor-fitting models and takes into account the number of parameters that the model estimates to select the more parsimonious model (12, 13). The corrected Akaike Information Criterion (AICc) is a modified version of the AIC including a correction term for small sample sizes and is calculated as following:
The k denotes the number of free parameters, and n is the number of observations (14, 15). In this study, we aimed to use AICc to build prognostic models of the overall survival (OS) and cancer-specific survival (CSS) for OCCC. Finally, nomogram is used to integrate multiple prognostic factors, which enables it to predict a patient’s survival with relative accuracy (16).
2 Materials and methods
2.1 Data source and study population
The Surveillance, Epidemiology, and End Results (SEER) database is supported by the national cancer institute (NCI) of USA and has been around since 1973. The SEER database collects information on every case of cancer reported in 19 geographic regions of the U.S., accounting for about 34.6% of the U.S. population. The SEER∗Stat software (version 8.3.6, https://seer.cancer.gov/seerstat/) was used to screen eligible patients who were OCCC between 2010 and 2016. According to the International classification of Diseases for Oncology, 3rd edition (ICD-O-3) morphological code, histopathologic classification of patients was performed, and the subtypes included: 8310/3, 8313/3, 8443/3 and 8444/3. At the same time, in order to increase the reliability of the results of this trial and to minimize experimental bias, data of OCCC patients from the Department of Gynecology of the First Affiliated Hospital of Dalian Medical University from June 2011 to June 2021 were used as the external validation group to test the validity of the prognostic model (n = 50).
Exclusion criteria are as follows: (a) No histologic diagnosis; (b) Contain two or more primary malignancies; (c) Survival months less than one month; (d) Treatment by primary site surgery; (e) ≥18 years of age; (f) Complete LN data; (g) Lack of relevant demographic and clinicopathological characteristics.
2.2 Variables collected
The following variables for this study were extracted: age, race, marital status, grade (G1 is equivalent to well differentiated; G2 is equivalent to moderately differentiated; G3 is equivalent to poorly differentiated; G4 is equivalent to undifferentiated), 7th AJCC stage, 7th AJCC TNM stage, tumor size, chemotherapy record, RLNs, PLNs, organ metastasis. OS and CSS were considered the primary endpoints. The cut-off values were established by X-tile program (3.5.1) (17).
2.3 Statistical analysis
All OCCC patients from the SEER database were assigned as the training group, and 30% of them were selected by random sampling as the internal validation group. All 50 OCCC patients collected from the First Affiliated Hospital of Dalian Medical University were used as external validation group. Baseline differences in demographic variables between the training cohort and validation cohort were investigated using chi-square tests and independent-sample t tests. Survival probability was calculated by the Kaplan–Meier method, and the differences in survival time between distinct subgroups were compared using the Log-rank test. To identify significant univariate results, the univariate results were visually inspected in R software by comparing the cumulative incidence function (CIF) based on the Turnbull estimator to the cumulative incidence function based on the normal distribution. The Akaike Information Criterion, corrected for small sample size was determined; a smaller AICc means a better fit, and was penalized for being overloaded with parameters (18, 19). As a result, the best-fitting model was chosen by selecting the lowest AICc. Then, nomograms were constructed and used to predict 1-, 3- and 5-year OS and CSS for OCCC patients. The predictive performance of the nomogram was verified internally for discrimination and calibration through the C-statistics, area under the curve (AUC) and calibration curves (20, 21). Finally, by evaluating model performance by considering the clinical consequences of true positives and false positives, decision curve analysis (DCA) compares the net benefit between the nomogram model and the multivariate Cox regression model across a range of threshold probabilities so that we can select better predictive models for clinical decision making.
All statistical analyses were performed with R version 4.2.1 (www.R-project.org). A P-value of< 0.05 was considered statistically significant.
3 Results
3.1 Patient characteristics
A total of 766 patients with primary OCCC from the SEER database were enrolled in the trial, and data on 50 patients with primary OCCC were collected as an external validation group for the trial (Figure 1) and the characteristics of these patients from the SEER database are listed in Table 1. There were no significant differences between the training group and the validation group with regards to the demographic and clinicopathological characteristics, thus implying that two groups were comparable. The incidence of OCCC is higher in the elderly, with 86.5% of patients older than 45 years. The distribution of race among patients demonstrated that the largest ethnic groups were white people (72.1%). Although most patients were diagnosed at a limited stage (64.8%), 53.4% had poorly differentiated tumors, 36.6% had undifferentiated tumors and 82.1% received chemotherapy during treatment in the training cohort.
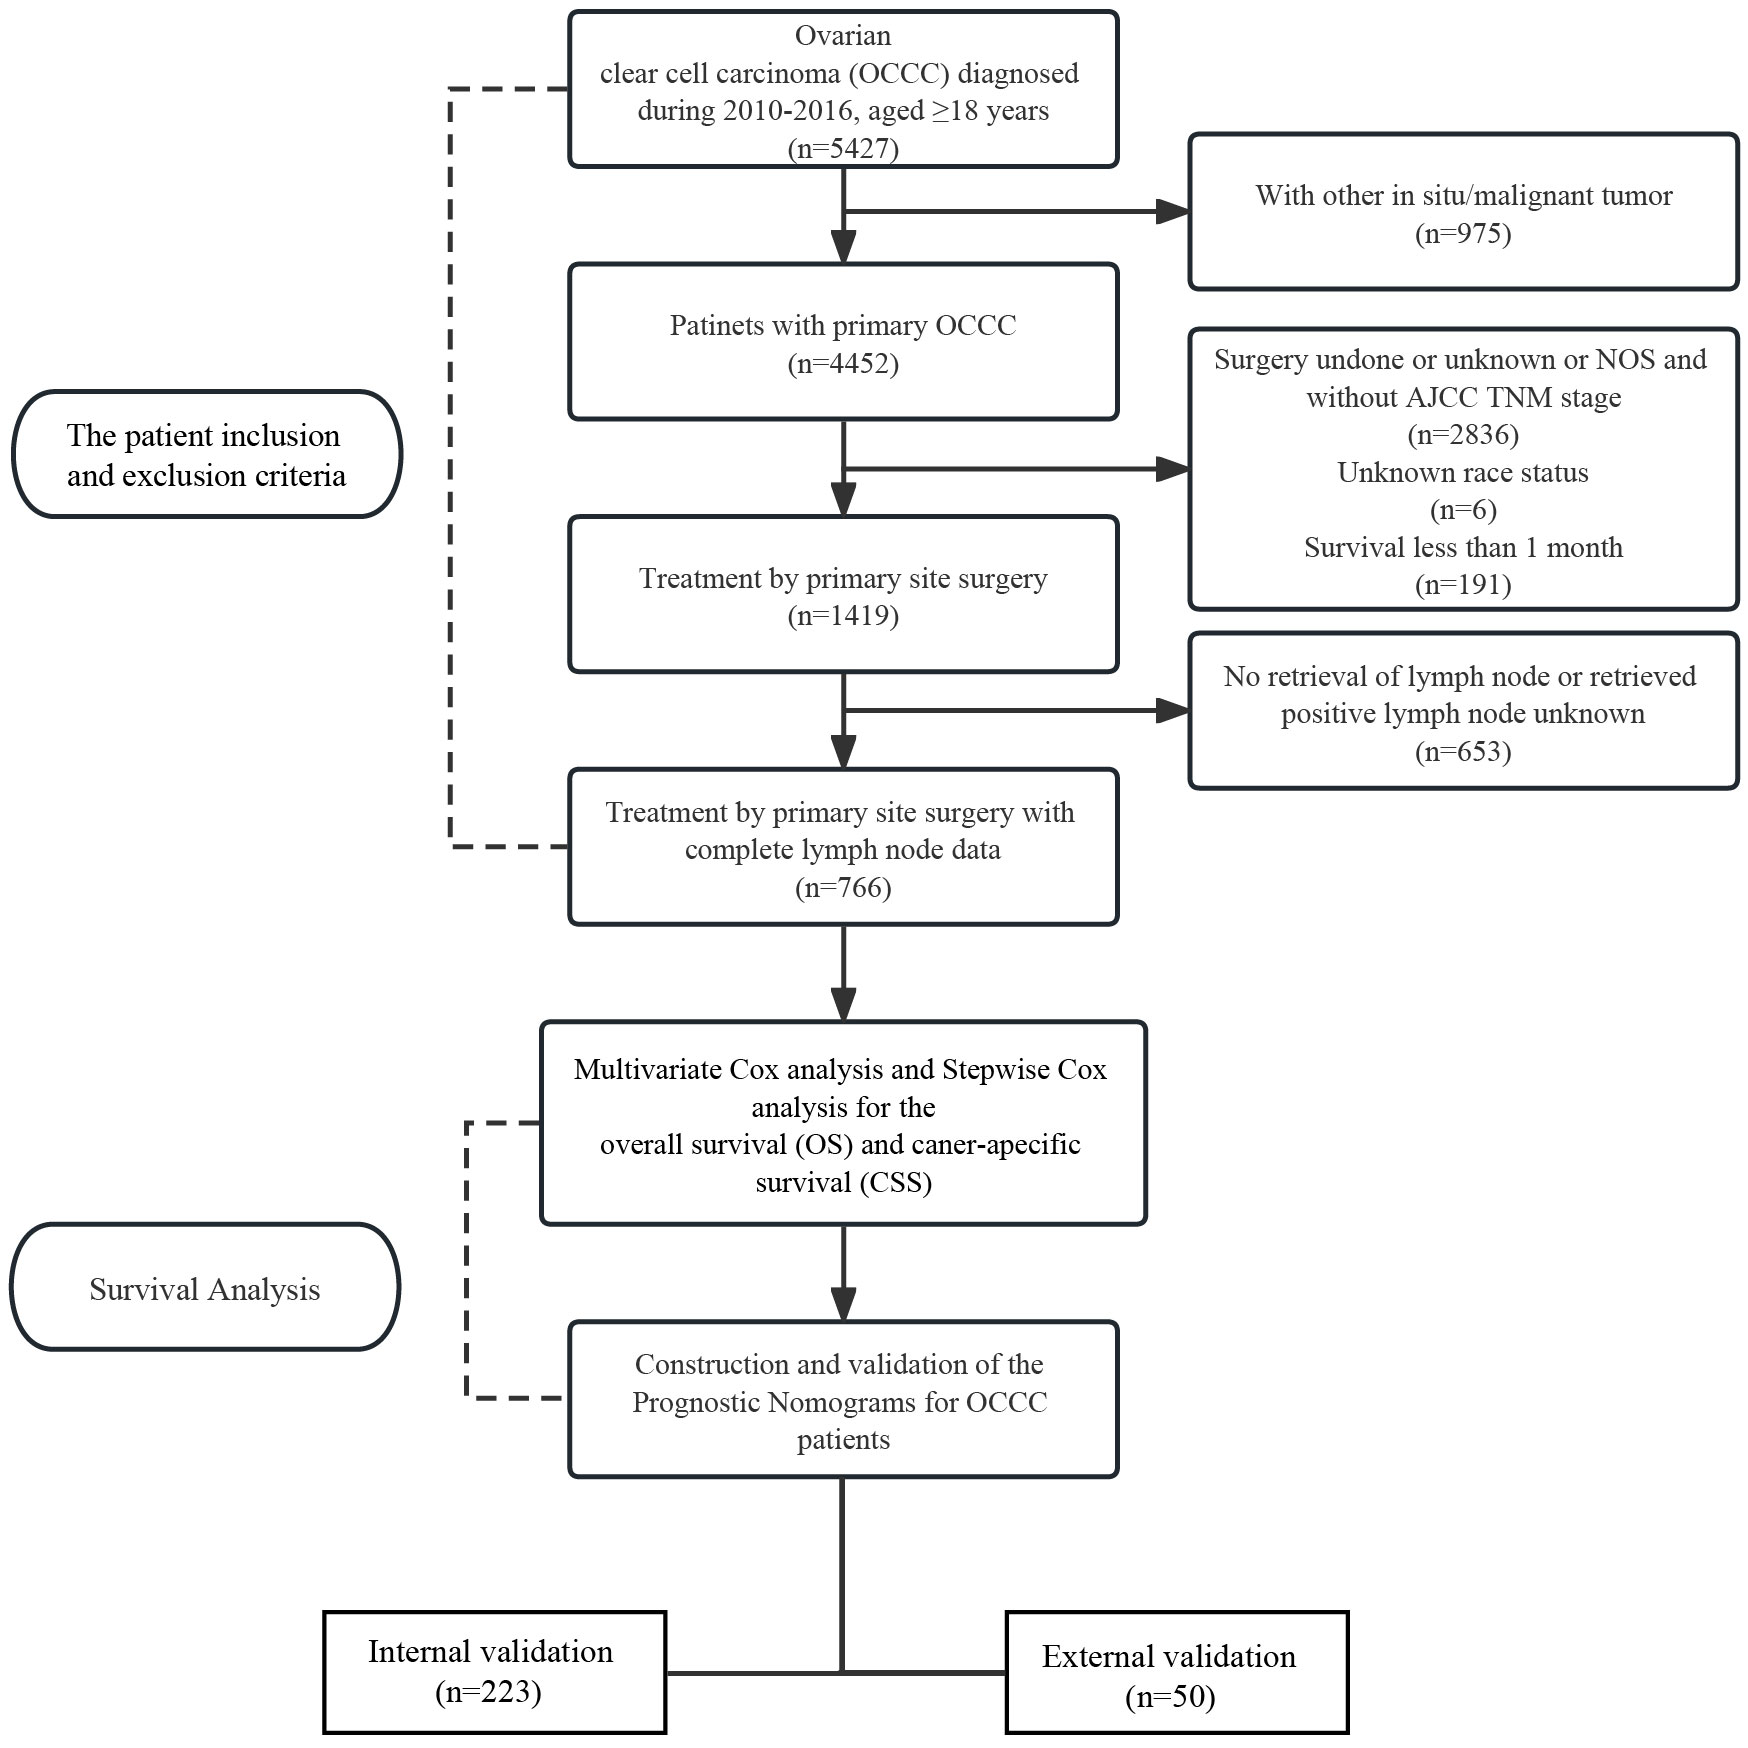
Figure 1 Flow diagram of patient selection and survival analysis.
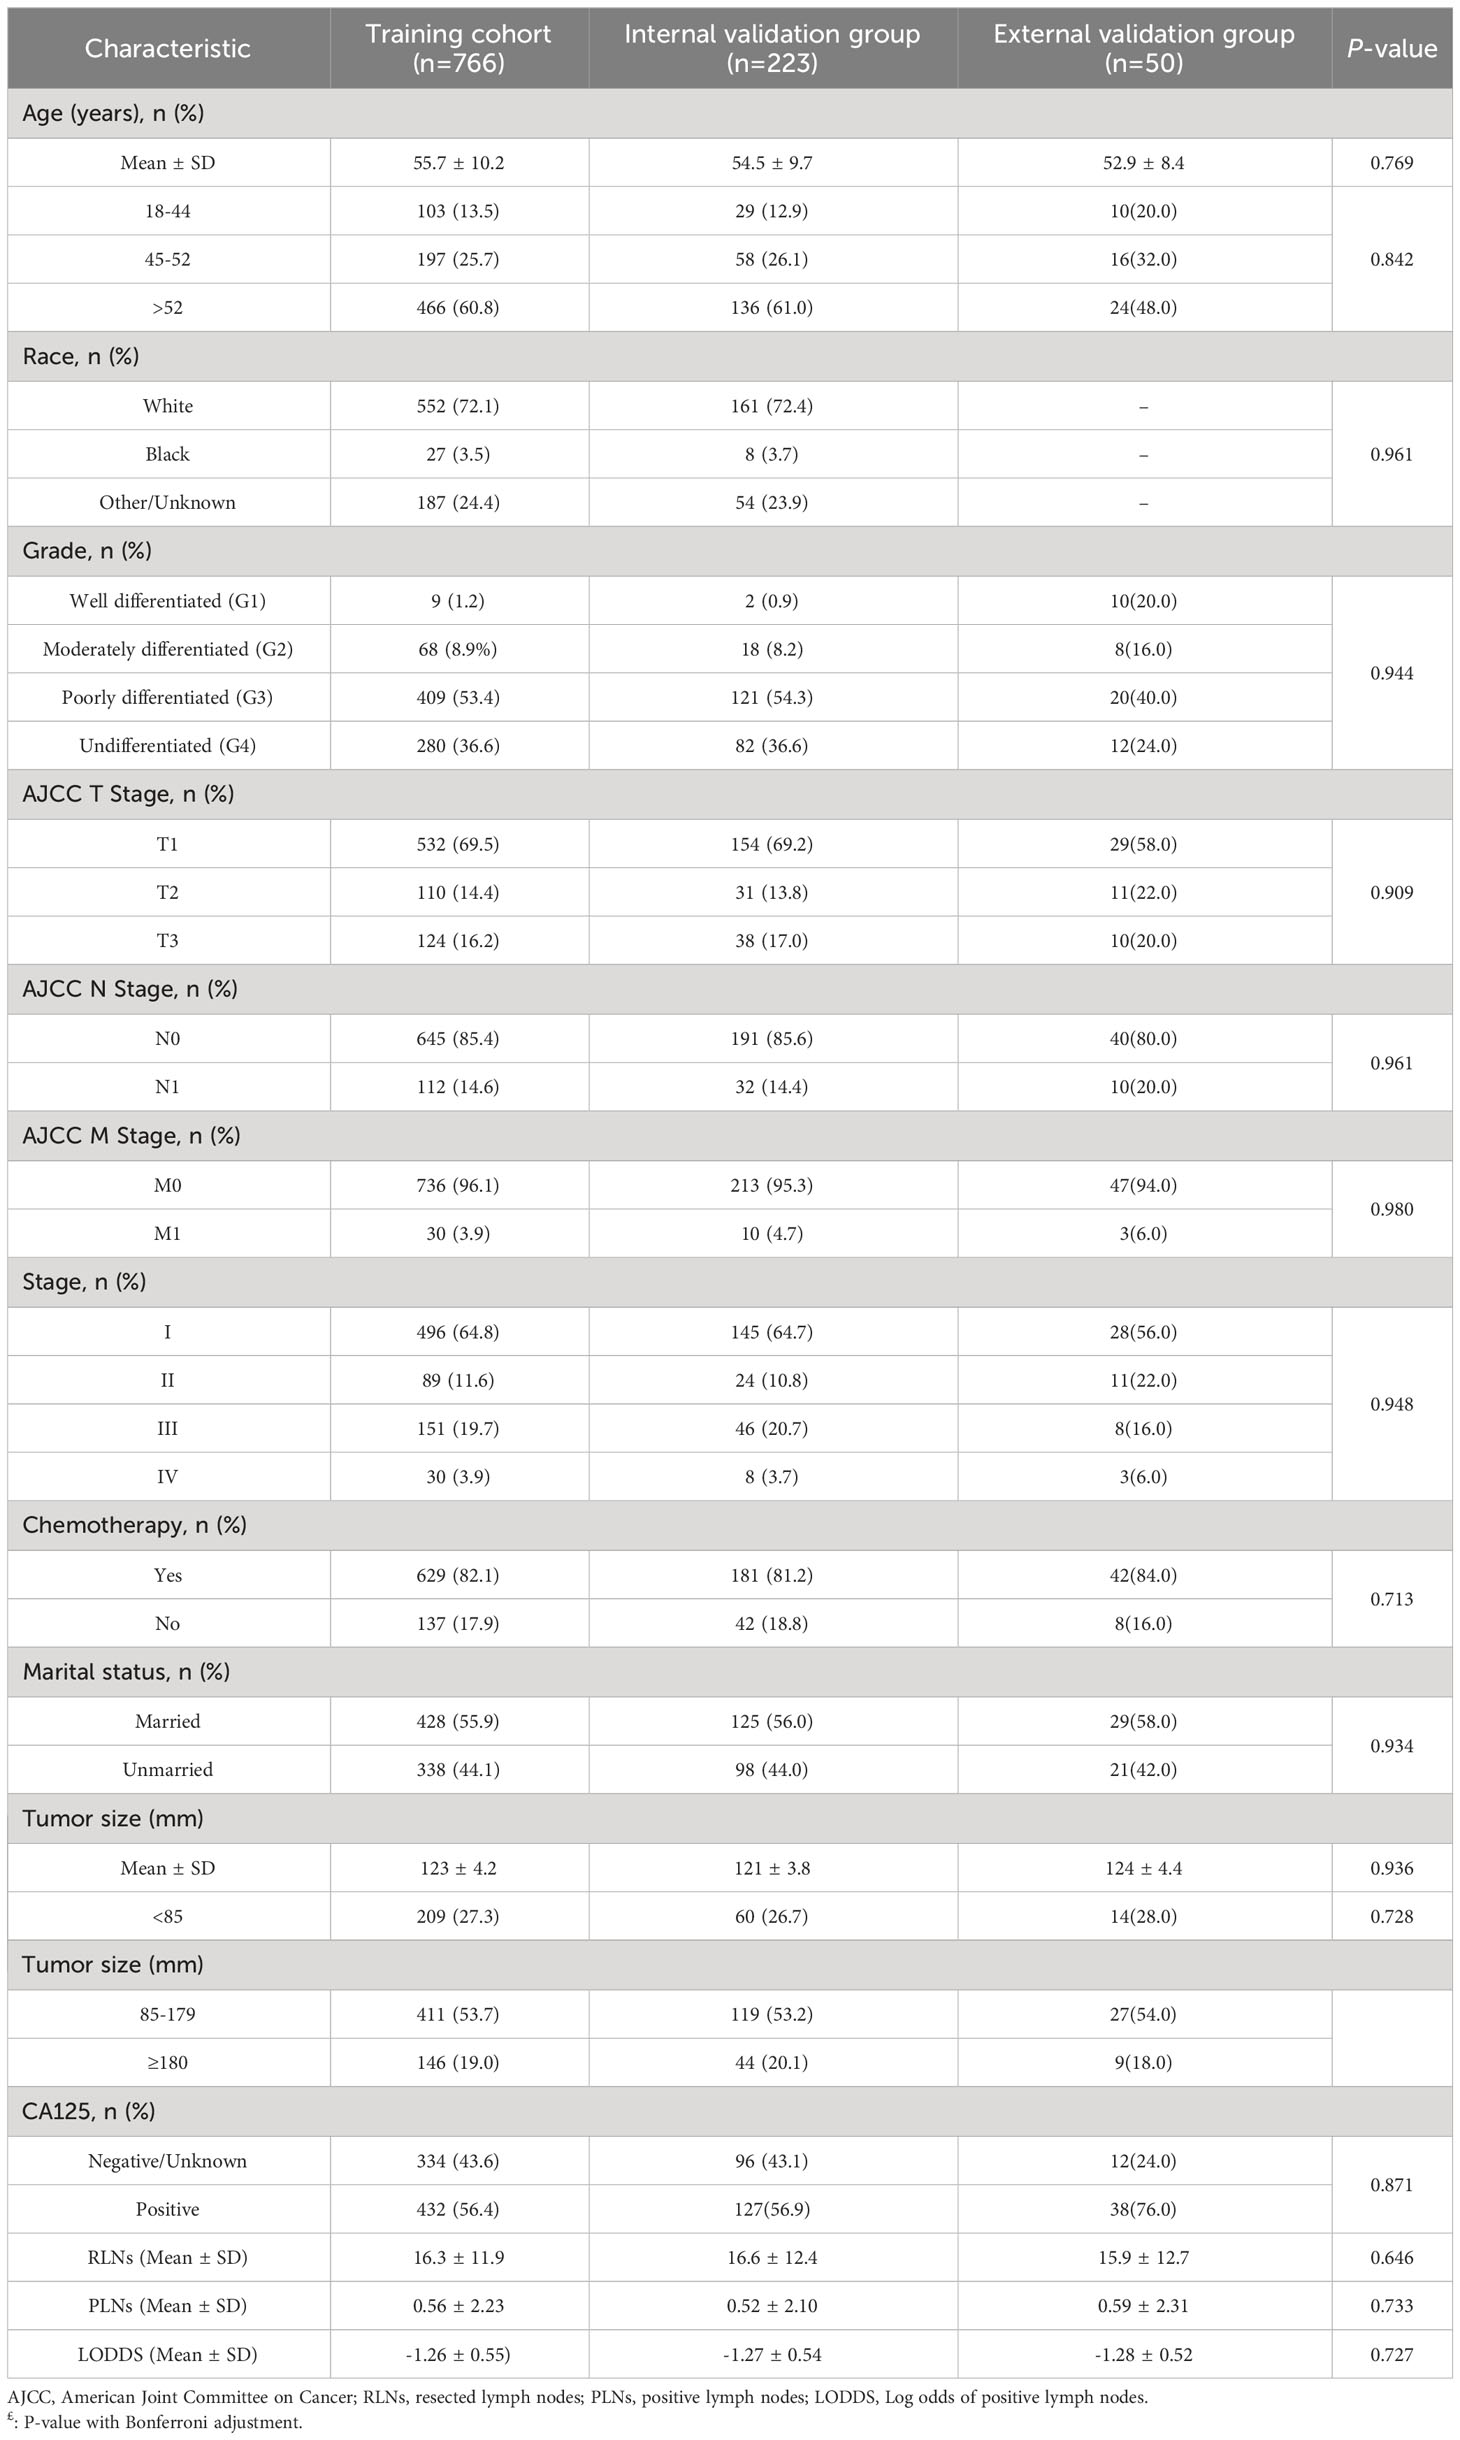
Table 1 Patients’ demographics and clinicopathological characteristics.
3.2 Survival analysis
In this study, the 14 variables included were analyzed by multivariate Cox analysis and stepwise Cox regression analysis. The results of multivariate Cox analysis indicated that Blacks (HR:2.27, 95% CI:1.03-5.00; P=0.042), AJCC stage III (HR:3.23, 95% CI:1.45-7.20; P=0.004), AJCC stage IV (HR:5.08, 95% CI:2.17-11.90; P<0.001), AJCC T3 stage (HR:2.20, 95% CI:1.12-4.30; P=0.022), distant metastasis (HR:1.69, 95% CI:1.12-2.17; P=0.014), and LODDS value (HR:1.61, 95% CI:1.00-2.60; P=0.048) were risk factors of OS. The OS was better for married OCCC patients (HR:0.79, 95% CI:0.57-0.91; P=0.043) (Supplementary Figure 1). By comparing the goodness-of-fit AICc statistics of model performance, the model with the lowest AICc value was the best-fitting model (22) (Figure 2A). As a result, AJCC T2 stage (HR:2.50, 95% CI:1.71-3.64; P<0.001), AJCC T3 stage (HR:5.17, 95% CI:3.69-7.25; P<0.001), distant metastasis (HR:1.77, 95% CI:1.12-2.81; P=0.015), marital status (HR:0.75, 95% CI:0.57-0.99; P=0.044), and LODDS (HR:1.57, 95% CI:1.26-1.95; P<0.001) were screened and identified as significant risk factors for OS in OCCC patients (Figure 2C).
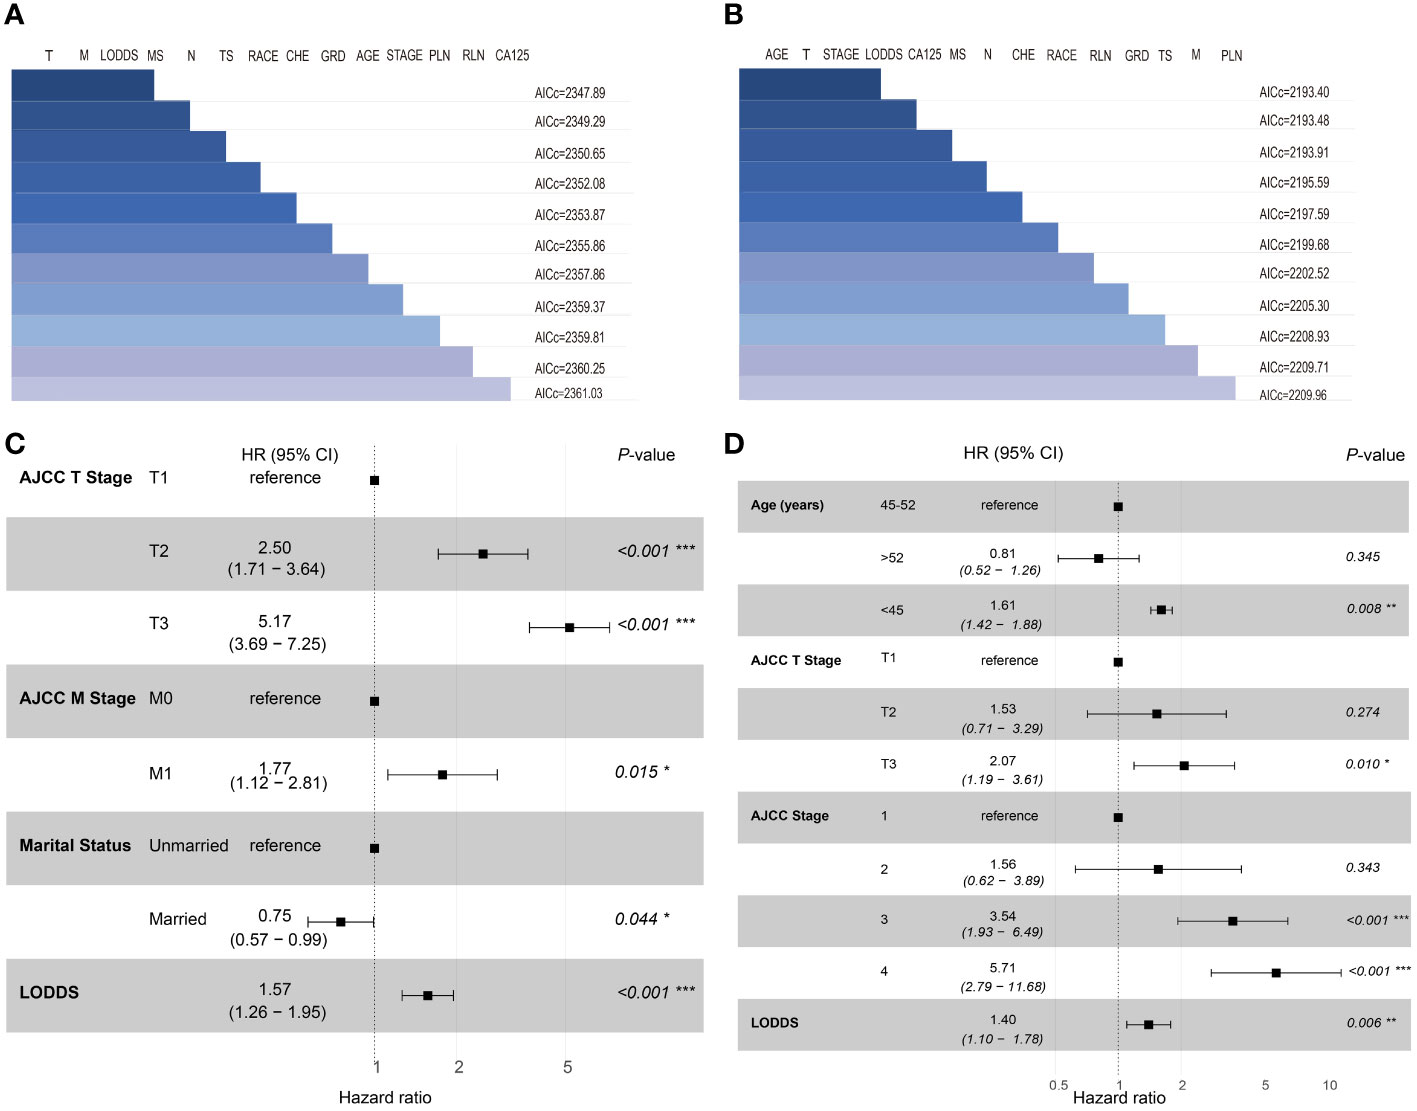
Figure 2 Set of models created with forward-stepwise selection for OS (A) and CSS (B), ranked by AICc. Shaded boxes signify the factors included within the model. Forest plots of independent risk factors in stepwise Cox regression analysis of OS (C) and CSS (D). T, 7th AJCC T Stage; M, 7th AJCC M Stage; MS, Marital status; N, 7th AJCC N Stage; TS, Tumor size; CHE, Chemotherapy; GRD, grade; PLN, positive lymph node; RLN, resected lymph node.
For CSS, age<45 years old (HR:1.64, 95% CI:1.43-1.94; P=0.021), AJCC stage 3 (HR:4.23, 95% CI:2.07-8.63; P<0.001), AJCC stage 4 (HR:6.23, 95% CI:2.80-13.83; P<0.001), distant metastasis (HR:1.91, 95% CI:1.47-2.71; P=0.039) and LODDS value (HR:1.68, 95% CI:1.12-2.51; P=0.012) were identified as risk factors. Interestingly, OCCC patients with evaluative CA125 indicated better CSS (HR:0.66, 95% CI:0.43-1.00; P=0.050) (Supplementary Figure 2). Similarly, a model with the lowest AICc value (Figure 2B) included four risk factors: age<45 years old (HR:1.61, 95% CI:1.42-1.88; P=0.008), AJCC T3 stage (HR:2.07, 95% CI:1.19-3.61; P=0.010), AJCC stage III (HR:3.54, 95% CI:1.93-6.49; P<0.001), AJCC stage IV (HR:5.71, 95% CI:2.79-11.68; P<0.001) and LODDS value (HR:1.40, 95% CI:1.10-1.78; P=0.006) was screened to predict CSS (Figure 2D). The Log-rank test was also used to explore differences in survival between subgroups based on risk factors and these results were visualized using Kaplan–Meier curves. According to the Kaplan-Meier survival curves in Figures 3A–D, there were significant differences in survival in AJCC T stage (P<0.001), organ metastasis (P<0.001), marital status (P=0.002), LODDS value (P<0.001) subgroups. In terms of competing risks, CIF curves were implemented to the risk factors according to CIF values for cancer-specific death (Supplementary Figures 3A–D).
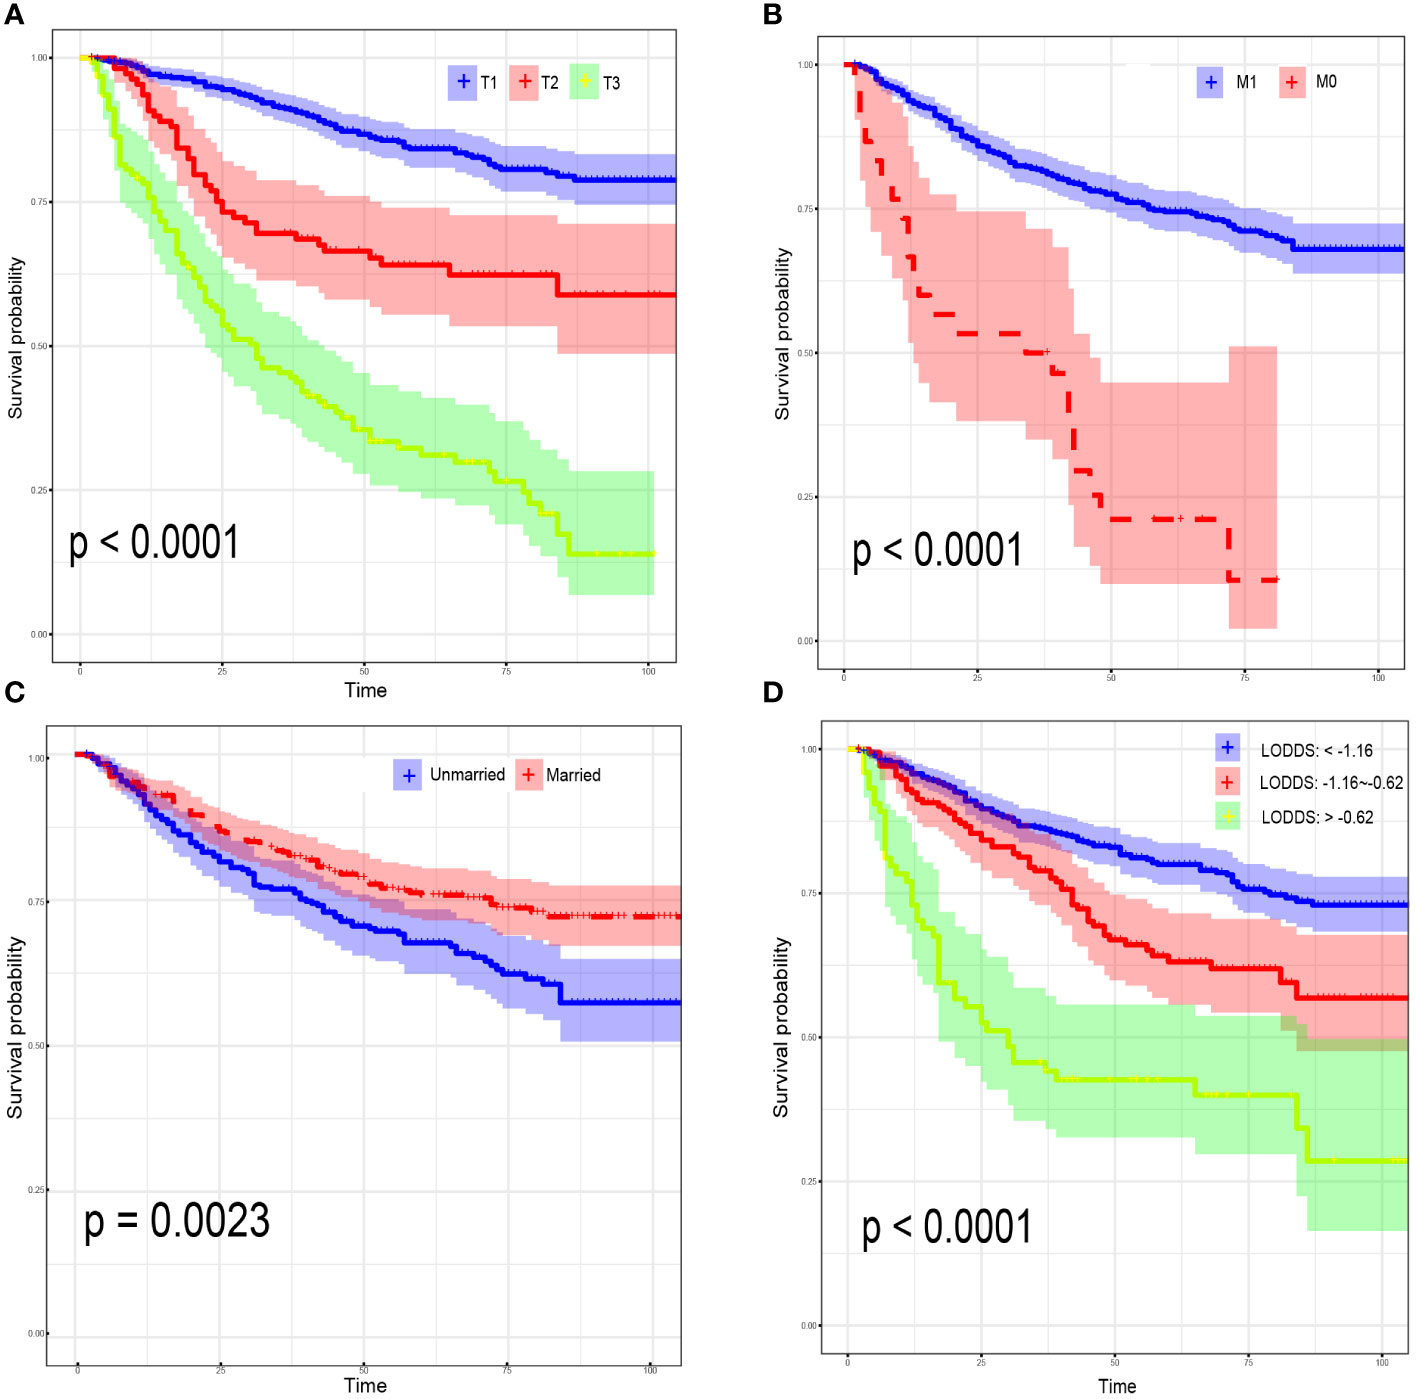
Figure 3 Kaplan–Meier curves for overall survival, stratified by 7th AJCC T Stage (A); 7th AJCC M Stage (B); marital status (C); LODDS (D).
3.3 Construction and validation of the prognostic nomograms
Nomograms were constructed by incorporating the prognostic factors to predict 1-, 3- and 5-year OS (Figure 4A) and CSS (Figure 4B) for OCCC patients. The C-statistic ranges from 0.5, which indicates the absence of discrimination, to 1.0, indicating perfect discrimination. Generally speaking, if the C-statistic value is greater than 0.7, the model has very good predictive value (23, 24). The C-statistic values of our nomogram model for OS and CSS prediction were 0.756 (95% CI: 0.728-0.764) and 0.746 (95%CI: 0.744-0.748), which denoted the good performance of the nomogram models. The actual survival rates of OCCC showed a good agreement with the optimal bootstrap predicted values, indicating good prognostic reliability (Supplementary Figures 4–7). The AUC values also indicated the nomogram had favorable sensitivity and specificity in predicting OS (Figures 5A, B) and CSS (Figures 5C, D) in OCCC patients. Additionally, the DCA curve indicated that the nomogram models had better prediction performance than the multivariate Cox regression model (Supplementary Figures 8, 9). Similar results were observed in the internal validation cohort. Finally, the real-world data was utilized for external validation. The 1, 3, 5-year AUC area was 0.691, 0.724 and 0.749 for OS, and the 1, 3, 5-year AUC area was 0.558, 0.667 and 0.716 for CSS, respectively (Figures 6A, B), suggesting that the prognostic model in this study could effectively predict OS and CSS in patients with OCCC.
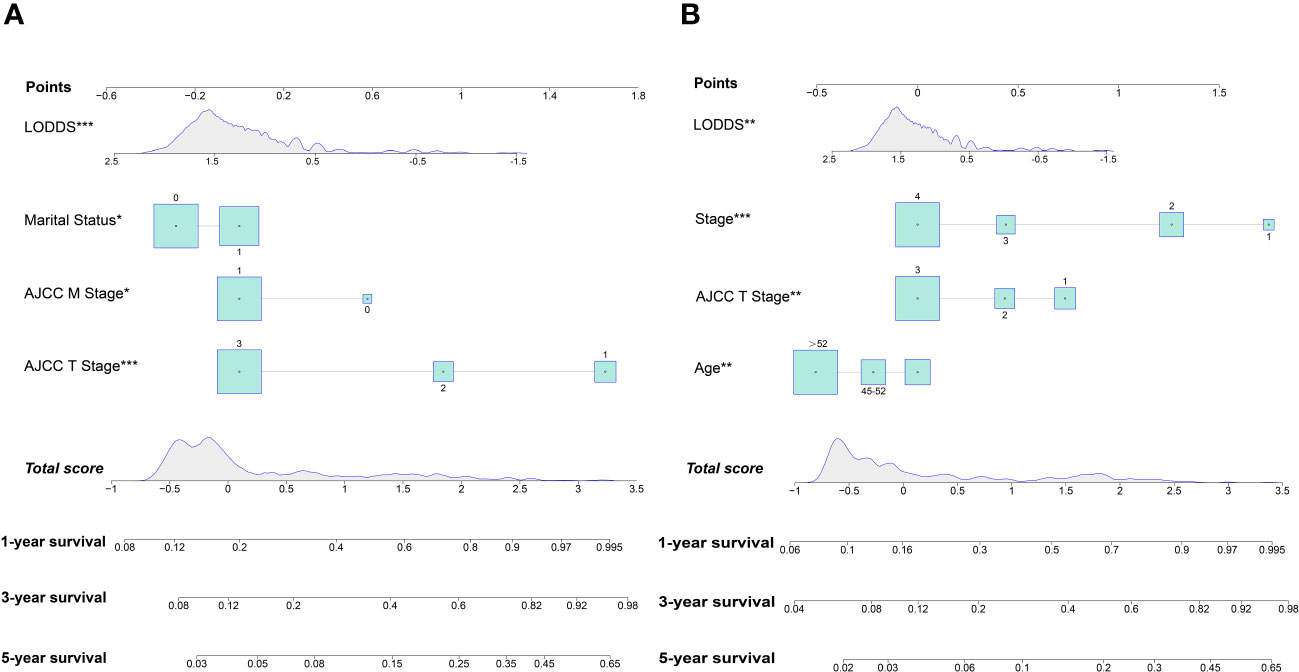
Figure 4 Nomogram for predicting 1-, 3- and 5-year OS (A); Nomogram for predicting 1-, 3- and 5-year CSS (B).
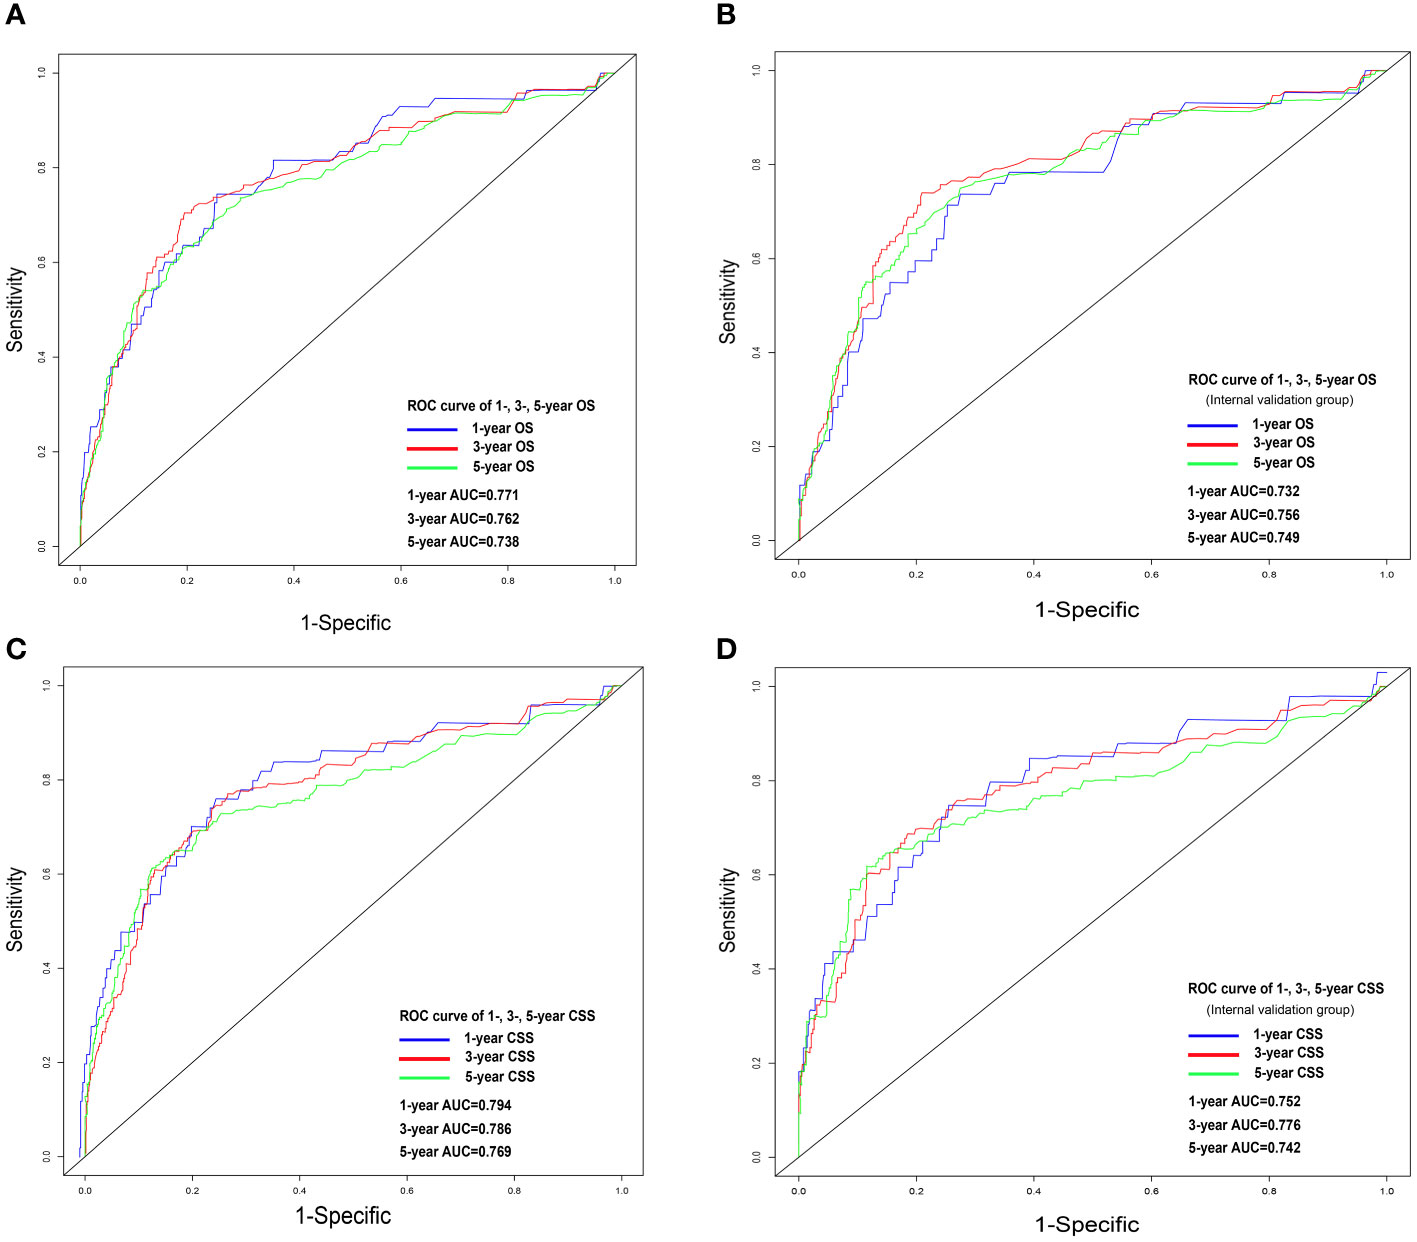
Figure 5 ROC analysis for OS and CSS. OS nomogram ROC curve for training cohort (A) and internal validation cohort (B); CSS nomogram ROC curve for training cohort (C) and internal validation cohort (D). OS, overall survival; CSS, cancer-specific survival; ROC, receiver operating characteristics.
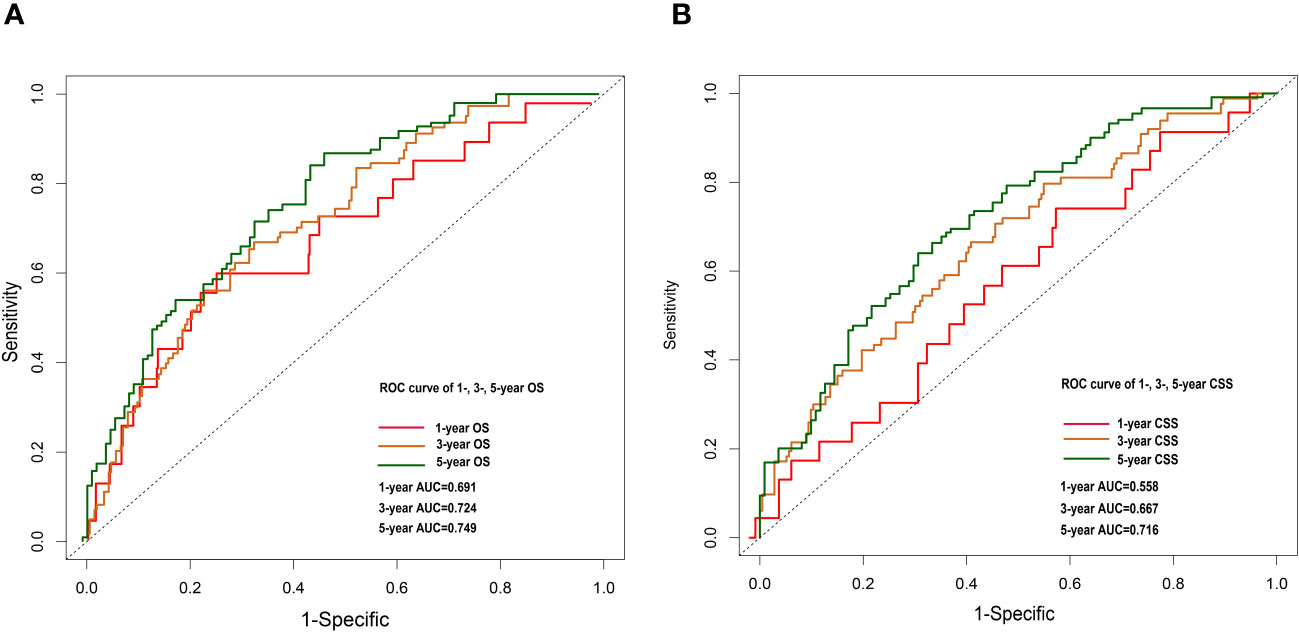
Figure 6 1-, 3- and 5-year OS nomogram ROC curve for external validation cohort (A). 1-, 3-and 5-year CSS nomogram ROC curve for external validation cohort (B).
4 Discussion
In the current study, according to stepwise Cox regression analyses, we screened out risk factors separately related to OS and CSS of OCCC patients. By comparing AICc scores, nomograms were constructed to assess the 1-, 3- and 5-year CSS and OS based on the identified prognostic factors (25). AUC, calibration curves and DCA curves in both training and validation sets showed favorable discrimination and calibration, indicating that our nomograms had good calibration power. Each risk factor included in the nomograms was attributed a risk score and was applied to successfully build a risk stratification system for predicting the OS and CSS of OCCC patients. Generally, younger age implied a better prognosis in EOC patients due to stronger immune response and better physical fitness (26, 27). However, our result indicated that OCCC patients younger than 45 years tended to have poorer prognosis. This result was in line with those of previous studies (28), which indicated the effect of age in OCCC may be different from other EOC. Moreover, we found a significant difference in the prognosis of OCCC patients in different marital statuses. Specifically, the prognosis of unmarried OCCC patients was worse compared to those who were married, which is the same as the finding of Kravdal et al (29). In this regard we generate the following analysis. Firstly, the companionship needs of married patients are met, and previous studies have shown that patients tend to be more emotionally positive when emotional needs are met. Therefore, MS may influence the prognosis of OCCC patients through emotions (30, 31). Secondly, Nayeri and colleagues found that married individuals tend to be diagnosed with cancer at an early stage (32).
The AJCC N-staging, a two-category system (N0: no regional lymph node metastasis; N1: histologically confirmed retroperitoneal lymph node metastasis), is the most basic and widely used cancer staging system and plays a vital role as a key prognostic factor in the development of postoperative treatment plans as well as in follow-up (33–35). However, this LN staging system does not account for the prognostic impact of PLNs and the number of RLNs. In fact, Nie et al. found that an increase in the number of PLNs is associated with lower DFS as well as OS (36). There is increasing evidence that the extent of LN dissection is also associated with the prognosis of patients with EOC (37). Therefore, the current LN staging appears inadequate in providing physicians with sufficient valuable information. Both LNR (the ratio of PLNs/RLNs) and LODDS take into account the number of PLNs and RLNs and both are more accurate than the pN staging system in predicting prognosis in several tumors (38, 39), but it is controversial which one is more superior (40, 41). There are many drawbacks of LNR led us to choose LODDS as the LN staging tool for this study. First, when the value of LNR is 0, its applicability is limited (e.g., 1/1 vs. 30/30). As the number of RLNs increases, the risk of post-op complications such as infection, vascular/nerve injuries, lymphatic leakage and lymphoedema increases, thus affecting patient prognosis (42). Then, the prognosis of patients may be significantly different despite having the same LNR (e.g., 1/2 vs. 15/30). Third, as mentioned, the majority of OCCC patients were still in stage I at the time of diagnosis (6). The probability of LN metastasis in early OCCC is relatively low, with only 3.6% in pT1aM0 and pT2aM0, compared with 71.6% in HGSOC (43). Compared with LNR, LODDS also has a unique value in the prognostic assessment of LN-negative patients (44). The value of LODDS increases with the decrease of RLNs. Additionally, there is an active debate about systematic lymphadenectomy in early-staging OCCC (45, 46). However, considering the calculation method of LODDS mentioned above, the clinician only needs to obtain the number of RLNs and the number of PLNs respectively to achieve the accurate value of LODDS. Therefore, LODDS acquisition does not depend on systematic lymphadenectomy. This will greatly reduce the difficulty of the surgery and the postoperative complication rate.
Several studies have found that the applications of nomogram models in several tumors have a better prognostic performance than the staging systems alone (47–49). With these nomograms, doctors can calculate the risk score for each patient, allowing for individualized prognostic assessment and guides postoperative personalized treatment. The AUC of the training and validation cohorts of the nomogram developed in our study was over 0.7, with the calibration points were separated on both sides of the ideal line. This means that we can obtain a more reasonable and more accurate follow-up schedule. Based on the results of the DCA curves, we believe that our model has higher discriminatory power than the traditional multivariate Cox regression.
It should be noted that there are several limitations in this study. First, while the SEER database certainly has a larger volume of data compared to prior case-series reports, it lacks records of some key variables related to prognoses, such as specific chemotherapy protocols, preoperative comorbidities, or postoperative complications. It is worthy to note that in this study we used part of the training set as the internal validation set, which does run the risk of producing an overly optimistic assessment of the efficacy of the predictive model. Although data from the real world supported our results, we will seek to re-evaluate the efficacy of our model in the future using completely independent data sets of larger sample sizes. Then, selection bias was inevitable due to the study’s retrospective nature. Fourth, statistical analyses were performed without correction for multiple testing, which may lead to potential false positives in the survival analysis.
Data availability statement
The original contributions presented in the study are included in the article/Supplementary Material. Further inquiries can be directed to the corresponding author.
Author contributions
ZL: Writing – original draft, Software, Methodology, Formal analysis, Conceptualization. CJ: Writing – review & editing, Validation, Methodology. YH: Writing – original draft, Methodology, Investigation. HY: Writing – original draft, Software, Visualization, Validation. ZC: Writing – review & editing, Visualization, Data curation. FK: Writing – review & editing, Supervision.
Funding
The author(s) declare that no financial support was received for the research, authorship, and/or publication of this article.
Acknowledgments
We kindly thank all the staff of National Cancer Institute for their efforts toward the SEER program.
Conflict of interest
The authors declare that the research was conducted in the absence of any commercial or financial relationships that could be construed as a potential conflict of interest.
Publisher’s note
All claims expressed in this article are solely those of the authors and do not necessarily represent those of their affiliated organizations, or those of the publisher, the editors and the reviewers. Any product that may be evaluated in this article, or claim that may be made by its manufacturer, is not guaranteed or endorsed by the publisher.
Supplementary material
The Supplementary Material for this article can be found online at: https://www.frontiersin.org/articles/10.3389/fonc.2024.1370272/full#supplementary-material
References
1. Romero I, Bast RC Jr. Minireview: human ovarian cancer: biology, current management, and paths to personalizing therapy. Endocrinology. (2012) 153:1593–602. doi: 10.1210/en.2011-2123
2. Machida H, Matsuo K, Yamagami W, Ebina Y, Kobayashi Y, Tabata T, et al. Trends and characteristics of epithelial ovarian cancer in Japan between 2002 and 2015: A JSGO-JSOG joint study. Gynecol Oncol. (2019) 153:589–96. doi: 10.1016/j.ygyno.2019.03.243
3. Gates MA, Rosner BA, Hecht JL, Tworoger SS. Risk factors for epithelial ovarian cancer by histologic subtype. Am J Epidemiol. (2010) 171:45–53. doi: 10.1093/aje/kwp314
4. Wiegand KC, Shah SP, Al-Agha OM, Zhao Y, Tse K, Zeng T, et al. ARID1A mutations in endometriosis-associated ovarian carcinomas. N Engl J Med. (2010) 363:1532–43. doi: 10.1056/NEJMoa1008433
5. Okamoto A, Glasspool RM, Mabuchi S, Matsumura N, Nomura H, Itamochi H, et al. Gynecologic Cancer InterGroup (GCIG) consensus review for clear cell carcinoma of the ovary. Int J Gynecol Cancer. (2014) 24:S20–5. doi: 10.1097/igc.0000000000000289
6. Chan JK, Teoh D, Hu JM, Shin JY, Osann K, Kapp DS. Do clear cell ovarian carcinomas have poorer prognosis compared to other epithelial cell types? A study of 1411 clear cell ovarian cancers. Gynecol Oncol. (2008) 109:370–6. doi: 10.1016/j.ygyno.2008.02.006
7. Katagiri A, Nakayama K, Rahman MT, Rahman M, Katagiri H, Nakayama N, et al. Loss of ARID1A expression is related to shorter progression-free survival and chemoresistance in ovarian clear cell carcinoma. Mod Pathol. (2012) 25:282–8. doi: 10.1038/modpathol.2011.161
8. Wang S, Wang Z, Li J, Qin J, Song J, Li Y, et al. Splicing factor USP39 promotes ovarian cancer Malignancy through maintaining efficient splicing of oncogenic HMGA2. Cell Death Dis. (2021) 12:294. doi: 10.1038/s41419-021-03581-3
9. Prat J. Staging classification for cancer of the ovary, fallopian tube, and peritoneum: abridged republication of guidelines from the international federation of gynecology and obstetrics (FIGO). Obstet Gynecol. (2015) 126:171–4. doi: 10.1097/aog.0000000000000917
10. Ye G, Chen Z, Wang L, Hu Z, Bian Y, Yang X, et al. Log odds of positive lymph nodes predicts survival in patients treated with neoadjuvant therapy followed by esophagectomy. J Surg Oncol. (2020) 121:1074–83. doi: 10.1002/jso.25888
11. Han L, Mo S, Xiang W, Li Q, Wang R, Xu Y, et al. Comparison of four lymph node staging systems for predicting prognosis for stage IV rectum cancer. Ann Transl Med. (2020) 8:111. doi: 10.21037/atm.2019.12.90
12. Posada D. jModelTest: phylogenetic model averaging. Mol Biol Evol. (2008) 25:1253–6. doi: 10.1093/molbev/msn083
13. Sheiner LB, Beal SL. Some suggestions for measuring predictive performance. J Pharmacokinet Biopharm. (1981) 9:503–12. doi: 10.1007/bf01060893
14. Hurvich CM, Tsai CL. Model selection for extended quasi-likelihood models in small samples. Biometrics. (1995) 51:1077–84. doi: 10.2307/2533006
15. Selbmann L, de Hoog GS, Zucconi L, Isola D, Ruisi S, van den Ende AH, et al. Drought meets acid: three new genera in a dothidealean clade of extremotolerant fungi. Stud Mycol. (2008) 61:1–20. doi: 10.3114/sim.2008.61.01
16. Balachandran VP, Gonen M, Smith JJ, DeMatteo RP. Nomograms in oncology: more than meets the eye. Lancet Oncol. (2015) 16:e173–80. doi: 10.1016/s1470-2045(14)71116-7
17. Camp RL, Dolled-Filhart M, Rimm DL. X-tile: a new bio-informatics tool for biomarker assessment and outcome-based cut-point optimization. Clin Cancer Res. (2004) 10:7252–9. doi: 10.1158/1078-0432.Ccr-04-0713
18. Park JN, Papworth E, Kassegne S, Moukam L, Billong SC, Macauley I, et al. HIV prevalence and factors associated with HIV infection among men who have sex with men in Cameroon. J Int AIDS Soc. (2013) 16 Suppl 3:18752. doi: 10.7448/ias.16.4.1875218752
19. Ford CB, Shah RR, Maeda MK, Gagneux S, Murray MB, Cohen T, et al. Mycobacterium tuberculosis mutation rate estimates from different lineages predict substantial differences in the emergence of drug-resistant tuberculosis. Nat Genet. (2013) 45:784–90. doi: 10.1038/ng.2656
20. Halabi S, Lin CY, Kelly WK, Fizazi KS, Moul JW, Kaplan EB, et al. Updated prognostic model for predicting overall survival in first-line chemotherapy for patients with metastatic castration-resistant prostate cancer. J Clin Oncol. (2014) 32:671–7. doi: 10.1200/jco.2013.52.3696
21. Vickers AJ, Cronin AM, Elkin EB, Gonen M. Extensions to decision curve analysis, a novel method for evaluating diagnostic tests, prediction models and molecular markers. BMC Med Inform Decis Mak. (2008) 8:53. doi: 10.1186/1472-6947-8-53
22. Weisent J, Rohrbach B, Dunn JR, Odoi A. Socioeconomic determinants of geographic disparities in campylobacteriosis risk: a comparison of global and local modeling approaches. Int J Health Geogr. (2012) 11:45. doi: 10.1186/1476-072x-11-45
23. Wang Q, Tang Y, Zhou J, Qin W. A prospective study of acute kidney injury in the intensive care unit: development and validation of a risk prediction model. J Transl Med. (2019) 17:359. doi: 10.1186/s12967-019-2118-6
24. Wang R, Xie G, Shang L, Qi C, Yang L, Huang L, et al. Development and validation of nomograms for epithelial ovarian cancer: a SEER population-based, real-world study. Future Oncol. (2021) 17:893–906. doi: 10.2217/fon-2020-0531
25. Condamine FL, Silvestro D, Koppelhus EB, Antonelli A. The rise of angiosperms pushed conifers to decline during global cooling. Proc Natl Acad Sci U.S.A. (2020) 117:28867–75. doi: 10.1073/pnas.2005571117
26. Pawelec G. Does patient age influence anti-cancer immunity? Semin Immunopathol. (2019) 41:125–31. doi: 10.1007/s00281-018-0697-6
27. Zeng X, Zhang X, Chen M, Liu J, Wu C. The influence of perceived organizational support on police job burnout: A moderated mediation model. Front Psychol. (2020) 11:948. doi: 10.3389/fpsyg.2020.00948
28. Chen Q, Wang S, Lang JH. Development and validation of Nomograms for predicting overall survival and Cancer-specific survival in patients with ovarian clear cell carcinoma. J Ovarian Res. (2020) 13:123. doi: 10.1186/s13048-020-00727-3
29. Kravdal H, Syse A. Changes over time in the effect of marital status on cancer survival. BMC Public Health. (2011) 11:804. doi: 10.1186/1471-2458-11-804
30. Lippman SA, Leddy AM, Neilands TB, Ahern J, MacPhail C, Wagner RG, et al. Village community mobilization is associated with reduced HIV incidence in young South African women participating in the HPTN 068 study cohort. J Int AIDS Soc. (2018) 21 Suppl 7:e25182. doi: 10.1002/jia2.25182
31. Lan T, Chen M, Zeng X, Liu T. The influence of job and individual resources on work engagement among chinese police officers: A moderated mediation model. Front Psychol. (2020) 11:497. doi: 10.3389/fpsyg.2020.00497
32. Nayeri K, Pitaro G, Feldman JG. Marital status and stage at diagnosis in cancer. N Y State J Med. (1992) 92:8–11.
33. Hogen L, Vicus D, Ferguson SE, Gien LT, Nofech-Mozes S, Lennox GK, et al. Patterns of recurrence and impact on survival in patients with clear cell ovarian carcinoma. Int J Gynecol Cancer. (2019) 29:1164–9. doi: 10.1136/ijgc-2019-000287
34. Prader S, Harter P, Grimm C, Traut A, Waltering KU, Alesina PF, et al. Surgical management of cardiophrenic lymph nodes in patients with advanced ovarian cancer. Gynecol Oncol. (2016) 141:271–5. doi: 10.1016/j.ygyno.2016.03.012
35. Tang LL, Chen YP, Mao YP, Wang ZX, Guo R, Chen L, et al. Validation of the 8th edition of the UICC/AJCC staging system for nasopharyngeal carcinoma from endemic areas in the intensity-modulated radiotherapy era. J Natl Compr Canc Netw. (2017) 15:913–9. doi: 10.6004/jnccn.2017.0121
36. Nie D, Mao X, Li Z. Prognostic value of lymph nodes ratio in patients with stage III ovarian clear cell carcinoma: A retrospective study of patients in Southwest China. J Cancer. (2019) 10:4689–94. doi: 10.7150/jca.29896
37. Mahdi H, Moslemi-Kebria M, Levinson KL, Gojayev A, Lockhart D, Ali-Fehmi R, et al. Prevalence and prognostic impact of lymphadenectomy and lymph node metastasis in clinically early-stage ovarian clear cell carcinoma. Int J Gynecol Cancer. (2013) 23:1226–30. doi: 10.1097/IGC.0b013e3182856736
38. Gao B, Zhou D, Qian X, Jiang Y, Liu Z, Zhang W, et al. Number of positive lymph nodes is superior to LNR and LODDS for predicting the prognosis of pancreatic neuroendocrine neoplasms. Front Endocrinol (Lausanne). (2021) 12:613755. doi: 10.3389/fendo.2021.613755
39. Chen LJ, Chung KP, Chang YJ, Chang YJ. Ratio and log odds of positive lymph nodes in breast cancer patients with mastectomy. Surg Oncol. (2015) 24:239–47. doi: 10.1016/j.suronc.2015.05.001
40. Li T, Yang Y, Wu W, Fu Z, Cheng F, Qiu J, et al. Prognostic implications of ENE and LODDS in relation to lymph node-positive colorectal cancer location. Transl Oncol. (2021) 14:101190. doi: 10.1016/j.tranon.2021.101190
41. Chen YR, Wang MQ, Li YT, Li P, Ouyang SS, Xu HW, et al. Prognostic performance of different lymph node classification systems in young gastric cancer. J Gastrointest Oncol. (2021) 12:1285–300. doi: 10.21037/jgo-21-185
42. Harter P, Sehouli J, Lorusso D, Reuss A, Vergote I, Marth C, et al. A randomized trial of lymphadenectomy in patients with advanced ovarian neoplasms. N Engl J Med. (2019) 380:822–32. doi: 10.1056/NEJMoa1808424
43. Heitz F, Harter P, Ataseven B, Heikaus S, Schneider S, Prader S, et al. Stage- and histologic subtype-dependent frequency of lymph node metastases in patients with epithelial ovarian cancer undergoing systematic pelvic and paraaortic lymphadenectomy. Ann Surg Oncol. (2018) 25:2053–9. doi: 10.1245/s10434-018-6412-y
44. Morales-Oyarvide V, Rubinson DA, Dunne RF, Kozak MM, Bui JL, Yuan C, et al. Lymph node metastases in resected pancreatic ductal adenocarcinoma: predictors of disease recurrence and survival. Br J Cancer. (2017) 117:1874–82. doi: 10.1038/bjc.2017.349
45. Kajiyama H, Suzuki S, Yoshikawa N, Tamauchi S, Shibata K, Kikkawa F. The impact of systematic retroperitoneal lymphadenectomy on long-term oncologic outcome of women with advanced ovarian clear-cell carcinoma. J Gynecol Oncol. (2020) 31:e47. doi: 10.3802/jgo.2020.31.e47
46. Magazzino F, Katsaros D, Ottaiano A, Gadducci A, Pisano C, Sorio R, et al. Surgical and medical treatment of clear cell ovarian cancer: results from the multicenter Italian Trials in Ovarian Cancer (MITO) 9 retrospective study. Int J Gynecol Cancer. (2011) 21:1063–70. doi: 10.1097/IGC.0b013e318218f270
47. Wang Y, Li J, Xia Y, Gong R, Wang K, Yan Z, et al. Prognostic nomogram for intrahepatic cholangiocarcinoma after partial hepatectomy. J Clin Oncol. (2013) 31:1188–95. doi: 10.1200/jco.2012.41.5984
48. Wang S, Yang L, Ci B, Maclean M, Gerber DE, Xiao G, et al. Development and validation of a nomogram prognostic model for SCLC patients. J Thorac Oncol. (2018) 13:1338–48. doi: 10.1016/j.jtho.2018.05.037
Keywords: LODDS, ovarian clear cell carcinoma, nomogram, overall survival, cancerspecific survival
Citation: Liu Z, Jing C, Hooblal YM, Yang H, Chen Z and Kong F (2024) Construction and validation of log odds of positive lymph nodes (LODDS)-based nomograms for predicting overall survival and cancer-specific survival in ovarian clear cell carcinoma patients. Front. Oncol. 14:1370272. doi: 10.3389/fonc.2024.1370272
Received: 14 January 2024; Accepted: 11 March 2024;
Published: 21 March 2024.
Edited by:
Robb Hollis, University of Edinburgh, United KingdomReviewed by:
Angelo Finelli, ULSS2 Marca Trevigiana, ItalyJessica Lim, Guy’s and St Thomas’ NHS Foundation Trust, United Kingdom
Copyright © 2024 Liu, Jing, Hooblal, Yang, Chen and Kong. This is an open-access article distributed under the terms of the Creative Commons Attribution License (CC BY). The use, distribution or reproduction in other forums is permitted, provided the original author(s) and the copyright owner(s) are credited and that the original publication in this journal is cited, in accordance with accepted academic practice. No use, distribution or reproduction is permitted which does not comply with these terms.
*Correspondence: Fandou Kong, tg980927@126.com
†These authors have contributed equally to this work