 Daniel Uysal1
 Blerta Thaqi1Alexander Fierek1David Jurgowski1Zoran V. Popovic2Fabian Siegel3Maurice Stephan Michel1Philipp Nuhn4Thomas Stefan Worst1
 Philipp Erben1Katja Nitschke1*
- 1Urologic Research Center, Department of Urology and Urosurgery, Medical Faculty Mannheim, University of Heidelberg, Mannheim, Germany
- 2Institute of Pathology, Medical Faculty Mannheim, University of Heidelberg, Mannheim, Germany
- 3Department of Biomedical Informatics at the Center for Preventive Medicine and Digital Health, Medical Faculty of Mannheim, University of Heidelberg, Mannheim, Germany
- 4Department of Urology, Universitätsklinikum Schleswig-Holstein (UKSH), Kiel, Germany
Introduction: Muscle invasive bladder cancer (MIBC) remains a prevalent cancer with limited therapeutic options, obviating the need for innovative therapies. The epidermal growth factor receptor (EGFR) is a linchpin in tumor progression and presents a potential therapeutic target in MIBC. Additionally, the EGFR ligands AREG and EREG have shown associations with response to anti-EGFR therapy and improved progression-free survival in colorectal carcinoma.
Materials and methods: We investigated the prognostic significance of EGFR, AREG, and EREG in MIBC. Gene expression and copy number analyses were performed via qRT-PCR on tissue samples from 100 patients with MIBC who underwent radical cystectomy at the University Hospital Mannheim (MA; median age 72, interquartile range [IQR] 64–78 years, 25% female). Results were validated in 361 patients from the 2017 TCGA MIBC cohort (median age 69, IQR 60–77 years, 27% female), in the Chungbuk and MDACC cohort. Gene expressions were correlated with clinicopathologic parameters using the Mann-Whitney test, Kruskal-Wallis- test and Spearman correlation. For overall survival (OS), cancer-specific survival (CSS) and disease-free survival (DFS) gene expression was analyzed with Kaplan-Meier and Cox-proportional hazard models.
Results: Significant gene expression differences in EGFR, AREG, and EREG could be detected in all cohorts. In the TCGA cohort, EGFR expression was significantly elevated in patients with EGFR amplification and KRAS wildtype. High AREG expression independently predicted longer OS (HR = 0.35, CI 0.19 - 0.63, p = 0.0004) and CSS (HR = 0.42, CI 0.18 – 0.95, p = 0.0378) in the MA cohort. In the TCGA cohort, high EGFR, AREG, and EREG expression correlated with shorter OS (AREG: HR = 1.57, CI 1.12 – 2.20, p = 0.0090) and DFS (EGFR: HR = 1.91, CI 1.31 – 2.8, p = 0.0008). EGFR amplification was also associated with reduced DFS.
Discussion: High EGFR and EREG indicate worse survival in patients with MIBC. The prognostic role of AREG should further be investigated in large, prospective series. Divergent survival outcomes between the four cohorts should be interpreted cautiously, considering differences in analysis methods and demographics. Further in vitro investigations are necessary to elucidate the functional mechanisms underlying the associations observed in this study.
1 Introduction
In 2023, bladder cancer (BC) was expected to account for an estimated 82,290 new cases and 16,710 cancer-related deaths in the United States, making it the 4th most common and the 8th most deadly malignancy in men in the US (1). In Europe, BC is the 5th most common cancer with an incidence of more than 200,000 new cases per year (2). While 70% of BC are localized to the mucosa and submucosal tissues and thus classified as non-muscle invasive bladder cancer (NMIBC), 30% invade into the musculature (muscle invasive bladder cancer, MIBC). While the 5-year overall survival (OS) rate for NMIBC is 81%, this drops to 48% when the disease progresses to MIBC (3). Approximately 50% of patients with MIBC develop metastases and have a 5-year survival rate of about 5% (4). Radical cystectomy (RC) with pelvic lymphadenectomy, urinary diversion and in selected cases neoadjuvant chemotherapy, remains the treatment of choice for localized MIBC. In the past decade, treatment in the metastasized setting has evolved from platinum-based chemotherapy regimens to immune checkpoint inhibitors to now include antibody-drug conjugates such as Enfortumab-Vedotin and pan-FGFR inhibitors like Erdafitinib. While these new therapies have the potential to revolutionize the treatment of metastatic MIBC, not all patients will respond and ultimately resistances will arise. Thus, new additional biomarkers and molecular targets in MIBC are still urgently needed. The tyrosine kinase receptor epidermal growth factor receptor (EGFR) has been proposed as a potential target in BC, due to its routine therapeutic inhibition in metastatic colorectal carcinoma (mCRC) and non-small cell lung cancer (NSCLC) (5, 6). Immunohistochemistry (IHC) studies in BC showed a comparatively low EGFR expression in normal urothelium and up to 74% protein overexpression in BC, further highlighting the potential role of EGFR as a target in MIBC (7). So far, clinical trials targeting EGFR in BC could not convincingly show a benefit for EGFR-directed therapy, except for a small group of patients (8, 9). Preclinical studies by Rebouissou et al. support the hypothesis, that a subset of patients with BC will likely respond to EGFR-directed therapy (10). Based on these observations, Goodspeed et al. developed a gene signature from EGFR-inhibited mCRC data, that could predict the response of BC cell lines to EGFR inhibition (11). This signature included, Amphiregulin (AREG) and Epiregulin (EREG), two of the seven potential EGFR ligands, whose predictive role for EGFR inhibition and progression-free survival (PFS) has further been confirmed in mCRC (12–15). Based on these promising preclinical and clinical data, we investigated clinicopathologic and survival associations of EGFR, AREG and EREG gene expression and copy number alterations on OS, disease-free survival (DFS) and cancer-specific survival (CSS) in a cohort of patients with MIBC after RC from Mannheim, and on OS and DFS in a second cohort of patients with MIBC from the The Cancer Genome Atlas (TCGA) project (16). Furthermore, OS and CSS were further analyzed in patients with MIBC from the Chungbuk National University Hospital (17) and the MD Anderson Cancer Center (MDACC) MIBC cohort (18).
2 Materials and methods
2.1 Patients and methods
Four independent cohorts were included in this study. The first cohort consisted of patients with MIBC who underwent RC at the Department of Urology and Urosurgery at the University Medical Center Mannheim (MA) between 2008 and 2014. Patients with either no histologic evidence of residual malignancy after RC, NMIBC, non-urothelial histologic subtype, distant metastases at the time of RC or missing detection of the reference gene Calmodulin 2 (Calm2) were excluded from further analysis. Figure 1 shows the different stages of analysis with respective exclusion criteria of the MA cohort. Formalin-fixed paraffin-embedded (FFPE) tissue specimens and clinical data were collected in a retrospective study design which had been approved by the local ethics committee before the study (2015–549N-MA). All participants provided written informed consent. All procedures in this study were carried out in accordance with the 1964 declaration of Helsinki and its later amendments or comparable ethical standards. The other three cohort included patients with MIBC from the TCGA cell 2017 study by Robertson et al. (16), from the Chungbuk National University Hospital study by Kim et al. (17) and from an MDACC cohort by Choi et al. (18).
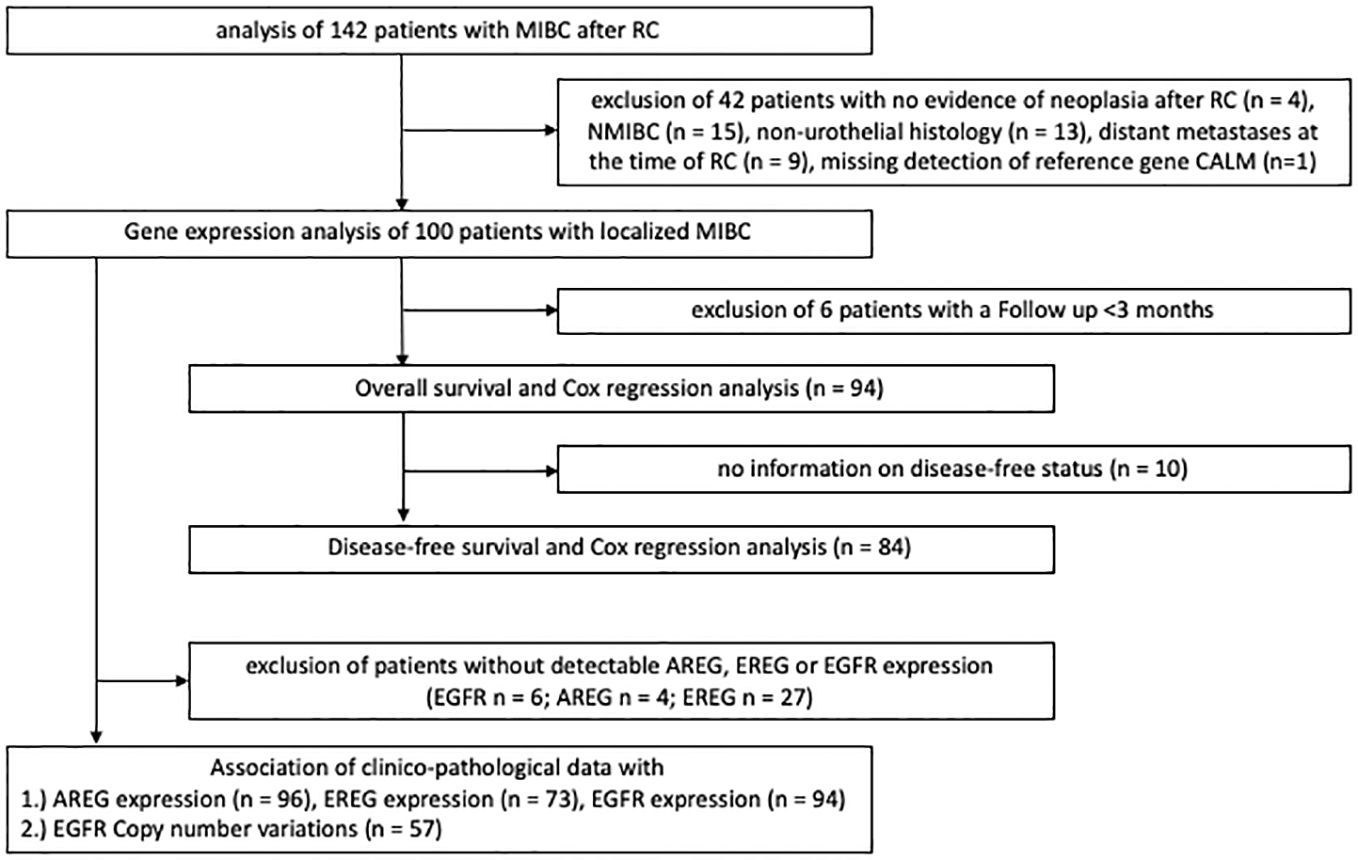
Figure 1 REMARK flow diagram of the exclusion criteria of the Mannheim cohort.
2.2 RNA extraction, cDNA synthesis and quantitative PCR analyses of the gene expressions and copy number alterations in patient samples from the MA cohort
All pathology specimens from the MA cohort were evaluated by the Institute of Pathology of the Medical Faculty Mannheim, University of Heidelberg. Tumor bearing FFPE tissue samples were stained with hematoxylin and eosin, examined by a board-certified uro-pathologist (ZVP) and graded according to the TNM classification (2017) and the WHO 2010/2016 classification of genitourinary tumors. RNA extraction was performed with the magnetic-based XTRAKT FFPE kit (Stratifyer, Cologne, Germany) according to the manufacturer’s instructions. For the quantitative real-time polymerase chain reaction (qRT-PCR), RNA was reversely transcribed into cDNA with Sequence-specific reverse primers (reference gene Calm2 and target genes EGFR, AREG and EREG), Superscript III reverse transcriptase (Thermo Fisher Scientific, Waltham, MA, USA) and supporting reagents were incubated at 55°C for 120 min with a subsequent enzyme deactivation step at 70°C for 15 min. cDNA was amplified through 40 cycles at 95°C for 3s and 60°C for 30s on a StepOnePlus qRT-PCR cycler (Applied Biosystems, Waltham, MA, USA). Calm2 was used as a reference gene for normalization and gene expression determined using the 40-(ΔCt)-method (19). Supplementary Table S1 shows the primers and probes used in this study. Copy number alterations (CNA) in the MA cohort were measured using qPCR with TaqMan Assays according to the manufacturers’ instructions (Supplementary Table S2). Predicted CNA values ≥3 were classified as amplification events.
2.3 In silico validation of findings
Findings were validated in patients with MIBC from the TCGA, the Chungbuk and the MDACC cohort (16–18). Figure 2 shows patient exclusion criteria at different stages of the analysis of the TCGA cohort. All TCGA data were downloaded from public repositories and have been produced in earlier analyses. CNA and gene expression data were downloaded from the Xenabrowser (https://xenabrowser.net) (20). Clinical data were downloaded from cBioPortal (https://www.cbioportal.org) (21, 22). Briefly, CNA data were generated using Affymetrix SNP6.0 arrays and mRNA gene expression data obtained through RNA Sequencing on an Illumina HiSeq. Data underwent further bioinformatic processing. CNA data were curated with the GISTIC2.0 algorithm and gene expression data quantified and normalized using RNA-Seq by Expectation Maximization (RSEM) and expressed as log2. CNA data ranged from -2 to 2, with the following nomenclature applied: -2: 2 copy del; -1: 1 copy del; 0: no change, 1: amplification, 2: high amplification. For the purposes of this study a GISTIC2.0 value of 2, or high amplification defined EGFR amplification. All other gene-level events (-2 to 1) were defined as non-amplification. Supplementary Figure S1 shows patient exclusion criteria for the Chungbuk and the MDACC cohorts. Similar exclusion criteria were applied as in the MA and TCGA cohort. Clinical and genomic data for the two cohorts were obtained from the Gene Expression Omnibus database (Chungbuk: GSE13507; MDACC: GSE48276) and were included as Supplementary Material. Gene expression in the Chungbuk cohort was measured using Illumina Human-6 BeadChip microarrays on RC specimens (17). Gene expression in the MDACC cohort was measured using FFPE TUR-B tissue samples on an Illumina HumanHT-12 WG-DASL V4.0 R2 expression beadchip (18).
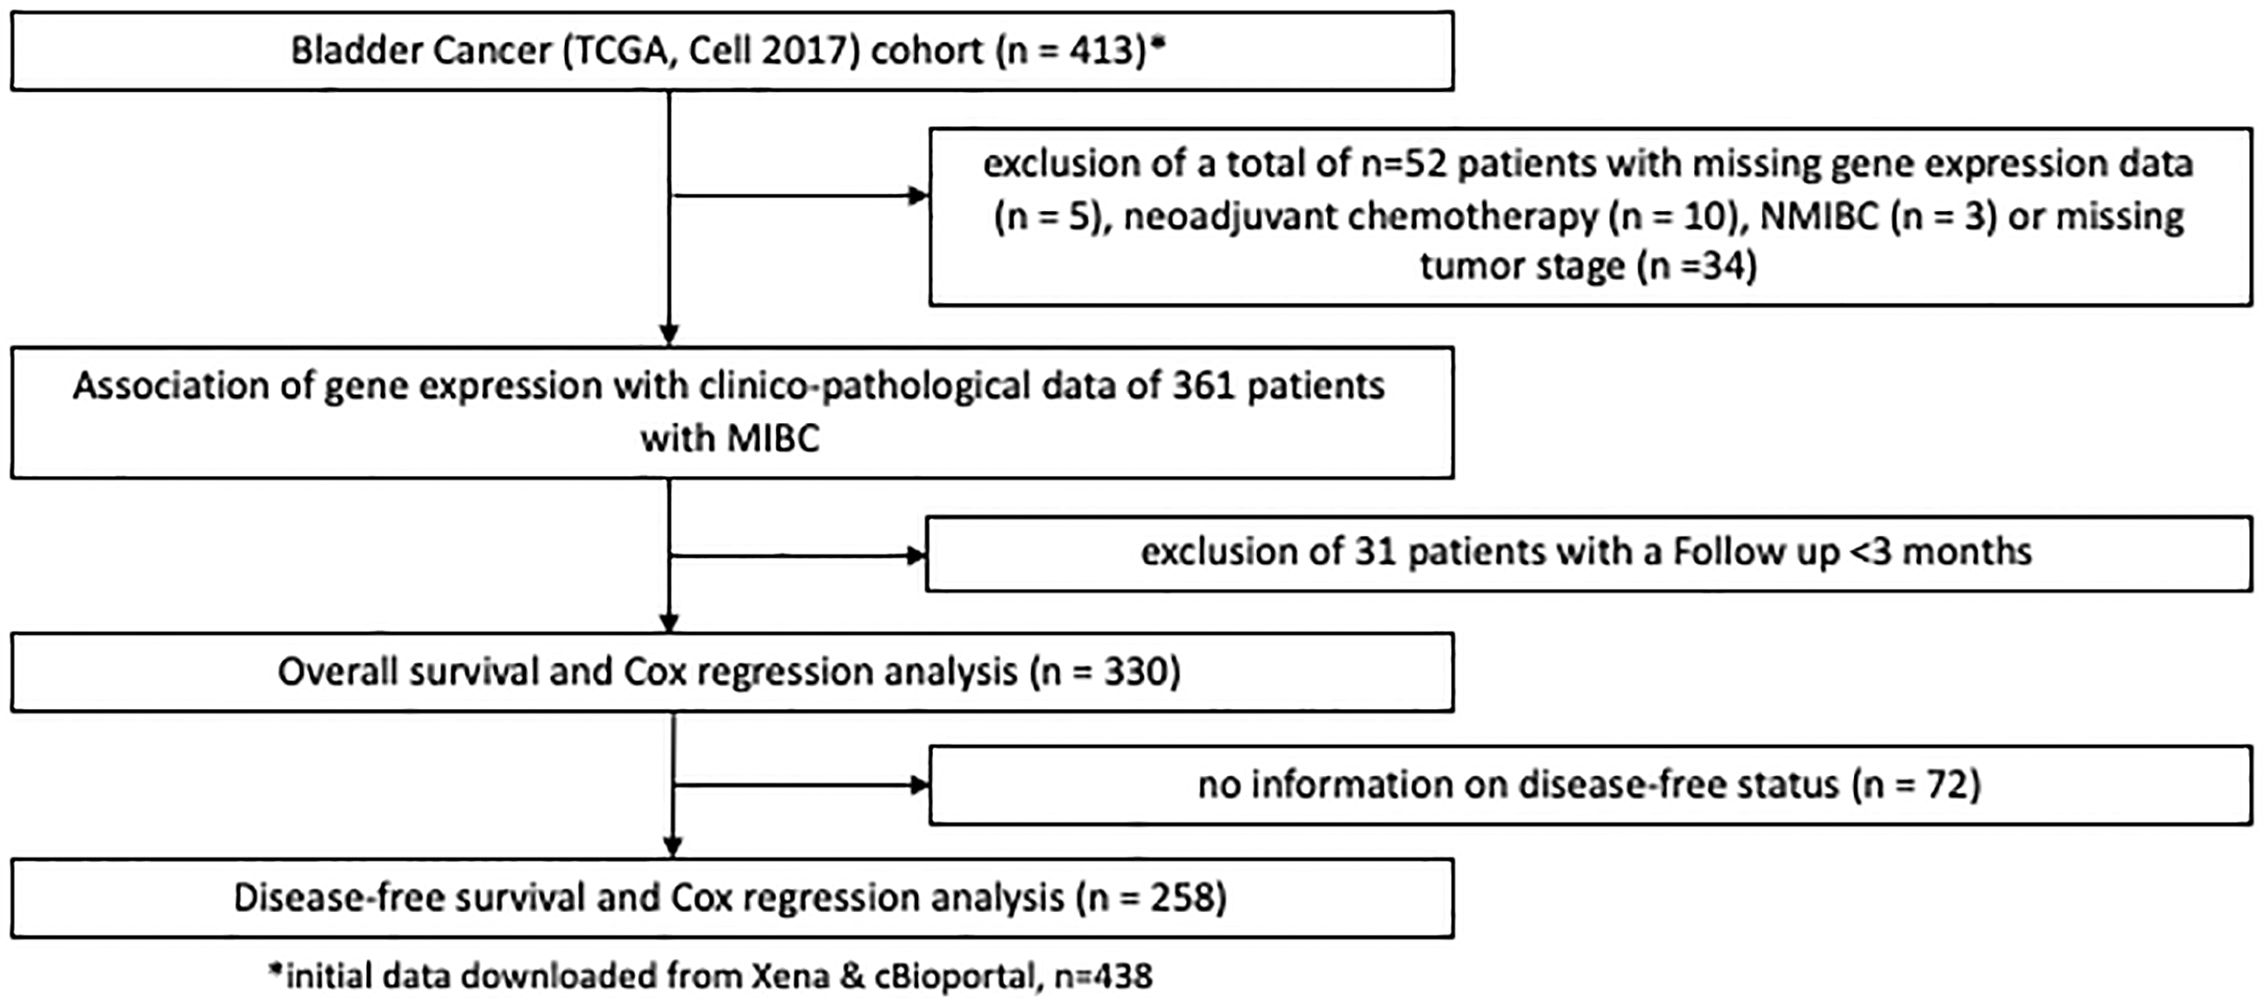
Figure 2 REMARK flow diagram of the exclusion criteria of the second study cohort based on the TCGA cell 2017 MIBC cohort.
2.4 Statistical analyses
Statistical analyses were performed using JMP16 (SAS, Cary, North Carolina, USA) and GraphPad Prism 9.0 (GraphPad Software Inc., La Jolla, California, USA). All p values were calculated for two sided tests with p ≤ 0.05 regarded as statistically significant. Statistical analyses of numeric continuous variables following a non-normal distribution were performed with non-parametric tests (Mann-Whitney-Test, Kruskal-Wallis test). Spearman coefficient analysis was performed to assess gene correlations. Survival analyses were performed using the Kaplan-Meier method and differences between subgroups were tested for significance with the log-rank test. Cut-off values for high and low gene expression groups were provided by using the partition test, with each group representing at least 20% of the total cohort. Uni- und multivariable analyses were performed using Cox-proportional hazard regression models, accepting a cut-off value of p < 0.2 to include relevant clinical or pathologic variables into the multivariable analyses, that would have been missed with a more restrictive p value of ≤ 0.05.
3 Results
3.1 Patient demographics
After exclusion of 42 patients (from initially 142 patients) 100 patients with histologically confirmed urothelial MIBC (median age: 72, range: 64 – 78, 25% female patients, 72% locally advanced carcinomas (T3/4)) remained for the subsequent analyses in the MA cohort. In the TCGA MIBC cohort 361 patients could be evaluated after exclusion criteria were applied (median age: 69, range:60 – 77, 27% female patients, 68% T3/4 tumors). Furthermore, 55 patients with MIBC from the Chungbuk cohort (median age 66, IQR 60–73 years, 20% female) and 38 patients from the MDACC MIBC cohort (median age 68, IQR 60–72 years, 16% female) were analyzed after exclusion criteria (Supplementary Figure S1).
Demographic and clinicopathologic data of these cohorts are shown in Table 1. Baseline characteristics between the four cohorts were comparable except for a slightly higher percentage of patients with lymph node metastases (N+) in the TCGA cohort. At a median follow-up (f/u) of 39.5 months (range 3 – 180 months, n = 94) 60 patients in the MA cohort died during the f/u period. Of those 60 patients, 31 (52%) died of MIBC. Median f/u among surviving patients was 120 (72.5 – 142) months. In the TCGA cohort median f/u for surviving patients was 24.8 (14.8 – 53.4) months. Median f/u in the original Chungbuk cohort was 37 (1–137) months (17) and in the MDACC cohort median f/u was 45.2 (4 – 180) months.
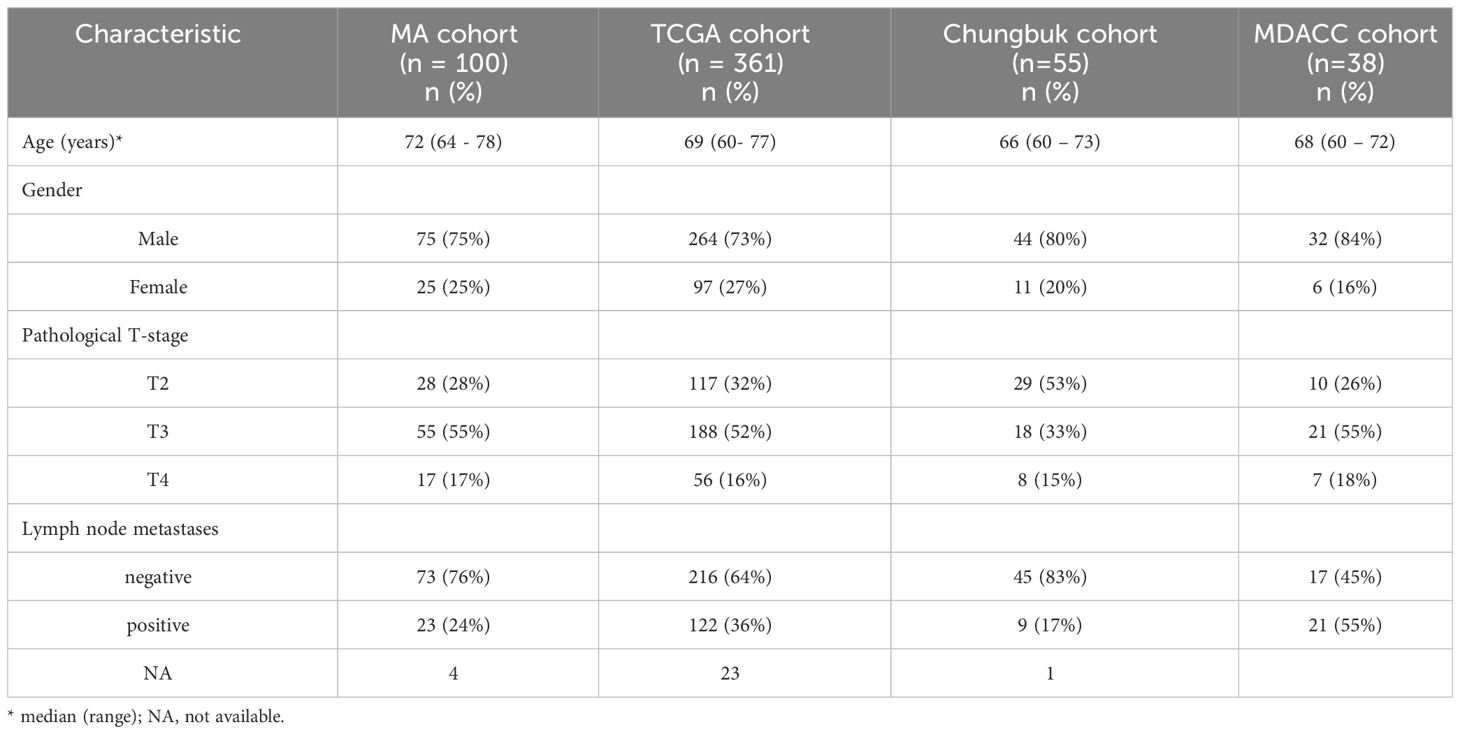
Table 1 Demographics of patients in the Mannheim (MA), the TCGA, the Chungbuk, and the MDACC cohort.
3.2 Gene expression analysis
Overall, EGFR showed the highest gene expression across all four cohorts (MA: EGFR median CT value 37.54 (range 36.94 - 38.25), median CT value AREG 29.45 (range 27.99 – 30.39), median CT value EREG 29.80 (range 28.25 – 31.56); TCGA: EGFR 9.26 (range 7.94 – 10.45), AREG 7.04 (range 5.37 – 9.17), EREG 4.98 (range 2.78 – 8.09); Chungbuk: EGFR median value 8.18 (range 7.88 – 8.180), AREG median 7.01 (range 6.95 – 7.06), EREG median value 7.28 (range 7.15 – 7.39); MDACC: EGFR median value 12.99 (range 12.47 – 13.47), AREG median value 5.32 (range 5.17 – 5.42), EREG median value 7.97 (range 7.14 – 9.09), Figure 3). Comparing the median gene expression between EGFR, AREG and EREG revealed significant differences between the three genes across all cohorts (p < 0.0001 for all cohorts, Figure 3). AREG and EREG were inversely related between the two cohorts, with a higher AREG expression in the TCGA cohort, while AREG showed a lower expression compared to EREG in the other three cohorts. Although high amplification (AMP), compared to low or no amplifications (NOT) of EGFR in the TCGA cohort, resulted in a higher gene expression in all three genes, only EGFR reached a statistically significant difference (EGFR: AMP 13.38 (range 12.08 – 14.66) vs. NOT 9.11 (range 7.89 – 10.21); p < 0.0001, Supplementary Figure S2A). Among the 57 patients from the MA cohort with available CNA information on EGFR only marginal, non-significant differences in gene expression between the two groups could be observed (AMP vs. Not, Supplementary Figure S2B). Assessing the correlation between the three genes revealed a moderately positive correlation between AREG and EREG in the MA cohort (Spearman ρ = 0.4960, p < 0.0001) and a highly positive correlation in the TCGA cohort (Spearman ρ = 0.7333, p < 0.0001). EGFR and both of its ligands were weakly correlated across both cohorts (Supplementary Figure S3). In the other cohorts, AREG and EREG were only weakly correlated (Chungbuk: Spearman ρ = 0.0091, p = 0.9472; MDACC: Spearman ρ = 0.0594, p = 0.7231). In the MDACC cohort, EGFR and EREG showed a weak positive correlation (Spearman ρ = 0.3457, p = 0.0335) (Supplementary Table S3).
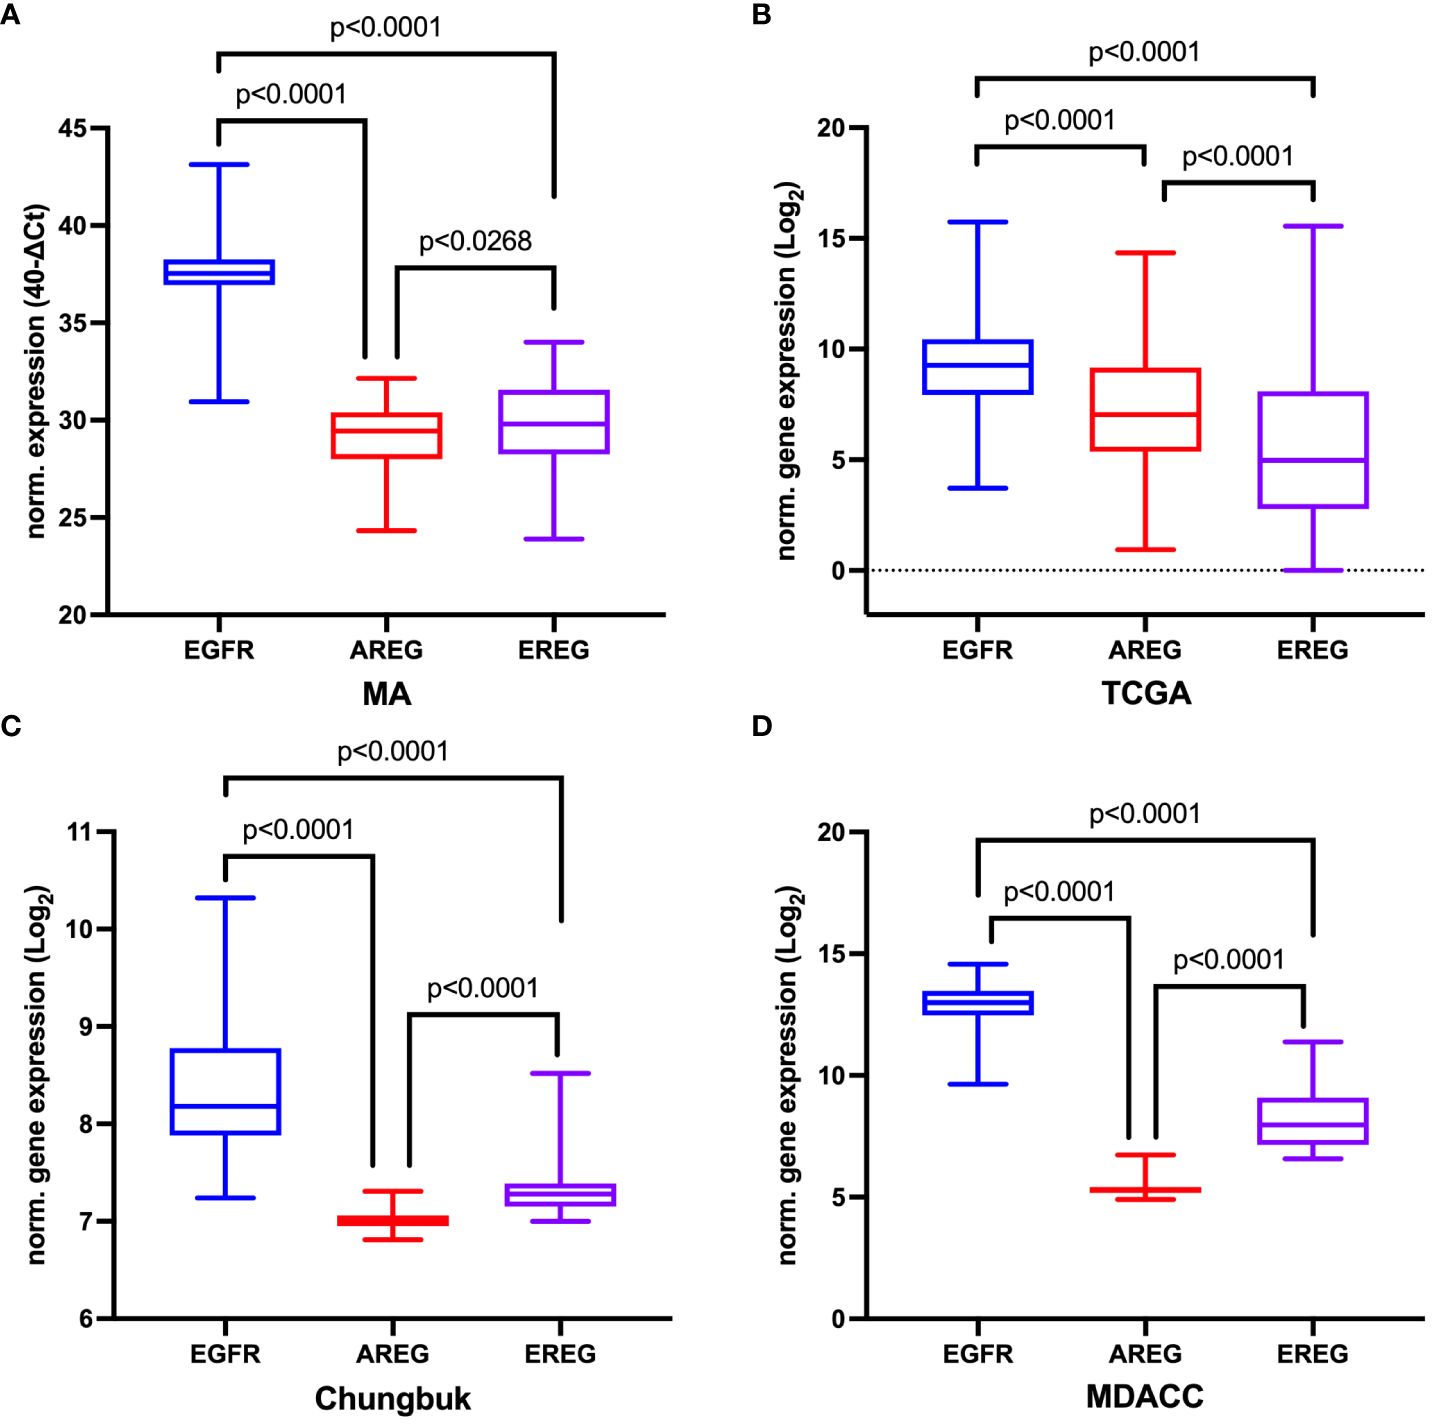
Figure 3 Comparison of normalized gene expression of EGFR, AREG and EREG (A) in the Mannheim cohort, (B) in the TCGA cell 2017 MIBC cohort, (C) in the Chungbuk cohort, and (D) in the MDACC cohort. The p value from the Kruskal-Wallis test between all three genes was p<0.0001. For comparisons between two genes the Mann-Whitney-Test was used.
3.3 Association with clinicopathologic data
In the TCGA cohort, T3/4 was correlated with a statistically significant increase in EGFR and EREG expression (EGFR p = 0.0176, EREG p = 0.0136, Figure 4A). However, this association could not be confirmed in the other three cohorts. Patients from the MA cohort with the presence of lymphovascular invasion (LVI) had a significantly lower AREG expression compared to patients without LVI (AREG 6.87 (range 5.37 – 8.69) vs. 7.78 (range 4.57 – 9.76); p = 0.0221, Figure 4B). Exploratory analysis of patients with a basal molecular subtype revealed a significantly higher gene expression for EGFR and both its ligands in patients with the basal molecular subtype (p < 0.0001 for each gene, Figure 4C). An exploratory analysis of the gene expression according to KRAS mutation status in the TCGA cohort showed a statistically significant higher expression of EGFR in patients with KRAS wildtype (vs. KRAS mutation; EGFR 9.35 (range 8.13 – 10.48) vs. 7.66 (range 6.59 – 8.53), p = 0.0002, Figure 4D). Further associations of the gene expressions with the investigated clinicopathologic characteristics are reported in Supplementary Tables S4, S5. In the Chungbuk cohort, N+ was associated with a significantly higher median EGFR expression (EGFR 8.37 (range 8.17 – 9.04) vs. 8.02 (range 7.24 – 10.32), p = 0.0485). In the MDACC cohort, female patients had a significantly higher EGFR expression (p = 0.0039) and patients with a basal molecular subtype had a significantly higher EGFR (p = 0.0053) and EREG expression (p = 0.0061).
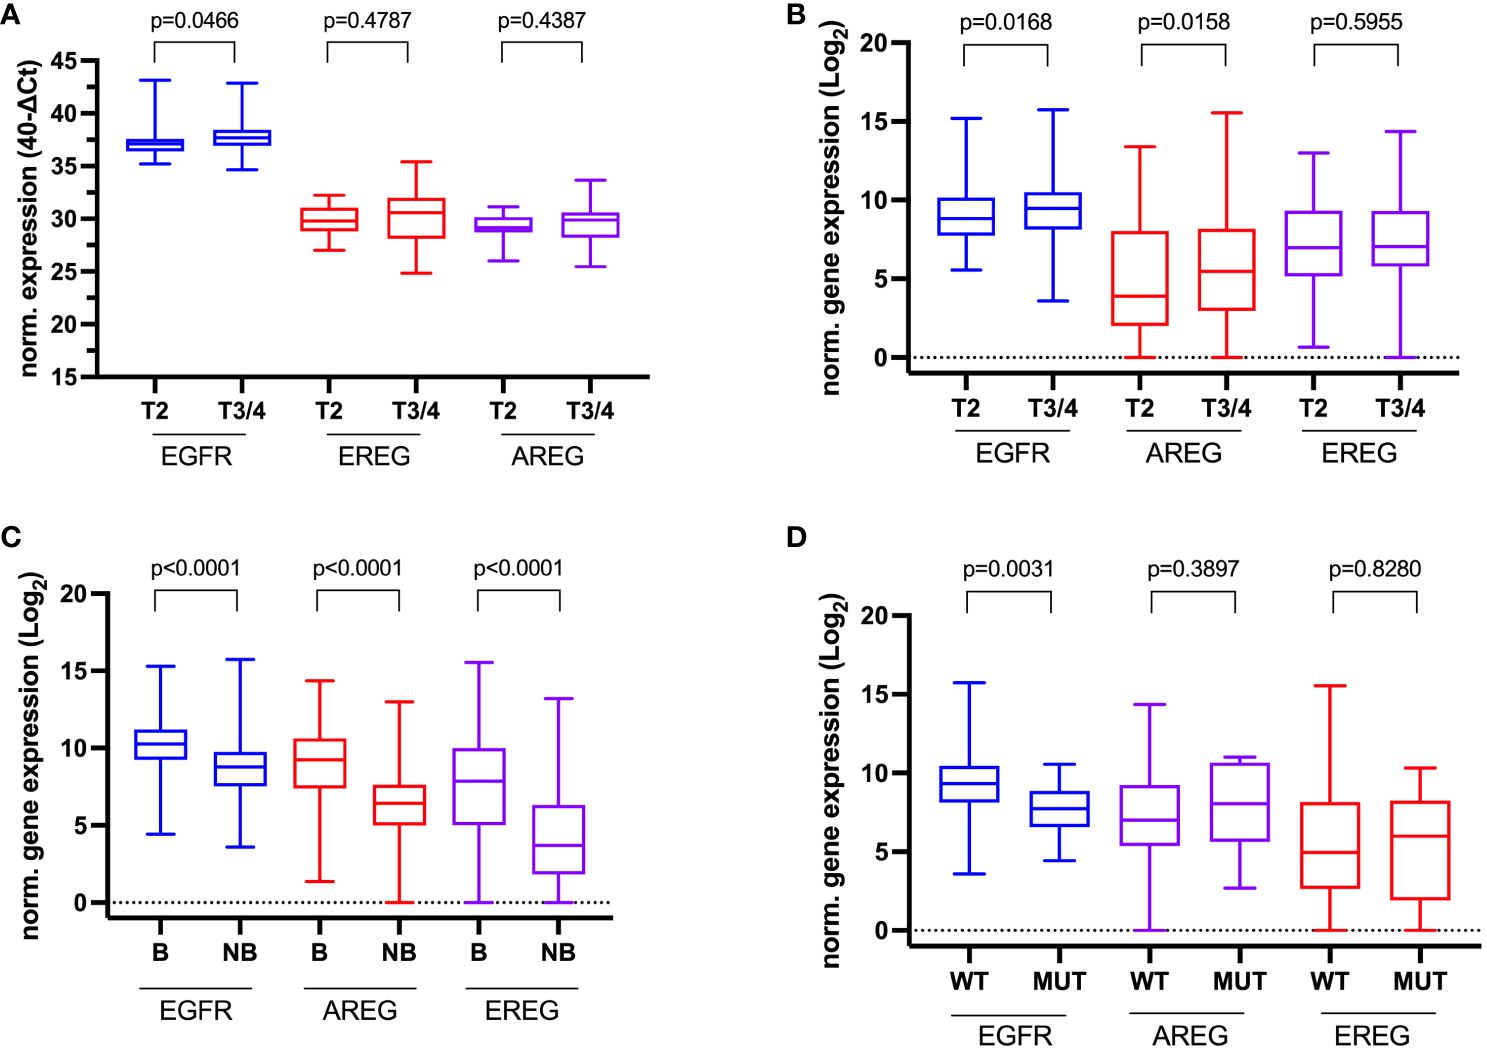
Figure 4 Association of clinicopathologic data with normalized gene expression. (A) Tumor stage in the Mannheim cohort, (B) Tumor stage in the TCGA cell 2017 MIBC cohort, (C) Molecular subtype (Basal (B) vs. Non-basal (NB) in the TCGA cell 2017 MIBC cohort, and (D) KRAS-Mutation status (wildtype (WT) vs. mutated (MUT) in the TCGA cell 2017 MIBC cohort.
3.4 Survival analyses
To evaluate the prognostic impact of EGFR, AREG and EREG expression on OS and CSS in the Chungbuk and MDACC, as well as OS, CSS and DFS in the MA cohort, and OS and DFS in the TCGA cohort, Kaplan-Meier analyses and cox proportional hazard ratios (HR) were used Figures 5, 6. In the MA cohort, a high AREG expression was associated with a longer OS (n = 94, median survival (high vs. low) 85 vs. 14 months, p < 0.0001, Figure 5B) and CSS (n = 84, median survival (high vs low) undefined (since the probability of survival exceeds 50% at the most distant time point measured) vs. 21 months, p = 0.0011, Figure 5E). Like AREG, a high EREG expression was associated with improved OS (n = 94, median survival (high vs. low) 76 vs. 20 months, p = 0.0488, Figure 5C) and improved CSS (n = 84, median survival (high vs. low) undefined vs. 30 months, p = 0.0242, Figure 5E). No statistically significant data for DFS were observed in the MA cohort (data not shown). In the TCGA cohort, a high EGFR, AREG and EREG gene expression was associated with shorter OS for all three genes (n = 330, EGFR: median survival (high vs. low) 27 vs. 87 months, p = 0.0003; AREG: median survival (high vs. low) 33 vs. 87 months, p = 0.0084, EREG, median survival (high vs. low) 33 vs. 59 months, p = 0.0376, Figures 6A–C). The association of worse survival with a high gene expression was maintained on DFS for all three genes but only reached statistical significance for EGFR (EGFR: n = 258, median survival (high vs. low) 28 vs. 81 months, p = 0.0007, Figures 6D, E). In the Chungbuk cohort, a high EGFR expression was associated with worse OS (EGFR: n = 54, median survival (high vs. low) 10 vs. 66 months, p = 0.0008; Supplementary Figure S4A). Due to the small sample size in the MDACC MIBC cohort (n=38), the observed survival effects could not be adequately evaluated. Univariable analysis of the MA cohort revealed locally advanced T stage (T3/4) and N+ to be associated with shorter OS, while a high AREG expression (HR = 0.30, CI 0.18 – 0.52, p < 0.0001) was associated with longer OS (Table 2). A high EREG expression (HR = 0.57 CI 0.32 – 1.01, p=0.0538) was similarly associated with a trend for improved OS, but no statistical significance could be reached (Table 2). On multivariable analysis of OS in the MA cohort, advanced T stages and N+ were associated with a worse outcome, while AREG (HR = 0.35, CI 0.19 - 0.63, p = 0.0004) maintained its association with improved survival (Table 2). Regarding CSS in the MA cohort, univariable analysis showed T3/4 and N+ to be associated with shorter CSS while a high AREG (HR = 0.32, CI 0.15 – 0.66, p=0.0021) and EREG (HR = 0.43, CI 0.20 - 0.92, p=0.0296) expression correlated with improved CSS (Table 3). In the multivariable analysis, the AREG expression (HR = 0.42, CI 0.18 - 0.95, p = 0.0378) remained as the only significant predictor of better CSS (Table 3). In the univariable analysis of the TCGA cohort, age, T3/4, N+ and high EGFR, AREG and EREG gene expression (EGFR: HR = 1.81, CI 1.30 – 2.52, p = 0.0004; AREG: HR = 1.57, CI 1.12 – 2.20, p = 0.0090; EREG: HR = 1.48, CI 1.02 – 2.15, p = 0.0389) were significant prognostic factors for shorter OS (Table 4). Except for EREG this negative survival association was maintained for all of the variables included in the multivariable model (Table 4). Univariable analysis of DFS in the TCGA cohort showed worse DFS with T3/4, N+, EGFR amplification (HR = 2.49, CI 1.26 – 4.95, p = 0.0389) and a high EGFR expression (HR = 1.91, CI 1.31 – 2.80, p = 0.0008, Table 5). While the association of EGFR amplification with a shorter DFS could not withstand in the multivariable analysis, T3/4, N+ and a high EGFR gene expression (HR = 1.73, CI 1.14 – 2.62, p = 0.0094) remained significant independent factors for a worse DFS (Table 5). In the Chungbuk cohort, a higher AREG expression was associated with a trend towards better OS (HR = 0.45, CI 0.19 – 1.08, p = 0.0735) on univariable analysis and a significant predictor of better OS (HR = 0.31, CI 0.11 – 0.87, p = 0.0257) in the multivariable OS analysis (Supplementary Table S6).
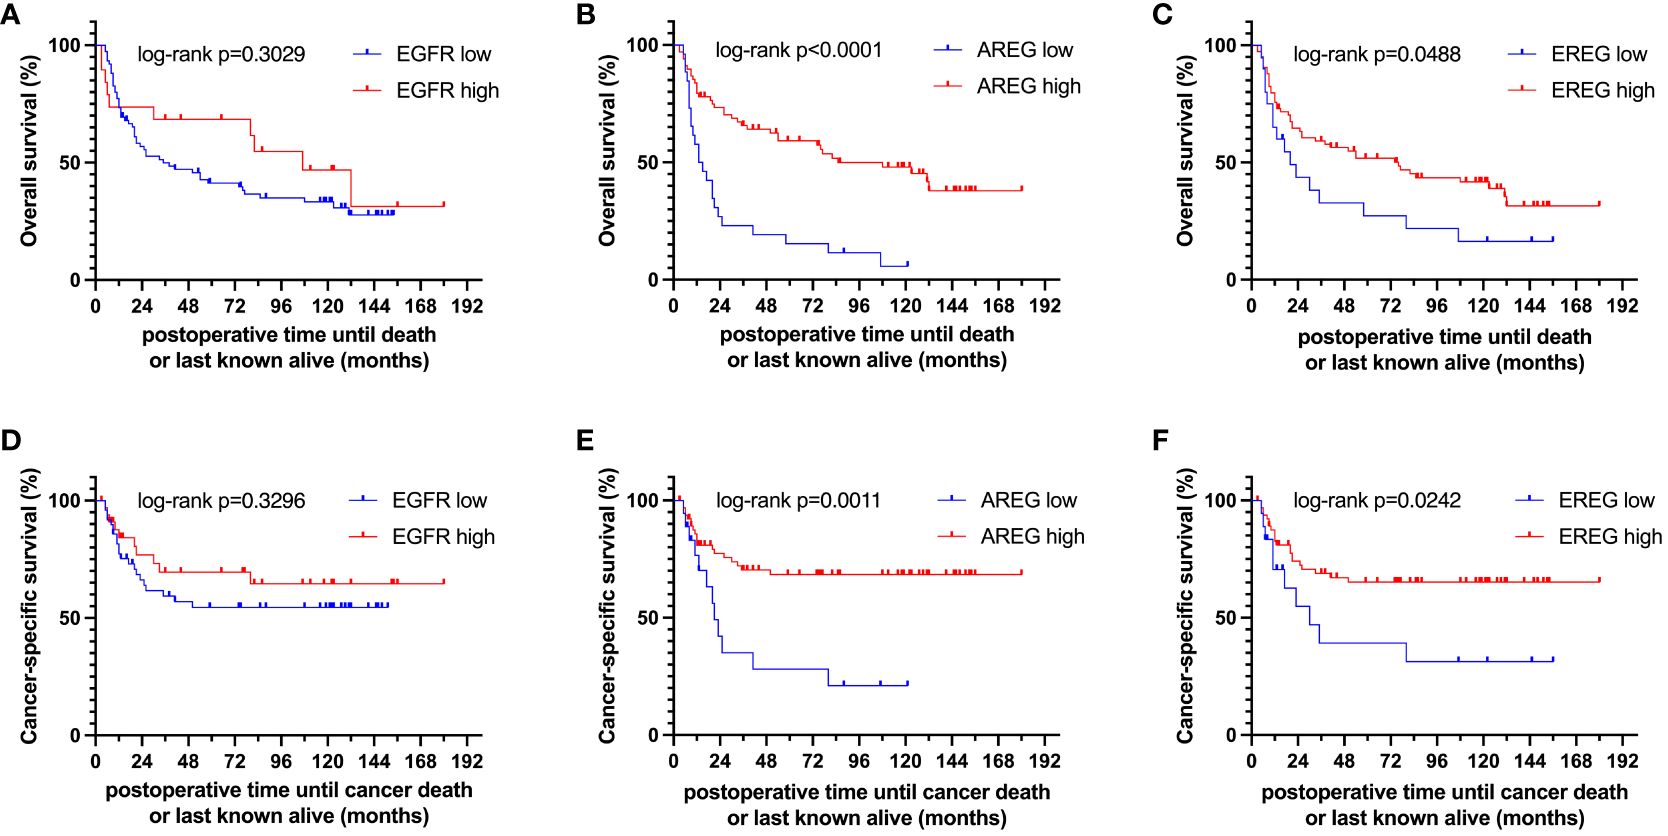
Figure 5 Kaplan-Meier curves of (A–C) overall survival (OS) and (D–F) cancer-specific survival (CSS) of EGFR, AREG and EREG in patients with MIBC from the Mannheim cohort.
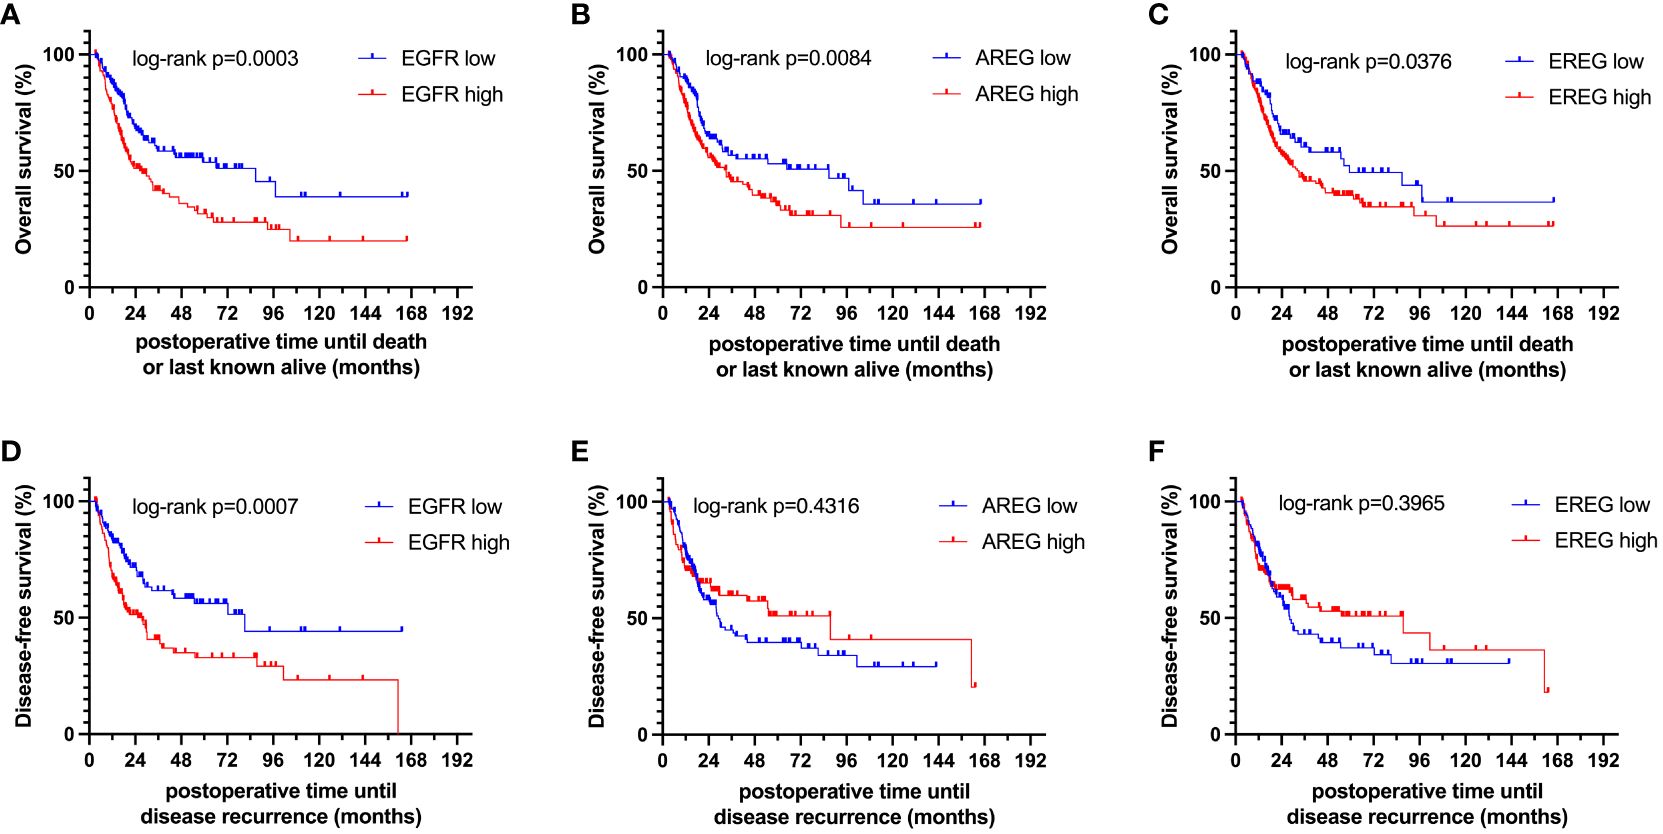
Figure 6 Kaplan-Meier curves of (A–C) overall survival (OS) and (D–F) disease-free survival (DFS) of EGFR, AREG and EREG in patients with MIBC from the TCGA cell 2017 MIBC cohort.
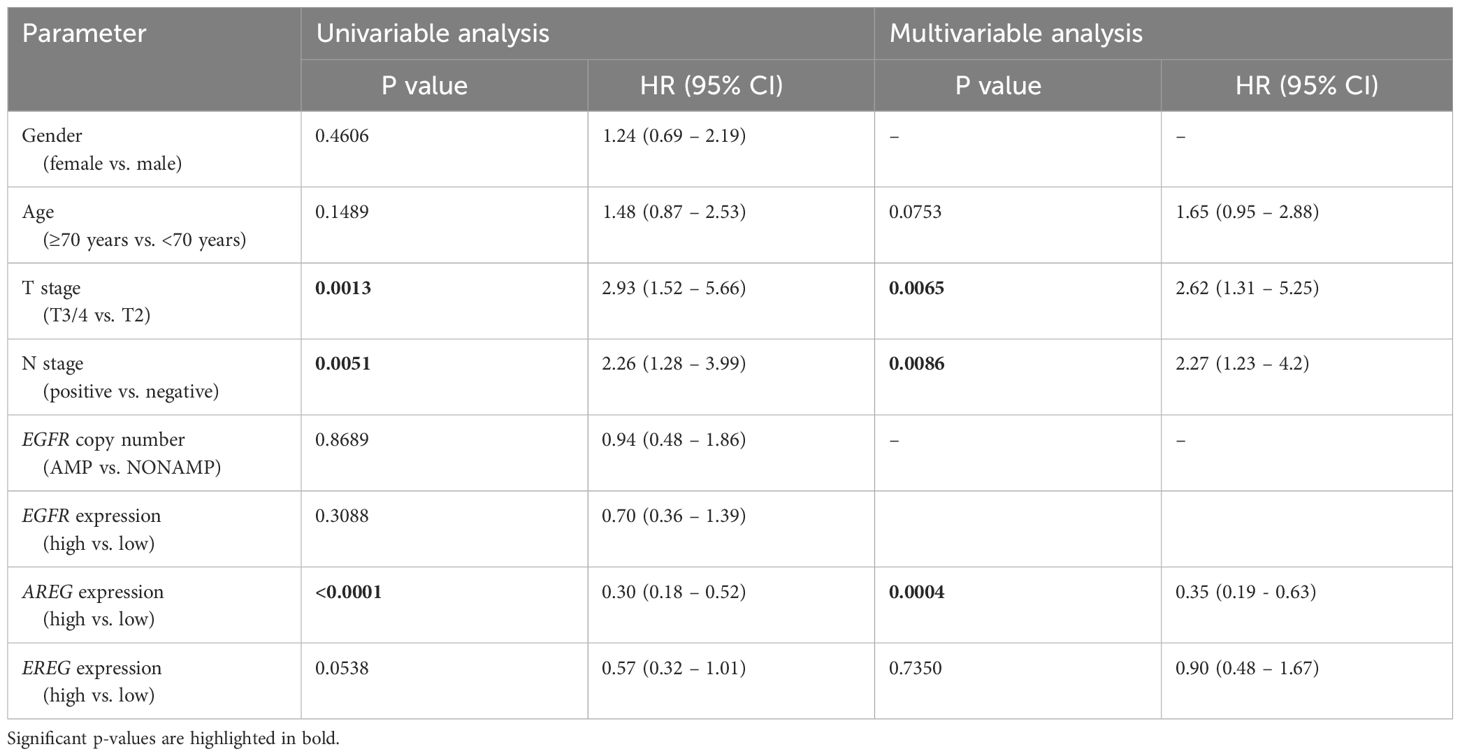
Table 2 Uni- and multivariable cox regression analyses of gene expression and clinicopathological parameters regarding overall survival (OS) in patients with MIBC after radical cystectomy (RC) in the MA cohort.
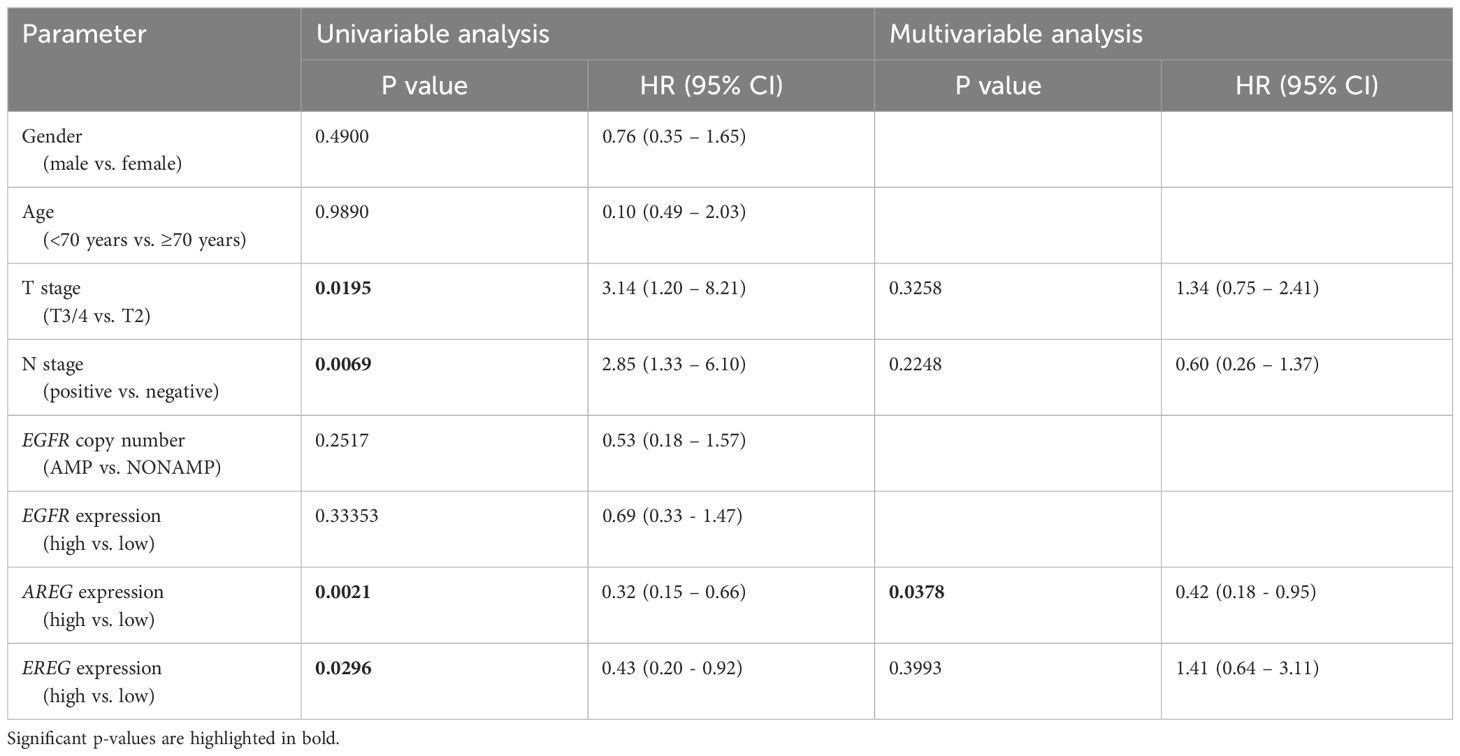
Table 3 Uni- and multivariable cox regression analyses of different parameters regarding cancer-specific survival (CSS) in patients with MIBC after RC in the MA cohort.
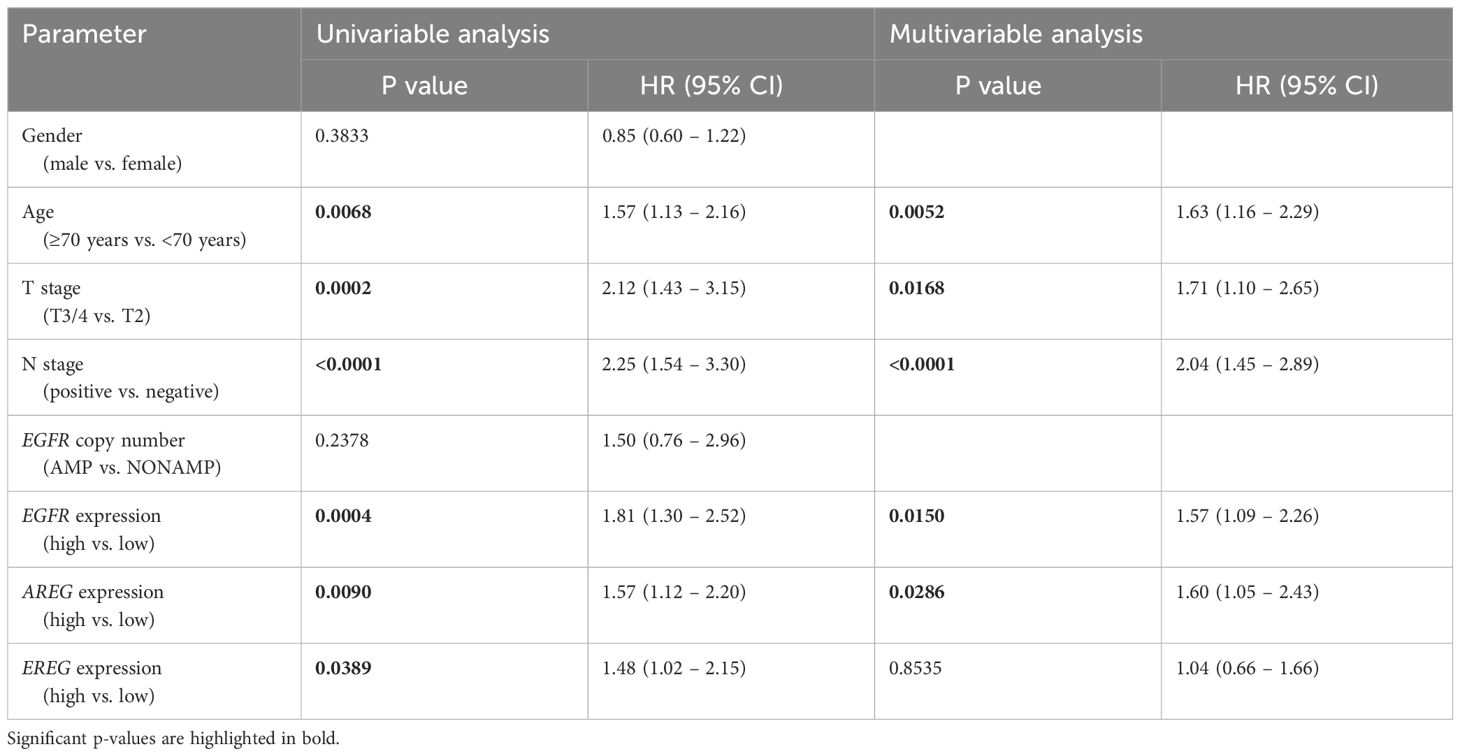
Table 4 Uni- and multivariable cox regression analyses of different parameters regarding OS in patients of the TCGA cohort.
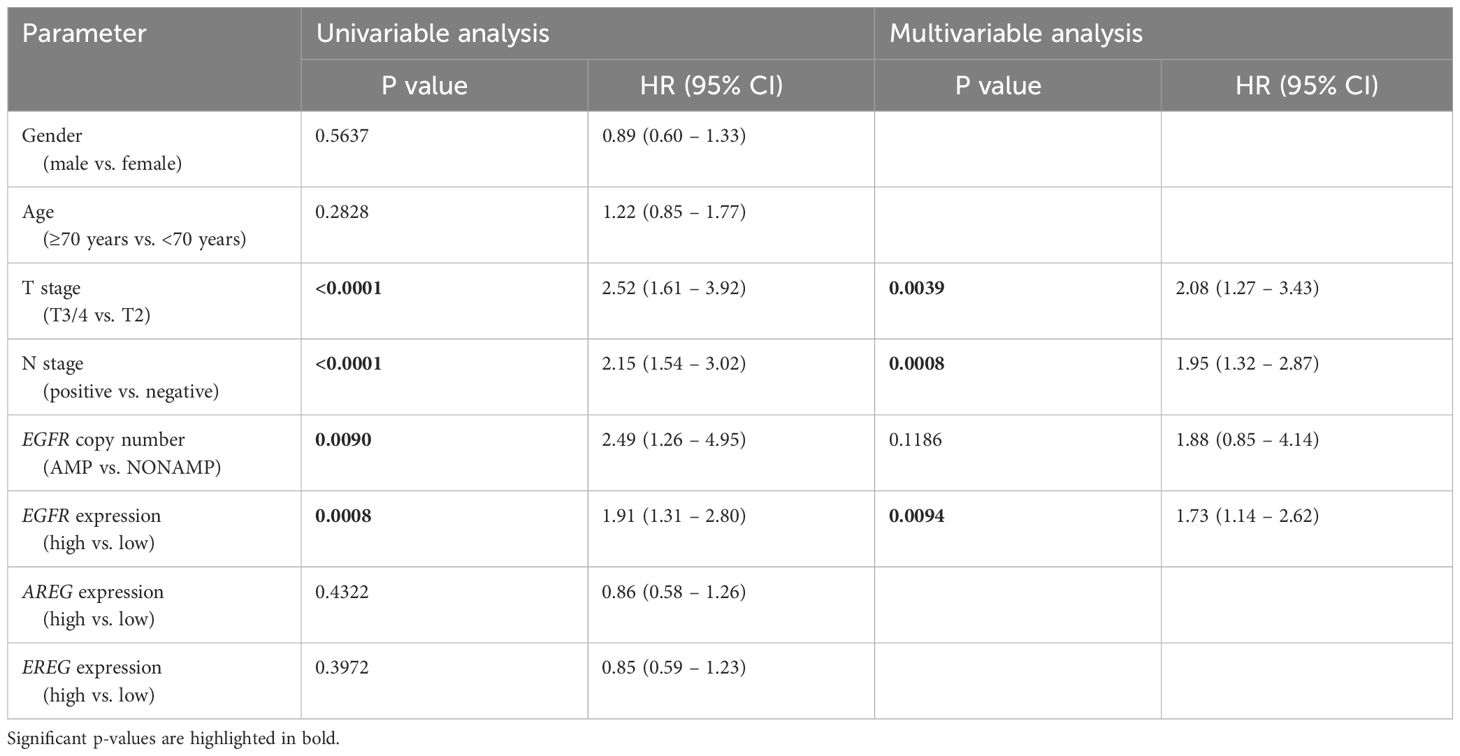
Table 5 Uni- and multivariable cox regression analyses of different parameters regarding DFS in patients with MIBC after RC in the TCGA cohort.
4 Discussion
In this study, the gene expression of EGFR, AREG and EREG in patients with MIBC, the association of gene expression with clinicopathologic variables of known prognostic impact in MIBC and the correlation of EGFR, AREG and EREG gene expression with survival and progression were investigated.
It was found that high AREG expression independently influenced the prediction of significantly longer OS and CSS in the MA (no significant survival associations for DFS) and longer OS in the Chungbuk cohort. In the TCGA cohort, a high EGFR, AREG and EREG expression were associated with worse OS and DFS. While this association was maintained for EGFR and EREG in the Chungbuk cohort, a high EGFR expression shifted from worse to better CSS prognosis in the Chungbuk cohort. The contradictory nature of these survival results in the three cohorts can partly be attributed to differences in analysis methods (qRT-PCR in the MA cohort, RNA-Seq in the TCGA cohort and microarray gene expression profiling in the Chungbuk cohort) and demographic baseline characteristics. We chose qRT-PCR in favor of IHC to analyze the gene expression, because the former method is free of inter-rater variability and proposed to be a more sensitive and unbiased method (23, 24). Additionally, patients’ treatments may further influence differences in gene expression profiles between individual cohorts. We compared the median gene expression of EGFR, AREG and EREG in patients with and without adjuvant chemotherapy in the MA cohort using the Mann-Whitney-Test, but could not find any statistically significant differences between both groups (data not shown).
Our observation that a high AREG expression was independently associated with better OS and CSS in the MA cohort is supported by data from Khambata-Ford et al., who found high expression levels of AREG and EREG on GeneChips and qRT-PCR to be associated with a significantly prolonged PFS under Cetuximab monotherapy (12). Correlation analysis further revealed AREG and EREG expression to be moderately (MA) and highly (TCGA) correlated with each other, which is in line with findings by Khambata-Ford et al. from mCRC and mostly attributable to colocalization of AREG and EREG on chromosome 4q13.3 (25). The observed weak correlation between EGFR and the two ligands could be explained by the ligand-receptor interaction, with EREG known to bind weaker to EGFR than other ligands but eliciting a stronger and prolonged EGFR activation (26, 27)
Biologically, elevated AREG and EREG expression have been postulated to stimulate an autocrine loop through EGFR leading Khambata-Ford et al. to hypothesize that these ligands are surrogate markers for an activated EGFR pathway, and potentially a positive feedback loop with EGFR (12). This hypothesis would be supported by our results of worse OS and DFS with a high expression of AREG, EREG and EGFR in the TCGA cohort.
As expected, EGFR gene expression was higher than that of its ligands in both cohorts and EGFR amplification events were associated with an increase in the expression of all three genes, while only EGFR was significantly differently expressed in the TCGA cohort. These findings correspond to the fact that, similar to CRC, activating mutations of EGFR in MIBC are rare, and EGFR expression is mainly regulated via EGFR amplification (12, 14).
Correlation with clinicopathologic data revealed advanced T stages T3/4 (TCGA: EGFR and EREG) and LVI (MA: AREG) to be the only variables associated with significant differences in gene expression. Further mechanistic studies are needed to ascertain if gene expression of EGFR and EREG/AREG truly drives local tumor growth, metastasis, and invasion or whether the observed differences are merely a bystander effect of the increased neoplastic microenvironment activity.
Interestingly, EGFR, although not statistically significant, was associated with better OS and CSS in the MA cohort, which corresponds to findings from mCRC showing no association of mRNA expression levels of EGFR and other EGFR-ligands (except for AREG and EREG) with disease control under Cetuximab (12).
Although a multitude of urinary and blood-based biomarkers exist to detect, monitor and control treatment response in NMIBC, survival prognosis for MIBC after RC is largely based on conventional imaging (CT and MRI scans). Since the gain of EGFR function is an established genomic event in the progression to MIBC, increased EGFR gene expression or amplification from FFPE tissue at the time of RC could be used as an additional marker for tumor aggressiveness besides histopathology and potentially serve as a biomarker (28). Smalley et al. used mass spectrometry to identify potential biomarkers on microparticles in the urine of patients with BC. They were able to show that 5 of the 8 detected proteins were associated with the EGFR pathway (29, 30). Other growth factors, such as the vascular endothelial growth factor A, which is part of the Oncuria® multiplex immunoassay (31), and the fibroblast growth factor 3 (FGFR3), which is part of the FDA-approved Uromonitor test® (32), are currently used in the context of urinary biomarker assays in clinical practice for NMIBC (33). While the above-mentioned markers were derived from urine, there is a clinical application for biomarkers evaluated by qRT-PCR of FFPE tissue samples, since FGFR3 mutations and FGFR2/3 gene fusions, which are currently used to guide the use of the pan-FGFR-inhibitor Erdafitinib for metastatic BC, are assessed using qRT-PCR of FFPE tissue samples (34).
Limitations of this study include its retrospective nature, varying gene expression detection and normalization methods between the MA and the TCGA cohort. Comparisons to other trials are limited through our endpoint selection of OS, CSS and DFS contrary to PFS and treatment response to anti-EGFR therapy. However, to our knowledge this is the first trial to date to assess clinicopathologic and survival associations of AREG and EREG in patients with MIBC.
Ultimately, the different findings between the MA and TCGA cohorts will need to be further investigated, as differences in used methodology, the existence of splice variants and differences in cohorts are potential biases to a validation. Further in vitro studies are needed to examine the nature of the EGFR-AREG/EREG relationship at a molecular level in MIBC.
AREG and EREG are promising prognostic markers in MIBC. Validation in the TCGA and Chungbuk cohort shows diverging survival results. Further in vitro studies at the molecular level are needed to explore the nature of the EGFR-AREG/EREG interaction and its potential impact on BC cancer biology and survival.
Data availability statement
The datasets presented in this study can be found in online repositories. The names of the repository/repositories and accession number(s) can be found in the article/Supplementary Material.
Ethics statement
The studies involving humans were approved by review board 2 of the University of Heidelberg under the number 2015- 549N-MA. The studies were conducted in accordance with the local legislation and institutional requirements. The participants provided their written informed consent to participate in this study.
Author contributions
DU: Conceptualization, Data curation, Formal analysis, Investigation, Methodology, Visualization, Writing – original draft, Writing – review & editing. BT: Data curation, Writing – review & editing. AF: Data curation, Writing – review & editing. DJ: Data curation, Writing – review & editing. ZP: Data curation, Writing – review & editing. FS: Formal analysis, Writing – review & editing. MM: Writing – review & editing. PN: Writing – review & editing. TW: Writing – review & editing. PE: Conceptualization, Supervision, Writing – review & editing. KN: Conceptualization, Data curation, Formal analysis, Investigation, Writing – original draft, Writing – review & editing.
Funding
The author(s) declare financial support was received for the research, authorship, and/or publication of this article. Except for institutional funding for the Urologic Research Laboratory no additional funding for this project was received.
Acknowledgments
We would like to thank all the patients who participated in this study. Additionally, we would like to thank and to acknowledge Annette Steidler for her technical and intellectual assistance in conducting the experiments.
Conflict of interest
The authors declare that the research was conducted in the absence of any commercial or financial relationships that could be construed as a potential conflict of interest.
Publisher’s note
All claims expressed in this article are solely those of the authors and do not necessarily represent those of their affiliated organizations, or those of the publisher, the editors and the reviewers. Any product that may be evaluated in this article, or claim that may be made by its manufacturer, is not guaranteed or endorsed by the publisher.
Supplementary material
The Supplementary Material for this article can be found online at: https://www.frontiersin.org/articles/10.3389/fonc.2024.1370303/full#supplementary-material
References
1. Siegel RL, Miller KD, Wagle NS, Jemal A. Cancer statistics, 2023. CA Cancer J Clin. (2023) 73:17–48. doi: 10.3322/caac.21763
2. Sung H, Ferlay J, Siegel RL, Laversanne M, Soerjomataram I, Jemal A, et al. Global cancer statistics 2020: GLOBOCAN estimates of incidence and mortality worldwide for 36 cancers in 185 countries. CA Cancer J Clin. (2021) 71:209–49. doi: 10.3322/caac.21660
3. Miller KD, Siegel RL, Lin CC, Mariotto AB, Kramer JL, Rowland JH, et al. Cancer treatment and survivorship statistics, 2016. CA Cancer J Clin. (2016) 66:271–89. doi: 10.3322/caac.21349
4. Stein JP, Lieskovsky G, Cote R, Groshen S, Feng AC, Boyd S, et al. Radical cystectomy in the treatment of invasive bladder cancer: long-term results in 1,054 patients. J Clin Oncol. (2001) 19:666–75. doi: 10.1200/JCO.2001.19.3.666
5. Arnold D, Lueza B, Douillard JY, Peeters M, Lenz HJ, Venook A, et al. Prognostic and predictive value of primary tumor side in patients with RAS wild-type metastatic colorectal cancer treated with chemotherapy and EGFR directed antibodies in six randomized trials. Ann Oncol. (2017) 28:1713–29. doi: 10.1093/annonc/mdx175
6. Ramalingam SS, Vansteenkiste J, Planchard D, Cho BC, Gray JE, Ohe Y, et al. Overall survival with osimertinib in untreated, EGFR-mutated advanced NSCLC. N Engl J Med. (2020) 382:41–50. doi: 10.1056/NEJMoa1913662
7. Chaux A, Cohen JS, Schultz L, Albadine R, Jadallah S, Murphy KM, et al. High epidermal growth factor receptor immunohistochemical expression in urothelial carcinoma of the bladder is not associated with EGFR mutations in exons 19 and 21: a study using formalin-fixed, paraffin-embedded archival tissues. Hum Pathol. (2012) 43:1590–5. doi: 10.1016/j.humpath.2011.11.016
8. Hussain M, Daignault S, Agarwal N, Grivas PD, Siefker-Radtke AO, Puzanov I, et al. A randomized phase 2 trial of gemcitabine/cisplatin with or without cetuximab in patients with advanced urothelial carcinoma. Cancer. (2014) 120:2684–93. doi: 10.1002/cncr.28767
9. Wulfing C, Machiels JP, Richel DJ, Grimm MO, Treiber U, De Groot MR, et al. A single-arm, multicenter, open-label phase 2 study of lapatinib as the second-line treatment of patients with locally advanced or metastatic transitional cell carcinoma. Cancer. (2009) 115:2881–90. doi: 10.1002/cncr.24337
10. Rebouissou S, Bernard-Pierrot I, de Reynies A, Lepage ML, Krucker C, Chapeaublanc E, et al. EGFR as a potential therapeutic target for a subset of muscle-invasive bladder cancers presenting a basal-like phenotype. Sci Transl Med. (2014) 6:244ra91. doi: 10.1126/scitranslmed.3008970
11. Goodspeed A, Jean A, Theodorescu D, Costello JC. A gene expression signature predicts bladder cancer cell line sensitivity to EGFR inhibition. Bladder Cancer. (2018) 4:269–82. doi: 10.3233/BLC-170161
12. Khambata-Ford S, Garrett CR, Meropol NJ, Basik M, Harbison CT, Wu S, et al. Expression of epiregulin and amphiregulin and K-ras mutation status predict disease control in metastatic colorectal cancer patients treated with cetuximab. J Clin Oncol. (2007) 25:3230–7. doi: 10.1200/JCO.2006.10.5437
13. Seligmann JF, Elliott F, Richman SD, Jacobs B, Hemmings G, Brown S, et al. Combined epiregulin and amphiregulin expression levels as a predictive biomarker for panitumumab therapy benefit or lack of benefit in patients with RAS wild-type advanced colorectal cancer. JAMA Oncol. (2016) 2:633–42. doi: 10.1001/jamaoncol.2015.6065
14. Jacobs B, De Roock W, Piessevaux H, Van Oirbeek R, Biesmans B, De Schutter J, et al. Amphiregulin and epiregulin mRNA expression in primary tumors predicts outcome in metastatic colorectal cancer treated with cetuximab. J Clin Oncol. (2009) 27:5068–74. doi: 10.1200/JCO.2008.21.3744
15. Erben P, Wezel F, Wirtz R, Martini T, Stein D, Weis CA, et al. Role of the human ErbB family receptors in urothelial carcinoma of the bladder: mRNA expression status and prognostic relevance. Aktuelle Urol. (2017) 48:356–62. doi: 10.1055/s-0043–110403
16. Robertson AG, Kim J, Al-Ahmadie H, Bellmunt J, Guo G, Cherniack AD, et al. Comprehensive molecular characterization of muscle-invasive bladder cancer. Cell. (2017) 171:540–56. doi: 10.1016/j.cell.2017.09.007
17. Kim WJ, Kim EJ, Kim SK, Kim YJ, Ha YS, Jeong P, et al. Predictive value of progression-related gene classifier in primary non-muscle invasive bladder cancer. Mol Cancer. (2010) 9:3. doi: 10.1186/1476–4598-9–3
18. Choi W, Porten S, Kim S, Willis D, Plimack ER, Hoffman-Censits J, et al. Identification of distinct basal and luminal subtypes of muscle-invasive bladder cancer with different sensitivities to frontline chemotherapy. Cancer Cell. (2014) 25:152–65. doi: 10.1016/j.ccr.2014.01.009
19. Breyer J, Otto W, Wirtz RM, Wullich B, Keck B, Erben P, et al. ERBB2 Expression as Potential Risk-Stratification for Early Cystectomy in Patients with pT1 Bladder Cancer and Concomitant Carcinoma in situ. Urol Int. (2017) 98:282–9. doi: 10.1159/000453670
20. Goldman MJ, Craft B, Hastie M, Repecka K, McDade F, Kamath A, et al. Visualizing and interpreting cancer genomics data via the Xena platform. Nat Biotechnol. (2020) 38:675–8. doi: 10.1038/s41587–020-0546–8
21. Cerami E, Gao J, Dogrusoz U, Gross BE, Sumer SO, Aksoy BA, et al. The cBio cancer genomics portal: an open platform for exploring multidimensional cancer genomics data. Cancer Discovery. (2012) 2:401–4. doi: 10.1158/2159–8290.CD-12–0095
22. Gao J, Aksoy BA, Dogrusoz U, Dresdner G, Gross B, Sumer SO, et al. Integrative analysis of complex cancer genomics and clinical profiles using the cBioPortal. Sci Signal. (2013) 6:pl1. doi: 10.1126/scisignal.2004088
23. Eckstein M, Wirtz RM, Pfannstil C, Wach S, Stoehr R, Breyer J, et al. A multicenter round robin test of PD-L1 expression assessment in urothelial bladder cancer by immunohistochemistry and RT-qPCR with emphasis on prognosis prediction after radical cystectomy. Oncotarget. (2018) 9:15001–14. doi: 10.18632/oncotarget.24531
24. Tyekucheva S, Martin NE, Stack EC, Wei W, Vathipadiekal V, Waldron L, et al. Comparing platforms for messenger RNA expression profiling of archival formalin-fixed, paraffin-embedded tissues. J Mol Diagn. (2015) 17:374–81. doi: 10.1016/j.jmoldx.2015.02.002
25. Conti M, Hsieh M, Park JY, Su YQ. Role of the epidermal growth factor network in ovarian follicles. Mol Endocrinol. (2006) 20:715–23. doi: 10.1210/me.2005–0185
26. Shelly M, Pinkas-Kramarski R, Guarino BC, Waterman H, Wang LM, Lyass L, et al. Epiregulin is a potent pan-ErbB ligand that preferentially activates heterodimeric receptor complexes. J Biol Chem. (1998) 273:10496–505. doi: 10.1074/jbc.273.17.10496
27. Freed DM, Bessman NJ, Kiyatkin A, Salazar-Cavazos E, Byrne PO, Moore JO, et al. EGFR ligands differentially stabilize receptor dimers to specify signaling kinetics. Cell. (2017) 171:683–95. doi: 10.1016/j.cell.2017.09.017
28. Batista R, Vinagre N, Meireles S, Vinagre J, Prazeres H, Leao R, et al. Biomarkers for bladder cancer diagnosis and surveillance: A comprehensive review. Diagnostics (Basel). (2020) 10:1–19. doi: 10.3390/diagnostics10010039
29. Smalley DM, Sheman NE, Nelson K, Theodorescu D. Isolation and identification of potential urinary microparticle biomarkers of bladder cancer. J Proteome Res. (2008) 7:2088–96. doi: 10.1021/pr700775x
30. Oliveira MC, Caires HR, Oliveira MJ, Fraga A, Vasconcelos MH, Ribeiro R. Urinary biomarkers in bladder cancer: where do we stand and potential role of extracellular vesicles. Cancers (Basel). (2020) 12:1–30. doi: 10.3390/cancers12061400
31. Hirasawa Y, Pagano I, Chen R, Sun Y, Dai Y, Gupta A, et al. Diagnostic performance of Oncuria, a urinalysis test for bladder cancer. J Transl Med. (2021) 19:141. doi: 10.1186/s12967–021-02796–4
32. Sieverink CA, Batista RPM, Prazeres HJM, Vinagre J, Sampaio C, Leao RR, et al. Clinical validation of a urine test (Uromonitor-V2((R))) for the surveillance of non-muscle-invasive bladder cancer patients. Diagnostics (Basel). (2020) 10:1–11. doi: 10.3390/diagnostics10100745
33. Malinaric R, Mantica G, Lo Monaco L, Mariano F, Leonardi R, Simonato A, et al. The role of novel bladder cancer diagnostic and surveillance biomarkers-what should a urologist really know? Int J Environ Res Public Health. (2022) 19:1–20. doi: 10.3390/ijerph19159648
Keywords: EGFR, AREG, EREG, bladder cancer, gene expression, survival
Citation: Uysal D, Thaqi B, Fierek A, Jurgowski D, Popovic ZV, Siegel F, Michel MS, Nuhn P, Worst TS, Erben P and Nitschke K (2024) Prognostic significance of EGFR, AREG and EREG amplification and gene expression in muscle invasive bladder cancer. Front. Oncol. 14:1370303. doi: 10.3389/fonc.2024.1370303
Received: 25 January 2024; Accepted: 09 May 2024;
Published: 28 May 2024.
Edited by:
Lei Yin, Shanghai Jiaotong University School of Medicine, ChinaReviewed by:
Guglielmo Mantica, San Martino Hospital (IRCCS), ItalyXiaotian Tan, Chinese Academy of Sciences (CAS), China
Copyright © 2024 Uysal, Thaqi, Fierek, Jurgowski, Popovic, Siegel, Michel, Nuhn, Worst, Erben and Nitschke. This is an open-access article distributed under the terms of the Creative Commons Attribution License (CC BY). The use, distribution or reproduction in other forums is permitted, provided the original author(s) and the copyright owner(s) are credited and that the original publication in this journal is cited, in accordance with accepted academic practice. No use, distribution or reproduction is permitted which does not comply with these terms.
*Correspondence: Katja Nitschke, Katja.Nitschke@medma.uni-heidelberg.de