 Zhu Xu1,2
 Qin Wang3Yiyao Zhang2,4Xiaolan Li3Mei Wang2,4Yuhong Zhang1,2Yaxin Pei2,4
 Kezhen Li1
 Man Yang4
 Liping Luo2,4
 Chuan Wu2,4Weidong Wang1,2*
- 1Department of Oncology, School of Clinical Medicine, Southwest Medical University, Luzhou, China
- 2Department of Radiation Oncology, Sichuan Clinical Research Center for Cancer, Sichuan Cancer Hospital & Institute, Sichuan Cancer Center, Affiliated Cancer Hospital of University of Electronic Science and Technology of China, Chengdu, China
- 3Department of Pathology, QuXian People’s Hospital, Dazhou, China
- 4School of Medicine, University of Electronic Science and Technology of China, Chengdu, China
Background: Tertiary lymphoid structures (TLS) is a particular component of tumor microenvironment (TME). However, its biological mechanisms in colorectal cancer (CRC) have not yet been understood. We desired to reveal the TLS gene signature in CRC and evaluate its role in prognosis and immunotherapy response.
Methods: The data was sourced from The Cancer Genome Atlas (TCGA) and the Gene Expression Omnibus (GEO) databases. Based on TLS-related genes (TRGs), the TLS related subclusters were identified through unsupervised clustering. The TME between subclusters were evaluated by CIBERSORT and xCell. Subsequently, developing a risk model and conducting external validation. Integrating risk score and clinical characteristics to create a comprehensive nomogram. Further analyses were conducted to screen TLS-related hub genes and explore the relationship between hub genes, TME, and biological processes, using random forest analysis, enrichment and variation analysis, and competing endogenous RNA (ceRNA) network analysis. Multiple immunofluorescence (mIF) and immunohistochemistry (IHC) were employed to characterize the existence of TLS and the expression of hub gene.
Results: Two subclusters that enriched or depleted in TLS were identified. The two subclusters had distinct prognoses, clinical characteristics, and tumor immune infiltration. We established a TLS-related prognostic risk model including 14 genes and validated its predictive power in two external datasets. The model’s AUC values for 1-, 3-, and 5-year overall survival (OS) were 0.704, 0.737, and 0.746. The low-risk group had a superior survival rate, more abundant infiltration of immune cells, lower tumor immune dysfunction and exclusion (TIDE) score, and exhibited better immunotherapy efficacy. In addition, we selected the top important features within the model: VSIG4, SELL and PRRX1. Enrichment analysis showed that the hub genes significantly affected signaling pathways related to TLS and tumor progression. The ceRNA network: PRRX1-miRNA (hsa-miR-20a-5p, hsa-miR-485–5p) -lncRNA has been discovered. Finally, IHC and mIF results confirmed that the expression level of PRRX1 was markedly elevated in the TLS- CRC group.
Conclusion: We conducted a study to thoroughly describe TLS gene signature in CRC. The TLS-related risk model was applicable for prognostic prediction and assessment of immunotherapy efficacy. The TLS-hub gene PRRX1, which had the potential to function as an immunomodulatory factor of TLS, could be a therapeutic target for CRC.
1 Introduction
CRC is among one of the most prevalent cancers worldwide. Recent surveys have shown that CRC accounted for 10% of new cancer cases and deaths globally (1, 2). Notwithstanding progress in surgical techniques, chemotherapy, and radiation therapy, a substantial number of patients experience recurrence or metastasis. Immunotherapy has opened new avenue for treatment, particularly for patients with specific genetic mutations like deficient mismatch repair (dMMR) and microsatellite instability-high (MSI-H). Clinical trials, including KEYNOTE-164, CheckMate 142 and others, have shown that the use of programmed cell death protein-1 (PD-1) blockade therapy leads to long-lasting response, especially in advanced-stage patients with MSI-H (3–5). However, immunotherapy is not universally effective; it benefits only a subset of patients and can cause unique side effects, such as autoimmune reactions. The effectiveness of immunotherapy largely depends on the TME and genetic profiles. According to reports, TLS was positively correlated with the expression of immune-related genes in CRC, such as programmed cell death ligand-1 (PD-L1) (6). This suggests that TLS may enhance the effectiveness of immune checkpoint blockade (ICB) therapies by promoting the infiltration of immune cells and remodeling TME.
TLS, also referred to ectopic lymphoid organizations (ELO), serves as a site for immune cells recruitment, activation, and proliferation (7–9). TLS resemble lymph nodes to some extent but with unique features. For example, TLS lack capsules and afferent lymphatic vessels, which distinguishes them from traditional lymph nodes. TLS contains structured zones of immune cells, such as the T cell zone and the B cell germinal center (GC) (10). In summary, TLS is comprised of immune cells, stromal cells, and specialized vascular components (11, 12). TLS has a vital function in local immune responses. Research on TLS is currently flourishing in the fields of cancer, chronic inflammation, and autoimmune diseases (13).
Accumulating evidences suggest that TLS generally associated with favorable prognosis and better immunotherapy efficacy in melanoma, breast cancer and so on (11, 14–16). Patients with TLS tend to have improved OS rates compared to those lacking TLS. TLS can convert an immune cold tumor to a hot tumor by increasing the recognition and clearance of the host immune system to tumors (17). In addition, the latest study found that combining immunotherapies with strategies to promote TLS formation or reorganization may enhance the effectiveness of immunotherapy. Strategies may include using specific cytokines or chemokines to recruit immune cells to TLS.
Despite progress, there remains an incomplete understanding of the precise molecular mechanisms governing TLS growth and maturity. There are still doubts about the interactions between TLS and the tumor immune system. Therefore, our study integrated TRGs and downloaded data from TCGA database to classify patients into two subclusters and develop a novel prognostic model. We also investigated the connection between TLS-hub genes and its molecular mechanisms.
2 Materials and methods
2.1 Data collection and preparation
The data, including gene sequencing data and corresponding clinical data, were obtained from the TCGA and GEO databases. TCGA-CRC dataset functioned as a discovery set for marker selection and model construction, consisting of 558 samples. Samples with survival times under 30 days were removed. GEO datasets GSE38832 and GSE17537 served as external validation sets to assess the robustness of the model. IMvigor210 immunotherapy cohort was obtained from the original article (18). Clinical information for all samples were detailed in Supplementary Table 1.
2.2 Establish TLS-related molecular subclusters and evaluate the TME
The mutation landscapes of CRC patients were analyzed by the “maftool” R package (19). Unsupervised clustering, via the “ConsensusClusterPlus” R package, segmented patients into two subclusters (20). This segmentation was guided by maximizing intergroup variances and minimizing intragroup variances. The immune infiltration environment in each patient was assessed using CIBERSORT and xCell (21, 22). XCell was also utilized to compare the environment scores in different groups.
2.3 Develop the TLS-related risk model, estimate its prognostic value, and develop a comprehensive nomogram
Using the “DESeq2” package, we obtained differentially expressed genes (DEGs) comparing two clusters, tumor and normal. The Lasso-Cox regression was applied to filter out DEGs that are associated with OS, reduce dimensions, and construct the prognostic model. Patients were classified into two risk groups by the risk score, which was calculated as: Coefi denotes the estimated regression coefficient, while Expri denotes the gene’s expression level. The model’s predictive efficiency and accuracy were evaluated via the “survival”, “survminer”, “timeROC”, and “pheatmap” R packages. MSI status was obtained from the “cBioPoralData” R package. According to the results of multivariate Cox regression, we plotted the forest plot and nomogram.
2.4 Identify TLS-related hub genes, analyze its molecular mechanism and enrichment pathways
The 14 model genes were ranked based on the feature importance calculated through “randomForest” package. All feature importance was normalized to range from 0 to 1. Genes with importance exceeding 0.75 were classified as TLS-related hub genes. To comprehensively analyze the biological pathways of TLS-related genes, a dual approach involving gene set enrichment analysis (GSEA) and gene set variation analysis (GSVA) were used. Gene Ontology (GO), Kyoto Encyclopedia of Genes and Genomes (KEGG), and hallmark annotation were conducted with the “clusterProfiler” and “GSVA” packages (23, 24). The visualization of results using the “ggplot2”.
2.5 Estimation of TLS existence in human CRC tissue samples
Human CRC tissue samples were collected from QuXian People’s Hospital, including 20 TLS+ tissue samples and 10 TLS- tissue samples (initial diagnosis of CRC, denial of other tumors, unaccepting of neoadjuvant therapy and complete clinical data). Clinical information for all samples was detailed in Supplementary Table 3. The research received approval from the Ethics Committee of the QuXian People’s Hospital. Two pathologists independently evaluated the TLS existence in all CRC samples. Questionable results were then co-reviewed for an agreed annotation. TLS were classified into three stages based on maturity: (1) early TLS (compact clumps of lymphocytes without segregated T and B cell zones), (2) primary follicle-like TLS [(have follicular dendritic cell (FDC), lack of GC)] and (3) secondary follicle-like TLS (have an active GC) (25). Samples with TLS were categorized as TLS+ group, while others were deemed TLS- group.
2.6 Using mIF to characterize TLS and related hub gene
Firstly, slides were deparaffinized and placed in the citrate-phosphate buffer (heat them in a microwave at low heat for 15 min). Circled the tissue with an immunohistochemical pen to block endogenous peroxidase. Secondly, incubated the slides in hydrogen peroxide water at room temperature and avoid light for 25 min. Added BSA buffer dropwise onto the slides and sealed for 30 min. After removing the BSA buffer, we added the prepared primary antibody (CD3: ab16669, Abcam, Britain, 1:1000) dropwise and incubated the slides overnight at 4 °C in a wet box. Next, the slides were washed, and horseradish peroxidase (HRP) labelled secondary antibody (Goat anti-mouse/rabbit IgG H&L, RCB054, RecordBio, China) were dripped onto the slides. Tyramide signal amplification (TSA) buffer was used to visualize each biomarker. Dripped corresponding TSA dye onto the slides and incubated them at room temperature in the dark for 10 min to stain the antibody. Repeated the previous steps using different primary antibodies (CD20: ab78237, Abcam, 1:1000; CD21: ab315160, Abcam, 1:1000) and switched different TSA dyes. Finally, stained nucleus with DAPI and coverslipped anti-fluorescence quenching to preserve fluorescence. The slides were digitized using OLYMPUS (OlyVIA, Japan).
Next, we performed IHC to examine the PRRX1 expression level in TLS+/- CRC formalin-fixed paraffin-embedded (FFPE) samples, using PRRX1 antibody (ab211292, Abcam, 1:100). Tissues were scored according to the product of stained area percentage (0 = 0%, 1 = 1%–25%, 2 = 26%–50%, 3= 51%–75%, and 4 = more than 75%) and the staining intensity scale [ranged from 0 (no staining) to 3 (strong staining), measured by Halo]. The IHC score for all samples was detailed in Supplementary Table 3.
2.7 Statistical analysis
The data analysis was performed using R software version 4.2.2. For categorical data, the Chi-square test and Fisher’s exact test were used to assess differences between groups. For continuous data, if the data are normally distributed and have equal variances, an independent samples T-test was used; if the data do not follow a normal distribution, the Mann-Whitney U test was used. Spearman’s correlation analysis was used to identify the relationship between two variables. The threshold for statistical significance was set at P< 0.05 (two-tailed).
3 Results
3.1 The genetic and variation characteristics of TRGs in CRC
By integrating current studies and reviews, we identified 42 TRGs, of which 25 were expressed in TCGA-CRC dataset (Supplementary Table 2). Among 517 CRC patients, 94.39% (488) experienced somatic mutations. APC and TP53 had the highest mutation frequencies (Figure 1A). We further analyzed the somatic mutation pattern of TRGs (Figure 1B). 11.41% (59) of patients experienced somatic mutations, predominantly missense mutations.IL1R1 and IL1R2 exhibited the highest mutation frequencies, while CD4 and LAMP3 primarily underwent frame shift deletions. Using STRING (V12.0), a protein-protein interaction (PPI) network was constructed (Figure 1C). GISTIC2.0 was used to calculate the copy number variations (CNV). The results showed that copy number amplification (including homozygous and heterozygous mutations) was the major mutation (Figure 1D).
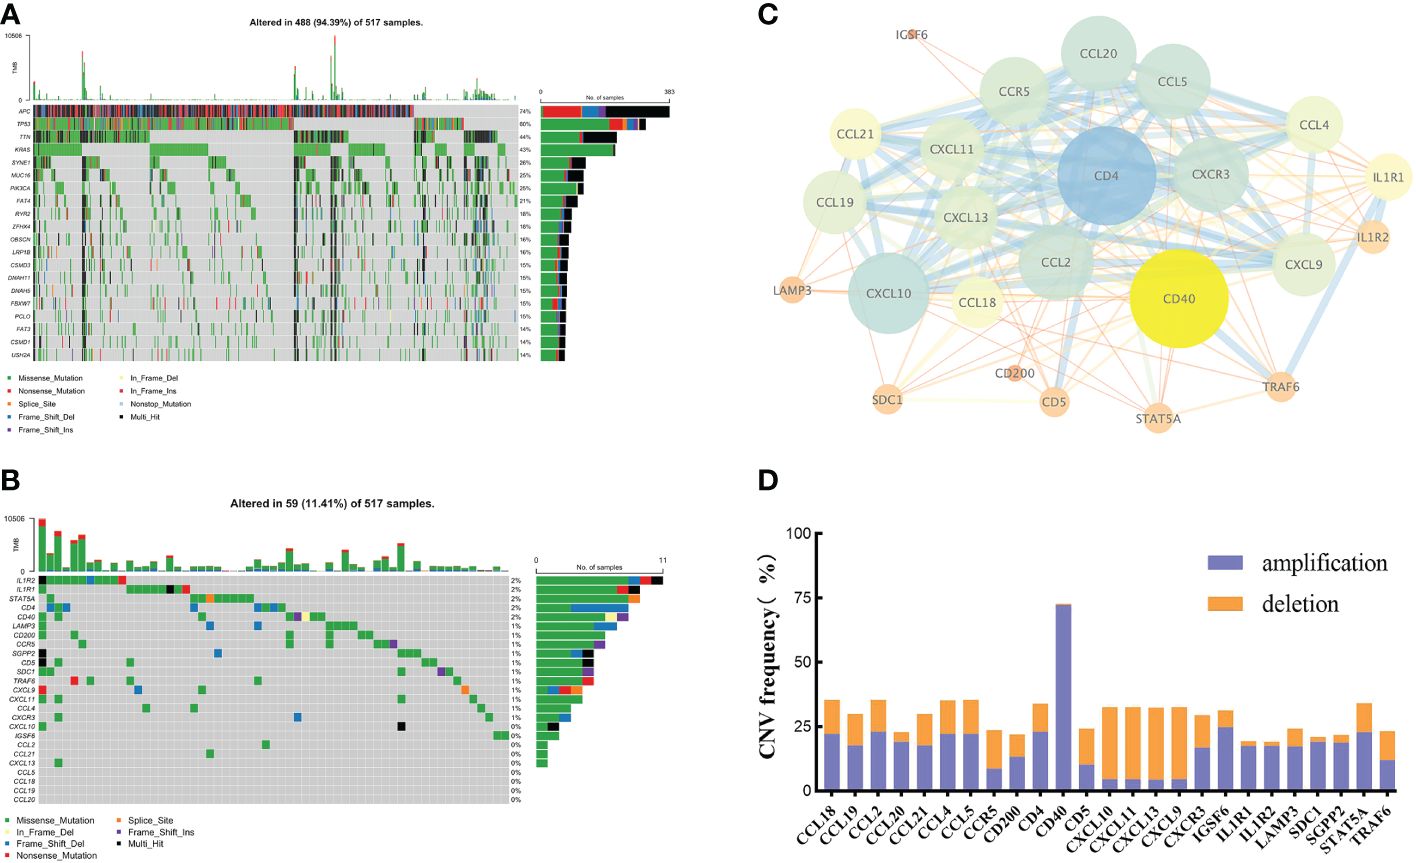
Figure 1 The genetic and variation landscapes of TCGA-CRC dataset. (A) Somatic mutation of the top 20 genes in CRC. (B) Somatic mutation of 25 TRGs. (C) PPI network of TRGs. The size and color of the nodes represented the degree of interaction. The edge size and the color showed the combined score of interaction. (D) CNV frequency of TRGs.
3.2 Clinicopathological characteristics and immune cell infiltration of TLS related subclusters
Unsupervised consensus clustering based on TRGs categorized CRC patients into two molecular subclusters. The consensus clustering results indicated that the optimal clustering number was 2 (Supplementary Figures 1A–C). Principal component analysis (PCA) proved the optimal division into two clusters, C1 and C2 (Supplementary Figure 1D). The Kaplan-Meier analysis demonstrated a statistically difference in C1 and C2 (P<0.01, Figure 2A). The prognosis for C1 was more favorable compared to C2. Meanwhile, we examined the clinicopathological characteristics of two subclusters. C1 had a higher proportion of males, N0, M0, and stage I/II (Supplementary Figures 1D–I).
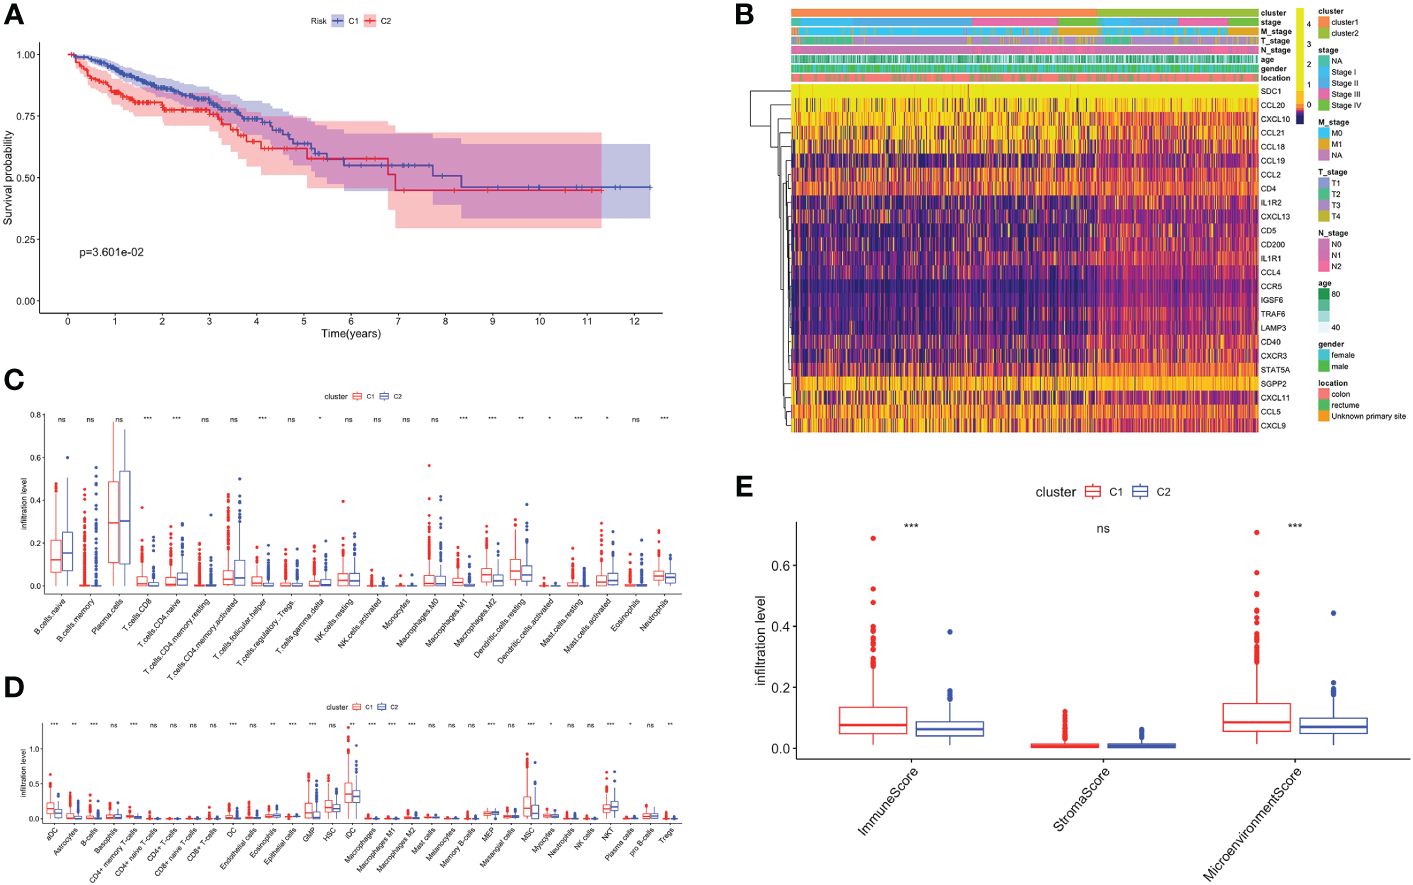
Figure 2 Biological characteristics of two TLS related subclusters. (A) Kaplan-Meier survival analysis of C1 and C2. (B) TRGs expression and clinicopathological characteristics heatmap. Immune cell infiltration patterns by Cibersort (C) and xCell (D). (E) The immune, stromal and microenvironment scores between two clusters. ns, not significance, *p< 0.05, **p< 0.01, ***p< 0.001.
Next, we analyzed the TRGs expression profiles of two subclusters in the TCGA-CRC dataset (Figure 2B). We found C1 had higher expression levels of CCL18, CCL21, CXCL10 and CXCL11. C2 was characterized by the remarkable enrichment in SDC1 and CCL20. In general, TRGs were more highly expressed in C1 than C2. Immune infiltrating cells are a crucial component of TME. We explored the differences in TME infiltration between two subclusters. (Figures 2C, D). B cells, CD8+ T cells, follicular helper T (TFH) cells, activated dendritic cells (DC), neutrophils and granulocyte-macrophage progenitor (GMP) cells were higher in C1, while naive CD4+ T cells and natural killer T (NKT) cells were higher in C2. Both macrophage M1 and macrophage M2 had higher infiltration levels in C1. Besides, we further noticed that C1 correlated positively with higher immune and microenvironment scores, while there was no difference between two subclusters in stroma scores (Figure 2E).
3.3 Biological functional enrichment analysis of TLS molecular subclusters
Volcano map was used to demonstrate DEGs between C1 and C2, with 639 genes upregulated in C1 and 86 in C2 (Supplementary Figure 2A). Firstly, we performed over-representation analysis (ORA) to determine the biological behavior behind these DEGs. The GO enrichment analysis revealed that immune receptor activity enrichment in molecular function (MF); plasma membrane signaling receptor complex and immunological synapse enrichment in cellular component (CC); T cell proliferation and activation enrichment in biological process (BP) (Figure 3A). The KEGG analysis indicated predominantly enrichment in cytokine-cytokine receptor interaction, calcium signaling pathway, and cell adhesion molecules (Figure 3B). GSEA showed that C1 was enriched in immune response, activation, and antigen presentation, including immunoglobulin mediated immune response, Th1 and Th2 cells differentiation, and Toll-like receptor signaling pathway (Figures 3C, D). Metabolic processes and biosynthesis related pathways were enriched in C2, such as glucuronate metabolic process, and biosynthesis of amino acids and steroid hormone (Figures 3E, F). GSVA showed differentially active signaling pathways and immune responses between two clusters (Figure 3G). Taken together, this suggested that TLS-enriched subcluster, C1, may inhibit tumor progression by activating non-specific anti-tumor immune responses. While TLS-depleted subcluster, C2, was for hypermetabolic and immunosuppression state.
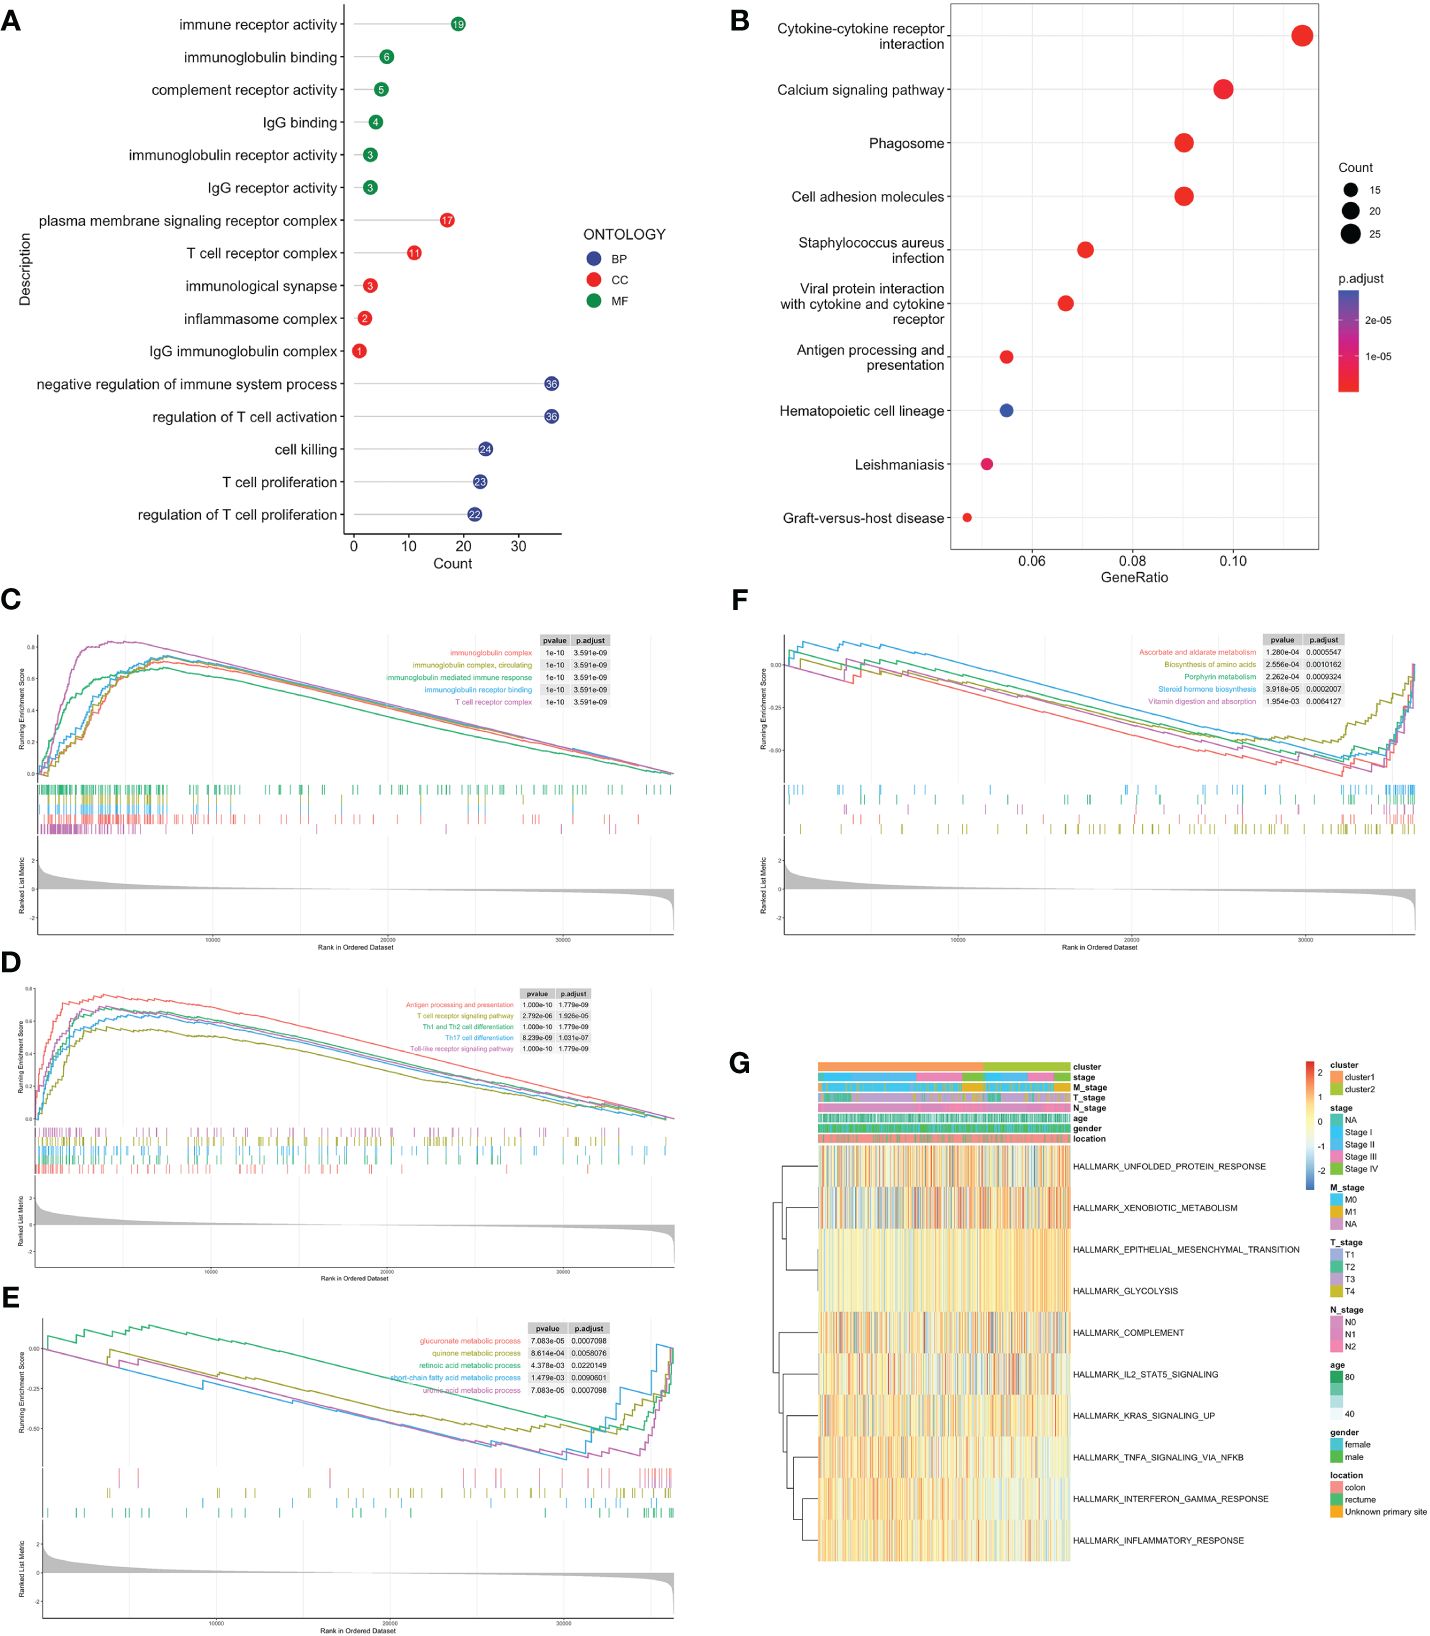
Figure 3 Biological functional enrichment analysis. GO (A) and KEGG (B) enrichment analyses based on DEGs. GSEA of C1 by GO (C), KEGG (D). GSEA of C2 by GO (E), KEGG (F). (G) GSVA of two clusters by Hallmark database.
3.4 Development and verification of the TLS-related risk model
To further analyze and quantify the TLS characteristics, a TLS-related prognostic model was established. TCGA-CRC dataset served as the training set, while GSE38832 and GSE17537 were utilized for the external validation. DEGs between tumor and normal samples were measured with the “DESeq2” (Supplementary Figure 2B). There were 508 intersection genes left (Supplementary Figure 2C, Supplementary Table 2). After univariable Cox regression analysis, we found 43 OS-related DEGs. Ultimately, 14 genes were selected for the risk model: CAVIN2, CCL19/21, CD8A, CXCL5, FHL1, IGHG1, MMP1, MRC1, NEXN, MOTUM, PRRX1, SELL and VSIG4 (Supplementary Figures 2D, E). The model genes displayed a distinct expression pattern between two groups (Supplementary Figure 2F).
Based on the optimum cutoff value, patients were divided into two risk groups. Kaplan-Meier curves indicated lower mortality and better prognosis in the low-risk group (P<0.001, Figures 4A, B). Furthermore, the AUC revealed the 1-, 3-, and 5-year survival rates were all above 0.7, which proved the accuracy of this model was wonderful (Figure 4C). External validation datasets GSE38832 and GSE17537 also demonstrated the model’s excellent prognostic performance (Figures 4D–I).
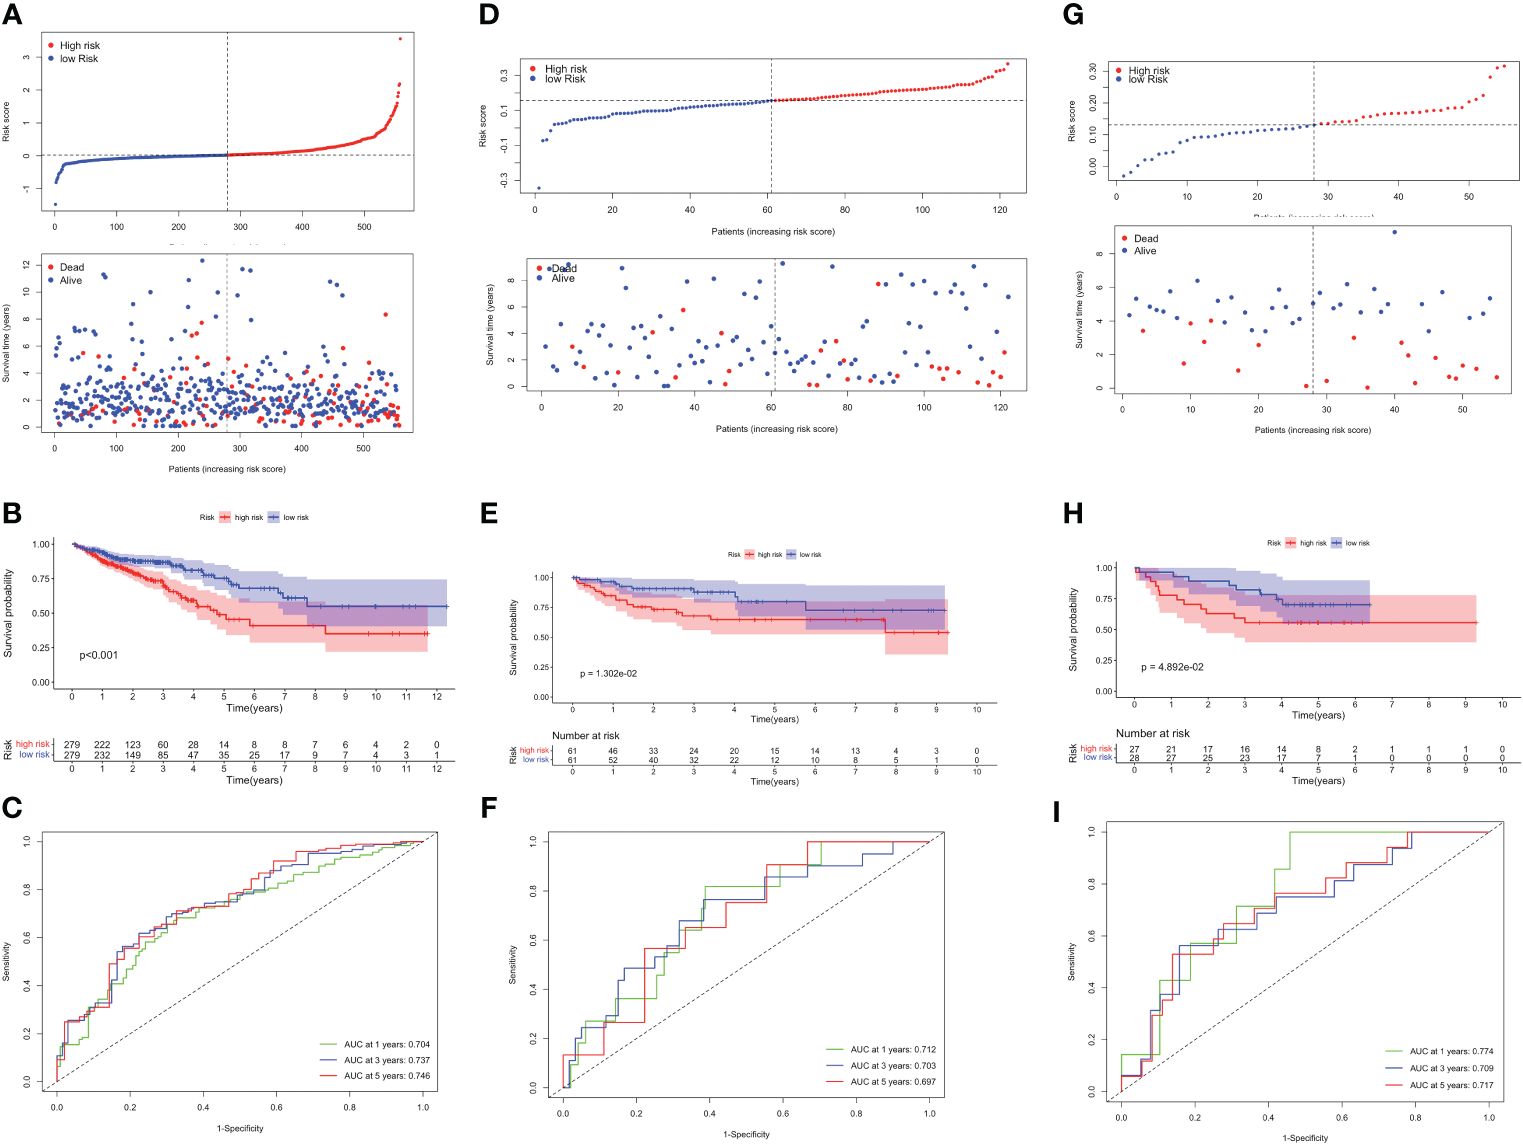
Figure 4 Validation of the TLS-related prognostic model in TCGA-CRC, GSE38832 and GSE17537 datasets. (A) Risk score distribution (up) and survival status (down) between high- and low-risk groups. (B) Kaplan–Meier survival analysis. (C) Time-dependent ROC analysis of risk scores. Risk score distribution and survival status (D), Kaplan–Meier survival analysis (E), and Time-dependent ROC analysis (F) in GSE38832. Risk score distribution and survival status (G), Kaplan–Meier survival analysis (H), and Time-dependent ROC analysis (I) in GSE17537.
3.5 Immune infiltration of TLS-related risk model
Different kinds of immune cell infiltration were estimated using CIBERSORT (Figure 5A). Plasma cells, macrophages and follicular helper T cells were higher in high-risk group. Additionally, we estimated the proportion of each cell in TME (Figure 5B). There were remarkably positive associations between risk score and CD8+ T cells, CD4+ naive T cells, macrophages and activated mast cells (P<0.01, Figure 5C). Further analysis revealed that there were more patients with KRAS mutations and fewer patients with BRAF mutations in the high-risk group (no statistically significant, Figures 5D, E). Next, we estimated the association between immune checkpoint genes and 14 model genes (Figure 5F). We found that the vast majority of model genes were positively correlated with immune related genes, except NOTUM.
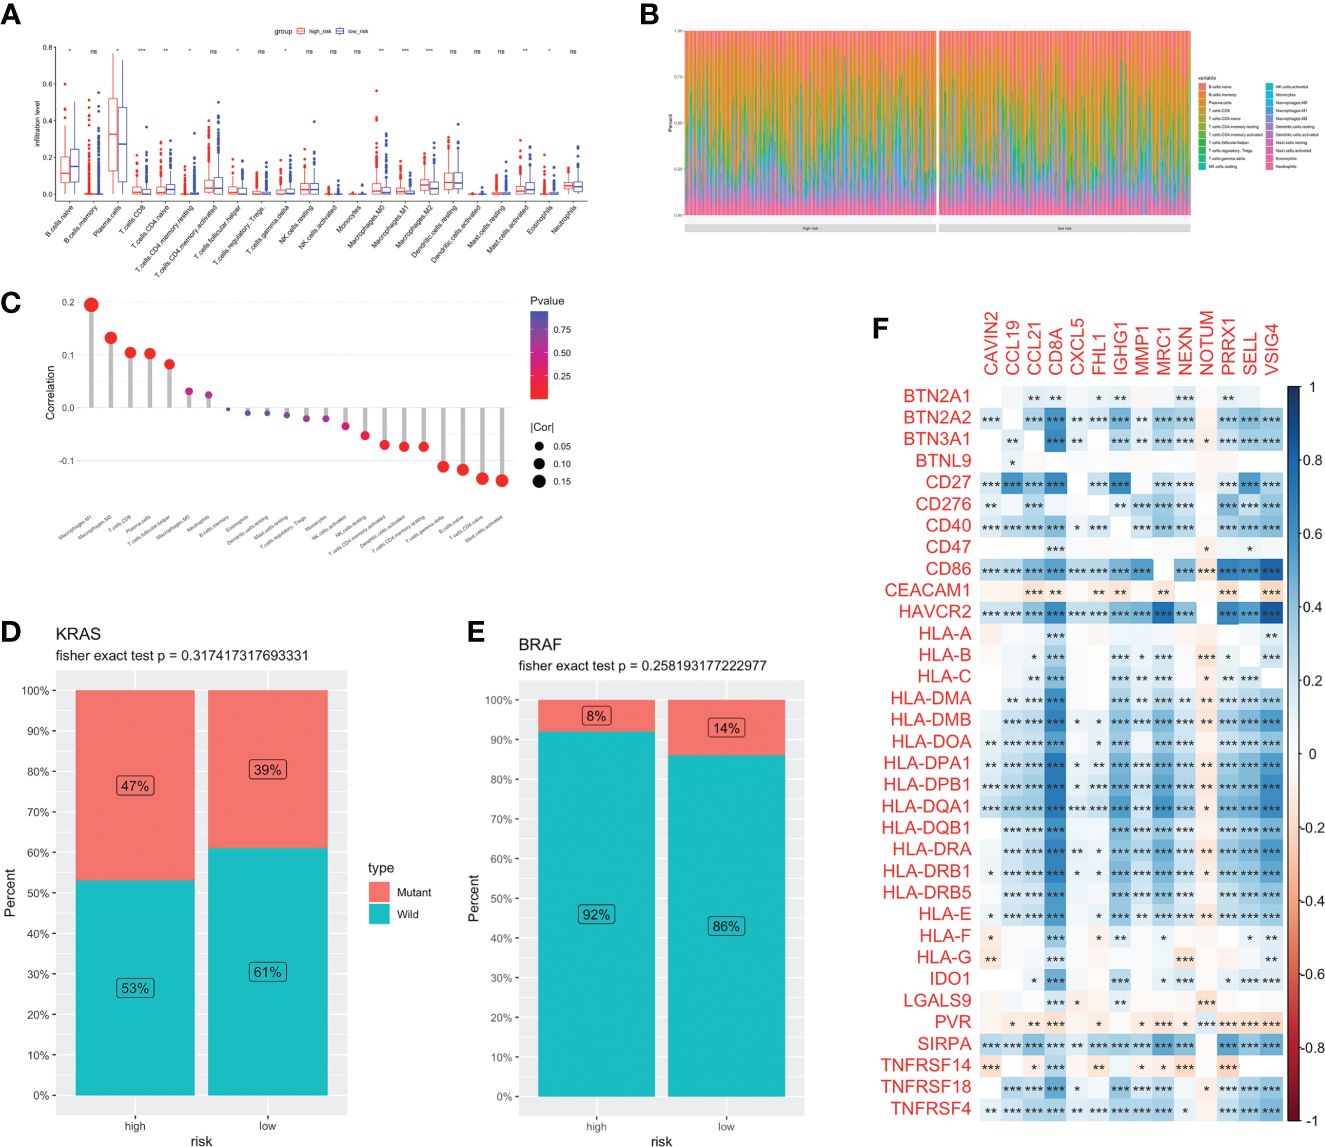
Figure 5 Immune infiltration and TME of low-and high-risk groups. Immune cell infiltration (A) and percentage (B) between two groups. (C) Correlation analysis between risk score and infiltration level. Risk score and CRC molecular features: KRAS (D) and BRAF (E). (F) The correlations between immune genes and model genes. ns, not significance, *p< 0.05, **p< 0.01, ***p< 0.001.
3.6 Predict the efficacy of immunotherapy
Our above findings demonstrated a potential correlation between risk score and immunotherapy response. The low-risk group had higher stroma, immune, and TIME scores (Supplementary Figures 3A–C). TIDE score has been extensively employed to assess the likelihood of immune evasion and resistance to immunotherapy. We discovered the high-risk group had a much higher TIDE score (Supplementary Figure 3D). A higher TIDE score was linked to worse ICB effectiveness as well as shorter OS with ICB therapies. The IMvigor210 dataset, involving patients treated with atezolizumab, was utilized to validate these observations. In IMvigor210, low-risk patients had a greater prognosis and higher disease control rate (p<0.05, Supplementary Figures 3E, F).
3.7 Construction of a comprehensive nomogram to predict prognosis
MSI status was used to be an effective predictor for patients receiving ICB treatment. Typically, patients with high level of MSI were classified as MSI-High, indicating genomic instability resulting from repeated microsatellite expansions or contractions. Conversely, patients with low or no MSI were classified as microsatellite instability-low (MSI-L)/Microsatellite Stability (MSS). We analyzed the relationship between patients with different MSI status and risk score, and found no significant correlation (Figure 6A). Then, we combined the risk score with MSI status for stratified survival analysis (Figure 6B). Investigations indicated that MSI-H and low-risk scores patients had the best prognosis, followed by those with MSI-L and low-risk scores. Univariate and multivariate Cox regression confirmed the risk score as an independent prognostic factor for CRC (HR=3.706, 95%CI=2.552–5.380, Figures 6C, D). Exploiting these Clinicopathological characteristics, a new-type nomogram was constructed to assess the clinical prognostic more accurately (Figure 6E).
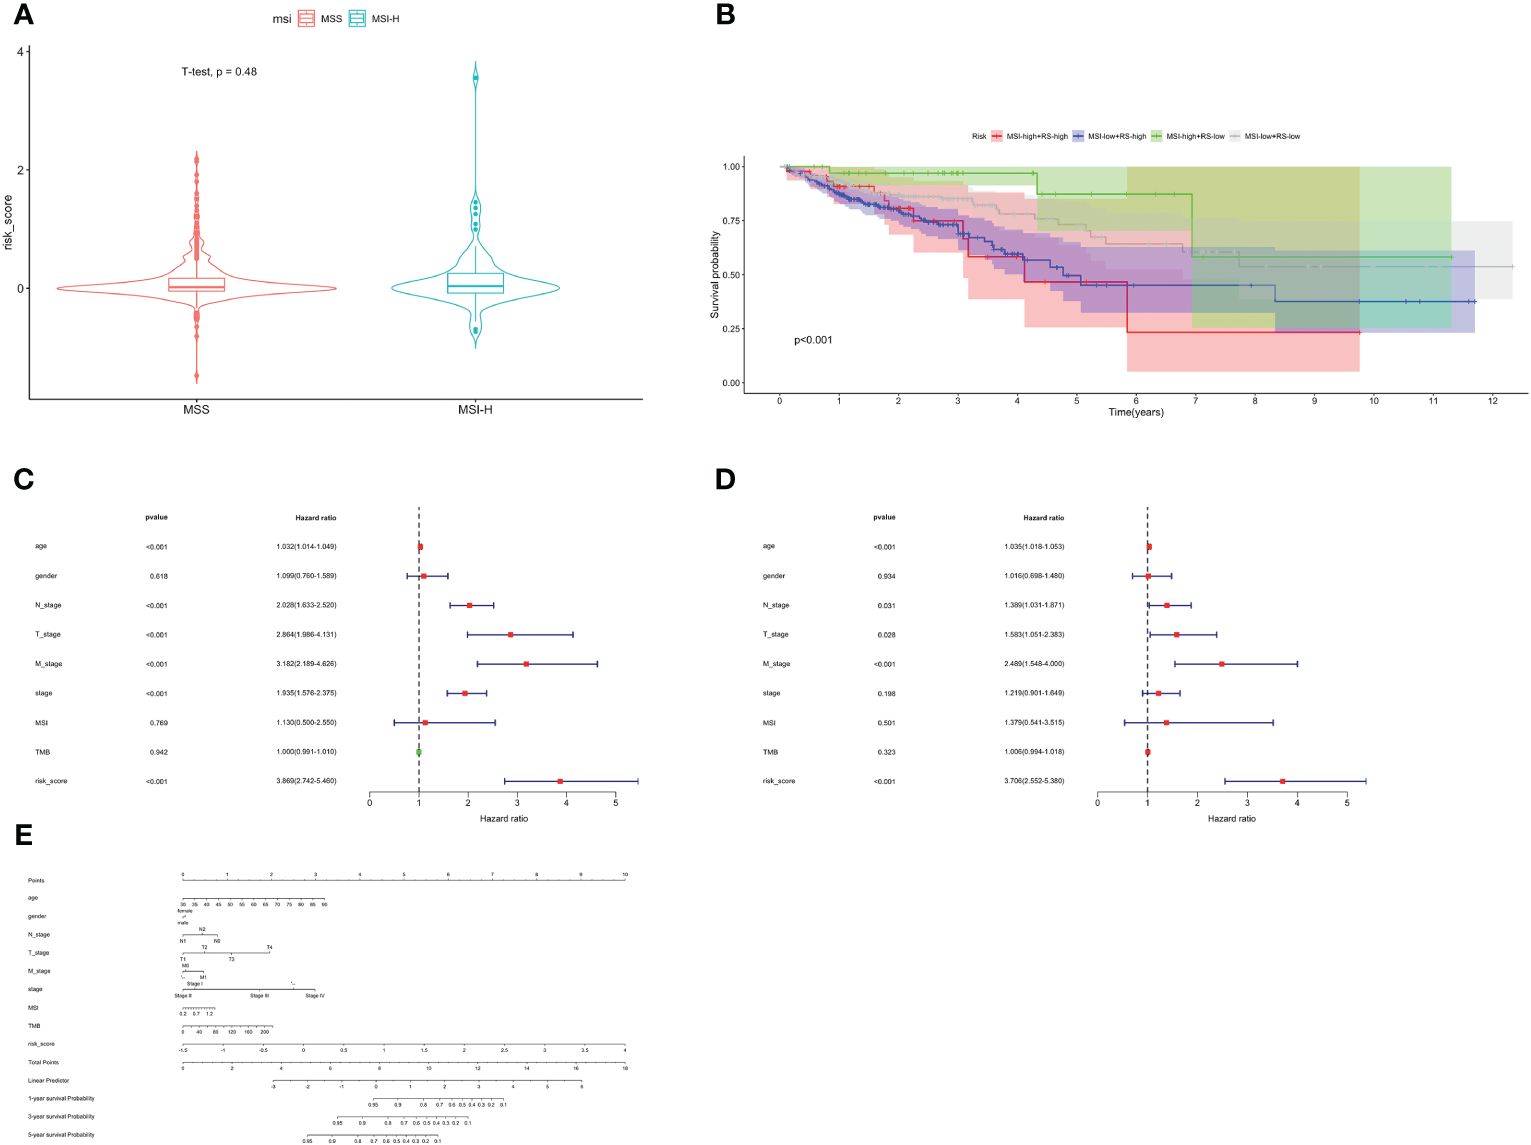
Figure 6 Stratified survival analysis and nomogram. (A) The relationship between risk score with different MSI status. (B) Stratified survival analysis combined with MSI status and risk score. Univariate Cox (C) and multivariate Cox (D) regression analyses. (E) The nomogram containing age, gender, T, N, M, stage, TMB and risk score.
3.8 TLS-related hub gene identification
Random forest analysis was used to determine the feature importance of 14 model genes, among which three genes—VSIG4, SELL and PRRX1—stood out with importance scores exceeding 0.75 (Supplementary Figure 4A). In the high-risk group, the expression level of VSIG4, SELL and PRRX1 were higher (Supplementary Figure 4B). Correlation analysis revealed that the vast majority of model genes were significantly positively correlated with hub genes (Supplementary Figure 4C). We conducted a further study to explore the correlation between the expression of TLS-related hub genes and the infiltration of immune cells in TME (Supplementary Figure 4D). VSIG4, SELL and PRRX1 exhibited a positive relationship with macrophages M2 and neutrophils.
3.9 Explore the potential molecular mechanisms of TLS-related hub genes
GSEA and GSVA were conducted to investigate the molecular mechanisms and immune functions of the three hub genes. Results indicated that VSIG4 was positively correlated with signaling pathways such as NF-kappa B signaling pathways, PI3K-AKT signaling pathways, and cytokine-cytokine receptor interaction (Figures 7A, B). High expression of SELL primarily enriched in the intestinal immune network for IGA production, oxidative phosphorylation, arginine and proline metabolism, Fc epsilon signaling pathway, and others (Figures 7C, D). GSEA of PRRX1 subsequently uncovered that PRRX1 was significantly linked to epithelial-mesenchymal transition (ECM) -receptor interaction, proteasome and TGF-beta signaling pathway (Figure 7E). High expression of PRRX1 was mainly enriched in riboflavin metabolism, regulation of actin cytoskeleton, and others (Figure 7F). The low expression of PRRX1 was enriched in pyruvate metabolism, purine metabolism, peroxisome, etc. In addition, PRRX1 may serve as a prominent regulatory factor in tumorigenesis and progression.
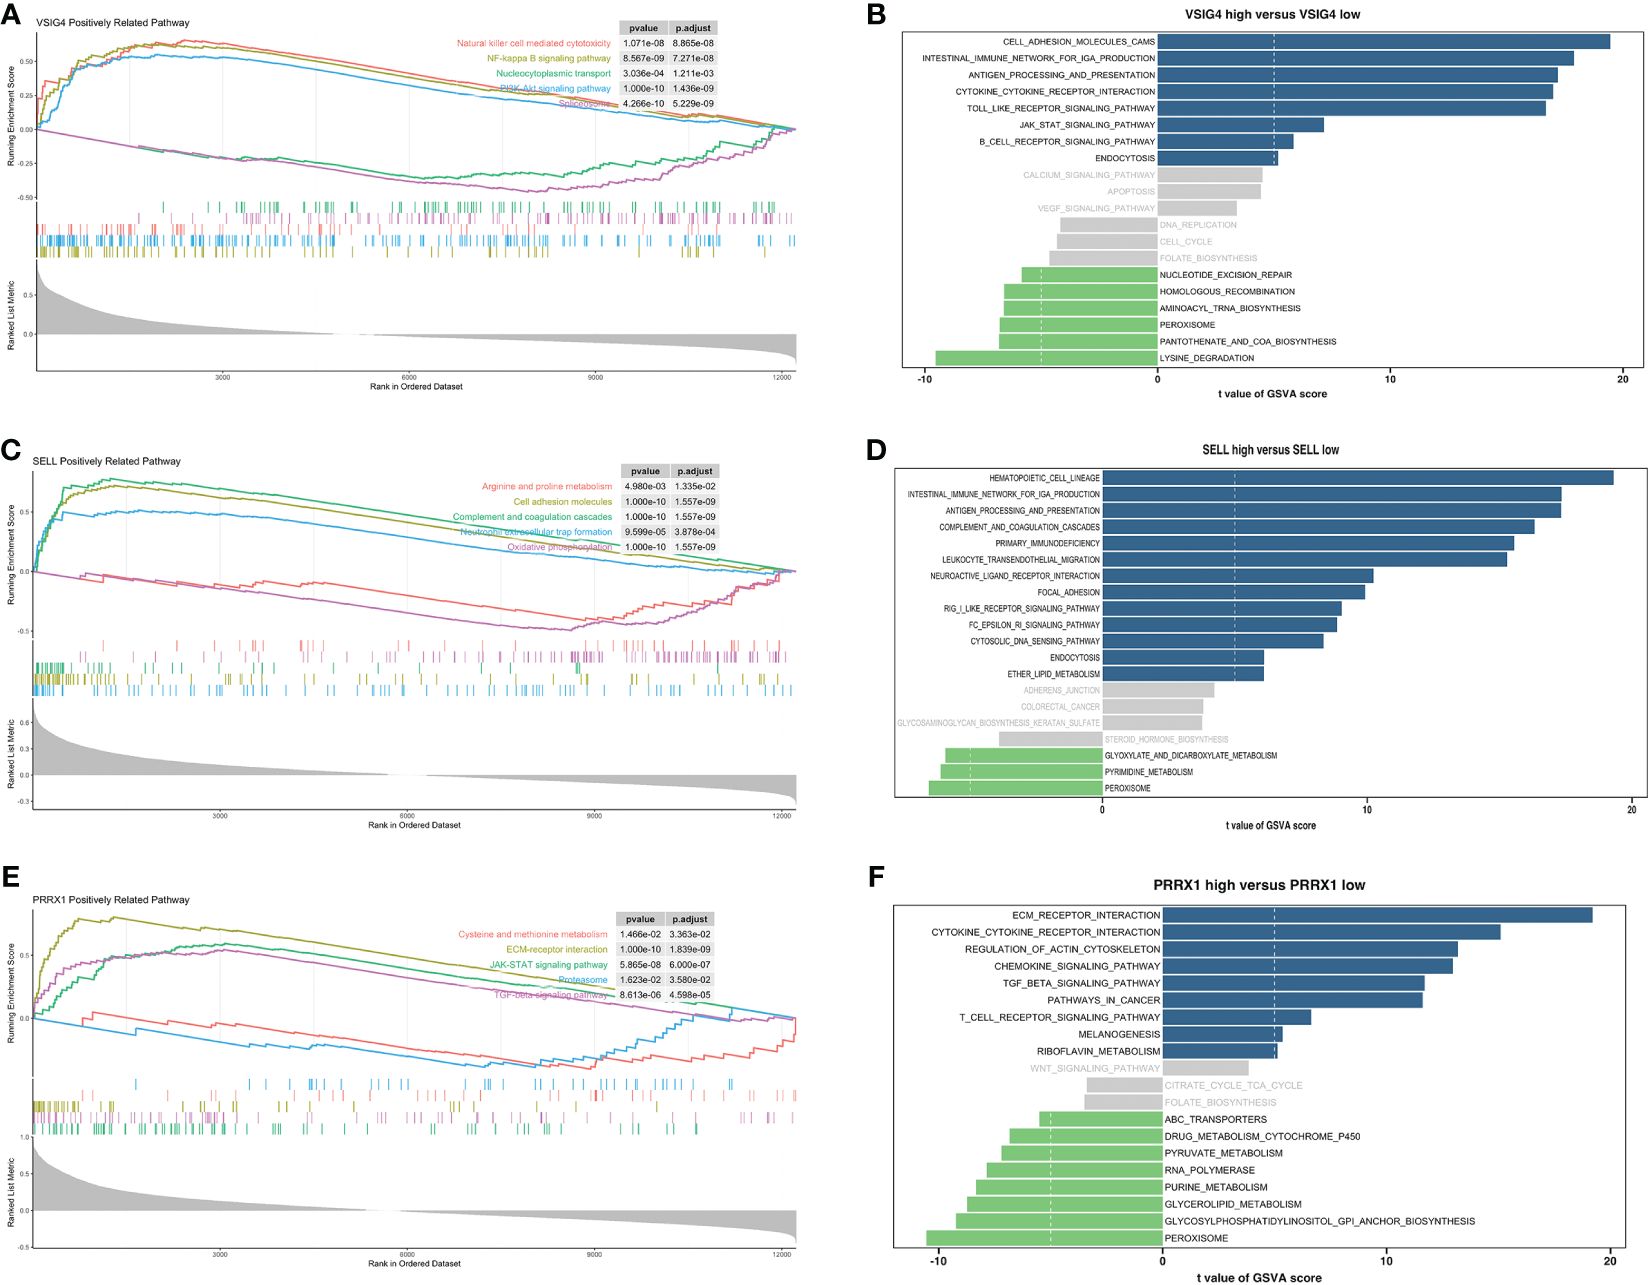
Figure 7 Enrichment analyses of VSIG4, SELL and PRRX1. (A) GSEA of VSIG4. (B) GSVA of VSIG4. (C) GSEA of SELL. (D) GSVA of SELL. (E) GSEA of PRRX1. (F) GSVA of PRRX1.
3.10 Identification of a hub gene related ceRNA network
Increasing evidence has shown that the mutual regulatory patterns between mRNA, lncRNA, miRNA, and downstream target genes are intimately related to tumors. Our study exploited the Human MicroRNA Disease Database (HMDD) and miRNA Walkthrough (miRWalk) databases to identify the miRNA and lncRNA associated with CRC. Excluding interactions unrelated to disease, only two mRNA (SELL, PRRX1) and eight miRNA were retained (Figure 8A). Secondly, those mRNA-miRNA interactions were validated in the ENCORI database, hsa-miR-485–5p and hsa-miR-20a-5p regulated PRRX1 were discovered. Utilizing Cytoscape, we constructed a ceRNA network, including 1 mRNA, 2 miRNA and 127 lncRNA (56 for hsa-miR-20a-5p, 71 for hsa-miR-485–5p) interaction pairs (Figure 8B).
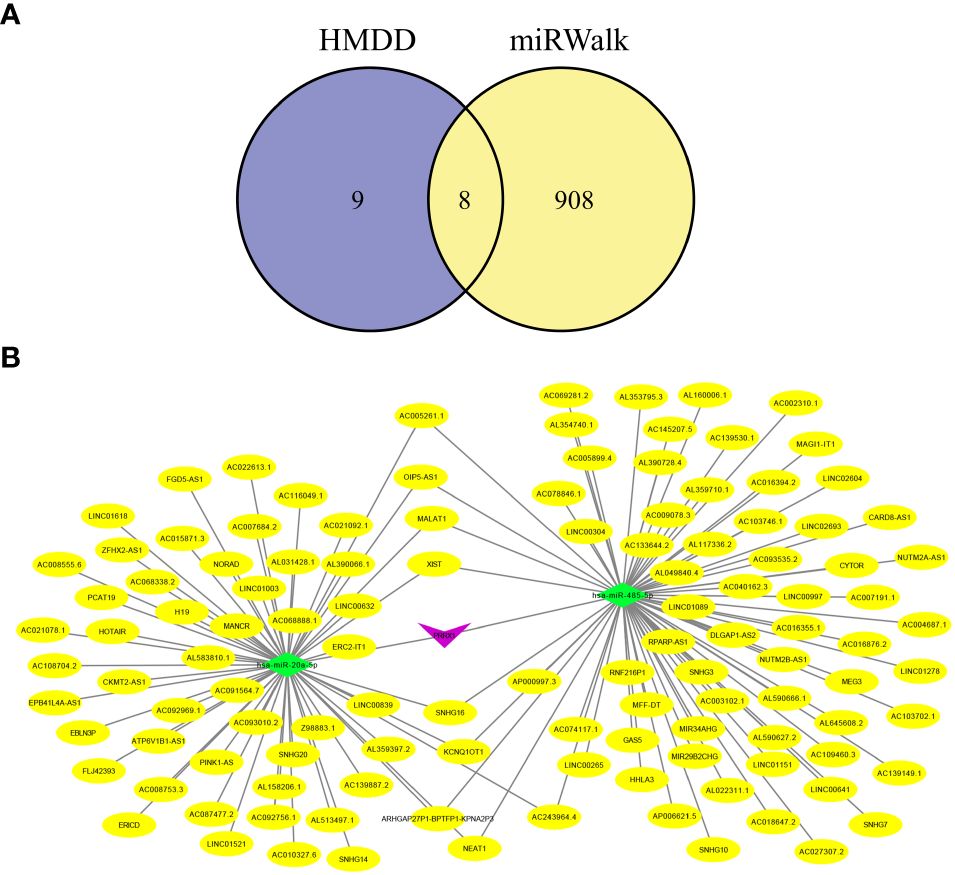
Figure 8 Hub genes-related ceRNA network analysis. (A) Intersection miRNAs of HMDB and miRWalk databases. (B) A hub genes-related ceRNA network of mRNA (PRRX1)-miRNA (hsa-miR-485–5p, hsa-miR-20a-5p)-lncRNA.
3.11 Experimental validation
Using IHC to assess the PRRX1 expression in the TLS+/- groups. Firstly, we observed TLS images through hematoxylin-eosin (H&E) and mIF (Figure 9A). The lymphocyte aggregates containing CD3+T cells, CD20+B cells, and CD21+FDCs that form corresponding regions are considered secondary follicle-like TLS, also known as mature TLS. To further validate the expression of PRRX1, we performed IHC on TLS+/- CRC tissues (Figures 9B, C). PRRX1 was significantly higher in the TLS- group (Figure 9D). Through these above findings, we speculate that PRRX1 may be a negative regulator of TLS and play a crucial role in tumor metastasis and immunocompetence.
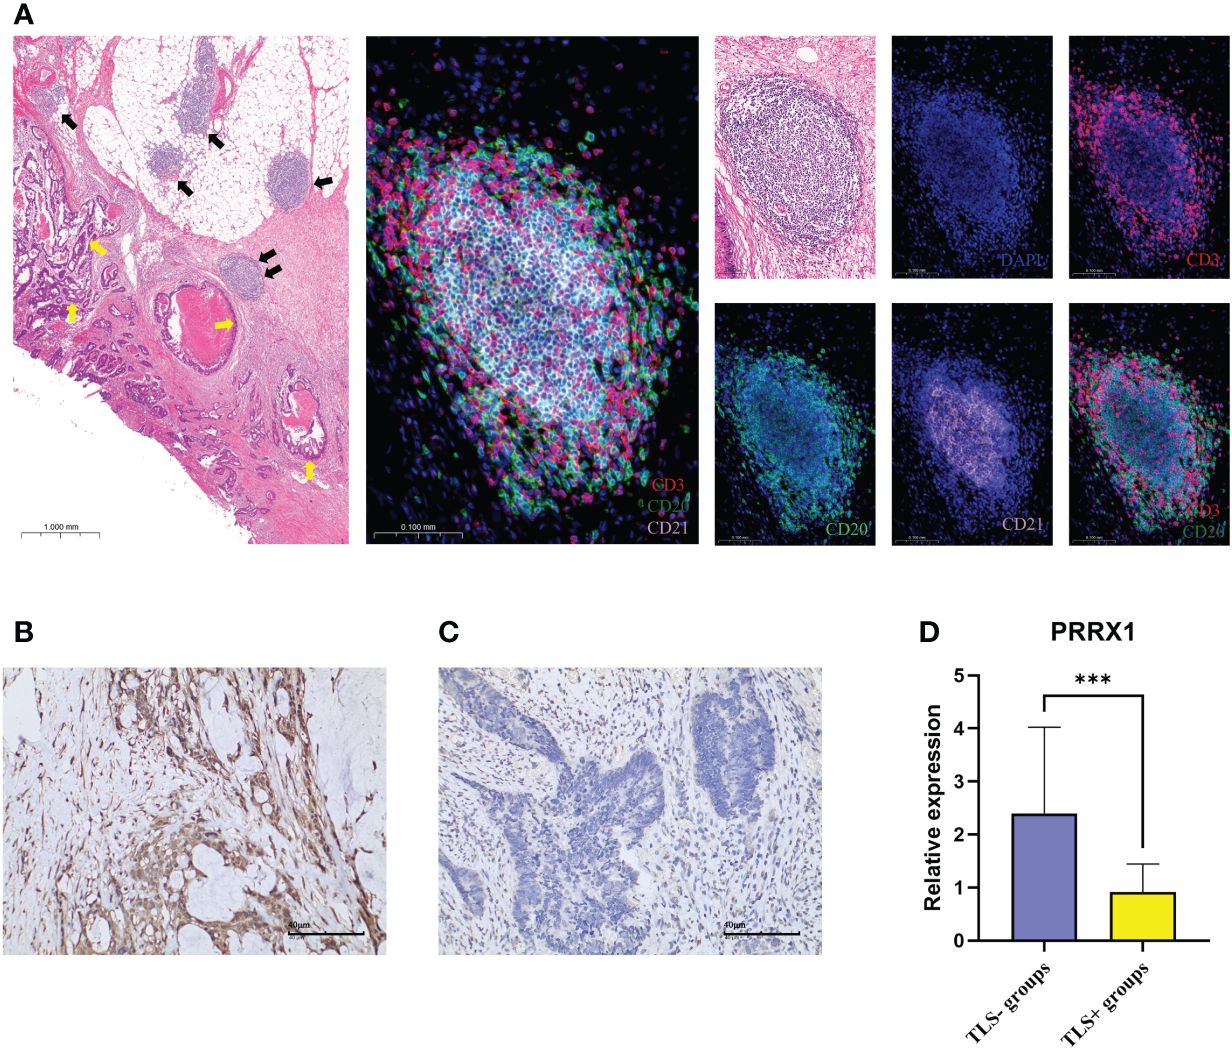
Figure 9 mIF and IHC characterized TLS and PRRX1 expression in CRC. (A) Representative images of secondary follicle-like TLS. The yellow arrows in the left image represented tumor tissue, the black arrows represented TLS. The TLS pointed by the two black arrows indicated the enlarged TLS in the subsequent image. The images contained H&E staining, mIF staining, and single IF under each marker (DAPI, CD3, CD20, CD21). IHC images (×200) of PRRX1 expression in the TLS- group (B) and TLS+ group (C). (D) Differences in the expression of PRRX1 between TLS+/- groups. ***p< 0.001.
4 Discussion
With the continuous development of anti-tumor therapy, immunotherapy has gradually become a common treatment method in clinical practice (26, 27). However, effective biomarkers to identify potential beneficiaries remain limited. PD-L1 and tumor mutation burden (TMB) are considered to be insufficient. Some patients receiving ICB treatments do not derive benefit, mainly due to the heterogeneity of TME and the complexity of immune mechanisms (28). TLS, as a particular component of TME, has been proven to independently predict the response to ICB, regardless of the PD-L1 expression and MSI status (15, 17, 29). In this research, we conducted a detailed analysis of the variations in immune infiltration and potential mechanisms caused by TLS, and developed a novel model for evaluating the prognosis and the effectiveness of immunotherapy in CRC.
Firstly, we integrated a large number of reviews and articles to recruit TRGs. TRGs including various TLS signatures relevant to CRC, melanoma, breast cancer, gastric cancer, ovarian cancer, soft tissue sarcoma, and others (13, 30–37). We initially investigated the expression and mutation patterns of TRGs in CRC. IL1R1 and IL1R2 had the highest mutation frequencies, CD40 and IGSF6 had the highest CNV amplification mutation frequencies. CD40 is a member of TNF receptor superfamily. The high mutation rate of CD40 is related to its structural changes and TRAF (TNF-α Receptor Associated Factor)-binding domain exposure induced by a residue mutation of its ligand CD40L. CD40-CD40L interaction promotes GC formation and maintenance, and Th1 (T helper 1) response conversion (38).
Unsupervised consensus clustering, as one of the methods of consensus clustering, can be used to distinguish various subclusters. According to TRGs, 2 TLS related subclusters (TLS-enriched/TLS-depleted) were identified. Survival analysis revealed that C1 had a more favorable prognosis. We further analyzed the immune infiltration patterns between two clusters. The abundance of B cells, CD8+ T cells, TFH cells, neutrophils and DC were higher in C1. Studies by Qin F et al. indicated that anti-TGF-β facilitates neutrophils recruitment and polarizes neutrophils towards an anti-tumor phenotype (N1) in CRC (39). Meanwhile, tumor infiltrating neutrophils can exert the role of antigen-presenting cells and heighten T cell proliferation (40). TFH cells are usually accompanied by high CXCR5, CD40, and CXCL13 expression. CXCL13/CXCR5 signaling axis is a critical signaling pathway for TLS formation (41). Research has shown that TFH controls the proliferation of B cells in GC (42). Patients with a substantial fraction of TFH cells usually have a more favorable clinical outcome (33). The GC with CD20+ B cells is considered a mature feature of TLS. B cells has the ability to generate antibodies and also enhance cytotoxic CD8+ T cell response by secreting various cytokines in TME, such as interleukin-2 (IL-2) and interferon-γ (IFN-γ) (43, 44). Various studies demonstrated a strong correlation between B cells, especially those in TLS, and the efficacy of immunotherapy (45, 46). Inducing the formation and maturation of TLS by enhancing B cell expression may improve the treatment response rates and OS in CRC. Immune and environment scores also indicate that C1 has an inflammatory immune phenotype and stands in an immune-activated state. Thereby, we infer that C1 is the TLS-enriched cluster, while C2 is the TLS-depleted cluster.
In addition, a prognostic risk model related to TLS was developed. The AUC values for OS at 1–3-5 years were 0.704, 0.737, and 0.746, as well. The external validation datasets GSE38832 and GSE17537 also demonstrated their excellent prognostic ability. Next, we further analyzed the immune infiltration landscapes, molecular mutation features and immunotherapy efficacy of the two risk groups. Based on risk score, TMB and other clinical features, we constructed a new-type nomogram to comprehensively evaluate the prognosis.
According to the random forest analysis, we selected TLS-related hub genes in the model: VSIG4, SELL and PRRX1. VSIG4, fully defined as V-set and immunoglobulin domain-containing 4, is a complement receptor of the B7 immunoglobulin superfamily. VSIG4 is mainly expressed in macrophages. VSIG4-expressing tumor-associated macrophages (TAMs) can inhibit tumor-specific CD8+ T cell proliferation and cytokines production, which function as a suppressor of anti-tumor immune response (47, 48). Recent studies indicates that VSIG4 could activate the PI3K-AKT-STAT3 pathway, upregulating PDK2 and thereby inhibiting mitochondrial pyruvate metabolism and mitochondria ROS secretion (49). The relationship between VSIG4 and poor prognosis has been confirmed in lung cancer (50), ovarian cancer (51), and glioma (52). SELL, an adhesion molecule, regulates the transport of immune cells to lymphocyte aggregates in TME (53). Tumor cells may utilize SELL to facilitate their detachment from the primary tumor, thereby promoting tumor metastasis and dissemination. Research by Liao et al. has inferred that SELL is involved in regulating the generation of PNAd and MAdCAM-1+ HEVs in TLS (54). These studies indicate that SELL may have a pivotal function in the initial stage of TLS formation. Research on this aspect is still lacking currently.
PRRX1, named as paired related homeobox 1 and PRX1, works as a primary transcription factor of cancer-associated fibroblasts (CAFs) (55). Prior research has established a robust link between elevated PRRX1 expression and the progression and recurrence of CRC, breast cancer, and esophageal cancer, leading to poor prognosis and drug resistance (55–57). Zhong et al. discovered that PRRX1 promotes tumor cells to migrate and invade by targeting the IL-6/JAK3/STAT3 axis (58). Silencing of PRRX1 may indirectly influence the proliferation and differentiation of TLS in CRC by inhibiting this axis (59). We checked the expression of PRRX1 in the TLS+/- groups through IHC in this study. In summary, PRRX1 may function as a therapeutic target for CRC treatment and be a negative immunomodulatory regulator of TLS.
Our research provided an innovative perspective for exploring the crosstalk between TLS and CRC TME. Nevertheless, our research still has some weaknesses. The data bias caused by retrospective studies is inevitable. TCGA and GEO cannot provide MRI imaging and hematological data. Furthermore, applying spatial transcriptomics to analyze TLS in situ may bring new insights.
5 Conclusion
Based on TRGs and DEGs, we discriminated the TLS related subclusters, constructed a prognostic risk model, and explored the potential mechanisms of hub genes to regulate TLS and CRC progression. Low-risk group exhibited a more favorable clinical outcome, richer immune infiltration, and better immunotherapy efficacy. Moreover, a preliminary exploration of the mechanisms of hub genes could help identify potential therapeutic targets.
Data availability statement
The original contributions presented in the study are included in the article/Supplementary Material. Further inquiries can be directed to the corresponding author.
Ethics statement
The studies involving human participants were reviewed by and approved by Institutional Ethics Committee of QuXian People’s Hospital. The participants provided their written informed consent to participate in this study. The studies were conducted in accordance with the local legislation and institutional requirements. The participants provided their written informed consent to participate in this study.
Author contributions
ZX: Conceptualization, Data curation, Funding acquisition, Writing – original draft, Writing – review & editing. QW: Data curation, Investigation, Resources, Writing – original draft. YYZ: Conceptualization, Funding acquisition, Software, Supervision, Validation, Writing – original draft. XL: Conceptualization, Methodology, Project administration, Resources, Validation, Writing – original draft. MW: Conceptualization, Methodology, Project administration, Resources, Software, Writing – review & editing. YHZ: Conceptualization, Investigation, Methodology, Resources, Visualization, Writing – original draft. YP: Investigation, Methodology, Project administration, Writing – review & editing. KL: Data curation, Methodology, Software, Supervision, Writing – review & editing. MY: Investigation, Supervision, Validation, Writing – original draft. LL: Conceptualization, Supervision, Validation, Writing – review & editing. CW: Project administration, Software, Validation, Writing – review & editing. WW: Conceptualization, Funding acquisition, Investigation, Resources, Software, Supervision, Validation, Visualization, Writing – original draft, Writing – review & editing.
Funding
The author(s) declare financial support was received for the research, authorship, and/or publication of this article. This work was supported by the Key Projects of Sichuan Natural Science Foundation (2022NSFSC0051), the Clinical Scientist Program of Sichuan Cancer Hospital (YB2022003), and the Chengdu Technology Innovation R&D Project (2021YF0501659SN).
Conflict of interest
The authors declare that the research was conducted in the absence of any commercial or financial relationships that could be construed as a potential conflict of interest.
Publisher’s note
All claims expressed in this article are solely those of the authors and do not necessarily represent those of their affiliated organizations, or those of the publisher, the editors and the reviewers. Any product that may be evaluated in this article, or claim that may be made by its manufacturer, is not guaranteed or endorsed by the publisher.
Supplementary material
The Supplementary Material for this article can be found online at: https://www.frontiersin.org/articles/10.3389/fonc.2024.1383096/full#supplementary-material
References
1. Bien J, Lin A. A review of the diagnosis and treatment of metastatic colorectal cancer. Jama-J Am Med Assoc. (2021) 325:2404–5. doi: 10.1001/jama.2021.6021
2. Sung H, Ferlay J, Siegel RL, Laversanne M, Soerjomataram I, Jemal A, et al. Global cancer statistics 2020: globocan estimates of incidence and mortality worldwide for 36 cancers in 185 countries. Ca-a Cancer J Clin. (2021) 71:209–49. doi: 10.3322/caac.21660
3. Le DT, Kim TW, Van Cutsem E, Geva R, Jager D, Hara H, et al. Phase ii open-label study of pembrolizumab in treatment-refractory, microsatellite instability-high/mismatch repair-deficient metastatic colorectal cancer: keynote-164. J Clin Oncol. (2020) 38:11–9. doi: 10.1200/jco.19.02107
4. Diaz LA, Shiu KK, Kim TW, Jensen BV, Jensen LH, Punt C, et al. Pembrolizumab versus chemotherapy for microsatellite instability-high or mismatch repair-deficient metastatic colorectal cancer (Keynote-177): final analysis of a randomized, open-label, phase 3 study. Lancet Oncol. (2022) 23:659–70. doi: 10.1016/s1470–2045(22)00197–8
5. Lenz HJ, Van Cutsem E, Limon ML, Wong KYM, Hendlisz A, Aglietta M, et al. First-line nivolumab plus low-dose ipilimumab for microsatellite instability-high/mismatch repair-deficient metastatic colorectal cancer: the phase ii checkmate 142 study. J Clin Oncol. (2022) 40:161–70. doi: 10.1200/jco.21.01015
6. Galon J, Costes A, Sanchez-Cabo F, Kirilovsky A, Mlecnik B, Lagorce-Pagès C, et al. Type, density, and location of immune cells within human colorectal tumors predict clinical outcome. Science. (2006) 313:1960–4. doi: 10.1126/science.1129139
7. van de Pavert SA, Mebius RE. New insights into the development of lymphoid tissues. Nat Rev Immunol. (2010) 10:664–74. doi: 10.1038/nri2832
8. Meier D, Bornmann C, Chappaz S, Schmutz S, Otten LA, Ceredig R, et al. Ectopic lymphoid-organ development occurs through interleukin 7-mediated enhanced survival of lymphoid-tissue-inducer cells. Immunity. (2007) 26:643–54. doi: 10.1016/j.immuni.2007.04.009
9. Colbeck EJ, Ager A, Gallimore A, Jones GW. Tertiary lymphoid structures in cancer: drivers of antitumor immunity, immunosuppression, or bystander sentinels in disease? Front Immunol. (2017) 8:1830. doi: 10.3389/fimmu.2017.01830
10. Drayton DL, Liao S, Mounzer RH, Ruddle NH. Lymphoid organ development: from ontogeny to neogenesis. Nat Immunol. (2006) 7:344–53. doi: 10.1038/ni1330
11. Di Caro G, Bergomas F, Grizzi F, Doni A, Bianchi P, Malesci A, et al. Occurrence of tertiary lymphoid tissue is associated with T-cell infiltration and predicts better prognosis in early-stage colorectal cancers. Clin Cancer Res. (2014) 20:2147–58. doi: 10.1158/1078–0432.Ccr-13–2590
12. Bergomas F, Grizzi F, Doni A, Pesce S, Laghi L, Allavena P, et al. Tertiary intratumor lymphoid tissue in colo-rectal cancer. Cancers. (2011) 4:1–10. doi: 10.3390/cancers4010001
13. Sautes-Fridman C, Petitprez F, Calderaro J, Fridman WH. Tertiary lymphoid structures in the era of cancer immunotherapy. Nat Rev Cancer. (2019) 19:307–25. doi: 10.1038/s41568–019-0144–6
14. Germain C, Gnjatic S, Tamzalit F, Knockaert S, Remark R, Goc J, et al. Presence of B cells in tertiary lymphoid structures is associated with a protective immunity in patients with lung cancer. Am J Respir Crit Care Med. (2014) 189:832–44. doi: 10.1164/rccm.201309-1611OC
15. Cabrita R, Lauss M, Sanna A, Donia M, Larsen MS, Mitra S, et al. Tertiary lymphoid structures improve immunotherapy and survival in melanoma. Nature. (2020) 577:561. doi: 10.1038/s41586–019-1914–8
16. Martinet L, Garrido I, Filleron T, Le Guellec S, Bellard E, Fournie JJ, et al. Human solid tumors contain high endothelial venules: association with T- and B-lymphocyte infiltration and favorable prognosis in breast cancer. Cancer Res. (2011) 71:5678–87. doi: 10.1158/0008–5472.Can-11–0431
17. Helmink BA, Reddy SM, Gao JJ, Zhang SJ, Basar R, Thakur R, et al. B cells and tertiary lymphoid structures promote immunotherapy response. Nature. (2020) 577:549–55. doi: 10.1038/s41586–019-1922–8
18. Necchi A, Joseph RW, Loriot Y, Hoffman-Censits J, Perez-Gracia JL, Petrylak DP, et al. Atezolizumab in platinum-treated locally advanced or metastatic urothelial carcinoma: post-progression outcomes from the phase ii imvigor210 study. Ann Oncol. (2017) 28:3044–50. doi: 10.1093/annonc/mdx518
19. Mayakonda A, Lin DC, Assenov Y, Plass C, Koeffler HP. Maftools: efficient and comprehensive analysis of somatic variants in cancer. Genome Res. (2018) 28:1747–56. doi: 10.1101/gr.239244.118
20. Wilkerson MD, Hayes DN. Consensusclusterplus: A class discovery tool with confidence assessments and item tracking. Bioinformatics. (2010) 26:1572–3. doi: 10.1093/bioinformatics/btq170
21. Newman AM, Liu CL, Green MR, Gentles AJ, Feng WG, Xu Y, et al. Robust enumeration of cell subsets from tissue expression profiles. Nat Meth. (2015) 12:453. doi: 10.1038/nmeth.3337
22. Aran D, Hu ZC, Butte AJ. Xcell: digitally portraying the tissue cellular heterogeneity landscape. Genome Biol. (2017) 18(1):220. doi: 10.1186/s13059–017-1349–1
23. Yu GC, Wang LG, Han YY, He QY. Clusterprofiler: an R package for comparing biological themes among gene clusters. Omics-a J Integr Biol. (2012) 16:284–7. doi: 10.1089/omi.2011.0118
24. Hänzelmann S, Castelo R, Guinney J. Gsva: gene set variation analysis for microarray and rna-seq data. BMC Bioinf. (2013) 14:7. doi: 10.1186/1471–2105-14–7
25. Posch F, Silina K, Leibl S, Mundlein A, Moch H, Siebenhuner A, et al. Maturation of tertiary lymphoid structures and recurrence of stage II and III colorectal cancer. Oncoimmunology. (2018) 7(2):e1378844. doi: 10.1080/2162402x.2017.1378844
26. Galluzzi L, Humeau J, Buqué A, Zitvogel L, Kroemer G. Immunostimulation with chemotherapy in the era of immune checkpoint inhibitors. Nat Rev Clin Oncol. (2020) 17:725–41. doi: 10.1038/s41571-020-0413-z
27. Vaddepally RK, Kharel P, Pandey R, Garje R, Chandra AB. Review of indications of fda-approved immune checkpoint inhibitors per nccn guidelines with the level of evidence. Cancers. (2020) 12:738. doi: 10.3390/cancers12030738
28. O’Donnell JS, Teng MWL, Smyth MJ. Cancer immunoediting and resistance to T cell-based immunotherapy. Nat Rev Clin Oncol. (2019) 16:151–67. doi: 10.1038/s41571–018-0142–8
29. Vanhersecke L, Brunet M, Guégan JP, Rey C, Bougouin A, Cousin S, et al. Mature tertiary lymphoid structures predict immune checkpoint inhibitor efficacy in solid tumors independently of pd-L1 expression. Nat Cancer. (2021) 2:794–802. doi: 10.1038/s43018–021-00232–6
30. Coppola D, Nebozhyn M, Khalil F, Dai HY, Yeatman T, Loboda A, et al. Unique ectopic lymph node-like structures present in human primary colorectal carcinoma are identified by immune gene array profiling. Am J Pathol. (2011) 179:37–45. doi: 10.1016/j.ajpath.2011.03.007
31. Messina JL, Fenstermacher DA, Eschrich S, Qu XT, Berglund AE, Lloyd MC, et al. 12-chemokine gene signature identifies lymph node-like structures in melanoma: potential for patient selection for immunotherapy? Sci Rep. (2012) 2:765. doi: 10.1038/srep00765
32. Finkin S, Yuan DT, Stein I, Taniguchi K, Weber A, Unger K, et al. Ectopic lymphoid structures function as microniches for tumor progenitor cells in hepatocellular carcinoma. Nat Immunol. (2015) 16:1235–44. doi: 10.1038/ni.3290
33. Gu-Trantien C, Loi S, Garaud S, Equeter C, Libin M, de Wind A, et al. Cd4+ Follicular helper T cell infiltration predicts breast cancer survival. J Clin Invest. (2013) 123:2873–92. doi: 10.1172/jci67428
34. Hennequin A, Derangere V, Boidot R, Apetoh L, Vincent J, Orry D, et al. Tumor infiltration by tbet plus effector T cells and cd20+B cells is associated with survival in gastric cancer patients. Oncoimmunology. (2016) 5:e1054598. doi: 10.1080/2162402x.2015.1054598
35. Kroeger DR, Milne K, Nelson BH. Tumor-infiltrating plasma cells are associated with tertiary lymphoid structures, cytolytic T-cell responses, and superior prognosis in ovarian cancer. Clin Cancer Res. (2016) 22:3005–15. doi: 10.1158/1078–0432.Ccr-15–2762
36. Hou Y, Qiao SJ, Li M, Han X, Wei X, Pang YX, et al. The gene signature of tertiary lymphoid structures within ovarian cancer predicts the prognosis and immunotherapy benefit. Front Genet. (2023) 13:1090640. doi: 10.3389/fgene.2022.1090640
37. Becht E, de Reynies A, Giraldo NA, Pilati C, Buttard B, Lacroix L, et al. Immune and stromal classification of colorectal cancer is associated with molecular subtypes and relevant for precision immunotherapy. Clin Cancer Res. (2016) 22:4057–66. doi: 10.1158/1078–0432.Ccr-15–2879
38. Sarode AY, Jha MK, Zutshi S, Ghosh SK, Mahor H, Sarma U, et al. Residue-specific message encoding in cd40-ligand. iScience. (2020) 23:101441. doi: 10.1016/j.isci.2020.101441
39. Qin F, Liu X, Chen J, Huang S, Wei W, Zou Y, et al. Anti-tgf-β Attenuates tumor growth via polarization of tumor associated neutrophils towards an anti-tumor phenotype in colorectal cancer. J Cancer. (2020) 11:2580–92. doi: 10.7150/jca.38179
40. Awasthi D, Sarode A. Neutrophils at the crossroads: unraveling the multifaceted role in the tumor microenvironment. Int J Mol Sci. (2024) 25(5):2929. doi: 10.3390/ijms25052929
41. Tian C, Li C, Zeng YL, Liang JY, Yang QF, Gu FF, et al. Identification of cxcl13/cxcr5 axis’s crucial and complex effect in human lung adenocarcinoma. Int Immunopharmacol. (2021) 94:107416. doi: 10.1016/j.intimp.2021.107416
42. Noël G, Fontsa ML, Garaud S, De Silva P, De Wind A, Van den Eynden GG, et al. Functional th1-oriented T follicular helper cells that infiltrate human breast cancer promote effective adaptive immunity. J Clin Invest. (2021) 131:e139905. doi: 10.1172/jci139905
43. Jacquelot N, Tellier J, Nutt SL, Belz GT. Tertiary lymphoid structures and B lymphocytes in cancer prognosis and response to immunotherapies. Oncoimmunology. (2021) 10:1900508. doi: 10.1080/2162402x.2021.1900508
44. Bruno TC, Ebner PJ, Moore BL, Squalls OG, Waugh KA, Eruslanov EB, et al. Antigen-presenting intratumoral B cells affect cd4+ Til phenotypes in non-small cell lung cancer patients. Cancer Immunol Res. (2017) 5:898–907. doi: 10.1158/2326–6066.Cir-17–0075
45. Phanthunane C, Wijers R, de Herdt M, Langeveld TPM, Koljenovic S, Dasgupta S, et al. B-cell clusters at the invasive margin associate with longer survival in early-stage oral-tongue cancer patients. Oncoimmunology. (2021) 10(1):1882743. doi: 10.1080/2162402x.2021.1882743
46. Petitprez F, de Reyniès A, Keung EZ, Chen TWW, Sun CM, Calderaro J, et al. B cells are associated with survival and immunotherapy response in sarcoma. Nature. (2020) 577:556–60. doi: 10.1038/s41586–019-1906–8
47. Huang W, Doucet M, Sen R, Pardoll A, Ganguly S. The role of vsig4 as an immuno-regulatory protein in cancer. J Immunother Cancer. (2022) 10:A508–A. doi: 10.1136/jitc-2022-SITC2022.0487
48. Jung K, Seo SK, Choi I. Endogenous vsig4 negatively regulates the helper T cell-mediated antibody response. Immunol Lett. (2015) 165:78–83. doi: 10.1016/j.imlet.2015.04.004
49. Li JL, Diao B, Guo S, Huang XY, Yang CY, Feng ZQ, et al. Vsig4 inhibits proinflammatory macrophage activation by reprogramming mitochondrial pyruvate metabolism. Nat Commun. (2017) 8(1):1322. doi: 10.1038/s41467–017-01327–4
50. Liao YM, Guo S, Chen YW, Cao DY, Xu H, Yang CY, et al. Vsig4 expression on macrophages facilitates lung cancer development. Lab Invest. (2014) 94:706–15. doi: 10.1038/labinvest.2014.73
51. Byun JM, Jeong DH, Choi IH, Lee DS, Kang MS, Jung KO, et al. The significance of vsig4 expression in ovarian cancer. Int J Gynecol Cancer. (2017) 27:872–8. doi: 10.1097/igc.0000000000000979
52. Xu T, Jiang Y, Yan Y, Wang HX, Lu CY, Xu HC, et al. Vsig4 is highly expressed and correlated with poor prognosis of high-grade glioma patients. Am J Transl Res. (2015) 7:1172–80.
53. Ivetic A, Green HLH, Hart SJ. L-selectin: A major regulator of leukocyte adhesion, migration and signaling. Front Immunol. (2019) 10:1068. doi: 10.3389/fimmu.2019.01068
54. Liao S, Ruddle NH. Synchrony of high endothelial venules and lymphatic vessels revealed by immunization. J Immunol. (2006) 177:3369–79. doi: 10.4049/jimmunol.177.5.3369
55. Lee KW, Yeo SY, Gong JR, Koo OJ, Sohn I, Lee WY, et al. Prrx1 is a master transcription factor of stromal fibroblasts for myofibroblastic lineage progression. Nat Commun. (2022) 13(1):2793. doi: 10.1038/s41467–022-30484–4
56. Takahashi Y, Sawada G, Kurashige J, Uchi R, Matsumura T, Ueo H, et al. Paired related homoeobox 1, a new emt inducer, is involved in metastasis and poor prognosis in colorectal cancer. Br J Cancer. (2013) 109:307–11. doi: 10.1038/bjc.2013.339
57. Cazet AS, Hui MN, Elsworth BL, Wu SZ, Roden D, Chan CL, et al. Targeting stromal remodeling and cancer stem cell plasticity overcomes chemoresistance in triple negative breast cancer. Nat Commun. (2018) 9:2897. doi: 10.1038/s41467–018-05220–6
58. Zhong LZ, Tan WL, Yang QQ, Zou ZW, Zhou R, Huang YS, et al. Prrx1 promotes colorectal cancer stemness and chemoresistance via the jak2/stat3 axis by targeting il-6. J Gastrointestinal Oncol. (2022) 13(6):2989–3008. doi: 10.21037/jgo-22–1137
59. Nairismägi ML, Gerritsen ME, Li ZM, Wijaya GC, Chia BKH, Laurensia Y, et al. Oncogenic activation of jak3-stat signaling confers clinical sensitivity to prn371, a novel selective and potent jak3 inhibitor, in natural killer/T-cell lymphoma. Leukemia. (2018) 32:1147–56. doi: 10.1038/s41375-017-0004-x
Keywords: tertiary lymphoid structures, colorectal cancer, tumor microenvironment, prognostic, immunotherapy
Citation: Xu Z, Wang Q, Zhang Y, Li X, Wang M, Zhang Y, Pei Y, Li K, Yang M, Luo L, Wu C and Wang W (2024) Exploiting tertiary lymphoid structures gene signature to evaluate tumor microenvironment infiltration and immunotherapy response in colorectal cancer. Front. Oncol. 14:1383096. doi: 10.3389/fonc.2024.1383096
Received: 12 February 2024; Accepted: 06 May 2024;
Published: 23 May 2024.
Edited by:
Ying Ma, Tianjin Medical University Cancer Institute and Hospital, ChinaReviewed by:
Alessandro Poggi, San Martino Hospital (IRCCS), ItalySatya Ranjan Dash, KIIT University, India
Aditya Yashwant Sarode, Columbia University, United States
Copyright © 2024 Xu, Wang, Zhang, Li, Wang, Zhang, Pei, Li, Yang, Luo, Wu and Wang. This is an open-access article distributed under the terms of the Creative Commons Attribution License (CC BY). The use, distribution or reproduction in other forums is permitted, provided the original author(s) and the copyright owner(s) are credited and that the original publication in this journal is cited, in accordance with accepted academic practice. No use, distribution or reproduction is permitted which does not comply with these terms.
*Correspondence: Weidong Wang, wangweidong1@scszlyy.org.cn