- DMPE, ONERA, Université Paris Saclay, Palaiseau, France
The efficiency of a Rotating Detonation Combustor (RDC) strongly depends on the transitory injection process of fresh reactants in the combustion chamber: poor propellant mixing induces losses of combustion efficiency and consequently low detonation speed and unstable detonation propagation. Moreover, dilution of fresh reactants with burnt gases during injection increases the deflagration losses and decreases the pressure gain provided by the detonation. Numerical simulation can help design an efficient injector to reduce these losses. In this study, the modeling strategy previously proposed by ONERA to simulate the transitory injection process is applied to two existing experimental RDC (from Nagoya University and TU Berlin) and one in-development RDC from ONERA. The computational domain represents only one injection element, convenient for a parametric study at low computational cost. A custom initial condition is used to model the expansion process of burnt gases past a detonation wave. The initial condition parameters are discussed and a method is proposed to correctly set them. The TU Berlin RDC is studied in more detail: mixing efficiency up to 70% is obtained, and 5% of deflagration losses are estimated according to the assumptions of the simulation. Based on the numerical results, detonation speed was evaluated at various distances from the injection plane taking into account the heterogeneities of the fresh mixture. The measured speed lies within the predicted range.
1 Introduction
In the 1960s, Voitsekhovskii. (1960) proposed the concept of an RDC, in which one or more detonations can propagate continuously. The detonation consumes fresh propellants injected during a period between two successive detonation waves. Using detonation instead of deflagration theoretically leads to an increase in the engine efficiency compared to conventional engines, as shown by Wolański. (2011). Despite encouraging results obtained by Naples et al. (2017), Frolov et al. (2018), and Bach et al. (2021), no experimental studies have shown a concrete efficiency increase with RDC, to the authors’ knowledge.
During the early stages of a conceptual study, empirical laws related to the RDC geometry proposed by Bykovskii et al. (2006) and the reduced model of Kaemming et al. (2017) can help highlight important parameters of an RDC to ensure stable operation, high thrust efficiency, and pressure gain. Nevertheless, these models are not based on mixing characteristics of fresh propellants in the chamber, which is a key factor for the RDC efficiency as shown by Sun et al. (2018). On the other hand, complex 3D simulations of a whole RDC have been performed by Cocks et al. (2016), Liu et al. (2020), Pal et al. (2020), Prakash et al. (2021), Nassini (2022) and many others to study conditions of detonation propagation in the RDC and to confirm the engine efficiency, but these simulations are too expensive to be used in the design process. A simplified approach based on numerical simulation can be a good way to study the propellant mixing by considering a part of the RDC and/or isolating the physical processes of interest. It could drastically reduce the computational cost of such simulations while still preserving the main physics to identify the deficiencies of the existing configurations and to test new ones.
Driscoll et al. (2016), Zhao and Zhang. (2020) and many others used cold-flow simulations of continuous injection to analyze the mixing of fresh propellants in the chamber. In such simulations, burnt gases are not taken into account. A cold-flow simulation can give insight for a preliminary characterization of the injection system efficiency, but it cannot capture some important effects such as axial stratification of fuel and oxidizer in an operating RDC, obtained in simulations by Gaillard et al. (2017), and in experiments by Ayers et al. (2022). Such stratification is mainly due to the asynchronous recovery of the fuel and oxidizer flows after the passage of a detonation wave followed by the burnt gas expansion. This axial stratification decreases combustion efficiency and engine performance. The unsteady injection process has been studied numerically in an entire annular RDC by Sato et al. (2021). They tested the effect of total mass flow rate and equivalence ratio on the recovery from blocked to unblocked injection states. Given that air and fuel holes have different sizes, the recovery process is quite different for the two reactants. It seems to be faster with a higher total mass flow rate. Studying the unsteady injection with the dynamic effect of the detonation propagation is very important to understand the origin of fresh mixture heterogeneities and minimize them.
A methodology was proposed by Gaillard et al. (2019) to model the burnt gas expansion in an RDC. This simulation strategy, named hereafter as reinjection simulation, is applied in this paper to the C2H4/O2 RDC from Ishihara et al. (2017), the H2/Air RDC from Bach et al. (2020), and the H2/O2 RDC studied at ONERA as a numerical concept (see Figure 1). Reinjection simulations rely on a custom initial condition to model the burnt gas expansion. In the following, the effects of the initial condition parameters are studied on the Nagoya and ONERA RDCs. This can help correctly set the initial condition for a simulation, to model the dynamic injector response as in an operating RDC. The RDC from Bach et al. (2020) is studied in further detail to obtain quantitative values regarding mixture characteristics.
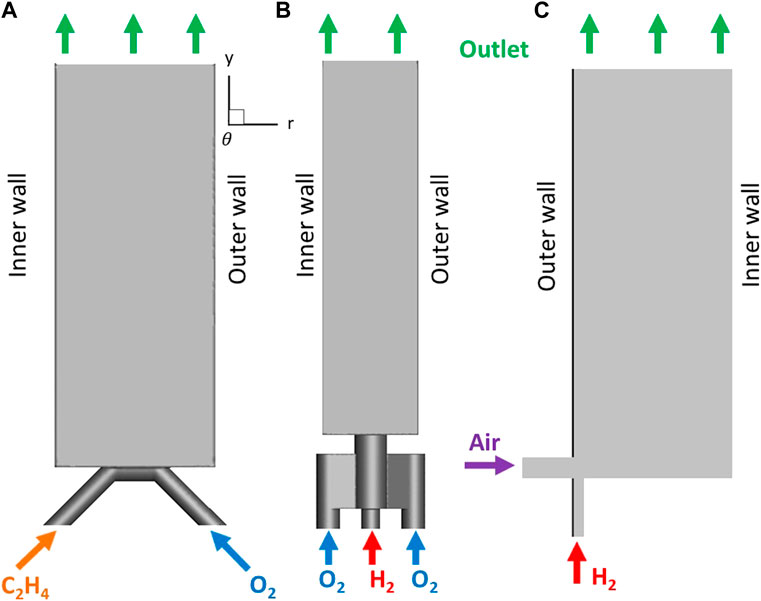
FIGURE 1. View of the 3D computational domains corresponding to Nagoya RDC (A), ONERA RDC (B), and TU Berlin RDC (C).
2 Simulation approach
2.1 Numerical method
In the present study, Large Eddy Simulations (LES) are performed with the CEDRE multiphysics software developed in the DMPE (Multi-Physics for Energetics Department) of ONERA (Refloch et al. (2011)). The CHARME solver (also mentioned in Refloch et al. (2011)) is used to solve the Navier-Stokes equations for a flow of compressible reactive gas. The finite-volume method on general unstructured meshes is utilized for spatial discretization. The MUSCL (Monotonic Upstream Scheme for Conservation Laws) interpolation scheme with the Van Leer slope limiter provides second-order accuracy on the convective fluxes. A central-difference second-order scheme is used to compute the viscous fluxes. A first-order implicit Euler scheme and a 10–8 s timestep are used for time integration. The Smagorinsky model is chosen to account for the effect of subgrid turbulence scales in the 3D simulations presented below.
Reactive simulations of the H2/Air and the H2/O2 RDCs are performed with the 7-species and 7-reaction kinetic mechanism presented by Davidenko et al. (2003). It has been applied for H2/O2 detonation (Davidenko et al. (2007); Gaillard et al. (2017)) and H2/Air deflagration (Fureby et al. (2015)). This reduced mechanism is known to underestimate the laminar flame speed being tested with a dedicated flame model like the ones from CHEMKIN (Kee et al. (1989)) or CANTERA (Goodwin et al. (2022)). In the present study, it is used together with a simplified model for molecular transport. Preliminary simulations of laminar flames for H2/O2 and H2/Air mixtures have shown satisfactory results for the same mesh resolution as in the 3D simulations of this study. The unresolved flame-turbulence interactions are not modeled, so the results of deflagration losses should be considered with caution.
The simulated flow in the Nagoya RDC is non-reactive, but species C2H4, O2, CO, CO2, H, H2, OH, H2O, HO2 and O are present to account for burnt gas dilution.
2.2 Computational domain
In the reinjection simulations, only one injection element is considered, thus reducing their computational cost. The numerical study of Zhao and Zhang. (2020) validated this approximation for cold-flow simulations. They found no difference between a simulation of one element and a simulation of the whole chamber, regarding mixing efficiency. We confirmed this finding for the TU Berlin configuration with cold-flow simulations of one and three injection elements. In this study, the computational meshes are composed of approximately 1.5 million tetrahedrons, with a minimum size of 100 µm in the mixing zone. The mesh cell size is then gradually increased along the chamber height far from the mixing zone. The present mesh resolution is comparable to previous RDC simulations of Sato and Raman. (2020) and Zhao and Zhang. (2020). Preliminary cold-flow simulations were used to evaluate the integral length scale in the TU Berlin RDC with two-point correlations. The present mesh resolves the integral length scale with about 10 points, which is assumed to be sufficient as proposed by Davidson. (2011).
Concerning the boundary conditions (see Figure 1), a non-slip adiabatic condition is set on all the walls. The outlet is set as supersonic. The mass flux and total temperature (300 K) are imposed at the inlet of the injection tubes. Pure fuel (respectively oxidizer) composition is set at the inlet boundary of the fuel (respectively oxidizer) tube. When air is used as oxidizer, it is represented by a homogeneous mixture of O2 and N2 with volumetric proportions 1:3.76. Periodic boundary conditions are imposed in the azimuthal direction on the radial boundaries (r, y), at half-distance between the neighboring injection elements.
Duration of the reinjection simulation, called τ, is set as the temporal period of RD propagation. This period is easily computed for the experimental RDCs using Equation 1, where Dmid is the median diameter of the RDC, VD the experimental detonation speed and nwave the number of detonation fronts. Values of the temporal period for the three RDCs are given in Table 1.
No experimental data exist for the ONERA RDC as it is still a numerical concept. A time period of τ = 22 µs is supposed in the following for this RDC. It corresponds approximately to the time period obtained in the numerical study by Gaillard et al. (2017), in which the same injection element is used.
2.3 Initial condition
As mentioned before, the reinjection simulation methodology uses a custom initial condition to model the burnt gas expansion in the chamber. The initial condition is obtained from the resolution of a Riemann problem. The initial states of the Riemann problem are defined as follows (see Figure 2): the lower state is usually represented by the Chapman-Jouguet (CJ) conditions, while the upper state considers an isentropic expansion from the lower state to a user-defined Mach number My,up. Hence, the lower state represents the burnt gases just after the detonation passage, whereas the upper state accounts for the expanded detonation products from the previous detonation. The bottom of the chamber, also referred to as the injection plane, is located at the lower boundary (y = 0 in Figure 2). Therefore, the location of the initial discontinuity hD can be seen as the height of the detonation front, as well as the thickness of the fresh mixture layer. The Riemann problem is solved assuming frozen states of combustion products on both sides of the contact discontinuity, so their composition corresponds to chemical equilibrium under the initial conditions. With this approach, expansion of the detonation products towards the injection openings is neglected because their cross-section is significantly restricted and the feeding pressure is higher than in the expanded hot gases.
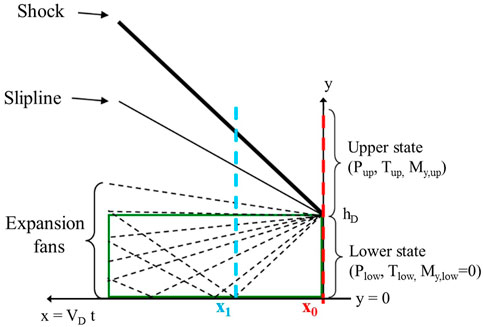
FIGURE 2. Scheme of the Riemann problem solved to obtain the initial condition for reinjection simulations.
The Riemann problem solution provided by an in-house code permits to determine the instant where the head of the expansion fan reaches the injection plane (position (x1, y = 0) in Figure 2). At this coordinate, the solution is extracted along y (Figure 3A) and applied to the LES simulations as an initial condition. Hence, the initial condition in the chamber is homogeneous in the (x, z) section (see Figure 3B) with zero velocity components in the tangential directions. As it was shown by Gaillard et al. (2019), this kind of initial condition permits to reproduce the pressure and temperature decay at the injector exit in comparison with a 2D RDC simulation. The tangential movement of the burnt gases past the detonation wave is difficult to reproduce as it exhibits a complex behavior (Gaillard et al. (2017)). Fortunately, its global effect on the propellant mixing is quite weak because its influence is observed either during the early stage of the reinjection process or on the outer boundaries of the fresh mixture layer, where the mixture is consumed by deflagration.
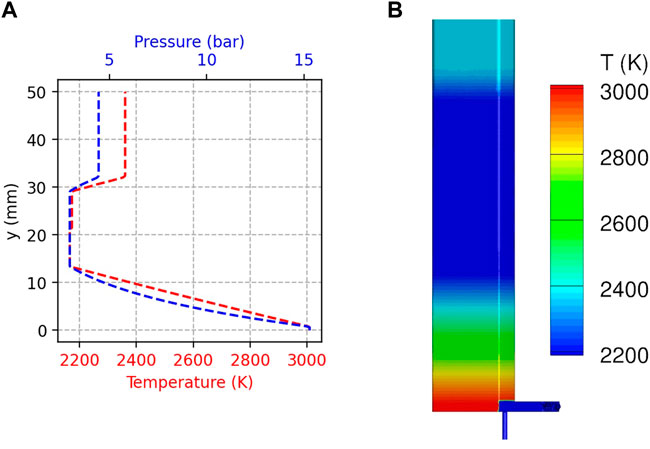
FIGURE 3. Example of the solution of the Riemann problem (A) and its application to a TU Berlin injection element for temperature (B).
The procedure to obtain the initial condition can be summed up as follows:
• Step 1: Evaluate the conditions in the fresh gas layer (pressure, temperature, species fractions).
• Step 2: Compute the CJ conditions to obtain the lower state of the Riemann problem.
• Step 3: Isentropically expand the burnt gases from the CJ conditions with My,low = 0 to a prescribed My,up to get the upper state of the Riemann problem.
• Step 4: Solve the Riemann problem with an assumed value for hD, until the expansion fan reaches the bottom wall at y = 0.
• Step 5: Perform a continuous injection simulation for the injection element using the pressure before detonation.
• Step 6: Patch the flowfield from Step 5 with the Riemann problem solution within the combustion chamber while preserving the flow in the injector channels.
3 Results
3.1 Nagoya RDC
3.1.1 Description of the geometry
The first case studied is the annular RDC designed and operated at Nagoya University by Ishihara et al. (2017). The RDC inner and outer diameters are 62 mm and 78 mm respectively, resulting in an 8 mm annulus width, while the length of the chamber is 70 mm. A converging-diverging nozzle is attached at the exit of the combustion chamber. The contraction ratio at the throat is 2.5. In the present simulation, the nozzle is not accounted for since its effect is also modeled by the initial condition. On the other hand, the length of the combustion chamber is greatly increased to reduce the potential reflective effect from the outlet boundary to the injection plane.
C2H4 and O2 are injected through 120 injection elements to obtain a global equivalence ratio of 0.9, corresponding to the test of Ishihara et al. (2017). The chamber mass flux is 120 kg/m2/s. One injection element is composed of two perpendicular injection tubes of 1 mm in diameter. The two tubes are inclined at 45° with respect to the chamber axis and they are radially aligned to provide a direct impact of the unlike jets.
In addition to the detonation speed, experimental data on the mean pressure at various locations in the RDC are available in the study of Ishihara et al. (2017) and will be used as reference values to correctly set the initial condition. In the following, a parametric study is conducted to determine the effect of the Riemann problem parameters on the simulation results.
3.1.2 Modeling of the Riemann problem states
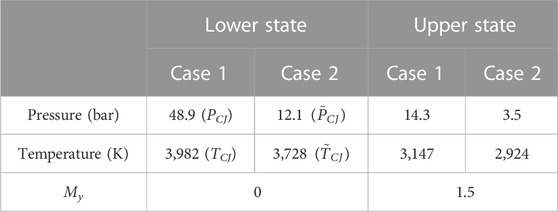
The effect of the two states of the Riemann problem is investigated in the Nagoya RDC case. In this RDC, detonation does not propagate at the theoretical CJ speed and it does not produce the theoretical CJ pressure, mainly because of the heterogeneities in the fresh mixture. Therefore, two reinjection cases are compared in Figure 4A: Case 1, for which the states of the Riemann problem are determined from the exact CJ conditions, and Case 2, for which the states are determined from a deteriorated CJ condition (
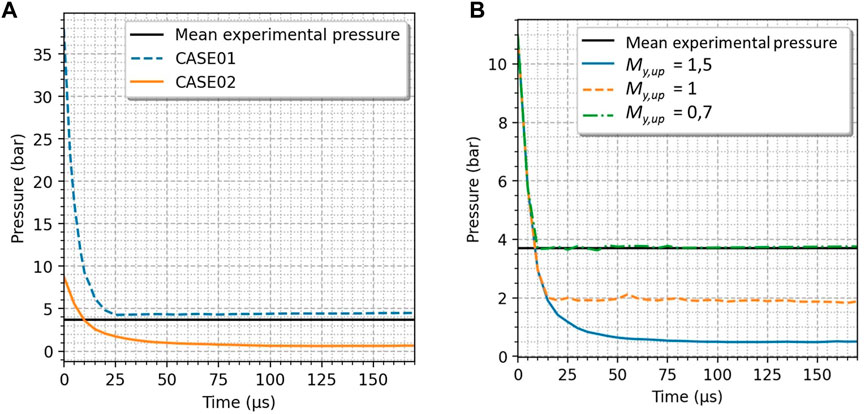
FIGURE 4. Pressure evolution at the injection plane in the Nagoya RDC using different (A) initial conditions for the Riemann problem, and (B) upper state Mach numbers My,up. The mean experimental pressure from Ishihara et al. (2017) is shown in black.
Figure 4A presents pressure evolution at the injection plane from the reinjection simulations. Pressure in Case 2 decreases slower than in Case 1 and reaches its final value around t = 100 µs, while pressure in Case 1 drops faster until it reaches a steady value around t = 25 µs. Thus, the conditions of the lower and upper states have a strong impact on the injection dynamics. The mean pressure in these two simulations is either too high (5.4 bar in Case 1) or too low (1.2 bar in Case 2) compared to the experimental pressure measured at the injection plane (approximately 3.7 bar).
For the next cases, the initial condition obtained for Case 2 (deteriorated CJ condition for the lower state values) is selected because it seems to produce a pressure decrease better suited to represent the mean experimental pressure.
3.1.3 Effect of the upper state Mach number
The second parameter studied here is the upper state Mach number (My,up), which is linked to the expansion of the burnt gases produced by the previous detonation wave. The pressure decrease at the injection plane in the simulations is plotted in Figure 4B for three different values of My,up, the other parameters from Case 2 remaining unchanged.
From the results shown in Figure 4B, My,up has an effect on the final pressure: when My,up is reduced, burnt gases expansion is weaker and the pressure at the injection plane has a higher final value. In addition, the pressure decrease shown here is quite different from the classical exponential decay illustrated in (Section 3.2.2). Consequently, My,up is not a suitable parameter to control the rate of the pressure decrease in spite of its effect on the final pressure at the injection plane.
The effect of My,up is also shown in Figure 5 with the field of Zexcess. If Zexcess is positive (respectively negative), it corresponds to the volume fraction of C2H4 (respectively O2) in excess relative to stoichiometry. The two fields obtained at the end of the reinjection period τ are very different from each other. Since the final pressure in the chamber increases when My,up is reduced, the velocity of the propellant jets in the chamber is also reduced for the same injected mass flow rates. Thus, the fresh gases have more time to mix close to the injection plane. This leads to a better mixing in the case of My,up = 1 as shown in Figure 5, on the right. Also in the same reinjection simulation, the O2 jet impinges the inner wall of the engine, creating a lean mixture close to it. This effect is due to the fact that the radial component of the O2 jet momentum is about four times higher than that of the C2H4 jet (the estimation is based on the mass fluxes of the injected propellant flows, which are 470 kg/m2/s for C2H4 and 1800 kg/m2/s for O2). This behavior is consistent with the observation of Ishihara et al. (2017), that a part of the wall coating in the experimental chamber was oxidized during the RDC operation.
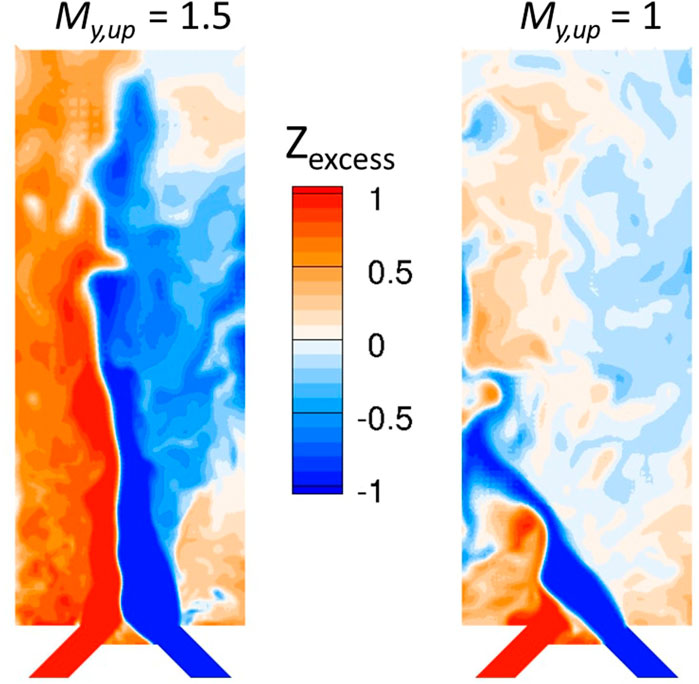
FIGURE 5. Instantaneous fields of Zexcess in the mid-plane of the Nagoya injection element at t = τ = 170 µs for two upper state Mach numbers My,up.
3.2 ONERA RDC
The effect of the Riemann problem initial states and My,up on the reinjection dynamics was studied in detail in Section 3.1. It does not influence the shape of the pressure decay in the chamber, so another parameter (hD) is studied in Section 3.2. Currently, it is difficult to obtain experimentally a well-resolved pressure decay in the RDC between two detonations. Therefore, a simplified numerical RDC is used to provide a pressure decrease of reference for the reinjection simulations.
3.2.1 Description of the geometry
The second geometry studied is an annular RDC (named as ONERA RDC in the following), in which the injector is composed of elements described in the patent of Davidenko and Gaillard. (2022). H2 and O2 are used as propellants for this RDC. Without any preliminary information on the operational conditions in this RDC, they are evaluated from a 2D simulation as a first approximation.
3.2.2 2D simulations of the RDC operation
The numerical approach used for the 2D RDC simulations has been detailed by Gaillard et al. (2017), and an example of the simulated flowfield is shown in Figure 6. Premixed propellants are uniformly injected through a slot at the bottom of the chamber. This kind of simulation serves to evaluate a reference pressure decrease on the injection plane, for ideal injection process and detonation propagation.
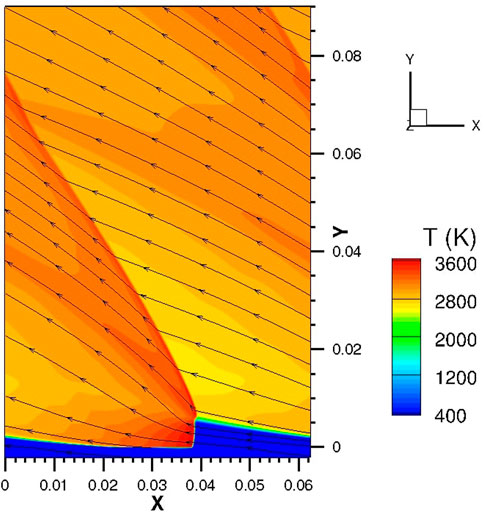
FIGURE 6. Temperature field in a 2D simulation of an RDC fed with stoichiometric H2/O2 mixture, with a chamber mass flux of 150 kg/m2/s and 5 detonations assumed in the chamber (Lx = 62.2 mm). Streamlines in the moving reference frame attached to the detonation are shown in black.
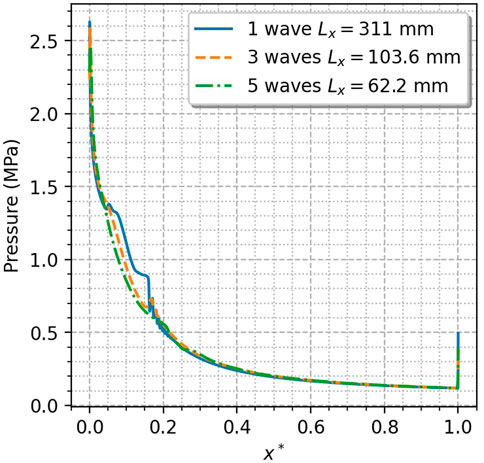
Figure 7 shows a pressure decrease along the injection plane obtained from three 2D simulations, with the same mass flux of propellants as in Figure 6. The dimensionless abscissa x* is the circumferential position x divided by the spatial period between detonation waves, noted Lx in the following. The detonation wave is located at
The only parameter that differs in these simulations is the number of detonation waves considered in the RDC and hence, the spatial period Lx. Nevertheless, the three pressure profiles are almost perfectly superimposed, meaning that for 2D premixed simulations, the period Lx does not have an impact on the pressure profile in the engine if the dimensionless coordinate x* is used. This similarity was also mentioned by Davidenko et al. (2007) concerning simulations using Euler equations.
According to this result, 2D simulations can be performed on a small computational domain (i.e., a small spatial period), leading to lower computational cost. The pressure profile describing the expansion process for any selected number of waves can then be derived from such a 2D simulation.
3.2.3 Effect of the discontinuity position in determining the initial condition
In determining the initial condition for a reinjection simulation, the position of the Riemann problem discontinuity, hD, is a free parameter unless one knows the height of the detonation front. The method described in this section allows finding the right hD for a given pressure variation. The 2D simulation in which 5 detonations were assumed is used to define the reference pressure profile. The pressure profiles obtained from reinjection simulations with hD = 3 and 10 mm are compared with the pressure profile of the 2D case in Figure 8A.
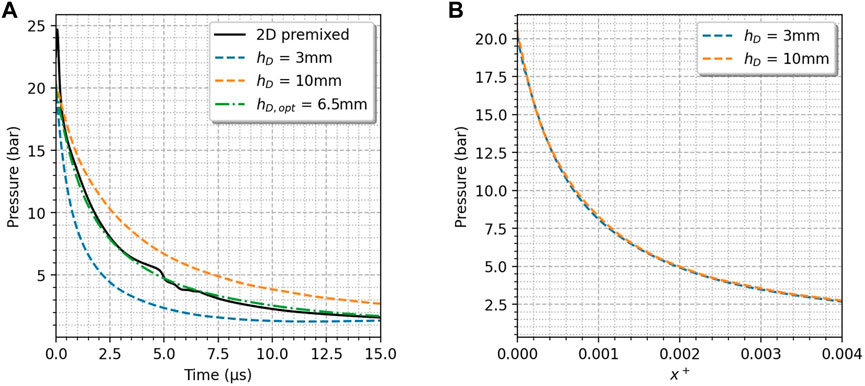
FIGURE 8. Pressure evolution at the injection plane for (A) the 2D simulation (solid line) and three reinjection simulations (dashed and dot-dashed lines), with various hD and for (B) two reinjection simulations with the x+ abscissa.
It can be seen in Figure 8A that hD has an impact only on the rate of the pressure decay. The initial pressure is the same, but increasing hD slows down the expansion of burnt gases at the injection plane. Therefore, hD is a key parameter to set a proper initial condition that can correctly model the effect of burnt gas expansion.
Now, a strategy to determine the correct value of hD is proposed. As for Figure 7, the idea is to find a dimensionless coordinate to compare the pressure profiles obtained from reinjection simulations. The Riemann problem is supposed to model the discontinuity located at hD, separating the burnt gases right behind a detonation, and the expanded burnt gases produced by the previous detonation. This discontinuity position is on the top of the fresh mixture layer in front of the detonation wave. If the period between two detonation waves increases, there is more time to inject propellants and the thickness of the fresh layer grows correspondingly. Therefore, it can be assumed that, like the thickness of the fresh layer, hD is proportional to the time period between detonations (τ). Also, the temporal and spatial periods are linked as Lx = τ × VD, where VD is the detonation speed in the laboratory reference frame. Hence, the thickness of the fresh mixture layer is proportional to the spatial period (Equation 2), as experimentally shown by Bykovskii et al. (2006) and Rankin et al. (2017).
It was shown previously that the pressure profiles in 2D simulations with different Lx are similar in dimensionless coordinate
Then, the coordinate change
Pressure at the injection plane of the RDC is plotted against the dimensionless variable x+ for the two reinjection simulations represented in Figure 8B. The two curves are perfectly superimposed. Thus, it is possible to predict the pressure profile for a reinjection simulation with a different hD. In fact, one reinjection simulation (obtained with an assumed discontinuity height hD,1) allows to plot the pressure profile
To illustrate this method, the optimum height hD = 6.5 mm is used to obtain a pressure profile, close to the one of the 2D simulation, plotted with green dashed-dotted line in Figure 8A.
3.3 TU Berlin RDC
Thanks to Section 3.1 and Section 3.2, it is easier to properly set the initial condition in the reinjection simulation to reproduce the transient behavior in the RDC. Section 3.3 now aims at presenting the potential of reinjection simulations to study the mixing and deflagration losses.
3.3.1 Description of the geometry
The geometry studied hereafter is the annular chamber of the experimental RDC designed and operated at the Technische Universität of Berlin (TU Berlin) by Bach et al. (2020). The annulus inner and outer diameters are 74.8 mm and 90 mm respectively, resulting in a 7.6 mm radial gap, whereas the length of the chamber is 110 mm. Air is injected radially from the outer wall through a 1 mm slot and H2 is injected through 100 evenly spaced 0.5 mm holes. The conditions in the chamber are taken or evaluated from the experiment. The global equivalence ratio is 1 and the mass flux related to the chamber cross-section is 100 kg/m2/s. The selected chamber geometry has an outlet restriction of 50%, creating a sonic throat for the selected operating point.
3.3.2 Non-reactive simulation
Firstly, a non-reactive reinjection simulation is carried out to make a comparison with an established injection. The lower state of the Riemann problem corresponds to the CJ condition for a stoichiometric H2/Air mixture at 1 bar (approximately 50% of the mean experimental pressure) and ambient temperature (300 K). The discontinuity is set at hD = 20 mm and the upper state Mach number is My,up = 1.5. The initial condition has been validated by comparing the experimental and numerical mean pressure measured 10 mm upstream of the throat (2.3 bar in both cases).
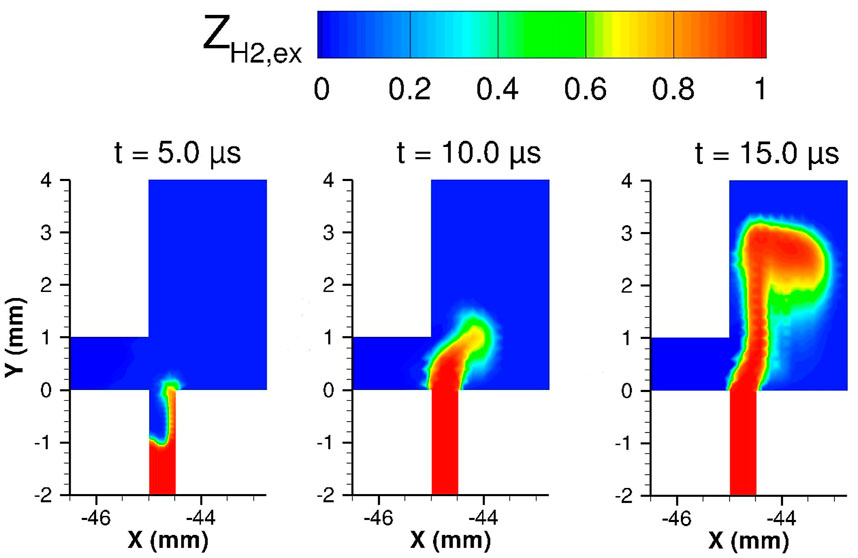
To study the mixing process in the chamber, the Zi variables (proposed by Gaillard et al. (2019)) will be used below. Zi are computed in every mesh cell and have a particular meaning: Zst corresponds to the mixture volume fraction at stoichiometry (i.e., the volume fraction of propellants that can react completely),
Figure 9 shows the
The final state (see the top of Figure 10), corresponds to the mixture the detonation will consume, meaning that a good mixing is obtained above y = 5 mm and slightly closer to the inner wall of the engine (see Figure 10A). The rich zone created close to the outer wall at the beginning of the simulation can still be observed (see Figure 10B). It is located in a recirculation zone, in which some burnt gases from the previous detonation is stuck (see Figure 10D). Meanwhile, a lean mixture is formed in the recirculation zone located at the bottom of the chamber, and along the inner wall (see Figure 10C).
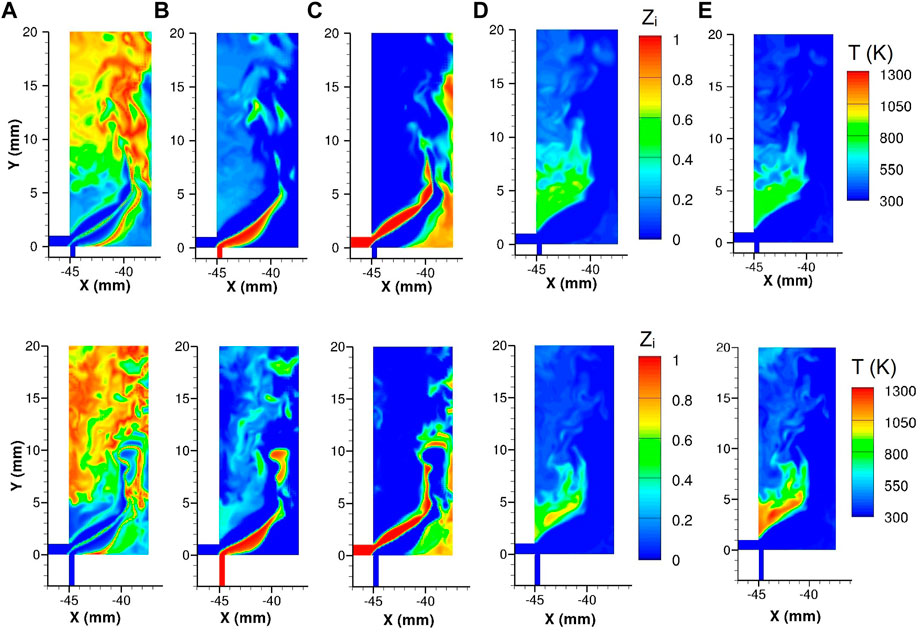
FIGURE 10. Instantaneous fields in the mid-plane of the non-reactive (top) and reactive (bottom) flows at t = 170 µs: (A) Zst (B)
Mixing efficiency from the reinjection and established flow simulations can be compared as a function of axial coordinate. Mixing efficiency is defined by Equation 6. It corresponds to the mass fraction of fresh gases which are in proportions that respect the global equivalence ratio of the chosen operating point (ERglob). ER is the local equivalence ratio in a cell.
Instantaneous profiles of mixing efficiency at different instants from the reinjection simulation and the time-averaged mixing efficiency of the established injection are compared in Figure 11. Mixing efficiency increases with time and gets to a maximum at t = 120 µs. At the same time, the fresh mixture layer reaches y = 20 mm (the maximum axial distance shown in Figure 11). The mixing efficiency profiles of the reinjection simulation are far below the one of the established simulation. In fact, the established injection simulation was performed at a pressure of 2.1 bar, corresponding to the mean experimental pressure at the chamber outlet obtained by Bach et al. (2020). On the contrary, the chamber pressure is not constant in the reinjection simulation, and it falls below the mean outlet pressure after approximately 50 µs. This lower pressure increases the flow velocity in the chamber, thus the reactants mix further away from the bottom of the chamber (above 20 mm) compared to the continuous injection.
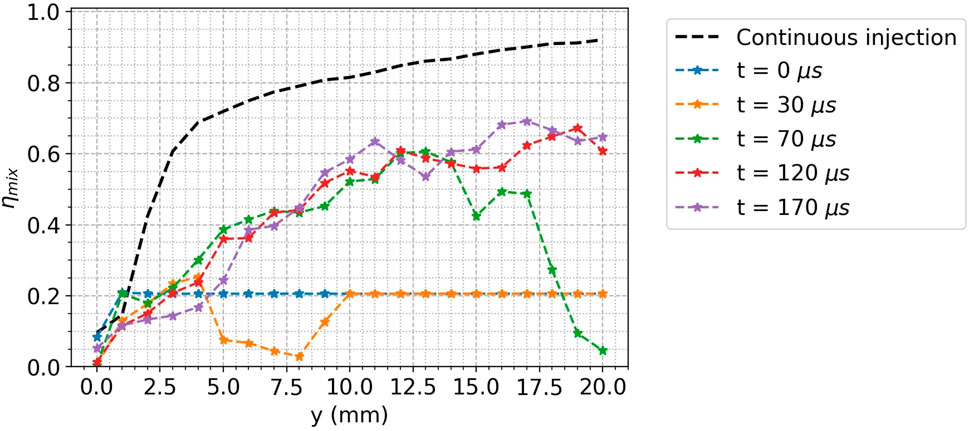
FIGURE 11. Mixing efficiency versus axial position in the computational domain. In black: time-averaged continuous injection; in color: instantaneous mixing efficiency for various instants.
3.3.3 Reactive simulation
The Zi and temperature fields obtained at the end of the reactive simulation are shown at the bottom of Figure 10. In comparison with the non-reactive simulation, the fraction of burnt gases indicated by Zbg (Figure 10D) and the temperature (Figure 10E) are significantly higher within the recirculation zone above the Air slot where combustion is stabilized. At the same time, the flow dynamics in the recirculation zone change in the way that a larger area is filled with the stoichiometric mixture (Figure 10A).
The reactive simulation makes it possible to compute the deflagration losses in the combustion chamber. Multiple strategies can be used to determine the mass of fresh gases consumed by deflagration. Here, it was decided to use the mass balance of fresh gases between the inlet and outlet of the combustion chamber. The CEDRE software allows to save the instantaneous mass flow rates at the inlet and outlet boundaries (
The height of the combustion chamber is high enough to prevent fresh gases from leaving the domain. Therefore, the mass of each propellant in the RDC corresponds to the difference between the injected mass and the mass consumed by deflagration. It is then divided by the total mass injected during the simulation and shown in Figure 12.
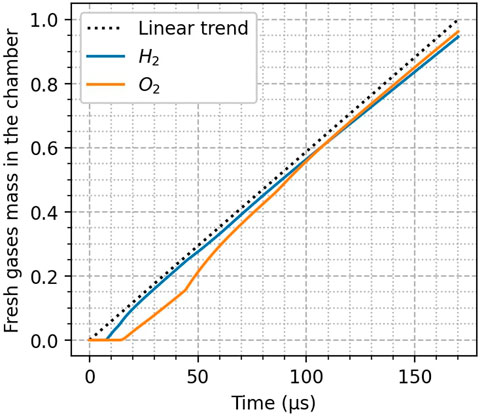
FIGURE 12. Amount of fresh gases in the chamber divided by the total mass injected during the simulation for H2 (blue) and O2 (orange).
The time delay between the start of H2 and Air reinjections is visible. The deflagration losses are of the same order of magnitude for the two reactants: only 5% are consumed by deflagration. Therefore, the early consumption of fresh gases during the time period between detonations is small under the conditions of the present study.
3.3.4 Evaluation of detonation speed
The final flowfield from the reactive simulation is used as input for the in-house code DetonHeter, which can account for mixture heterogeneities to evaluate the detonation propagation speed (see Supplementary Material). The simulated flowfield is divided, along the distance from the injection plane, into 10 slices of 4 mm in height, and the computation is performed with the heterogeneous state of each slice.
The obtained detonation propagation speed is displayed in Figure 13. The abscissa represents the center of each slice. The experimental value of Bach et al. (2020) and the numerical speed range of Nassini. (2022) are shown for comparison. The simulation of Nassini. (2022) was performed on the TU Berlin RDC but at a different operating point. The computed detonation speed in Figure 13 presents a bell shape. In fact, fresh gases are not well mixed in the bottom of the chamber, inducing an important speed deficit. As shown before, mixing improves along the chamber height, thus increasing the detonation speed, which reaches a maximum at 26 mm above the injection wall. The following decrease is caused by the growth of the burnt gases mass fraction that remains on the top of the fresh mixture layer. The reduced model results are also coherent with the numerical work of Nassini (2022).
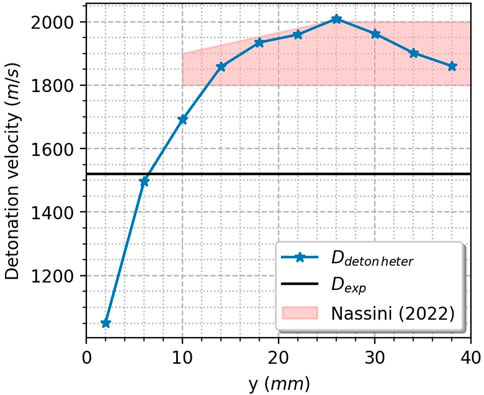
FIGURE 13. Detonation speed evaluated for the heterogeneous mixture state at different axial positions (blue line) compared to the mean experimental value of Bach et al. (2020) (black line) and the numerical velocity of Nassini. (2022) (shadowed area).
The experimental detonation propagation speed lies within the predicted range. Nevertheless, the experimental speed is about 400 m/s lower than the maximum estimated detonation velocity. RDC simulations often result in such discrepancies with experimental observations. Different reasons can be given, such as neglected viscous interactions on the walls or too simplified kinetic mechanism. Apart from the modeling aspects, we also propose a discussion in relation to the detonation cell size for the present RDC. Figure 14 compares the combustor annular gap with the experimental cell width for a similar H2/Air mixture at different pressures. The cell size is close to the annular gap. In this particular case, the detonation cellular structure tends to change from 3D to 2D (Ishii et al. (2002)) and the effect of the boundary layer (friction and heat transfer) is non-negligible. Multiple experiments such as Ishii et al. (2002) or Xiao et al. (2021) showed that the speed deficit depends on the gap-to-cell width ratio and that it can reach 30% before detonation failure. The present detonation speed calculation does not account for these effects, which are probably important in the TU Berlin RDC and can be responsible for the observed detonation speed deficit. From an experimental point of view, it could be interesting to see if the detonation speed can be increased with a larger annular gap in the TU Berlin RDC.
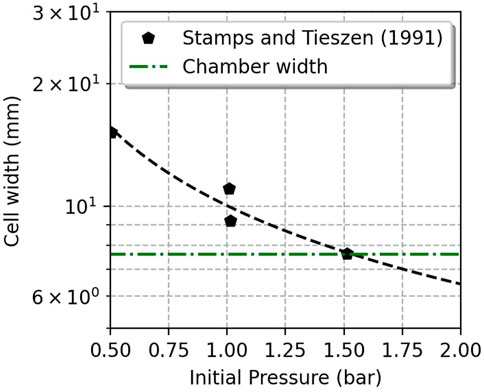
FIGURE 14. Experimental H2/Air cell size measurement from Stamps and Tieszen. (1991) compared to the TU Berlin RDC annular gap.
4 Conclusion
The reinjection simulation methodology has been applied to three RDC configurations and the effects of the initial condition parameters on the pressure profile decay at the injection plane have been studied. The conditions of the lower and upper states of the Riemann problem have to be set carefully since they have an important impact on the initial and final pressures at the injection plane. The upper state Mach number controls the final pressure in the chamber: a lower Mach number stops the burnt gases expansion sooner. The rate of the pressure decrease is mainly controlled by the location of the discontinuity imposed in the Riemann problem. The farther the discontinuity is located, the slower is the pressure decay. A method to accurately impose this height has been proposed to correctly set the initial condition regarding a known pressure variation on the injection plane.
It was shown that the effect of the burnt gas expansion has a major impact on the mixing process: it can create an axially stratified mixture, leading to a global reduction in mixing efficiency because of the non-synchronized propellant admission during the pressure drop on the injector. Thus, mixing in the reinjection simulation may be significantly different as compared to the established injection. For the TU Berlin RDC, little difference in mixing is obtained between the reactive and non-reactive cases. Moreover, deflagration losses computed from the reactive simulation, show that little amount of fresh gases is burnt by deflagration in the TU Berlin RDC, under the study assumptions. Reinjection simulation can be used to help design an optimized injector providing efficient propellant mixing, low deflagration losses, and weak propellant stratification. The detonation speed computed from the mixture state in the reinjection simulation may differ from the experimental velocity. More detailed studies are then needed to predict the detonation speed from the heterogeneous mixture state by a reduced model. Future work will also focus on the validation of reinjection simulations with comparison to 3D simulations of an RDC.
Data availability statement
The raw data supporting the conclusions of this article will be made available by the authors, without undue reservation.
Author contributions
The numerical simulations and post-processing of the results were performed by PH in the framework of his Master thesis. PH wrote the first draft of the manuscript. DD wrote the supplemental data. TG and DD contributed to the manuscript revision. All authors approved the submitted version.
Funding
This study was funded by the General Scientific Direction of ONERA.
Acknowledgments
The comparison between the numerical and experimental results of the RDC was possible thanks to the experimental data shared by TU Berlin. Special thanks to Prof. Myles Bohon who kindly accepted this sharing and Dr. Eric Bach who provided the data.
Conflict of interest
The authors declare that the research was conducted in the absence of any commercial or financial relationships that could be construed as a potential conflict of interest.
Publisher’s note
All claims expressed in this article are solely those of the authors and do not necessarily represent those of their affiliated organizations, or those of the publisher, the editors and the reviewers. Any product that may be evaluated in this article, or claim that may be made by its manufacturer, is not guaranteed or endorsed by the publisher.
Supplementary material
The Supplementary Material for this article can be found online at: https://www.frontiersin.org/articles/10.3389/fpace.2023.1127671/full#supplementary-material
References
Ayers, Z. M., Lemcherfi, A., Plaehn, E. W., Gejji, R. M., Perkins, H. D., Roy, S., et al. (2022). Simultaneous 100-khz acetone planar laser-induced fluorescence and oh* chemiluminescence in a linear non-premixed detonation channel. Combust. Flame 244, 112209. doi:10.1016/j.combustflame.2022.112209
Bach, E., Paschereit, C. O., Stathopoulos, P., and Bohon, M. D. (2021). An empirical model for stagnation pressure gain in rotating detonation combustors. Proc. Combust. Inst. 38, 3807–3814. doi:10.1016/j.proci.2020.07.071
Bach, E., Stathopoulos, P., Paschereit, C. O., and Bohon, M. D. (2020). Performance analysis of a rotating detonation combustor based on stagnation pressure measurements. Combust. Flame 217, 21–36. doi:10.1016/j.combustflame.2020.03.017
Bykovskii, F. A., Zhdan, S. A., and Vedernikov, E. F. (2006). Continuous spin detonations. J. Propuls. power 22, 1204–1216. doi:10.2514/1.17656
Cocks, P. A., Holley, A. T., and Rankin, B. A. (2016). “High fidelity simulations of a non-premixed rotating detonation engine,” in 54th AIAA aerospace sciences meeting (San Diego, California, USA: AIAA), 0125.
Davidenko, D., Gökalp, I., Dufour, E., and Magre, P. (2003). “Numerical simulation of hydrogen supersonic combustion and validation of computational approach,” in 12th AIAA international space planes and hypersonic systems and technologies (Norfolk, Virginia: AIAA), 7033.
Davidenko, D. M., Gökalp, I., and Kudryavtsev, A. N. (2007). “Numerical simulation of the continuous rotating hydrogen-oxygen detonation with a detailed chemical mechanism,” in West-East high speed flow field conference (Poitiers, France: WEHSFF).
Davidson, L. (2011). “How to estimate the resolution of an les of recirculating flow,” in Quality and reliability of large-eddy simulations II (Springer), 269–286.
Driscoll, R., Aghasi, P., St George, A., and Gutmark, E. J. (2016). Three-dimensional, numerical investigation of reactant injection variation in a h2/air rotating detonation engine. Int. J. hydrogen energy 41, 5162–5175. doi:10.1016/j.ijhydene.2016.01.116
Frolov, S., Aksenov, V., Ivanov, V., Medvedev, S., Shamshin, I., Yakovlev, N., et al. (2018). “Rocket engine with continuous detonation combustion of the natural gas–oxygen propellant system,” in Doklady physical chemistry (Springer), 31–34.
Fureby, C., Nordin-Bates, K., Petterson, K., Bresson, A., and Sabelnikov, V. (2015). A computational study of supersonic combustion in strut injector and hypermixer flow fields. Proc. Combust. Inst. 35, 2127–2135. doi:10.1016/j.proci.2014.06.113
Gaillard, T., Davidenko, D., and Dupoirieux, F. (2019). “Numerical investigation of an unsteady injection adapted to the continuous detonation wave rocket engine operation,” in Progress in propulsion physics. Editors C. Bonnal, M. Calabro, S. Frolov, L. Galfetti, and F. Maggi (Madrid: EDP Sciences), 347–370. doi:10.1051/eucass/201911347
Gaillard, T., Davidenko, D., and Dupoirieux, F. (2017). Numerical simulation of a rotating detonation with a realistic injector designed for separate supply of gaseous hydrogen and oxygen. Acta Astronaut. 141, 64–78. doi:10.1016/j.actaastro.2017.09.011
Goodwin, D. G., Moffat, H. K., Schoegl, I., Speth, R. L., and Weber, B. W. (2022). Cantera: An object-oriented software toolkit for chemical kinetics, thermodynamics, and transport processes. Avaliable At: https://www.cantera.org.
Ishihara, K., Nishimura, J., Goto, K., Nakagami, S., Matsuoka, K., Kasahara, J., et al. (2017). “Study on a long-time operation towards rotating detonation rocket engine flight demonstration,” in In 55th AIAA Aerospace sciences meeting (Grapevine, Texas: AIAA), 1062.
Ishii, K., Itoh, K., and Tsuboi, T. (2002). A study on velocity deficits of detonation waves in narrow gaps. Proc. Combust. Inst. 29, 2789–2794. doi:10.1016/s1540-7489(02)80340-6
Kaemming, T., Fotia, M. L., Hoke, J., and Schauer, F. (2017). Thermodynamic modeling of a rotating detonation engine through a reduced-order approach. J. Propuls. Power 33, 1170–1178. doi:10.2514/1.b36237
Kee, R. J., Rupley, F. M., and Miller, J. A. (1989). Chemkin-II: A fortran chemical kinetics package for the analysis of gas-phase chemical kinetics. Livermore, CA (United States): Sandia National Lab.SNL-CA.
Liu, X. Y., Chen, Y. L., Xia, Z. J., and Wang, J. P. (2020). Numerical study of the reverse-rotating waves in rotating detonation engine with a hollow combustor. Acta Astronaut. 170, 421–430. doi:10.1016/j.actaastro.2020.02.008
Naples, A., Hoke, J., Battelle, R. T., Wagner, M., and Schauer, F. R. (2017). “Rde implementation into an open-loop t63 gas turbine engine,” in 55th AIAA aerospace sciences meeting (Grapevine, Texas: AIAA), 1747.
Nassini, P. C. (2022). High-fidelity numerical investigations of a hydrogen rotating detonation combustor. Ph.D. thesis. Florence: University of Florence.
Pal, P., Xu, C., Kumar, G., Drennan, S. A., Rankin, B. A., and Som, S. (2020). “Large-eddy simulations and mode analysis of ethylene/air combustion in a non-premixed rotating detonation engine,” in AIAA propulsion and energy 2020 forum (New Orleans, LA: AIAA), 3876.
Prakash, S., Raman, V., Lietz, C. F., Hargus, W. A., and Schumaker, S. A. (2021). Numerical simulation of a methane-oxygen rotating detonation rocket engine. Proc. Combust. Inst. 38, 3777–3786. doi:10.1016/j.proci.2020.06.288
Rankin, B. A., Richardson, D. R., Caswell, A. W., Naples, A. G., Hoke, J. L., and Schauer, F. R. (2017). Chemiluminescence imaging of an optically accessible non-premixed rotating detonation engine. Combust. Flame 176, 12–22. doi:10.1016/j.combustflame.2016.09.020
Refloch, A., Courbet, B., Murrone, A., Villedieu, P., Laurent, C., Gilbank, P., et al. (2011). CEDRE software. Palaiseau: Aerospace Lab, 1–10.
Sato, T., Chacon, F., Gamba, M., and Raman, V. (2021). Mass flow rate effect on a rotating detonation combustor with an axial air injection. Shock Waves 31, 741–751. doi:10.1007/s00193-020-00984-7
Sato, T., and Raman, V. (2020). Detonation structure in ethylene/air-based non-premixed rotating detonation engine. J. Propuls. Power 36, 752–762. doi:10.2514/1.b37664
Stamps, D. W., and Tieszen, S. R. (1991). The influence of initial pressure and temperature on hydrogen-air-diluent detonations. Combust. Flame 83, 353–364. doi:10.1016/0010-2180(91)90082-m
Sun, J., Zhou, J., Liu, S., and Lin, Z. (2018). Numerical investigation of a rotating detonation engine under premixed/non-premixed conditions. Acta astronaut. 152, 630–638. doi:10.1016/j.actaastro.2018.09.012
Wolański, P. (2011). “Rotating detonation wave stability,” in 23rd international colloquium on the dynamics of explosions and reactive systems (Irvine, USA: ICDERS).
Xiao, Q., Sow, A., Maxwell, B. M., and Radulescu, M. I. (2021). Effect of boundary layer losses on 2d detonation cellular structures. Proc. Combust. Inst. 38, 3641–3649. doi:10.1016/j.proci.2020.07.068
Keywords: rotating detonation combustor, transient injection, turbulent mixing, deflagration losses, numerical simulation
Citation: Hellard P, Gaillard T and Davidenko D (2023) Evaluation of a computational strategy to model transitory injection in rotating detonation combustors. Front. Aerosp. Eng. 2:1127671. doi: 10.3389/fpace.2023.1127671
Received: 19 December 2022; Accepted: 03 February 2023;
Published: 23 February 2023.
Edited by:
Simone Salvadori, Polytechnic University of Turin, ItalyReviewed by:
Pier Carlo Nassini, University of Florence, ItalySuo Yang, University of Minnesota Twin Cities, United States
Myles Bohon, Technical University of Berlin, Germany
Copyright © 2023 Hellard, Gaillard and Davidenko. This is an open-access article distributed under the terms of the Creative Commons Attribution License (CC BY). The use, distribution or reproduction in other forums is permitted, provided the original author(s) and the copyright owner(s) are credited and that the original publication in this journal is cited, in accordance with accepted academic practice. No use, distribution or reproduction is permitted which does not comply with these terms.
*Correspondence: Pierre Hellard, cGllcnJlLmhlbGxhcmRAb25lcmEuZnI=
 Pierre Hellard
 Thomas Gaillard
 Dmitry Davidenko
