 Nathaniel C. Hawes
 Jay P. Wilhelm
- Mechanical Engineering, Ohio University, Athens, OH, United States
Autonomous uncrewed aircraft will require collision avoidance systems (CASs) designed with autonomy in mind as they integrate into the increasingly crowded national airspace system. Current uncrewed aircraft CASs typically require a remote pilot to execute avoidance or to provide poorly defined guidance that does not benefit autonomous systems. The Path Recovery Automated Collision Avoidance System (PRACAS) re-plans flight paths to autonomously adjust for collisions using path planners and keep-out zones (KOZs), but it does not currently detect or mitigate overtaking collisions. This work investigates the effect of geometric KOZs on overtaking scenarios for autonomous uncrewed aircraft. KOZ shapes were developed by relating relative velocities and turn rates of aircraft in overtaking scenarios and were tested using PRACAS. The operational ranges for approach heading, relative velocity, and look-ahead time were then determined. The set of KOZs that were developed prevented intruder aircraft from entering the minimum separation distance of one wingspan from the mission aircraft in overtaking scenarios with look-ahead times between 5 and 12 s, relative velocities of 2–20, and approach angles between 110° and −110° measured from the heading of the main UAS. Minimum separation was maintained for low-speed encounters with relative velocities between 1.1 and 2.0 for look-ahead times between 2 and 8 s for all approach angles. With look-ahead times ranging from 5 to 8 s, overtaking collisions of all tested approach angles and relative speeds are handled with more than twice the separation required for success, showing that the KOZs developed are feasible in possible autonomous CASs.
1 Introduction
Uncrewed aerial systems (UAS) that operate autonomously must rely on aerial collision-avoidance systems (CASs) for safe operation as they integrate into the National Airspace System (NAS). Passenger aircraft with on-board pilots are required to utilize the Traffic Collision Avoidance System (TCAS) to provide collision avoidance advisories to pilots, although TCAS was never meant to be implemented on UASs without modifications (ICAO, 2011). Autonomous UASs require strictly defined paths to follow, but CASs frequently rely on guidance methods that do not satisfy this need. The Path Recovery Automated Collision Avoidance System (PRACAS) is a type of CAS designed specifically for autonomous UASs that identifies collisions using contact between probability cones generated using vehicle characteristics and resolves collisions using path planners and waypoints to provide clearly defined avoidance paths that autonomous systems can follow. Although PRACAS has been shown to be effective in specific high-risk collision scenarios, it cannot detect overtaking collision scenarios (Browne et al., 2021).
Aerial collisions fall into three main categories defined by the International Civil Aviation Organization: 1) head-on, where the intruder approaches the mission UAS directly or approximately; 2) converging, where the intruder approaches the mission UAS from the side; 3) overtaking, where the intruder approaches the mission UAS from behind (ICAO, 2005). PRACAS addresses head-on collisions and some converging collisions—specifically perpendicular approach collisions—but it does not address overtaking collisions (Browne et al., 2021). Solutions for overtaking scenarios are essential for any autonomous UAS CAS since the majority of aerial collisions are overtaking collisions (Electronic Code of Federal Regulations e-CFR, 2023). Parameters used by PRACAS to construct probability cones—look-ahead time and aircraft velocity—can be used to construct additional keep-out zones (KOZs) that can mitigate overtaking scenarios. The focus of this paper is to investigate the impact of geometric KOZs on the overtaking collision scenario for small, fixed-wing, autonomous uncrewed aircraft.
2 Literature review
Exploring the impact of geometric KOZs in overtaking scenarios requires a CAS that can utilize geometric KOZs. Autonomous collision avoidance is necessary for UASs to operate autonomously and can be achieved using waypoint defined paths that skirt KOZs placed on intruder vehicles or obstacles. Typical approaches to collision avoidance in UASs require pilot intervention (Kochenderfer et al., 2013; Alvarez et al., 2019; Owen et al., 2019) or generic guidance that can be difficult for autonomous vehicles to follow (Khatib, 1986; Kandil et al., 2010; Dang et al., 2019). The following literature review will provide a brief description of current approaches to collision avoidance and discuss the tools and relevant laws regarding UASs and the overtaking scenario.
Waypoints in conjunction with path planners are commonly used to guide UASs (Kaminer et al., 1998; Chandler et al., 2000; Richards et al., 2002; Park et al., 2004; Osborne and Rysdyk, 2005; Valenti et al., 2006; Park et al., 2007; Lim and Bang, 2009; Goerzen et al., 2010; Milutinović et al., 2017) because they are simple to use and robust when introduced to disturbances such as wind blowing a UAS off course or a sensor error misrepresenting the exact location of a vehicle. One of the path planners most frequently used to connect waypoints is A* (Hart et al., 1968; Kunchev et al., 2006; Blaich et al., 2012; Duchoň et al., 2014; Tseng et al., 2014; Kusuma et al., 2019), which identifies the shortest path between two goal points on a discretized search area (Hart et al., 1968; Kusuma et al., 2019). A* is preferred because of its adaptability to a variety of problems (Le et al., 2018; Dong et al., 2020; English and Wilhelm, 2020) and its performance in respect to computation time compared to other algorithms (Liu and Gong, 2011; Handy Permana et al., 2018). Although waypoints are simple and effective guidance tools, they must be integrated with collision avoidance path planning methods to be effective avoidance tools.
TCAS is a deterministic CAS that uses time-to-impact thresholds (Bourgeois, 2007; FAA, 2011) and airspace protection volumes to identify collisions and send advisories to pilots to resolve conflicts (ICAO, 2006; Kuchar and Drumm, 2007). Time-to-impact is used by TCAS to size three airspace protection volumes: the caution, warning, and collision areas. Avoidance responses escalate depending on the protection volume infringed. Intruders that violate caution area airspace trigger a traffic advisory (TA) to the pilot to assist in visually identifying the threat. Violating the warning area triggers a resolution advisory (RA) in the form of recommended climb or descent rates that pilots must execute to prevent collision (Kochenderfer and Chryssanthacopoulos, 2011; Tang et al., 2018).
Utilizing time-to-impact as a method of collision detection works well when the closure rates of the aircraft are large; however, as the closure rate approaches zero, the time-to-impact approaches infinity and becomes less useful for detecting collisions (Munoz et al., 2013; Lin et al., 2016). Aircraft approaching head-on regularly have high rates of closure, but overtaking collisions are much more likely to have a closure rate close to zero. TCAS combats the low rate of closure problem by implementing a distance modifier called “DMOD” that modifies the time-to-impact parameter. Modified time-to-impact measures the time until airspace separation drops below DMOD, which creates a protective airspace volume around the mission aircraft. Use of DMOD forces TCAS to send an RA when DMOD is violated by an intruder, which raises the issue of how large to make DMOD. A large DMOD increases the number of false collision alerts, while a small DMOD risks causing collisions due to a lack of avoidance time once a collision threat is detected.
TCAS has been proven to increase safety for aircraft with on-board pilots, but it was not designed for direct implementation on autonomous or remotely piloted systems (ICAO, 2006; ICAO, 2011; Tomić et al., 2022). False collision detections are more common in high-traffic density situations (Wang et al., 2021), such as those that may be experienced by UASs; requiring pilot intervention to execute RAs does not benefit autonomous systems. However, the success of TCAS with on-board piloted aircraft and the simplicity of its design make it attractive as a template for future UAS CASs.
PRACAS is a waypoint guided path planning CAS that simplifies the TCAS detection volumes into two-dimensional probability cones and utilizes waypoints and path planning to achieve autonomous collision avoidance (Browne et al., 2021). The TCAS protection volumes are simplified to detection cones governed by vehicle velocity, turn rate, and a specified look-ahead time. Detection cones are analogous to the TCAS warning area protection volume, while a circular area around the mission vehicle is similar to the TCAS caution zone (Browne et al., 2021). Contact between mission and intruder UAS detection cones triggers the collision resolution section of PRACAS. Probability cones are converted into KOZs ,and then, the A* path planner is used to find an avoidance path to a goal point placed along the planned mission path. Pseudo-code for this CAS method can be found in Browne et al. (2021).
Additional KOZs are necessary in some scenarios to avoid undesired avoidance actions, such as crossing maneuvers. Using KOZs to prevent collisions and undesired avoidance actions makes PRACAS a robust system with adjustable avoidance maneuvers that ensure that the shortest and safest paths are available to the mission UAS. However, PRACAS is a nascent system and has not been proven beyond the three test cases mentioned in Browne et al. (2021). Overtaking collisions are currently undetectable by PRACAS, although slow rate-of-approach issues present in TCAS are not applicable to PRACAS since time-to-impact is not considered. Its lack of inherent slow rate-of-approach failures make KOZs and detection cones useful tools for dealing with overtaking collision scenarios.
Overtaking collisions for UASs occur when an intruder aircraft approaches the mission aircraft from behind with a heading that makes an angle of less than 70° with the mission aircraft’s plane of symmetry (ICAO, 2005). Current CASs do not distinguish between overtaking collision scenarios and other collision scenarios but treat them like a head-on collision with a slow rate of approach. Typically, the slower aircraft is not responsible for avoiding an intruder overtaking it (ICAO, 2005; Electronic Code of Federal Regulations e-CFR, 2023), but UASs are required to give way to all other aircraft (LII, 2023). Since more specific right-of-way laws for UASs are yet to be implemented, UAS CAS must be able to identify and resolve overtaking collisions. PRACAS is a strong candidate for this since it does not rely on parameters such as time-to-impact that lose meaning as closure rates shrink (Manfredi and Jestin, 2016); however, it currently cannot detect overtaking collisions.
3 Methods
A meaningful investigation of the impact of geometric KOZs on overtaking collision scenarios for small, fixed-wing, autonomous uncrewed aircraft required utilizing an autonomous UAS CAS capable of reacting to KOZs. PRACAS was selected since it provided simple guidance in the form of waypoints and utilized KOZs with an optimal path planner to achieve conflict resolution. Using parameters such as PRACAS look-ahead time and UAS velocity, a set of KOZs was defined that provided a minimum of one wingspan of separation from the intruder aircraft in the overtaking scenario. Simulations were constructed using Dubins turn-rate constraints to determine the limits of the KOZ set with respect to the changing relative velocity, look-ahead time, and approach angle. Separation distance was measured at 100 Hz in each case to determine whether the minimum separation fell below the minimum value of one wingspan. Limits of each variable were measured to determine the range of effectiveness for the set of KOZs.
3.1 Detecting overtaking collisions
The detection of overtaking collisions was the first challenge in mitigating the overtaking scenario. The PRACAS method utilizes probability cones projected in front of all UASs involved to detect collisions. PRACAS probability cones are constructed using a cone radius (Rcone), which is calculated using velocity (v) and look-ahead time (ta), and a cone arc (ψcone) which is calculated using the UAS’s maximum turn rate
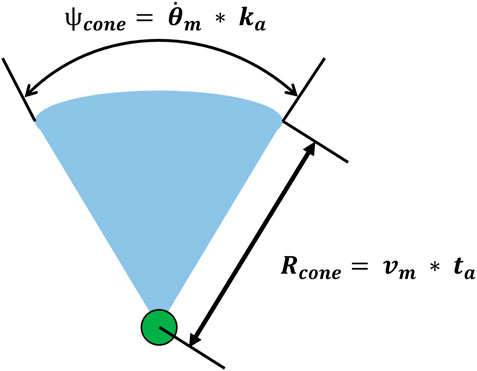
FIGURE 1. Parameters that describe a PRACAS probability cone.
Cone overlap determines the beginning of a collision scenario where PRACAS then converts the intruder probability cone into KOZ, which poses a problem in overtaking collision scenarios since the intruder cone envelops the mission UAV. Enveloping the mission UAV in the intruder KOZ causes PRACAS to fail to produce a solution since the starting location for the path planner resides within KOZ. With the mission UAS located inside KOZ, any action that A* could take would cause the mission UAS to “enter” a KOZ. Therefore, no action can be taken by A* to try and reach the goal point, causing it to fail to produce a solution. This can be solved by shrinking or removing the KOZ that results from the intruder cone (Figure 2).Shrinking the intruder KOZ in no way impacts the probability cone projected ahead of the intruder since the probability cone and the KOZs generated by PRACAS are handled in separate processes. Modifying the intruder cone KOZ enabled PRACAS to detect a possible collision using probability cone overlap in the overtaking scenario. However, PRACAS was still unable to react appropriately because it did not treat overtaking any differently than a head-on collision. Overtaking collisions were differentiated from head-on collisions by determining the approach angle of the intruder: if the intruder was approaching from behind at 110°–250° of the mission UAS heading, it was treated as an overtaking collision and the intruder cone KOZ was modified. Detecting overtaking collisions in this manner enabled PRACAS to distinguish overtaking collisions from other collision types and to take actions to resolve them once detected, but an additional KOZ was necessary to enable the mission UAS to avoid the intruder.
FIGURE 2. Example of shrinking the cone KOZ.
3.2 Dimensioning the set of KOZs
Once an overtaking collision is detected, the parameters used by PRACAS to construct the probability cones shown in Figure 1 are useful to determine a KOZ shape that will enable the mission UAS to alter its course to give way to the oncoming intruder. The concept of the KOZ is shown in Figure 3, where RI is the radius of the intruder’s probability cone.KOZ width can be defined by summing the width of both UAS collision cones. PRACAS calculates the width of the collision cones using Eq. 1:
where Rcone is the radius of the cone and
where subscript I refers to intruder UAS attributes and subscript M refers to mission UAS attributes.
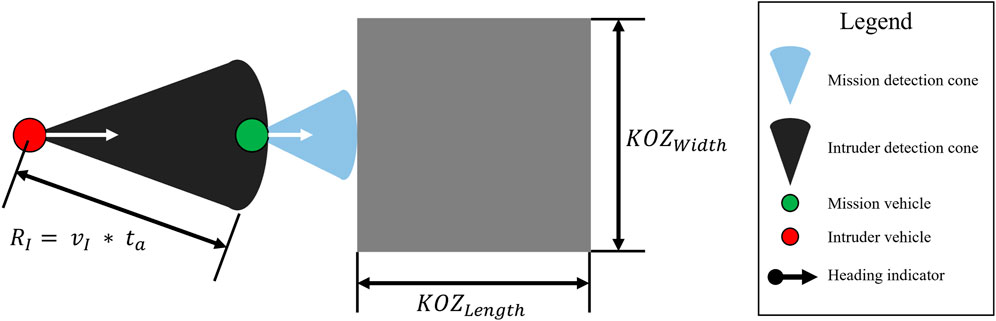
FIGURE 3. Example of an overtaking collision scenario with the proposed KOZ solution.
KOZ length can be determined by how much distance is required for the intruder to pass the mission aircraft. Once the overtaking scenario is detected, the intruder needs to traverse the total radii of their cone (vIta) and of the mission cone (vMta) to pass the mission aircraft. The goal of the mission aircraft is to reach the maximum width of the KOZ by the time the intruder catches up, which would result in the situation in Figure 4.
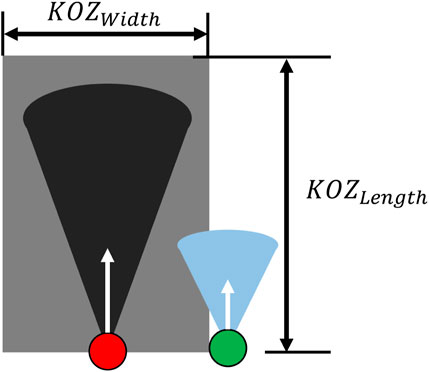
FIGURE 4. Main UAS position goal by the time the intruder has caught up.
Due to differences in speed, the main UAV would not be able to reach the full width of the KOZ in one look-ahead time step, and it would take the intruder only slightly longer than one look-ahead time to catch up with the mission UAS, depending on the turn rate capabilities of the main UAS. Thus, the situation presented in Figure 4 is a worst-case scenario for KOZ length and also a best-case scenario for KOZ width, meaning that it is the ideal position to determine a maximum necessary KOZ length. This is determined by the amount of time that the intruder takes to pass well clear of the mission UAS cone. Time-to-pass for the intruder is given in Eq. 3:
where vI is intruder UAS velocity, vM is mission UAS velocity, and ta is look-ahead time. The length of KOZ is the mission velocity multiplied by the time to pass, resulting in Eq. 4:
3.3 Placement of the KOZ
Identifying the location and orientation of KOZ relative to the mission UAS was the next challenge in defining a set of KOZs for overtaking collisions. The KOZ was placed at the end of the mission UAS probability cone to prompt immediate avoidance action once a collision was detected. Placing the KOZ too far ahead of the mission aircraft could cause the UAS to remain in the intruder’s flight path for longer than necessary, while placing the KOZ too close to the mission aircraft would generate paths that would require the mission UAS to turn more quickly than its turn rate capabilities would allow. Probability cones represent the states that the aircraft can reach in the given look-ahead time. By placing the KOZ at the end of the probability cone, immediate action is prompted while ensuring that mission turn-rate constraints are not violated by paths around the KOZ.
KOZ was fixed in front of the main UAV by only referencing the two vertexes closest to the mission UAS to the mission heading. The two vertexes furthest away from the mission UAS still used the intruder heading to shift the back of the box toward the heading of the intruder (Figure 5).Allowing the back vertexes to adjust to the intruder heading ensures that the KOZ does not keep the main UAS off the originally planned path for longer than necessary by applying the length of the KOZ in the direction of the intruder instead of in the direction of the main UAS.
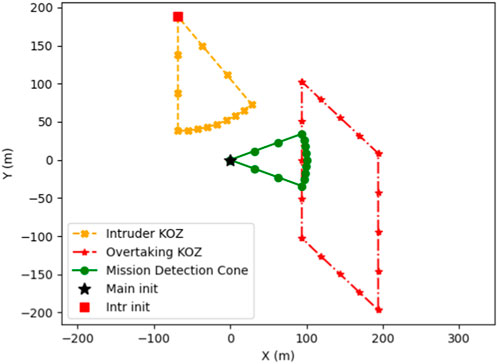
FIGURE 5. The KOZ is placed at the end of the mission cone and adapted to intruder heading.
3.4 Preventing crossing maneuvers
Initial data showed that, as approach angles grew further away from 180°, loss of separation occurred because of crossing maneuvers—maneuvers that cause the main UAS to pass in front of the intruder. This was because KOZ did not provide a directional preference for the avoidance maneuver, and A* optimizes only to the shortest path, not directional preferences. Discouraging crossing maneuvers required extending the KOZ in one direction or another to make A* prefer non-crossing maneuvers because they are shorter. KOZ was initially extended based on the position of the intruder, but this resulted in only preventing crossing maneuvers where the intruder would pass in front of the main UAS (Figure 6).
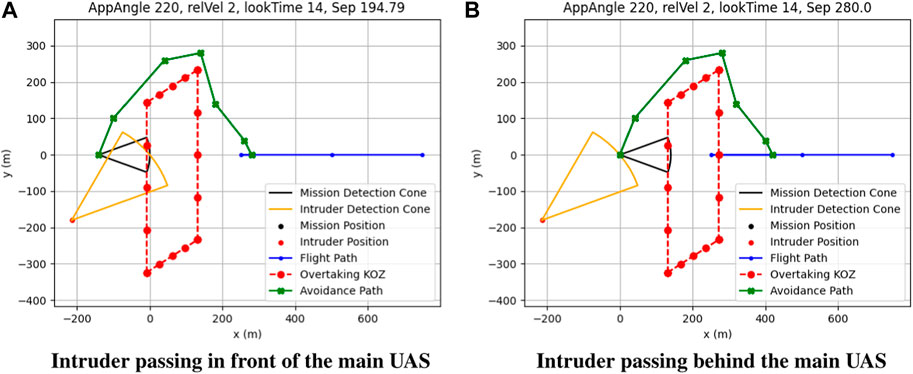
FIGURE 6. Overtaking collision with position-based crossing discouragement where the intruder passes in front of (A) and behind (B) the main UAS.
Preventing crossing maneuvers depended on both the position and the heading of the intruder relative to the main UAS. Adding this logic into the KOZ extension resulted in proper crossing discouragement for each scenario. The KOZ extension was based on the intruder position to scale the scenario to the size of the event so that the extension is not lost due to a low A* resolution in large collision events. Heading-based crossing maneuvers resulted in the KOZ extensions shown in Figure 7.
FIGURE 7. Overtaking collision with heading and position-based crossing discouragement where the intruder passes in front of (A) and behind (B) the main UAS.
3.5 Simulation setup
Simulations were constructed to evaluate the limits of KOZ described above with respect to the relative velocity, look-ahead time, and approach angle. Dubins constraints, where agents move in ideal circles while turning and in straight lines otherwise, were used to update the UASs involved in the simulations. A* was configured the same way as in Browne et al. (2021) using a 1,000 × 1,000 m grid size with grid vertexes in steps of 10 m. Each simulated scenario involved one uncooperative intruder UAS and one mission UAS capable of detecting and avoiding overtaking collisions using the set of KOZs and the process described above. Multiple overtaking collisions were not used since PRACAS had already shown its capabilities with multiple intruder scenarios (Browne et al., 2021). The main UAS had a velocity of 10 m per second in all simulated scenarios, which was chosen as a conservative estimate of UAS speed in the small UAS category defined by the United States Department of Defense (NIM-A DoD) (National Intelligence Manager for Aviation, 2023). Collision scenarios were started with the intruder probability cone in contact with the mission UAS and the intruder heading aimed at the mission aircraft. Aiming the intruder directly at the mission aircraft enabled exact control over the approach angle at the consequence of a non-zero separation at collision time for steep angles of the approach. The position of each UAS was updated at 100 Hz, and the separation distance was measured at each position update. The goal for the simulations was to maintain separation of the UASs above one standard wingspan, or 7.5 m (Weinert et al., 2022), of the mission aircraft. Falling below one standard wingspan was considered a mid-air collision, while falling below 15 m was considered a near mid-air collision (Weinert et al., 2022).
Relative velocity was varied from 2 to 20 in steps of 1 to identify the range of speeds in which the KOZ could maintain separation. Increasing the ratio of intruder velocity to mission velocity causes PRACAS probability cones for the intruder to increase in size, but the amount of time taken by the mission aircraft for avoidance after detection does not increase. The upper bound of the speed range was selected to represent the extreme scenario of a commercial airliner interacting with the PRACAS-equipped UAS, while the lower bound was selected because relative velocities below 2 and above 1 were highly sensitive to A* grid parameters and required a higher step resolution to examine. Relative velocities between 1.1 and 2.0 were then examined separately in steps of 0.1 to measure separation distance performance at low relative speeds.
Look-ahead time was varied 1–25 s in steps of 1 s to identify the effect of time-to-maneuver on the scenario. Probability cone size is directly proportional to look-ahead time, so increasing look-ahead time increases the distance between the two UASs without changing the speed differential. Browne et al. used a static PRACAS look-ahead time of 10 s in their work (Browne et al., 2021), so a floor of 1 s was used in this work to identify a minimum time to maneuver in low- and high-speed scenarios, while a ceiling of 25 s was used to identify unknown issues that may appear with large look-ahead times.
Approach angle—the relative angle from the mission heading to the intruder position—was varied from 110° to 250° (−110°) in increments of 1°. These approach angles comprise the definition of overtaking collisions used by the United States and put forth by ICAO (2005). Intruder heading was determined by the approach angle plus 180°, which enabled the starting approach angle to be exact. Each approach angle was simulated with each velocity with each look-ahead time.
3.6 Methods summary
Parameters for a set of KOZs that mitigated the overtaking scenario were identified by enabling detection of the overtaking scenario, determining the proper length and width of the KOZ based on PRACAS probability cone parameters, identifying the placement of the KOZ, and preventing crossing maneuvers that caused the main UAS to fly into the intruder. The length and width were calculated in Eqs 2, 4 using the velocities of each aircraft, the PRACAS look-ahead time, and the turn rate capabilities of each aircraft. KOZ was placed at the end of the main UAS probability cone to prompt immediate path deviation for the main UAS, and the furthest points of the KOZ were allowed to shift based on the intruder heading so that KOZ more accurately reflected the trajectory of the intruder aircraft, while the nearest points of KOZ were based on an intruder heading of zero so that KOZ always affected the mission aircraft flight path. Crossing maneuvers were prevented by extending KOZ to one side or another based on the position of the intruder and whether it was aimed in front of or behind the main UAS.
Simulations were constructed with one mission UAS and one uncooperative intruder UAS that varied in relative speed, look-ahead time, and approach angle to identify the operational limits of KOZ. Dubins constraints were used to update the UAS states, and simulations were started with the intruder in contact with and aimed at the mission UAS so that the approach angle could be precisely controlled. UAS position was updated at 100 Hz, and separation distance was measured at each update until separation distance started increasing, at which point the next scenario was started. Relative velocity was varied from 1 to 20 in steps of 1, look-ahead time was varied from 1 to 25 s in steps of 1 s, and the approach angle was varied from 110° to 250° in steps of 1°. Minimum separation distance was measured for each value of the three variables with the goal of maintaining at least one wingspan separation (7.5 m) at all times.
4 Results
Experiments were conducted at each unique combination of relative velocity, look-ahead time, and approach angle, and minimum separation distance data were collected, as shown in Figure 8. Overtaking collisions were simulated by placing an intruder so that its detection cone started in contact with the mission aircraft detection cone. Aircraft positions were updated at 100 Hz until the distance between the mission UAS and intruder UAS began increasing. Minimum separation distance for each scenario was recorded and compiled into surface plots where one variable was held constant and the other two were plotted along with the corresponding minimum separation distances. Examining these constant parameter surface plots can identify the performance of the KOZ solution in the overtaking scenario.
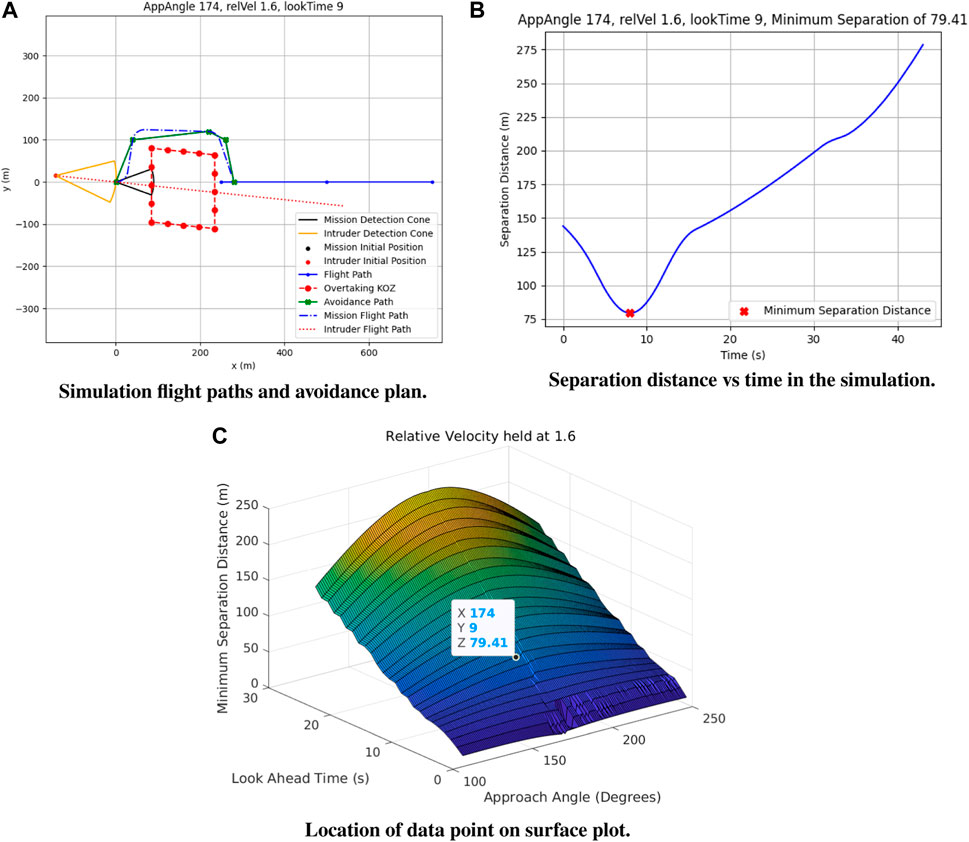
FIGURE 8. Example simulation and data collection showing the simulation flight paths (A), data collected throughout the simulation (B), and how that data was compiled to examine trends in separation distance (C).
4.1 High rate of approach
Relative velocity was increased in steps of 1 from 2 to 20 to identify the effect of speed difference on the overtaking KOZ. Plots were constructed by fixing relative velocity and plotting all minimum separation distance values at each look-ahead time and approach angle value. Figure 9 shows the minimum separation distance for all combinations of the look-ahead time and approach angle when the intruder was moving at twice the speed of the mission aircraft.
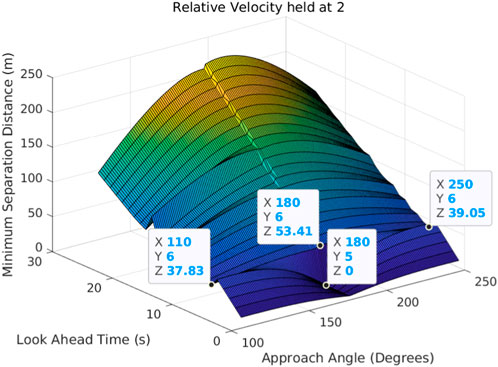
FIGURE 9. Separation distance (Z-axis) with respect to the look-ahead time (Y-axis) and approach angle (X-axis) with a relative velocity of 2.
Minimum separation distance increases with look-ahead time, showing that higher separation distances are directly proportional to the amount of time taken by the mission vehicle to maneuver. Intruders approaching from angles at or near 180° would pass by the mission UAS with very small minimum separation distances if no avoidance action was taken; however, when using the overtaking KOZ intruder, approach angles close to 180° result in the highest minimum separation distances of all approach angles. This is significant as it shows that the overtaking KOZ is highly effective in the worst-case scenarios where intruders are approaching from directly behind at high speeds. Look-ahead times at and below 5 s show a sharp drop in minimum separation distance near a 180° intruder approach angle, unlike at higher look-ahead times, because the mission aircraft does not have enough time to move out of the way at 5 s and below of look-ahead time. Utilizing look-ahead times above 5 s is necessary for UAS to maintain higher than the desired aerial separation of 7.5 m.
The same trends identified in Figure 9 are present in relative velocities ranging from 2 to 10, but relative velocities of 10 and above have features not present at lower relative velocities. High relative velocity and high look-ahead time combinations result in the loss of separation at very shallow angles of attack, while higher separation occurs at steep angles of attack (Figure 10).
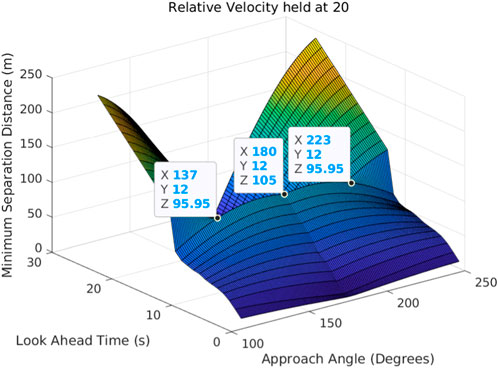
FIGURE 10. Separation distance (Z-axis) with respect to the look-ahead time (Y-axis) and approach angle (X-axis) with a relative velocity of 20.
Minimum separation distance at 20 relative velocity follows the trends identified at lower relative velocities up to a look-ahead time of 12 s, where the trend reverses so that loss of separation occurs at angles of approach close to 180°. This is due to the KOZ being too large to fit inside the A* search grid above 12 s of look-ahead time, which caused the mission vehicle to take no avoidance action. KOZs that exceed the search grid cause no avoidance action being taken since A* cannot find a path from the starting point to the goal point.
The overtaking KOZ is effective at high speeds only for look-ahead times at or below 12 s and above 5 s. This threshold expands as relative speeds go down from 20 to 10 (Figure 11), where KOZ is effective at look-ahead times between 5 and 24 s as the loss of separation does not occur until 25 s of look-ahead time.
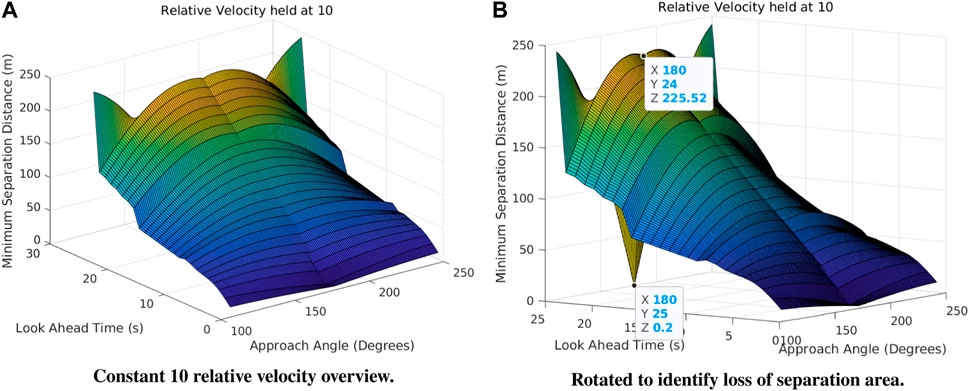
FIGURE 11. Separation distance (Z-axis) with respect to the look-ahead time (Y-axis) and approach angle (X-axis) with a relative velocity of 10 both as an overview (A) and (B).
Examining constant look-ahead time plots further explains the trends found in the constant relative velocity data. Low look-ahead times resulted in little to no avoidance action being taken, resulting in low separation distances (Figure 12A). Identifying collisions with only 1 s to maneuver does not give the mission aircraft enough time to avoid the intruder, which can be seen since the maximum separation distance that occurs in Figure 12A is 10 m. Figure 12B shows that avoidance actions started being taken at 5 s of look-ahead time since the separation distance does not follow the same trend as Figure 12A. Five seconds of look-ahead time is sufficient for avoidance at all relative velocities except the lowest, where there are still separation distances indicating a collision. Low relative velocities and low look-ahead time combinations cause the radius of the PRACAS probability cones to be small, which leads to low minimum separation distances since collision events are not detected until the intruder is very close to the mission aircraft. Relative velocities above 2 show nearly constant minimum separation distance from 110° to 250°, demonstrating that relative velocity has little to no effect on separation distance.
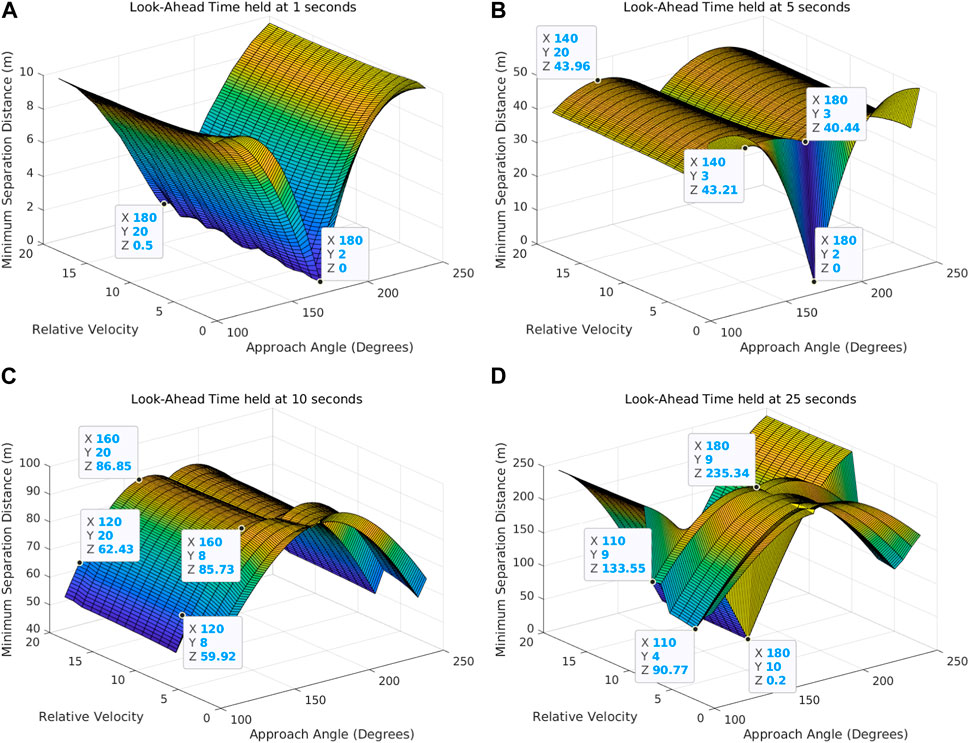
FIGURE 12. Minimum separation distance (Z-axis) with respect to the relative velocity (Y-axis) and approach angle (X-axis) when look-ahead time is constant at 1 s (A), 5 s (B), 10 s (C), and 25 s (D).
Higher look-ahead times resulted in higher separation distances (Figure 12C), which agrees with the results obtained from examining the relative velocity data. Look-ahead times of 10 s and above perform better at lower relative velocities, as shown by the ridge in Figure 12C at low relative velocities. Figure 12C also shows that the separation distance remains relatively constant across the range of relative velocities, indicating that the primary determining factor of separation distance in the overtaking scenario is look-ahead time and not relative velocity.
Longer look-ahead times increase airspace separation but can also lead to KOZ outgrowing the A* search space. A* requires a finite search space to identify a path from the start point to the goal point, and excessive look-ahead times can cause the KOZ to grow outside of this finite search space, resulting in the separation distance decreasing at high speed and look-ahead time combinations (Figure 12D). This separation loss at high look-ahead time and relative velocity combinations created the upper limit for the relative velocity at high look-ahead times—nine times the speed of the mission aircraft.
4.2 Slow rate of approach
Overtaking scenarios with relative velocities ranging from 1.1 to 2.0 in steps of 0.1 were simulated to identify the capabilities of the developed KOZ set in slow rate-of-approach situations. Similar trends are present in these as in high rate-of-approach simulations. Higher look-ahead times result in higher separation distances, and a minimum look-ahead time of 4 s is required to maintain the goal of 7.5 m separation. Relative velocities between 1.4 and 1.9 show almost identical trends in separation distance, which can be seen by comparing Figures 13A, B.
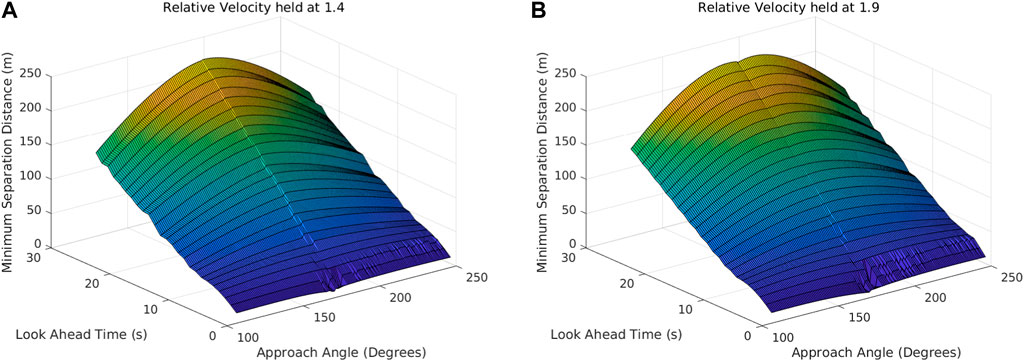
FIGURE 13. Minimum separation distance (Z-axis) with respect to the look-ahead time (Y-axis) and approach angle (X-axis) when the velocity is held constant at 1.4 (A) and 1.9 (B).
The results from relative velocities of 1.4–1.9 agree with high velocity results, although the minimum look-ahead time shrinks for slow rate-of-approach simulations, since lower relative velocities result in more time-to-avoid once a collision is detected. Look-ahead times of 4 s and above are consistently capable of providing adequate separation in the overtaking scenario for relative velocities of 1.4–1.9 compared to a minimum look-ahead time of 5 s for relative velocities of 2 and above. Minimum look-ahead time continues to decrease as the relative velocity decreases, with the minimum look-ahead time at a relative velocity of 1.1 being 2 s.
Like relative velocities greater than 10, relative velocities less than 1.4 identify a maximum look-ahead time that can avoid all approach angles in the overtaking range. Figure 14A shows that at a relative velocity of 1.3, look-ahead times above 21 s cannot maintain separation for approach angles of 163°–197°.
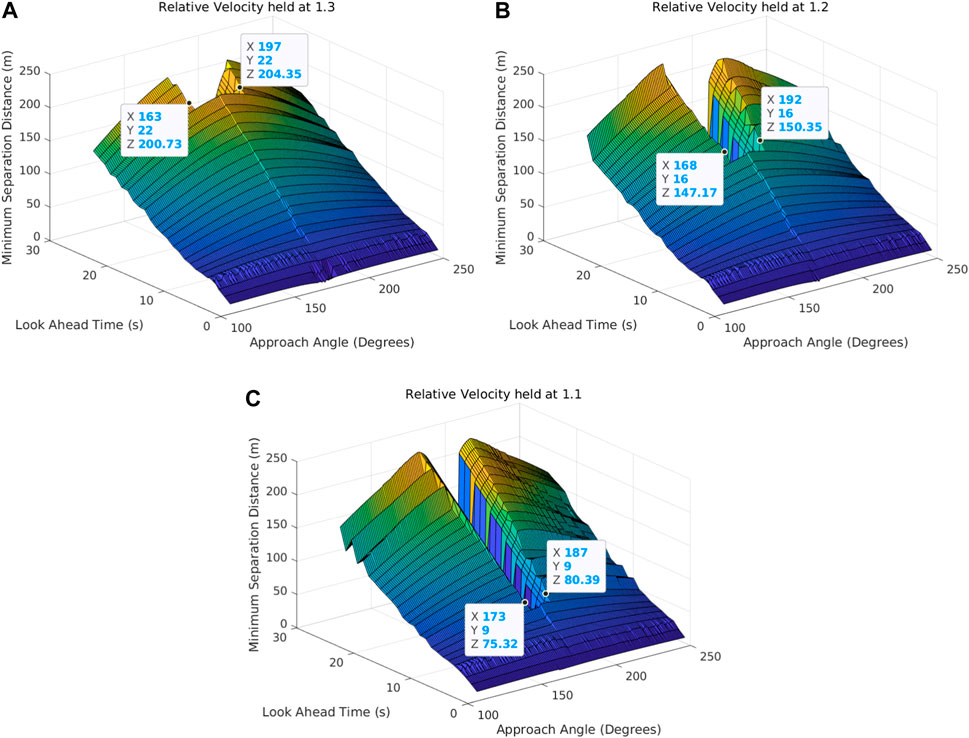
FIGURE 14. Minimum separation distance (Z-axis) with respect to the look-ahead time (Y-axis) and approach angle (X-axis) when the relative velocity is constant at 1.3 (A), 1.2 (B), and 1.1 (C).
Maximum look-ahead time decreases to 15 s for 1.2 relative velocity and 8 s for 1.1 relative velocity (Figures 14B, C, respectively). The overtaking KOZ is unable to maintain minimum airspace separation for collisions involving relative velocities of 1.2 and look-ahead times greater than 15 s when the intruder approaches at 168°–192°. Overtaking collision scenarios involving relative velocities of 1.1 and look-ahead times greater than 8 s also do not meet the minimum airspace separation requirements for approach angles between 173° and 187°.
The loss of separation that occurs at look-ahead times above their maximum is caused by the KOZ outgrowing the A* search grid, as shown in the simulation snapshots in Figure 15. The simulation shown in Figure 15A is conducted at a 173° approach angle, which is outside the loss-of-separation zone identified in the goal point in Figures 14A, C. One degree closer to 180°, however, and the KOZ envelops much of the path and prevents a goal point from being placed.
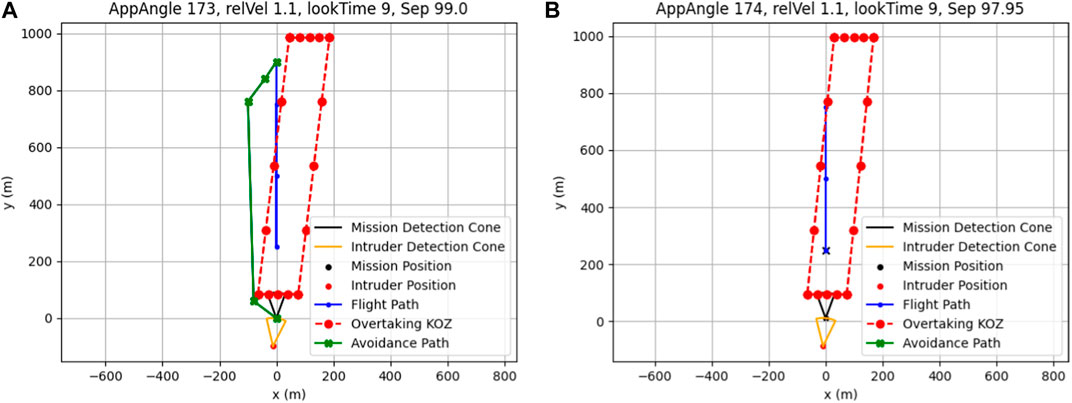
FIGURE 15. Look-ahead times above 8 s will produce an avoidance path if the approach angle is less than 174° (A), but fail to produce an avoidance path from 174° (B) to 187° at 1.1 relative velocity.
The KOZ length increases greatly as relative velocity approaches 1 since the intruder will require more time to pass the mission aircraft once the latter has given way. Large look-ahead times also factor into the length of the KOZ since it affects the distance that must be covered by the intruder from the time of detection until the time that the mission aircraft is well-clear of a collision. Large KOZ lengths cause the end of the KOZ to extend past the length of the A* search grid, resulting in no valid goal point being selected and, therefore, no valid path being generated.
4.3 Summary and discussion
Simulations of overtaking scenarios were conducted where the relative velocity, look-ahead time, and intruder approach angle were varied over expected overtaking collision scenario ranges. Airspace separation was measured for each combination of relative velocity, look-ahead time, and intruder approach angle at 100 Hz until the distance began to increase. Minimum separation distance data were collected and plotted by fixing one variable and plotting the other two in surface plots versus minimum separation. Separation distance was primarily influenced by the look-ahead time and approach angle. Intruder relative velocity and mission look-ahead time values that enabled the mission aircraft to avoid an overtaking collision are summarized in Figure 16, where green cells represent look-ahead time and relative velocity combinations that were able to maintain airspace separation for all intruder approach angles, and red cells represent combinations that experienced a loss of separation at one or more intruder approach angles.
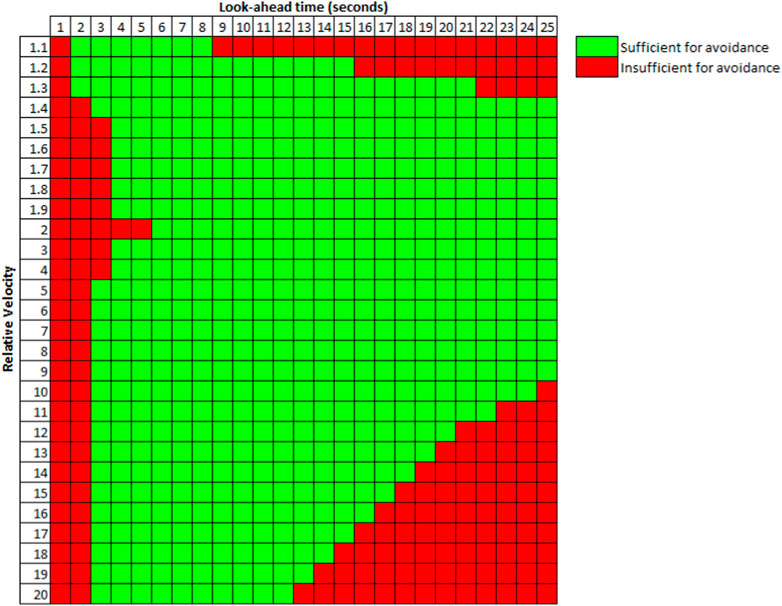
FIGURE 16. Summary of the look-ahead time and relative velocity limits for maintaining 7.5 m of airspace separation in all intruder approach angles.
Look-ahead times from 5–8 s maintained the minimum separation of 7.5 m or above for each tested overtaking scenario. Airspace separation was maintained for relative velocities 2–20 and all approach angles at look-ahead times between 5 and 12 s. Overtaking collisions involving relative velocities between 1.4 and 9 were solvable using all look-ahead times above 5 s. Slow rate-of-approach overtaking collisions involving relative velocities 1.1–2.0 could be solved for look-ahead times of 2–8 s for all approach angles. Using geometric KOZs on the overtaking scenario for UASs enabled the mission UAS to maintain airspace separation in a wide range of relative velocities, look-ahead times, and all approach angles that define the overtaking scenario. Tuning the look-ahead time and A* search grid size to mission requirements would result in the highest separation distances, but overtaking collisions between 1.1 and 20 relative velocity and all approach angles 110°–250° can be avoided with greater than one wingspan minimum separation without tuning PRACAS, so long as the look-ahead time is set to 5–8 s.
5 Conclusion
This work investigated geometric KOZ generation techniques for overtaking collision scenarios involving two small, fixed-wing, uncrewed aircraft. Current methods of solving overtaking collisions involve pilot advisories, which do not benefit autonomous UASs, or nonspecific guidance, which is vulnerable to error from outside sources such as wind or sensor error. PRACAS offers well-defined flight paths using waypoint guidance with path planners, but it does not currently provide adequate guidance for, or detect, all collision scenarios. This work produced a novel set of KOZs specific to the overtaking scenario. PRACAS probability cone parameters were used to define a set of KOZ shapes that were iterated based on initial separation distance data. Operational limits of the KOZ set were assessed by simulating the overtaking scenario for a wide range of parameters. Parameters that were varied included relative velocity, PRACAS look-ahead time, and intruder angle of attack defined as “overtaking” by the ICAO.
Overtaking collisions with ranges of relative velocities between 1 and 20, PRACAS look-ahead times between 1 and 25, and intruder angles of attack between 110° and −110° of the main UAS heading were simulated to evaluate the operational limits of the KOZ set. The minimum separation distance was measured for each simulated scenario with the goal of maintaining at least one wingspan, or 7.5 m, of separation. Separation distance was most sensitive to changes in look-ahead time, which is closely related to the amount of time that the main UAS had to maneuver. Look-ahead times of less than 5 s resulted in the catastrophic loss of separation for some tested relative velocities, while look-ahead times between 5 and 12 s maintained separation for relative velocities of 2–20. Loss of separation occurred at high relative velocities when combined with high look-ahead times, where KOZ grew too wide and passed outside of the PRACAS A* search grid, causing the UAS to take no avoidance action. Low relative velocities introduced zones where separation loss occurred due to KOZ growing too long and passing outside the A* search grid. Tuning the A* search grid to mission needs would prevent these zones from causing collisions, but, without tuning, the KOZ was able to maintain airspace separation at all tested relative velocities and approach angles using look-ahead times between 5 and 8 s. This method, when used in conjunction with waypoint following autopilots, is capable of maintaining a minimum separation distance above one wingspan in overtaking collision scenarios for look-ahead times between 5 and 12 s in relative velocities above 2 and for look-ahead times between 2 and 8 s for all relative velocities between 1.1 and 2.
Future work on this project would involve increasing the fidelity of the simulations to identify bank angle and speed-loss effects on separation distance in the overtaking scenario. Flight tests of the overtaking scenario would then be conducted to identify performance issues arising from hardware integration.
Data availability statement
The raw data supporting the conclusion of this article will be made available by the authors, without undue reservation.
Author contributions
NH: conceptualization, investigation, methodology, software, writing–original draft, and writing–review and editing. JW: funding acquisition, project administration, resources, supervision, and writing–review and editing.
Funding
The author(s) declare that financial support was received for the research, authorship, and/or publication of this article. This work was supported by the Ohio Federal Research Network through the project “Resilient and enhanced security UAS flight control” and by Asymmetric Technologies.
Conflict of interest
The authors declare that the research was conducted in the absence of any commercial or financial relationships that could be construed as a potential conflict of interest.
The author(s) declared that they were an editorial board member of Frontiers at the time of submission. This had no impact on the peer review process and the final decision.
Publisher’s note
All claims expressed in this article are solely those of the authors and do not necessarily represent those of their affiliated organizations, or those of the publisher, the editors, and the reviewers. Any product that may be evaluated in this article, or claim that may be made by its manufacturer, is not guaranteed or endorsed by the publisher.
References
Alvarez, L. E., Jessen, I., Owen, M. P., Silbermann, J., and Wood, P. (2019). “ACAS sXu: robust decentralized detect and avoid for small unmanned aircraft systems,” in 2019 IEEE/AIAA 38th Digital Avionics Systems Conference (DASC), San Diego, CA, USA, 08-12 September 2019 (IEEE), 1–9. doi:10.1109/DASC43569.2019.9081631
Blaich, M., Rosenfelder, M., Schuster, M., Bittel, O., and Reuter, J. (2012). “Fast grid based collision avoidance for vessels using A* search algorithm,” in 2012 17th International Conference on Methods & Models in Automation & Robotics (MMAR), Miedzyzdroje, Poland, 27-30 August 2012 (IEEE), 385–390. doi:10.1109/MMAR.2012.6347858
Bourgeois, B. S. (2007). Using range and range rate for relative navigation. Naval Research Laboratory Stennis Space Center, MS: Defense Technical Information Center. Avaliable at: http://www.dtic.mil/docs/citations/ADA472033.
Browne, J. P., Neuhart, C., Moleski, T. W., and Wilhelm, J. (2021). “Minimal deviation from mission path after automated collision avoidance for small fixed wing UAVs,” in AIAA SCITECH 2022 forum (San Diego, CA & Virtual: American Institute of Aeronautics and Astronautics). doi:10.2514/6.2022-0275
Chandler, P., Rasmussen, S., and Pachter, M. (2000). “UAV cooperative path planning,” in AIAA guidance, navigation, and control conference and exhibit (Dever,CO,U.S.A: AIAA), 4370.
Dang, A. D., La, H. M., Nguyen, T., and Horn, J. (2019). Formation control for autonomous robots with collision and obstacle avoidance using a rotational and repulsive force–based approach. Int. J. Adv. Robotic Syst. 16 (3), 172988141984789. doi:10.1177/1729881419847897
Dong, G., Yang, F., Tsui, K.-L., and Zou, C. (2020). Active balancing of lithium-ion batteries using graph theory and A-star search algorithm. IEEE Trans. Industrial Inf. 17 (4), 2587–2599. doi:10.1109/tii.2020.2997828
Duchoň, F., Babinec, A., Kajan, M., Beňo, P., Florek, M., Fico, T., et al. (2014). Path planning with modified a star algorithm for a mobile robot. Procedia Eng. 96, 59–69. doi:10.1016/j.proeng.2014.12.098
Electronic Code of Federal Regulations (e-CFR) (2023). 14 eCFR 91.113 – right-of-way Rules: except water operations. Avaliable at: https://www.ecfr.gov/current/title-14/chapter-I/subchapter-F/part-91/subpart-B/subject-group-ECFRe4c59b5f5506932/section-91.113.
English, J., and Wilhelm, J. (2020). “Collision avoidance in OpenUxAS,” in AIAA scitech 2020 forum (Orlando, FL: American Institute of Aeronautics and Astronautics). doi:10.2514/6.2020-0880
FAA (2011). Introduction to TCAS II: version 7.1. Washington, DC, USA: Federal Aviation Administration.
Goerzen, C., Kong, Z., and Mettler, B. (2010). A survey of motion planning algorithms from the perspective of autonomous UAV guidance. J. Intelligent Robotic Syst. 57 (1), 65–100. doi:10.1007/s10846-009-9383-1
Handy Permana, S. D., Yogha Bintoro, K. B., Arifitama, B., and Syahputra, A. (2018). Comparative analysis of pathfinding algorithms A* dijkstra, and BFS on maze runner game. IJISTECH Int. J. Inf. Syst. Technol. 1 (2), 1. doi:10.30645/ijistech.v1i2.7
Hart, P. E., Nilsson, N. J., and Raphael, B. (1968). A formal basis for the heuristic determination of minimum cost paths. IEEE Trans. Syst. Sci. Cybern. 4, 100–107. doi:10.1109/tssc.1968.300136
ICAO (2005). Annex 2 to the convention on international Civil aviation: rules of the air. Montreal, Quebec, Canada: International Civil Aviation Organization.
ICAO (2006). Airborne collision avoidance system (ACAS) manual. Montreal, Quebec, Canada: International Civil Aviation Organization.
ICAO (2011). “Operations: collision avoidance,” in Unmanned aircraft systems (UAS). Montreal, Quebec, Canada: International Civil Aviation Organization.
Kaminer, I., Pascoal, A., Hallberg, E., and Silvestre, C. (1998). Trajectory tracking for autonomous vehicles: an integrated approach to guidance and control. J. Guid. Control, Dyn. 21 (1), 29–38. doi:10.2514/2.4229
Kandil, A. A., Wagner, A., Gotta, A., and Badreddin, E. (2010). “Collision avoidance in a recursive nested behaviour control structure for unmanned aerial vehicles,” in 2010 IEEE International Conference on Systems, Man and Cybernetics, Istanbul, Turkey, 10-13 October 2010 (IEEE), 4276–4281.
Khatib, O. (1986). Real-time obstacle avoidance for manipulators and mobile robots. Int. J. robotics Res. 5 (1), 90–98. doi:10.1177/027836498600500106
Kochenderfer, M. J., and Chryssanthacopoulos, J. (2011). Robust airborne collision avoidance through dynamic programming. Washington, D.C: Massachusetts Institute of Technology, Lincoln Laboratory, Project Report ATC-371.
Kochenderfer, M. J., and Chryssanthacopoulos, J. P. (2013). “Collision avoidance using partially controlled markov decision processes,” in Agents and artificial intelligence. Editors J. Filipe, and A. Fred (Berlin, Heidelberg: Springer), 86–100. doi:10.1007/978-3-642-29966-7_6
Kuchar, J., and Drumm, A. C. (2007). The traffic alert and collision avoidance system. Linc. laboratory J. 16 (2), 277.
Kunchev, V., Jain, L., Ivancevic, V., and Finn, A. (2006). “Path planning and obstacle avoidance for autonomous mobile robots: a review,” in Proceedings, Part II 10 knowledge-based intelligent information and engineering systems: 10th international conference, KES 2006 (Bournemouth, UK: Springer), 537–544.
Kusuma, M., Riyanto, E., and Machbub, C. (2019). “Humanoid robot path planning and rerouting using A-Star search algorithm,” in 2019 IEEE International Conference on Signals and Systems (ICSigSys), Bandung, Indonesia, 16-18 July 2019 (IEEE), 110–115.
Le, A., Prabakaran, V., Sivanantham, V., and Mohan, R. (2018). Modified A-star algorithm for efficient coverage path planning in tetris inspired self-reconfigurable robot with integrated laser sensor. Sensors 18 (8), 2585. doi:10.3390/s18082585
LII (2023). 14 eCFR 107.37 – operation near aircraft: right-of-way rules. Avaliable at: https://www.ecfr.gov/current/title-14/chapter-I/subchapter-F/part-107/subpart-B/section-107.37.
Lim, S., and Bang, H. (2009). “Waypoint guidance of cooperative UAVs for intelligence, surveillance, and reconnaissance,” in 2009 IEEE International Conference on Control and Automation, Christchurch, New Zealand, 09-11 December 2009 (IEEE), 291–296.
Lin, C. E., Hung, T.-W., and Chen, H.-Y. (2016). TCAS algorithm for general aviation based on ADS-B. Proc. Institution Mech. Eng. Part G J. Aerosp. Eng. 230 (9), 1569–1591. doi:10.1177/0954410016631974
Liu, X., and Gong, D. (2011). “A comparative study of A-star algorithms for search and rescue in perfect maze,” in 2011 International Conference on Electric Information and Control Engineering, Wuhan, China, 15-17 April 2011 (IEEE), 24–27. doi:10.1109/ICEICE.2011.5777723
Manfredi, G., and Jestin, Y. (2016). “An introduction to ACAS xu and the challenges ahead,” in 2016 IEEE/AIAA 35th Digital Avionics Systems Conference (DASC), Sacramento, CA, USA, 25-29 September 2016 (IEEE), 1–9.
Milutinović, D., Casbeer, D., Cao, Y., and Kingston, D. (2017). Coordinate frame free Dubins vehicle circumnavigation using only range-based measurements. Int. J. Robust Nonlinear Control 27 (16), 2937–2960. doi:10.1002/rnc.3718
Munoz, C., Narkawicz, A., and Chamberlain, J. (2013). “A TCAS-II resolution advisory detection algorithm,” in AIAA guidance, navigation, and control (GNC) conference (USA: American Institute of Aeronautics and Astronautics). doi:10.2514/6.2013-4622
National Intelligence Manager for Aviation (2023). UAS categories. Avaliable at: https://www.airdomainintelligence.mil/Global-Air-Hub/Unmanned-Aircraft-System-UAS/UAS-Categories/.
Osborne, J., and Rysdyk, R. (2005). “Waypoint guidance for small UAVs in wind,” in Infotech@ Aerospace (Arlington, Virginia: American Institute Aeronautics and Astronautics AIAA), 6951.
Owen, M. P., Panken, A., Moss, R., Alvarez, L., Leeper, C., and Xu, ACAS (2019). “Integrated collision avoidance and detect and avoid capability for UAS,” in 2019 IEEE/AIAA 38th Digital Avionics Systems Conference (DASC), San Diego, CA, USA, 08-12 September 2019 (IEEE), 1–10. doi:10.1109/DASC43569.2019.9081758
Park, S., Deyst, J., and How, J. (2004). “A new nonlinear guidance logic for trajectory tracking,” in AIAA guidance, navigation, and control conference and exhibit (Providence, Rhode Island: AIAA), 4900.
Park, S., Deyst, J., and How, J. P. (2007). Performance and lyapunov stability of a nonlinear path following guidance method. J. Guid. Control, Dyn. 30 (6), 1718–1728. doi:10.2514/1.28957
Richards, A., Bellingham, J., Tillerson, M., and How, J. (2002). “Coordination and control of multiple UAVs,” in AIAA guidance, navigation, and control conference and exhibit (Monterey, California: AIAA), 4588.
Tang, J., Zhu, F., and Piera, M. A. (2018). A causal encounter model of traffic collision avoidance system operations for safety assessment and advisory optimization in high-density airspace. Transp. Res. Part C Emerg. Technol. 96, 347–365. doi:10.1016/j.trc.2018.10.006
Tomić, L., Čokorilo, O., Vasov, L., and Stojiljković, B. (2022). ACAS installation on unmanned aerial vehicles: effectiveness and safety issues. Aircr. Eng. Aerosp. Technol. 94 (8), 1252–1262. doi:10.1108/AEAT-10-2021-0313
Tseng, F. H., Liang, T. T., Lee, C. H., Chou, L. D., and Chao, H. C. (2014). “A star search algorithm for Civil UAV path planning with 3G communication,” in 2014 Tenth International Conference on Intelligent Information Hiding and Multimedia Signal Processing, Kitakyushu, Japan, 27-29 August 2014 (IEEE), 942–945. doi:10.1109/IIH-MSP.2014.236
Valenti, M., Bethke, B., Fiore, G., How, J., and Feron, E. (2006). “Indoor multi-vehicle flight testbed for fault detection, isolation, and recovery,” in AIAA guidance, navigation, and control conference and exhibit (Keystone, Colorado: AIAA), 6200.
Wang, S., Zhong, Y., and Dong, L. (2021). “Research on TCAS alert of high elevation airport,” in 2021 IEEE 3rd International Conference on Civil Aviation Safety and Information Technology (ICCASIT), Changsha, China, 20-22 October 2021 (IEEE), 232–235. doi:10.1109/ICCASIT53235.2021.9633605
Keywords: overtaking collision, uncrewed aircraft systems, autonomous collision avoidance, small UAS, collision avoidance, collision detection, slow rate of approach, autonomy
Citation: Hawes NC and Wilhelm JP (2023) Overtaking collision avoidance for small autonomous uncrewed aircraft using geometric keep-out zones. Front. Aerosp. Eng. 2:1334291. doi: 10.3389/fpace.2023.1334291
Received: 06 November 2023; Accepted: 23 November 2023;
Published: 18 December 2023.
Edited by:
Chengxi Zhang, Jiangnan University, ChinaReviewed by:
Jiashan Cui, Xidian University, ChinaWeijia Lu, Jiangnan University, China
Wei Xue, Jiangnan University, China
Copyright © 2023 Hawes and Wilhelm. This is an open-access article distributed under the terms of the Creative Commons Attribution License (CC BY). The use, distribution or reproduction in other forums is permitted, provided the original author(s) and the copyright owner(s) are credited and that the original publication in this journal is cited, in accordance with accepted academic practice. No use, distribution or reproduction is permitted which does not comply with these terms.
*Correspondence: Nathaniel C. Hawes, bmg5Nzk0MTZAb2hpby5lZHU=; Jay P. Wilhelm, d2lsaGVsajFAb2hpby5lZHU=