 Caleb Van Beck
 Venkat Raman
- Advanced Propulsion Concepts Laboratory, Department of Aerospace Engineering, University of Michigan, Ann Arbor, MI, United States
High-fidelity simulations of RDEs with H2-Air-NOx chemistry are employed to study NOx emissions in such devices. Discrete injection of gaseous hydrogen fuel and continuous injection of air oxidizer is used at various mass flow rate conditions in several 3D RDE simulations to understand resulting NOx production behaviors. Simulations are also performed for two different injector configurations, one in which air is injected axially into the detonation chamber [Axial Air Inlet (AAI)] and one in which air is injected radially [Radial Air Inlet (RAI)]. It is seen that the AAI RDE produces much less NOx than the RAI RDE, mainly due to the weaker waves seen in this system as a result of parasitic combustion losses from product gas recirculation. Parasitic combustion does lead to NOx formation in its own right, but the emissions levels from this process are negligible compared to emissions stemming directly from detonation processes. In regards to detonation strength in particular, it is generally seen that detonation strength increases with increasing mass flow rate, in turn increasing peak pressure, peak heat release and NOx emissions levels. Nevertheless, even the highest recorded NOx levels at the combustor exit in this study remain on the same order of magnitude as compared to gas turbine exhaust emissions levels, supporting the claim that significant differences between detonative and deflagrative combustion do not necessarily lead to significant differences in NOx levels. Overall, this study provides greater understanding into the behaviors of NOx formation in RDEs and how these behaviors are affected by changes in operating parameters.
1 Introduction
Rotating detonation engines (RDEs), which were initially researched several decades ago, are now an important subject again in modern combustion research. Taking advantage of the detonation-based thermodynamic cycle Anand and Gutmark, (2019), Raman et al. (2023), RDEs employ self-sustained detonation waves to process fuel-oxidizer mixture into products. The resulting energy release from this process helps to fuel the waves’ propagation and increases the fluid’s dynamic pressure, allowing for it to later be expanded and useful work to be extracted. The ability of RDEs to increase thermodynamic efficiency Anand and Gutmark (2019), take on multiple unique form factors Bykovskii et al. (2006), and provide compact energy release Wolański (2013) makes them an attractive option for applications ranging from rocket propulsion Buyakofu et al. (2022) to power generation (Athmanathan et al., 2019). This work focuses on power generation, where RDEs can potentially replace conventional lean-premixed swirl combustors. Although thermal efficiency is important in such application, another crucial consideration is the emissions of nitrogen oxides from the engine, which are generally referred to as NOx.
The flowpaths of RDEs and deflagration-driven gas turbines are inherently different, as RDE flows experience large, unsteady changes in pressure and temperature in addition to possibly reaching sonic conditions before exiting the combustor. These extreme conditions within RDEs can adversely affect NOx formation, as it is highly susceptible to temperature and combustor residence time. Interestingly, prior computational studies Schwer and Kailasanath (2016) have shown that shorter residence times in RDEs reduce NOx emissions, and no significant formation is observed even with the use of hydrogen fuel at stoichiometric conditions. However, this study used an ideal, simplified RDE design involving two-dimensional geometry and continuous premixed fuel and air injection. More recently, there is experimental evidence that NOx emissions are generally low even in a practical RDE setup (Ferguson et al., 2020). These studies indicate the general hypothesis that the reduced residence time prevents large quantities of emissions from being generated. However, a comprehensive analysis of the formation mechanisms and the influence of the internal flow field has not been carried out.
Practical RDEs involve non-premixed fuel-air injection, with separate injection ports for the gases, which prevents detonation flashback into the feed plenums (Anand and Gutmark, 2019; Wolański, 2013; Raman et al., 2023). As such, practical RDEs are limited by fuel/oxidizer mixing within the combustor, with the injection process greatly influencing flow structure, residence time, and detonation strength inside the detonation chamber (Prakash et al., 2020). However, the unique nature of discrete injection RDEs involves the blockage of injectors due to passing detonation waves. The higher pressure behind the detonation wave temporarily impedes fuel injection until the post-wave gases eventually expand, reducing pressure and reestablishing flow (Sato et al., 2018; Sato, 2020; Sato et al., 2021a). This unsteady behavior of injector flow can cause significant variations in local equivalence ratio, which have been found to directly contribute to variable detonation speeds and strengths (Prakash and Raman, 2021; Sato et al., 2021a). Possible phenomena stemming from these flow characteristics include premature deflagration, post-detonation combustion, and general incomplete fuel/oxidizer mixing (Raman et al., 2023). Since NOx production is highly sensitive to local temperature, these spatial and temporal variations in thermochemical composition within the RDE can affect net emissions.
With this background, the basis of this work is to evaluate NOx emissions in practical RDE configurations using a computational approach. Hydrogen-air mixtures at stoichiometric conditions are used for two geometrically different RDE configurations. The first configuration, the University of Michigan (UM) axial geometry Chacon and Gamba (2018), Chacon and Gamba (2019b), Sato et al. (2021a), injects air axially into the combustor relative to the axis of the combustor itself, whereas the second configuration, the Air Force Research Laboratory (AFRL) radial geometry Rankin et al. (2017), injects air radially outward into the combustor. These two geometries have previously been shown to produce different flow behaviors and detonation structures even for nominally similar operating mass flow rates (Sato et al., 2018; Sato, 2020; Sato et al., 2021a). Production and transport of NOx inside these combustors are investigated using detailed numerical simulations with multi-step chemical kinetics. The next section details the simulation configurations of interest along with the numerical methods used.
2 RDE configurations and simulation details
2.1 Configuration
The cross-sectional views of the three-dimensional RDE configurations used are shown in Figure 1. A continuous air injection inlet along with 120 uniformly spaced fuel injectors are used in both the AFRL and the UM geometries, with the major difference between geometries being the air inlet designs used. As mentioned previously, the UM design injects air axially into the combustor with an Axial Air Inlet (AAI), whereas the AFRL design injects air radially with a Radial Air Inlet (RAI). Specifically, a 0.3 inch combustor annular gap and a 0.069 inch air injector gap are used in the AFRL RAI design simulated in this work. Additional dimensions for each design are noted in Figure 1, with further information provided by Sato (2020). The various fuel and oxidizer mass flow rates and global equivalence ratios used for each case studied with these geometries are shown in Table 1.
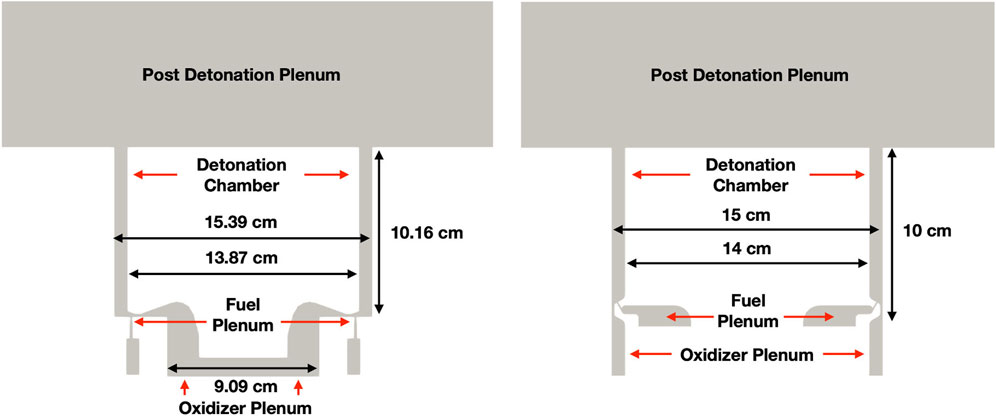
FIGURE 1. Cross-section schematics for AFRL RAI configuration (Left) and UM AAI configuration (Right).
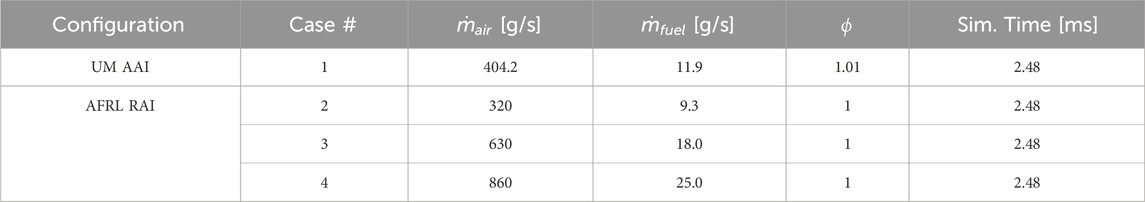
TABLE 1. 3D RDE case configurations.
2.2 Numerical approach
High-fidelity numerical simulations of full-scale RDE systems are employed to study NOx emissions behaviors. Governing equations for conservation of mass, momentum, and energy in addition to species conservation with chemical reactions are solved, with the ideal gas equation of state closing the system of equations. An in-house solver termed UMdetFOAM is used to solve these governing equations. The spatial, temporal, and diffusion schemes used in the solver are second order HLLC + MUSCL, second order Runge Kutta, and KNP respectively. The chemistry calculations allow for a user-controlled level of fidelity in the chemical kinetics and are performed using Cantera (Goodwin, 2006). The solver was previously validated under a variety of turbulent reacting flow conditions (Sato et al., 2018). The solver uses MPI-based decomposition to allow for parallel operation and it ran on roughly 4000 to 5000 cores to obtain the results in this study.
NOx chemistry is accounted for in the simulations through the use of a 13 species, 32 reaction modified Jachimowski mechanism with H2-Air-NOx reactions (Wilson and MacCormack, 1992). This reduced mechanism considers only the foremost formation pathway of NOx, thermal NOx production, by means of the extended Zeldovich mechanism (Zeldovich, 1946). The assessment of this mechanism for use in the RDE simulations of this study is detailed in the Supplementary Material. Adiabatic, no-slip walls are used for the boundary conditions of each case. Additionally, a constant mass flow rate boundary condition is prescribed at the fuel and oxidizer inlet planes, upstream in a truncated plenum region, with these conditions detailed in Table 1. Both RDE configurations are represented by unstructured meshes, with the UM AAI and AFRL RAI meshes containing roughly 25 × 106 and 48 × 106 control volumes in their entire domains, respectively. The UM AAI mesh has a resolution of 10–4 m in the injector region and 2 × 10⁻⁴ m up to 0.04 m in the detonation chamber, whereas the AFRL RAI mesh has a resolution of 2 × 10⁻⁴ m in the detonation chamber. These grid resolutions are identical to the ones used by Sato (2020) and Sato (2023), who found that all appropriate physics involved in such RDE configurations are sufficiently resolved while comparing reasonably well to experimental data. Similar resolution has been used in other studies as well (Pal et al., 2021; Prakash and Raman, 2021; Strakey et al., 2016).
The NOx simulations in this study were initialized from pure H2-Air solutions from Sato (2020) without using NOx chemistry steps. These H2-Air solution states were established by allowing the RDE flows to stabilize to quasi-steady states wherein the detonation behavior in the combustors reached statistical stationarity. Following this, the simulations were run for 2.48 ms, or roughly 10 system cycles, to provide sufficient time for NOx to develop within the RDEs.
3 Results
3.1 Macroscopic RDE features
In order to describe the NOx formation processes within the combustor, it is useful to first analyze the overall detonation structure. The flow structure observed here is qualitatively similar to that seen in previous studies (Sato, 2020; Rankin et al., 2017), and is shown in Figure 2. Detonation waves in each system are composed of a thin azimuthal region of high pressure and temperature in which the leading shock wave resides and defines a clear wave front (WF). While this azimuthal extent is small in comparison to the full annulus, the detonation structure itself is much thicker than comparable wave propagation over fully premixed mixtures (Prakash et al., 2020). Chemical reactions are activated behind this wave front due to sharp changes in pressure and temperature across the shock, leading to intense heat release and the combustion of entrained reactants. The energy release in this reaction zone helps self-sustain the detonation waves. Hot product gases (PG) then expand behind the detonation waves as they move axially toward the combustor exit. These gases accelerate as they expand axially, causing the formation of oblique shock waves stemming from the top of the detonation waves as they meet colder, low pressure gases from previous wave cycles. On the lower axial end of the PG region, an additional interface forms between hot product gases and cold fresh reactants from the refill region. This interface is termed the contact burning (CB) region, where ignition of mixture formed by fresh and combusted products occurs. Additionally, mixing of fresh reactants with hot unburned gases can sometimes occur within the refill region, leading to the burning of such reactants in a process called parasitic combustion (PC). PC is essentially a loss mechanism in RDEs, as it reduces the amount of fresh mixture available to be processed by the detonation wave, leading to less energy release behind the wave and a resulting reduction in wave strength. PC can be seen much more prominently in the UM AAI configuration in Figure 2, which is due to increased recirculation near the injector plane as a result of the injector design used. Implications of such recirculation patterns are discussed in Section 3.2.1.
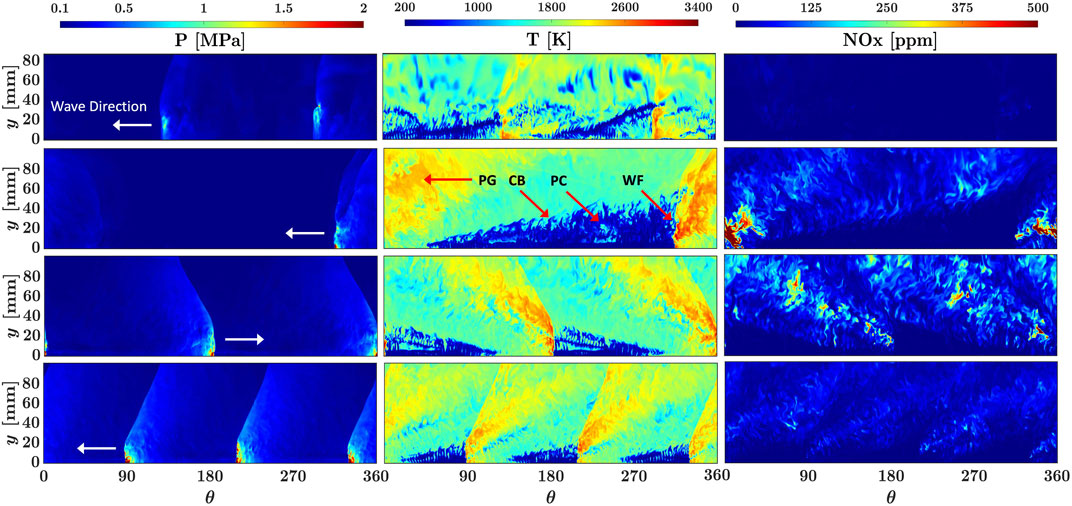
FIGURE 2. Instantaneous pressure, temperature, and NOx at mid-channel for all cases studied at 2.48 ms. Case 1 (Top) to Case 4 (Bottom).
Another unique feature of RDEs in general is the pressure blocking of injectors they experience from passing detonation waves. The intense pressures from detonation waves in the system are usually much higher than pressures within the injectors themselves, which leads to the temporary blockage of injectors and possible backflow into the injectors once detonation waves pass over them. This behavior is shown in Figure 3, a time history of pressure and axial velocity inside a single fuel injector at the exit plane into the combustion chamber. As the injector experiences the intense pressure from a detonation wave, axial velocity immediately plummets to a low or possibly negative value, indicating either stoppage of flow out of the injector or reverse flow back into the injector. The injector eventually recovers and begins injecting fresh fuel into the detonation chamber again, but the response of the injector greatly depends on the strength of the detonation wave as well as the stiffness of the injector based on inlet mass flow rate. For the cases in this study, it is seen that increasing the mass flow rate in the RAI RDE generally leads to an increase in wave strength, but along with that is a greater increase in the stiffness of the injectors. The net effect is to reduce the pressure differential between injector and detonation wave, therefore shortening the recovery time of injectors after waves pass over them. This feature is observed in Figure 2, where the azimuthal distance between the wave front and the start of the refill region is shortened with an increase in mass flow rate. It is also seen that the relationship between injector response and mass flow rate has a marked effect on the resulting detonation structure and height, which will be discussed further in Section 3.2.2.
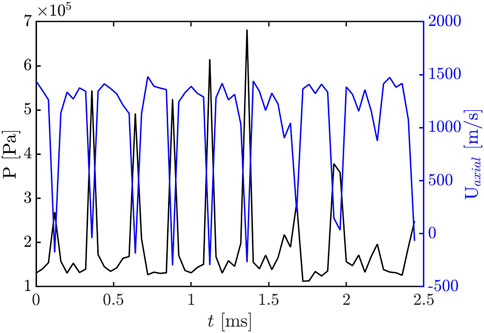
FIGURE 3. Time history of pressure and axial velocity inside single injector at injector exit plane for Case 2 (single wave mode).
In addition to affecting injector response, increasing mass flow rate has the general effect of increasing the number of waves in the system. The reasoning for this stems from the observation that an RDE can only maintain a certain wave mode for a certain range of mass flow rates before becoming unstable, beyond which it undergoes a transition process where it splits into a greater amount of waves to regain a state of stability. Although the specific triggers leading to wave splitting are still being investigated, with some studies linking wave stability to detonation height versus detonation cell width (Bykovskii and Zhdan, 2015; Wolański, 2013; George et al., 2017) and others pointing to fuel reactivity as the root cause (Tarey et al., 2020), it is clear that the initial transition process involves counter-propagating waves. These waves shed off from main detonation waves and collide with subsequent main detonation waves, ultimately weakening them by causing instabilities in wave speed and strength. The end result is splitting of the waves, leading to a marked reduction in wave strength and speed in all waves, a phenomenon confirmed in Sato et al. (2021a). This transition process and its effect on emissions behavior will be discussed later in this work.
Other trends seen as mass flow rate is increased in the RAI RDE system include stronger pressures (and thus stronger detonation waves) and greater axial velocities further axially into the detonation chamber. Figure 4 shows average axial pressure distributions for the three RAI RDE cases in this study at the outer chamber wall, with 0 cm signifying the chamber bottom. The data compares well to the experimental data from Rankin et al. (2017), and it shows that higher mass flow rate cases experience much higher average pressures, as corroborated by the plots in Figure 2. Additionally, pressures appear to drop significantly more moving further axially into the chamber as mass flow rate increases, indicating a reduction in axial detonation height and a stronger pressure differential between the waves and their surroundings. The larger pressure differential allows for greater expansion of product gases behind the detonation waves, leading to increased axial velocities in the post-detonation regions in higher mass flow rate cases. Higher pressures in such cases also serve to spatially compact the detonations, aiding in faster injector recovery (Sato et al., 2021a) and a reduction in induction length and corresponding delay in heat release (Sato, 2020). This leads to significant changes in temperature structures across detonation waves, leading to thinner, tighter regions of high temperature behind wave fronts.
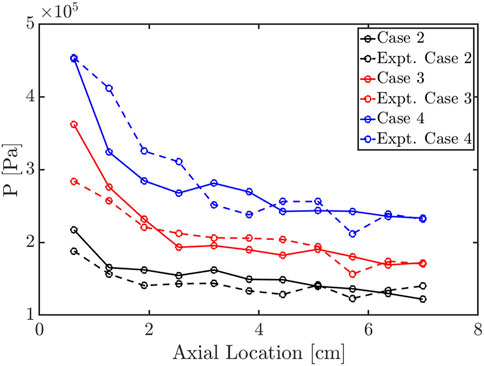
FIGURE 4. Average axial pressure distributions of RAI RDE cases at outer chamber wall for simulations as well as experimental data from Rankin et al. (2017).
3.2 NOx formation patterns
3.2.1 Instantaneous data
Figure 2, for which pressure and temperature observations have already been discussed in the previous section, also shows instantaneous snapshots of NOx for all cases studied after 2.48 ms of simulation time. These snapshots show that both geometry and mass flow rate have a significant impact on resulting NOx levels and formation patterns. When viewing results for different geometries first, it is seen that the RAI design produces long, coherent trails of NOx azimuthally behind the detonation waves, with the most intense levels usually seen near the detonation fronts where high temperatures are present. This behavior is expected since the NOx chemistry mechanism used for these simulations only accounts for thermal NOx production, making NOx formation primarily sensitive to high temperature. In contrast to the RAI geometry, the AAI geometry produces more incoherent patterns of NOx. This observation is supported by the non-uniformity seen in the temperature plot for the AAI geometry, specifically in the refill region, with evidence of PC present due to prominent temperature striations there. The presence of PC is consistent with previous experimental and computational studies of the AAI geometry (Chacon and Gamba, 2019a; Sato et al., 2021b), and this works to weaken detonation waves and reduce peak pressure and peak heat release experienced across them. The combination of PC, reduced peak pressure and peak heat release, and weaker waves in the AAI RDE is realized in the significant reduction in fuel efficiency (η), shown for all cases in Figure 5, as compared to the RAI RDE, with average exit plane fuel efficiency values of 71.72% and 90.31% seen in AAI case 1 and RAI case 2, respectively. However, the reduction in heat release and the fuel burned in the AAI case is ultimately reflected in lower overall NOx emissions. As such, conclusions from Figure 2 alone suggest that while PC leads to weaker waves and less efficient combustion, it also inversely correlates with NOx production given the incoherence and lower average heat release it induces.
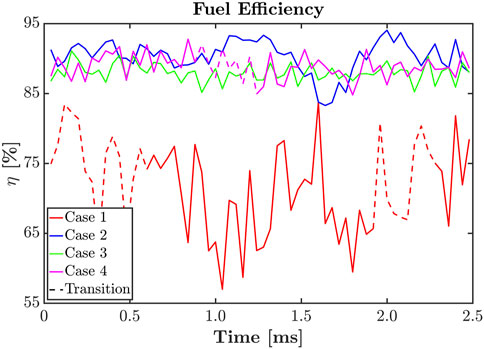
FIGURE 5. Fuel efficiency values (η) from injection to exit over time for all cases. Dashed lines represent transitory periods between wave modes, specifically between 1 and 2 waves for Case 1 and between 2 and 3 waves for Case 4.
Figure 2 shows the effect mass flow rate has on flow structure and emissions behavior in the RAI geometry. As mass flow rate increases, the RDE generally begins to operate with an increased amount of detonation waves in the combustor. The refill regions behind these waves ultimately adjust to these changes by reducing in azimuthal length and axial height. Injector recovery is also faster behind the detonation waves as a result of higher plenum pressures. As noted in previous studies using an AAI geometry Sato et al. (2021a), this helps to produce more steady fuel/oxidizer injection, thus increasing detonation strength and reducing PC. From Figure 2 these trends seen with increasing mass flow rate are clear between cases 2 and 3, with average temperature and NOx increasing as increased detonation strength would imply. However, case 4 shows differing behavior, with an even further increase in mass flow rate yet a reduction in NOx produced. It should be noted though that Figure 2 shows case 4 at an instant when the RDE operates with 3 waves after transitioning from 2 waves at the same mass flow rate condition. As such, the role this wave splitting process has on case 4 (as well as case 1 which splits from 1 to 2 waves) remains important in understanding the relationship between mass flow rate, detonation strength, and NOx emissions, which will be discussed further in Section 3.2.2. Nevertheless, qualitative trends are observed among all 3 RAI cases, wherein detonation waves become thinner and tighter with increasing mass flow rate, leading to thinner, tighter trails of NOx production in the post-detonation regions.
When viewing instantaneous radial cuts of cases 1 and 2, as shown in Figure 6, the effect PC has on NOx emissions in RDEs becomes apparent. These snapshots, which are taken from an azimuthal location in the refill region behind the detonation waves, show recirculation of gases in both geometries, which can ultimately lead to parasitic combustion in the refill region. However, the interesting observation here is that recirculation in the AAI geometry is more prominent near the injection plane, resulting in greater heat release and more NOx production in this area. Within the RAI geometry heat release is delayed further axially into the detonation chamber, resulting in the axial delay of NOx production. These results clearly show the effect that injector design has on recirculation and consequently PC and NOx production, with the AAI injector design more distinctly promoting radial recirculation within the detonation chamber. This behavior is also reported in previous experimental and computational studies with this AAI geometry (Chacon and Gamba, 2019b; Sato et al., 2021a). Although this behavior largely explains the processes through which most NOx is formed within the AAI geometry, this geometry still inherently produces less NOx overall than the RAI geometry. Weaker overall detonation waves from the prominent PC in the AAI geometry, as already discussed, are most likely contributing to such reductions in NOx emissions, but this relationship is discussed in further detail in Section 3.2.2.
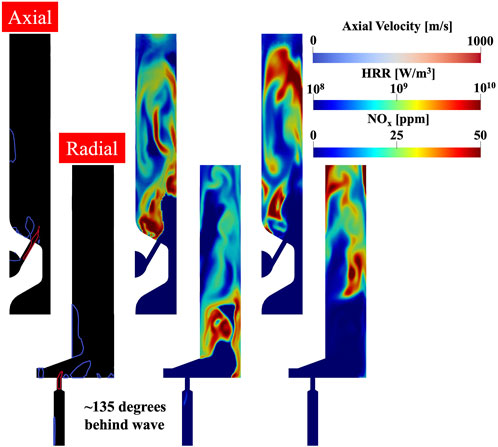
FIGURE 6. Instantaneous axial velocity, heat release rate, and NOx (left to right) at radial injector cut for Case 1 (Top) and Case 2 (Bottom). Blue and red contours on axial velocity plots signify values of 0 m/s and 1,000 m/s respectively.
3.2.2 Temporally averaged data
Before the temporally averaged data is discussed, a brief explanation of the temporal averaging process is described. The mid-channel data, shown in Figures 8, 9, is obtained by shifting waves on top of each other with respect to azimuthal location and then temporally averaging the result. This wave shifting process is detailed in Figure 7. The waves are shifted by marking locations of maximum pressure at an axial location of 3 mm above the bottom of the detonation chamber. Once these locations are marked, the plots of certain parameters (such as temperature in Figure 7) can be shifted to the position of the wave in the first frame. The aggregated waves can then be averaged to obtain a wave profile detailing the average detonation structure through time. In the instances where multiple waves occur within the RDE system, the amount to shift the waves on top of one another is obtained by averaging the distances each individual wave moved through every timestep. In addition to their role in temporal averaging, the marked pressure locations are also used for calculating distances between waves through every timestep. This allows for the calculation of wave speeds for all waves in the system in each case, and metrics from these calculations are shown in Table 2, including maximum pressure, temperature, heat release rate, and NOx, along with the minimum, maximum, average and standard deviation (σ) of wave speed (W). The temporally averaged radial cuts, shown in Figures 10, 11, are averaged in a similar manner to the mid-channel data, except no wave shifting is implemented before temporally averaging.
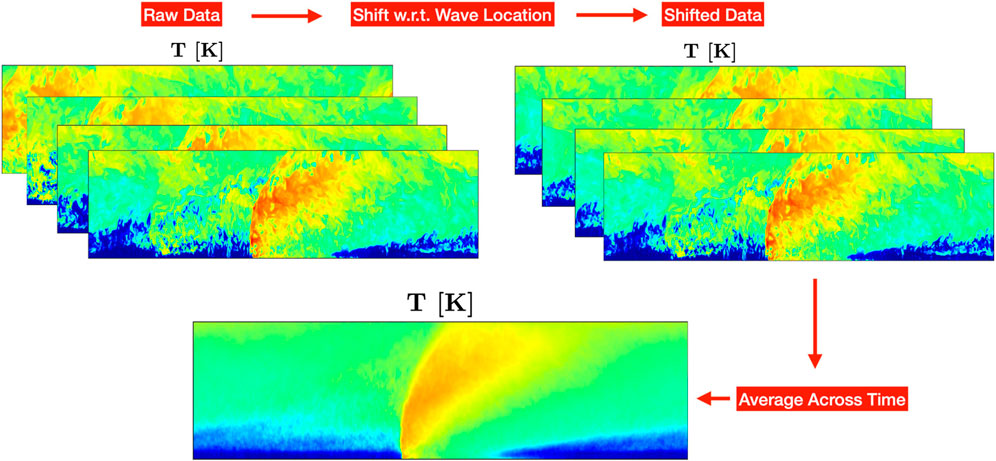
FIGURE 7. Depiction of wave shifting process used to generate temporally averaged mid-channel plots of flow properties with temperature used as an example.
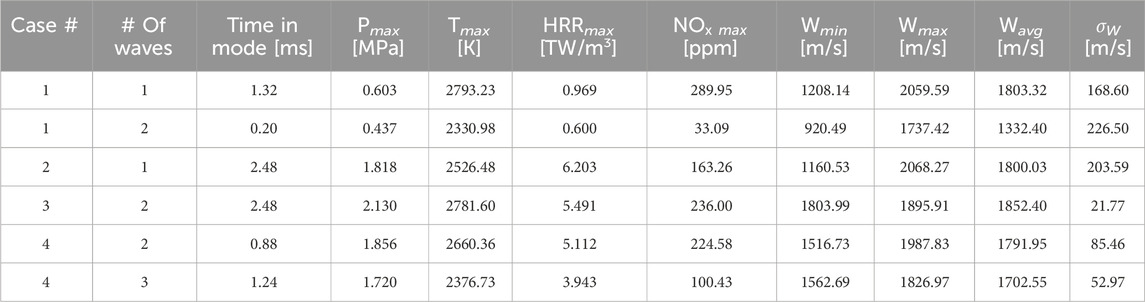
TABLE 2. Flow properties at mid-channel for all cases.
Mid-channel temporally averaged properties of all cases, shown in Figure 8, show mostly similar trends to the ones seen in the instantaneous plots in Figure 2. NOx emissions are much higher in the RAI cases as opposed to the single AAI case. The disorganization in NOx production seen in the AAI case is now absent, with a clear trail of NOx stemming from behind the detonation wave. Additionally, it is seen again that as additional waves spawn with increasing mass flow rate, the waves themselves begin to tighten and by consequence produce tighter trails of NOx in the post-detonation region. The intensity of NOx emissions is similar between cases 2 and 3, as similar maximum temperatures and pressures are noted in these cases. As for cases 1 and 4, temperatures, pressures, and NOx emissions are lower than in cases 2 and 3. It is noted though that the temporally averaged results for case 1 and 4 in Figure 8 are before the systems transitioned from 1 to 2 waves and 2 to 3 waves respectively, with data before and after the transition shown in Figure 9 for these cases.
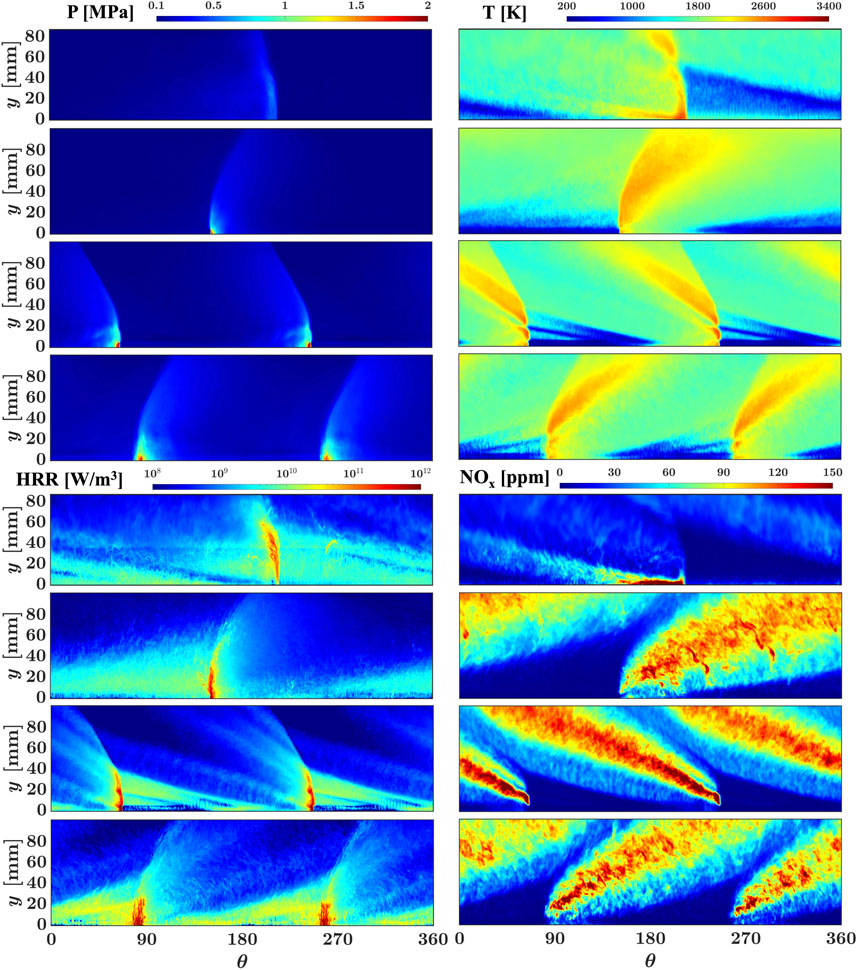
FIGURE 8. Temporally averaged pressure, temperature, heat release rate, and NOx for all cases. Case 1 (Top) to Case 4 (Bottom). In cases where wave transitions occurred temporal averages are shown only before the transition process.
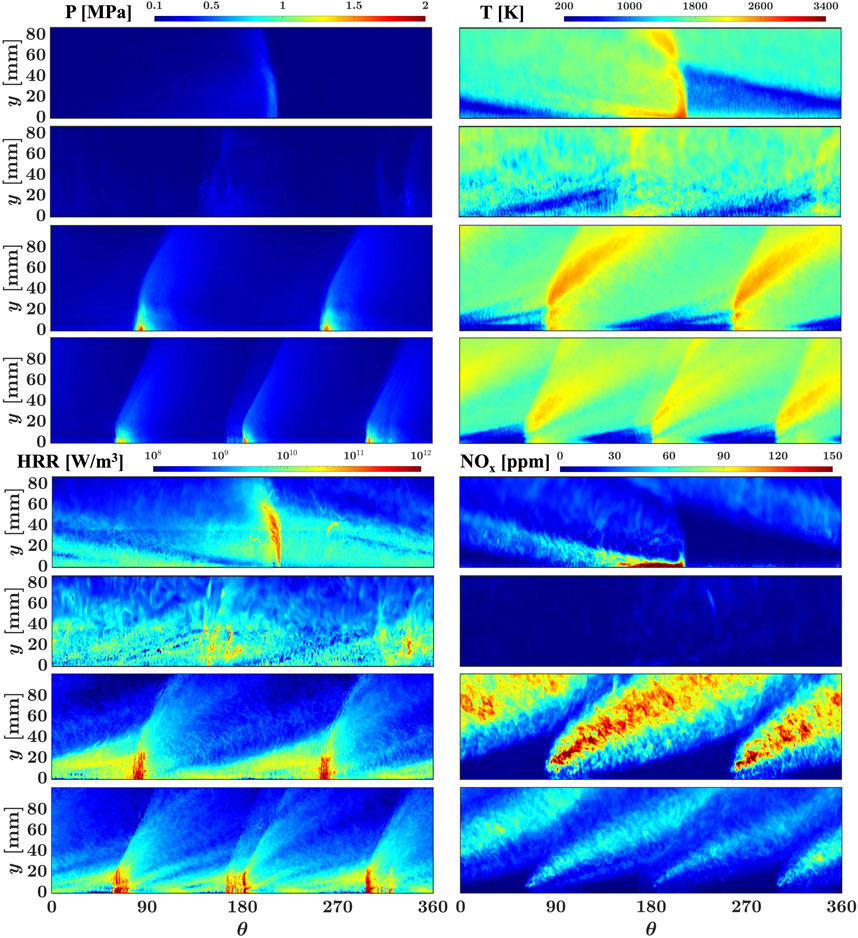
FIGURE 9. Temporally averaged pressure, temperature, heat release rate, and NOx for Case 1 and Case 4 that experienced wave transitions. From Top to Bottom: Case 1 before transition, Case 1 after transition, Case 4 before transition, Case 4 after transition.
When combining the qualitative behavior seen in Figure 8 with the corresponding mid-channel properties tabulated in Table 2, a clear trend between detonation strength and NOx production begins to form. Table 2 shows that as mass flow rate increases from case 2 to case 3 the strength of the detonation waves, as signified by maximum pressure, increases accordingly. When this occurs, peak temperature and NOx increase as well. However, this trend does not appear to be linear when the other cases are taken into account. The trend that detonation strength follows likens to the one observed in Sato et al. (2021a) where strength and wave speed follow a staggered pattern based on mass flow rate. More specifically, as mass flow rate increases, the wave speed and strength of waves increase linearly until a certain point when the waves ultimately split. Once the waves split, a noticeable dip in wave strength and wave speed is seen. As mass flow rate continues to increase, though, wave speed and strength continue to increase linearly again. Although fewer mass flow rate conditions are tested in this study than in Sato et al. (2021a), which limits the correlations that can be made between detonation strength and mass flow rate, the trend noticed by Sato et al. (2021a) still holds based on the available data. When air mass flow rate increases from 320 g/s to 630 g/s and the number of waves changes from 1 to 2 waves (from case 2 to case 3), maximum pressure and average wave speed increase by 17.2% and 2.9%, respectively. Considering that this change is not too dramatic compared to the dramatic increase in mass flow rate (96.9%), it can be surmised that in the region of mass flow rates between these two conditions the properties noted above experience a marked decrease when the wave ultimately splits into two and slowly increase above the values seen at the lower mass flow rate condition before the split as mass flow rate continues to increase. During this increase temperature and NOx levels rise as well. Then, as the air mass flow rate continues to increase another 36.5% from case 3 to 4, maximum pressure and average wave speed actually decrease by 14.8% and 3.4% respectively, signifying the beginning of unsteadiness leading to another wave transition. Here, average wave speed and maximum NOx already start to suffer in case 4 as counter-propagating waves shed off the main ones, and the system ultimately transitions to 3 waves, leading to another marked decrease in all properties and thus a decrease in wave strength and NOx emissions. This marked decrease is also seen in the AAI geometry when the system transitions from 1 to 2 waves, reducing detonation strength and NOx emissions in the process. As such, the behaviors noted between all cases confirms a significant correlation between detonation strength and the NOx emissions levels produced accordingly.
Figure 9 shows mid-channel data in cases 1 and 4 before and after their transitions between wave modes. It is clear from these plots that detonation strength reduces significantly after the wave splitting process as was previously noted and can be seen in the data from Table 2. The standard deviation in wave speed for case 4 before and after the transition reveals the system’s propensity for wave splitting to achieve steadier operation, with a higher variation in wave speed seen before the split as opposed to afterward. This is not the case for case 1 though, but it should be noted that as the deviation in wave speed increases here after the wave splitting process occurs, the averaging span for this case after transitioning is significantly shorter than that of case 4 in the same condition.
Another interesting effect of the transitions is the notable change in the detonation structure of the waves. First, after an additional wave is added to the systems, the heights of the detonation waves shrink in both cases. This behavior is consistent with previous studies (Sato, 2020; Rankin et al., 2017) and is a result of the refill region height reducing due to the reduced time between two waves passing over an injector. When additional waves are present at the same mass flow rate condition, the fresh mixture does not penetrate as much axially into the chamber. Since detonation height ties directly to refill height (Sato, 2020), the detonation height reduces. Additionally, it can be said that this extra wave effectively reduces the azimuthal residence time between waves since another wave is present in the system with mass flow rate remaining constant. This notion is corroborated by Schwer and Kailasanath (2016), who showed that operating an RDE in a multi-wave mode as opposed to a single-wave mode reduced the length scale between waves and consequently reduced residence time in the high temperature region, resulting in significantly lower NOx emissions. Second, the weakening of the waves lowers the peak pressures experienced across them. This has the effect of increasing the induction length across the wave, leading to slower, less intense heat release spread out across the wave and ultimately less compact and efficient combustion. This behavior leads to lower average temperatures inside the newly formed waves and less NOx produced in the system as a result. As such, both wave structure and wave strength are clearly affected by the wave splitting process and since these parameters are directly tied to NOx emissions levels, NOx is consequently affected with more waves at the same mass flow rate condition generating less NOx overall.
The trends seen in the mid-channel temporal averages from Figure 8 are also seen in the radial temporal averages shown in Figure 10. NOx levels are much lower in the AAI RDE than in the RAI RDE, which is a direct result of the lower average temperatures seen in the AAI RDE. Also, the location of most NOx production in the AAI RDE is near the injector plane due to the presence of increased recirculation here based on the axial air injection design. This process traps hot product gases near the inner wall close to the fuel injectors, promoting PC and in turn NOx formation here. Regarding the average temperatures in all plots, it is seen that a threshold temperature of around 1700 K must be met before significant NOx formation occurs. The injector design, presence of PC, and lengthened lower temperature structure in the axial direction in the AAI RDE all work together to reduce heat release in the detonation chamber, reducing the maximum temperature reached near the exit of the combustor as compared to the RAI RDE. As such, no significant NOx production occurs near the exit of the combustor in the AAI RDE, with the majority of NOx forming near the injector plane as a result of PC.
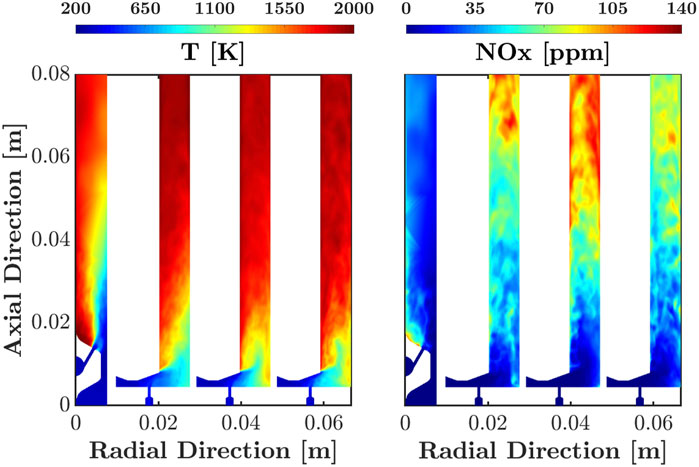
FIGURE 10. Temporally averaged temperature and NOx at radial injector cut for all cases. Case 1 (Left) to Case 4 (Right). In cases where wave transitions occurred temporal averages are shown only before the transition process.
In the RAI RDE cases, more uniformity is seen in the radial temperature profiles at lower axial positions in the combustor, with increasing radial uniformity seen with increasing mass flow rate and decreasing detonation height. This behavior, a clear result from better combustion efficiency and detonation strength with the RAI design, allows for temperatures to reach the 1700 K threshold temperature in rather short axial distances into the combustor, causing more significant NOx to be produced here as a result. The impingement of the cool temperature stream into the detonation chamber from the refill region is seen in each case, with case 3 showing the most well-formed, centered region of all cases in terms of radial location within the detonation chamber. This well-formed, centered refill region structure in case 3, which is indicative of the detonation wave structure as well, is most likely why the NOx produced in this case is more radially uniform than in all other cases, and is a direct result of the detonation strength seen in this case as previously noted. At lower mass flow rates, the detonation waves favor the outer wall, as they are not strong enough to significantly affect injector flow. As mass flow rate increases, the detonation waves strengthen, leading to higher peak pressures that affect injector recovery to a greater extent, a trend also seen in Sato et al., (2021a); Sato (2020). This response by the stronger detonation waves shifts the radial location of the refill region and consequently the radial location of the waves. As such, greater radial uniformity is seen in the stronger detonation wave cases, leading to greater radial uniformity in resulting NOx emissions.
As for the radial temporal averages in cases 1 and 4 before and after their wave mode transitions, which are shown in Figure 11, the results remain consistent with mid-channel findings. In case 1, the AAI RDE, greater variability is seen in the temperature profile before the system splits from 1 to 2 waves, but wave strength remains stronger in the single wave mode, which alludes to the fact that higher NOx levels are observed before the split. Interestingly, the greatest NOx production maintains itself near the inner wall and injection plane both before and after wave splitting, indicating that the primary mechanism of NOx formation in the AAI RDE is indifferent to wave number and is more of a direct consequence of injector design and the PC this promotes. As for the RAI RDE in case 4, system behavior before wave splitting likens to that of case 3, as 2 waves are present in both cases, strong detonations are observed, and higher amounts of radially uniform NOx are observed. The changing temperature structure after the split along with the mid-channel statistics from Table 2 support the claim that detonation strength directly affects NOx production, as lower peak pressures and resulting heat release values are noted upon splitting to 3 waves. The wave splitting processes in case 4 negatively impact fuel efficiency, shown in Figure 5, as average exit plane fuel efficiency values are 89.55% and 88.30% before and after the split. This minimal decrease in efficiency is most likely because the waves in this system are already relatively strong compared to the ones in the AAI system and the system is more efficient in general, leading to minute changes in efficiency levels between wave modes. Interestingly, in case 1 the average fuel efficiency actually increases from 69.33% to 74.52%. However, the caveat here is that this system is only in a mode with 2 waves for 0.2 ms, less than a full cycle, and so the exit plane values most likely have not adjusted to the new mode of operation in the range of times averaged. As such, the average fuel efficiency obtained for case 1 after wave splitting should be disregarded. Nevertheless, the radial distributions for both cases before and after wave splitting show a marked reduction in NOx, thus further supporting the link between detonation strength and NOx emissions levels.
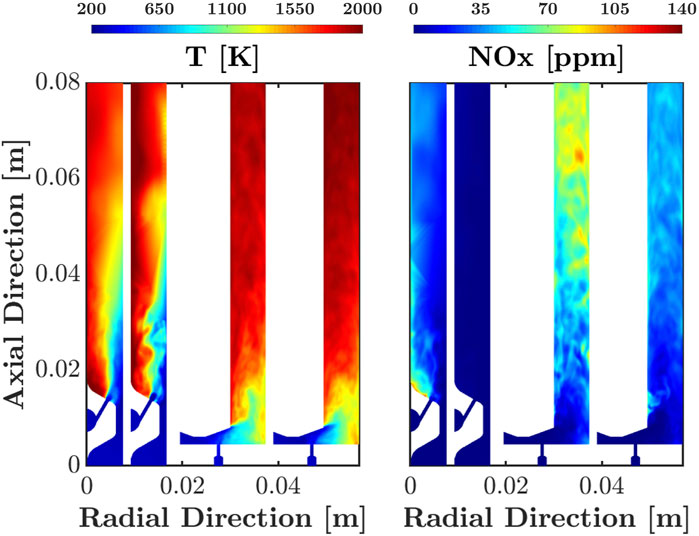
FIGURE 11. Temporally averaged temperature and NOx at radial injector cut for Case 1 and Case 4 that experienced wave transitions. From Left to Right: Case 1 before transition, Case 1 after transition, Case 4 before transition, Case 4 after transition.
3.2.3 Exit plane emissions levels
As is previously evident from temporally averaged mid-channel and radial data, it is seen that the RAI RDE produces significantly more NOx than the AAI RDE, even at nominally similar mass flow rate conditions. Additionally, as mass flow rate increases in the RAI RDE, the flow properties of the system appear to behave in a staggered manner, with detonation strength increasing to a point and then markedly decreasing after the system reaches an unstable point and wave splitting occurs. To further understand how these behaviors affect NOx at the exit of the combustor, an important metric of interest for power generation applications, average NOx levels at the exit plane are plotted in time for each case in Figure 12.
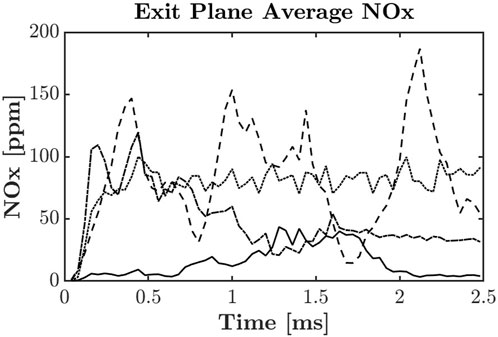
FIGURE 12. Spatially averaged NOx at combustor exit plane over time for Case 1 (−), Case 2 (-- -), Case 3 (⋯⋯), and Case 4 (−⋅ − ⋅).
From the average NOx values at the exit plane it is seen that NOx levels in the AAI RDE stay below those in the RAI RDE cases at most times throughout the simulation, even before the wave splitting process. This again is a result of the detonation strength seen in the AAI case, where the weaker overall pressures observed lead to an increase in induction length and a delay and reduction in overall combustion. Additionally, the nature of the injector design in the AAI RDE promotes PC within the system and PC is more prominent in this configuration than in the RAI RDE as a result, leading to inherent losses in this system that manifest themselves in the weaker observed detonations. Overall, the average exit plane emissions for each case corroborate previous conclusions on detonation strength and system stability noted beforehand. This feature indicates that NOx generation occurs predominantly in the region near the detonation wave, and the time-scales are relatively short for further production downstream.
Regarding the connection between exit plane NOx levels and system stability in specific, it is observed in most cases that steady NOx levels appear at the exit when the systems remain relatively stable. However, in certain cases where wave transitions occur, significant changes in NOx emissions are observed, indicating the strong sensitivity of NOx as a marker for system stability. In addition, specific instabilities in wave propagation, as seen in case 2 where only 1 wave is present in the system, can be noted from exit plane NOx levels where highly oscillatory behavior occurs. These instabilities arise from the increased PC seen in both RDE geometries at lower mass flow rates and are evidenced by the high variability in wave speeds for these cases, as shown in Table 2. Since case 2 in specific is the only case to stay within the single-wave mode for the entire simulation, the wave in this system experiences these instabilities the most frequently within the context of the RAI RDE cases. As a result, the pre-burning of fresh mixture, detonation weakening, and combustion delay from increased induction length spawned from PC in this case are reflected in the local spikes and dips in exit plane NOx emissions. In the higher mass flow rate cases, where less PC is observed and is also observed in previous studies (Sato et al., 2021a; Sato, 2020), steadier behavior is seen in exit plane NOx emissions over time. As such, exit plane NOx emissions levels have shown to be a reliable marker for determining system stability within the detonation chamber, specifically with regard to instabilities arising from the presence of PC.
In terms of fuel conversion efficiency at the exit plane, a relationship forms between efficiency and NOx levels when comparing the AAI and RAI cases at nominally similar mass flow rate conditions. In particular, Figure 12 shows lower NOx levels in AAI case 1, and the average exit plane fuel efficiency for this case is 71.72%. This fuel efficiency is the fraction of mass flow rate of fuel burned in the combustor divided by the total fuel mass flow rate entering the combustor. The mass flow rate of fuel burned is the difference between fuel mass flow rate entering the combustor and fuel mass flow rate exiting the combustor at the exit plane. Fuel efficiency values through time are shown for all cases in Figure 5. For RAI case 2, significantly higher levels of NOx are in the system, and the fuel efficiency is 90.31%. These numbers support the claim that weaker waves and a greater presence of PC in the AAI RDE help reduce fuel efficiency yet ultimately reduce NOx emissions as well. However, the relationship between efficiency and NOx levels breaks down when looking solely at the RAI cases for different mass flow rate conditions. Average fuel efficiency values of 90.31%, 87.98%, and 88.88% are seen for cases 2, 3, and 4, respectively, with average NOx levels progressively decreasing from case 2 to case 4. This behavior suggests a more nuanced relationship between the efficiency and NOx emissions in these cases, supported by the more nuanced differences in these cases where combustor geometry does not change. Nevertheless, the relationship holds between the AAI and RAI cases at nominally similar mass flow rate conditions as previously mentioned. When wave splitting occurs in RAI case 4, the trend continues to hold, as average fuel efficiency decreases from 89.55% to 88.30%. This decreasing efficiency behavior through wave splitting processes is consistent with a decrease in wave strength and resulting NOx emissions, thus supporting the relationship between such parameters as already evident between AAI case 1 and RAI case 2. Interestingly, though, the trend reverses with AAI case 1 through wave splitting, as the average fuel efficiency increases from 69.33% to 74.52%. It should be noted though that this system spends less than a full cycle with 2 waves present (0.2 ms), and the system would need at least 1 full cycle to propagate the effects of the new wave mode to the exit plane. Additionally, the short amount of time available to average over amplifies the uncertainty in the measurement. As such, this anomaly should be disregarded in this discussion, and the relationship between fuel efficiency, wave strength, and NOx should hold. Therefore, although no general trend can be inferred between fuel efficiency and NOx emissions for all 4 cases studied, a correlation between decreasing efficiency and decreasing NOx emissions is evident when specifically comparing overall data between AAI case 1 and RAI case 2 and data for RAI case 4 before and after wave splitting processes.
When the data shown in Figure 12 is temporally averaged it is revealed that average NOx levels through the full simulation time in the AAI RDE are 15.0 ppm, which is over 5.5 times less than the RAI RDE NOx levels (83.4 ppm) at the nominally similar mass flow rate condition in case 2. Additionally, the AAI RDE exit plane emissions levels are still roughly 3.3 times lower than the levels seen in case 4 (49.6 ppm) which has the lowest NOx levels of all RAI RDE cases. This data, combined with the premise from Prakash et al. (2020) that the injection process has a large impact on flow structure, residence time, and detonation strength, strongly suggests that injector design significantly affects resulting NOx emissions. However, despite the stark differences in RDE injector design and accompanying emissions, the average exit emissions levels in all cases are relatively low compared to data in Schwer and Kailasanath (2016). The simulations in Schwer and Kailasanath (2016) were of 2D idealized RDE systems though, so they do not take into account the non-idealities of practical 3D RDEs with discrete injection that affect NOx production. Nevertheless, RDE exit plane emissions levels in this study remain under 100 ppm on average, with local spikes not exceeding 200 ppm for RAI case 2. Since average NOx exhaust levels in a stationary gas turbine amount to 22–240 ppm (Layi, 2010), the NOx emissions levels found in this study are very similar to those in traditional gas turbines relying on pure deflagrative combustion. Schwer and Kailasanath (2016) specifically strays away from comparing RDE NOx emissions to those in more traditional engines, as a direct comparison between vastly different engine designs and functions is difficult. Although a direct comparison still cannot be made between RDE and gas turbine emissions, and the corresponding exit plane emissions comparisons should be taken lightly, this study differs from Schwer and Kailasanath (2016) in that it explores more practical, 3D, non-ideal RDE systems with multiple operating conditions. In addition, all cases are run at stoichiometric conditions to ensure an ideal burning scenario and ultimately an upper limit for NOx emissions production. As such, less uncertainty remains in the correlations made in this study than in those expressed by Schwer and Kailasanath (2016), although further analysis may still be necessary to determine more nuance patterns of emissions evolution in specific RDE configurations.
4 Conclusion
Emissions are an important factor to consider when designing an RDE, yet little research has been done on the subject to date. The unique detonative flow characteristics of RDEs harbor uncertainty in how emissions should develop in these systems as compared to how they develop under traditional deflagrative combustion seen in gas turbine engines. Additionally, the non-idealities arising in practical 3D RDEs should be assessed to determine their effects on flow structure and consequently emissions levels. This work studied the behaviors seen in practical RDEs under different geometric and operating conditions to understand how these ultimately affected resulting NOx emissions patterns.
Four cases were studied at stoichiometric hydrogen-air conditions with two different RDE configurations, namely, the UM Axial Air Inlet (AAI) RDE and the AFRL Radial Air Inlet (RAI) RDE. One mass flow rate condition was run with the AAI RDE whereas three conditions were run with the RAI RDE. A simplified NOx chemistry mechanism primarily accounting for thermal NOx production was used to understand primary patterns of NOx formation without incurring too much computational cost. Simulations were run for nearly ten wave cycles, to allow enough time for NOx to fully form within the systems. Instantaneous and temporally averaged data were then analyzed at mid-channel, radial, and exit plane locations to determine the effects differing detonation structures have on NOx emissions patterns.
Results showed a large discrepancy in NOx levels between the AAI and RAI RDEs even at nominally similar mass flow rate conditions. The increased presence of parasitic combustion in the AAI RDE effectively reduced detonative combustion efficiency, leading to overall weaker detonation waves. This ultimately broadened the induction zone in this system, leading to delayed combustion and lower peak levels of heat release and thereby reduced overall NOx emissions. It was noted that the parasitic combustion in the AAI RDE, induced by its injector design’s propensity for recirculating hot product gases into the refill region, did lead to NOx formation but the levels produced were significantly smaller than those seen in the RAI RDE in the direct wake of the detonation waves.
Furthermore, a strong correlation was found between detonation strength and NOx emissions, with greater peak pressure leading to greater NOx formation. As mass flow rate was increased in the RAI RDE, detonation waves generally increased in strength in a staggered linear manner. In specific, wave speed and strength increased to a point of instability in the system until wave splitting occurred, wherein a marked reduction in wave speed and strength was noticed. Waves appeared to intensify linearly again with increasing mass flow rate. The effect of wave splitting was determined to greatly reduce NOx emissions by way of the large reduction in wave strength. As such, all cases in this study, whether they experienced entirely steady operation or wave splitting processes, showed evidence that increasing detonation wave strength directly increases NOx formation.
Another finding from the study was the greater radial uniformity seen in detonation structure and therefore NOx emissions when mass flow rate increased. This highlighted the effect stronger detonations and injector stiffness have on resulting flow characteristics of fresh mixture into the detonation chamber. The lower mass flow rate cases showed increased axial impingement of fresh cool mixture into the chamber, resulting in greater detonation heights and delayed combustion and NOx formation in the axial direction. Additionally, the location of this increased axial impingement near the outer wall shifted radial dominance of the detonation waves to the outer wall in these cases.
In terms of emissions levels at the exit plane of the combustor, results supported previous findings from mid-channel and radial data. It was noted that exit plane NOx levels can be seen as a marker for system stability in RDEs given their sensitivity to wave instabilities and wave splitting processes. Finally, it was determined that despite the unique flow characteristics RDEs bring about over pure deflagrative combustion, average NOx levels at the combustor exit remain similar to exhaust levels seen in stationary gas turbines from literature. This finding suggests the strong capability for RDEs to provide much more efficient combustion and work extraction than gas turbines without suffering from significantly higher emissions. However, as already noted in this study, care should be taken when designing an RDE for maximum efficiency, as the tradeoff for increasing efficiency and detonation strength is an increase in emissions levels.
Data availability statement
The raw data supporting the conclusion of this article will be made available by the authors, without undue reservation.
Author contributions
CVB: Writing–original draft, Writing–review and editing. VR: Writing–review and editing.
Funding
The author(s) declare financial support was received for the research, authorship, and/or publication of this article. DOE-NETL Grant DE-FE0025315 with Dr. Mark Freeman as program monitor. Allocation of Computational Resources: NASA Pleiades Supercomputer. Support from an NDSEG Fellowship through AFRL.
Acknowledgments
The authors acknowledge financial support from the Department of Energy (DOE) National Energy Technology Laboratory (NETL) program through Grant DE-FE0025315 with Mark Freeman as program monitor. The authors appreciate NASA High-End Computing Capability (HECC) for their generous allocation of computational resources on the NASA Pleiades supercomputer. The authors also acknowledge support from a National Defense Science and Engineering Graduate (NDSEG) Fellowship through the Air Force Research Laboratory (AFRL).
Conflict of interest
The authors declare that the research was conducted in the absence of any commercial or financial relationships that could be construed as a potential conflict of interest.
Publisher’s note
All claims expressed in this article are solely those of the authors and do not necessarily represent those of their affiliated organizations, or those of the publisher, the editors and the reviewers. Any product that may be evaluated in this article, or claim that may be made by its manufacturer, is not guaranteed or endorsed by the publisher.
Supplementary material
The Supplementary Material for this article can be found online at: https://www.frontiersin.org/articles/10.3389/fpace.2024.1335906/full#supplementary-material
References
Anand, V., and Gutmark, E. (2019). Rotating detonation combustors and their similarities to rocket instabilities. Prog. Energy Combust. Sci. 73, 182–234. doi:10.1016/j.pecs.2019.04.001
Athmanathan, V., Fisher, J. M., Ayers, Z. M., Cuadrado, D. G., Andreoli, V., Braun, J., et al. (2019). Development of a turbine-integrated high-pressure optical RDE (THOR) for time-resolved fluid dynamic measurements using high-speed optical diagnostics. In AIAA propulsion and energy forum and exposition.
Buyakofu, V., Matsuoka, K., Matsuyama, K., Kawasaki, A., Watanabe, H., Itouyama, N., et al. (2022). Development of an S-shaped pulse detonation engine for a sounding rocket. J. Spacecr. Rockets 59, 850–860. doi:10.2514/1.a35200
Bykovskii, F., and Zhdan, S. (2015). Current status of research of continuous detonation in fuel-air mixtures (Review). Combust. Explos. Shock Waves 51, 21–35. doi:10.1134/s0010508215010025
Bykovskii, F. A., Zhdan, S. A., and Vedernikov, E. F. (2006). Continuous spin detonations. J. Propuls. Power 22, 1204–1216. doi:10.2514/1.17656
Chacon, F., and Gamba, M. (2018). “Development of an optically accessible continuous wave rotating detonation engine,” in 2018 joint propulsion conference.
Chacon, F., and Gamba, M. (2019a). “Detonation wave dynamics in a rotating detonation engine,” in AIAA scitech 2019 forum, 0198.
Chacon, F., and Gamba, M. (2019b). “Study of parasitic combustion in an optically accessible continuous wave rotating detonation engine,” in AIAA scitech 2019 forum.
Ferguson, D., O’meara, B., Roy, A., Sidwell, T., and Johnson, K. (2020). “Experimental measurements of NOx emissions in a rotating detonation engine,” in AIAA scitech 2020 forum, 1.
George, A. S., Driscoll, R., Anand, V., and Gutmark, E. (2017). On the existence and multiplicity of rotating detonations. Proc. Combust. Inst. 36, 2691–2698. doi:10.1016/j.proci.2016.06.132
Layi, R. (2010). “Exergy and environmental considerations in gas turbine Technology and applications,” in Gas turbines.
Pal, P., Kumar, G., Drennan, S. A., Rankin, B. A., and Som, S. (2021). Multidimensional numerical modeling of combustion dynamics in a non-premixed rotating detonation engine with adaptive mesh refinement. J. Energy Resour. Technol. 143. doi:10.1115/1.4050590
Prakash, S., Fiévet, R., Raman, V., Burr, J., and Yu, K. H. (2020). Analysis of the detonation wave structure in a linearized rotating detonation engine. AIAA J. 58, 5063–5077. doi:10.2514/1.j058156
Prakash, S., and Raman, V. (2021). “The effects of mixture preburning on detonation wave propagation,” in Proceedings of the combustion Institute, 38.
Raman, V., Prakash, S., and Gamba, M. (2023). Non-idealities in rotating detonation engines. Annu. Rev. Fluid Mech. 55, 639–674. doi:10.1146/annurev-fluid-120720-032612
Rankin, B. A., Richardson, D. R., Caswell, A. W., Naples, A. G., Hoke, J. L., and Schauer, F. R. (2017). Chemiluminescence imaging of an optically accessible non-premixed rotating detonation engine. Combust. Flame 176, 12–22. doi:10.1016/j.combustflame.2016.09.020
Sato, T. (2020). High-fidelity simulations of rotating detonation engines. Ph.D. thesis, University of Michigan.
Sato, T., Chacon, F., Gamba, M., and Raman, V. (2021a). Mass flow rate effect on a rotating detonation combustor with an axial air injection. Shock Waves 31, 741–751. doi:10.1007/s00193-020-00984-7
Sato, T., Chacon, F., White, L., Raman, V., and Gamba, M. (2021b). Mixing and detonation structure in a rotating detonation engine with an axial air inlet. Proc. Combust. Inst. 38, 3769–3776. doi:10.1016/j.proci.2020.06.283
Sato, T., Van Beck, C., and Raman, V. (2023). Numerical and boundary condition effects on the prediction of detonation engine behavior using detailed numerical simulations. Front. Aerosp. Eng. 2. doi:10.3389/fpace.2023.1123249
Sato, T., Voelkel, S., and Raman, V. (2018). “Detailed chemical kinetics based simulation of detonation-containing flows,” in Proceedings of the ASME turbo expo, 4A, 2018.
Schwer, D. A., and Kailasanath, K. (2016). Characterizing NOx emissions for air-breathing rotating detonation engines. In 52nd AIAA/SAE/ASEE joint propulsion conference.
Strakey, P., Ferguson, D., Sisler, A., and Nix, A. (2016). “Computationally quantifying loss mechanisms in a rotating detonation engine,” in 54th AIAA Aerospace sciences meeting, 0900.
Tarey, P., Ramaprabhu, P., McFarland, J., and Bigdelou, P. (2020). “Investigation of mode transition in rotating detonation engines using detailed numerical simulations,” in AIAA propulsion and energy 2020 forum, 3726.
Wilson, G. J., and MacCormack, R. W. (1992). Modeling supersonic combustion using a fully implicit numerical method. AIAA J. 30, 1008–1015. doi:10.2514/3.11021
Wolański, P. (2013). Detonative propulsion. Proc. Combust. Inst. 34, 125–158. doi:10.1016/j.proci.2012.10.005
Keywords: rotating detonation engine, direct numerical simulation, propulsion system, computational fluid dynamics, combustion, nitrogen oxides, emissions, pollutants
Citation: Van Beck C and Raman V (2024) NOx formation processes in rotating detonation engines. Front. Aerosp. Eng. 3:1335906. doi: 10.3389/fpace.2024.1335906
Received: 09 November 2023; Accepted: 15 January 2024;
Published: 01 February 2024.
Edited by:
Tanvir I. Farouk, University of South Carolina, United StatesReviewed by:
Simone Salvadori, Polytechnic University of Turin, ItalySi Shen, Technion Israel Institute of Technology, Israel
Copyright © 2024 Van Beck and Raman. This is an open-access article distributed under the terms of the Creative Commons Attribution License (CC BY). The use, distribution or reproduction in other forums is permitted, provided the original author(s) and the copyright owner(s) are credited and that the original publication in this journal is cited, in accordance with accepted academic practice. No use, distribution or reproduction is permitted which does not comply with these terms.
*Correspondence: Caleb Van Beck, Y3ZhbmJlY2tAdW1pY2guZWR1