 Zhixin Lei1,2
 Qianying Liu1,2Jincheng Xiong1Bing Yang1Shuaike Yang1Qianqian Zhu2Kun Li1Shishuo Zhang3
 Jiyue Cao1,2*Qigai He3*
- 1Department of Veterinary Pharmacology, College of Veterinary Medicine, Huazhong Agricultural University, Wuhan, China
- 2National Reference Laboratory of Veterinary Drug Residues and MAO Key Laboratory for Detection of Veterinary Drug Residues, Huazhong Agriculture University, Wuhan, China
- 3State Key Laboratory of Agriculture Microbiology, College of Veterinary Medicine, Huazhong Agriculture University, Wuhan, China
The aim of this study was to evaluate the activity of marbofloxacin and establish the optimal dose regimens for decreasing the development of fluoroquinolone resistance in pigs against Escherichia coli with ex vivo pharmacokinetic/pharmacodynamic (PK/PD) modeling. The recommended dose (2 mg/kg body weight) of marbofloxacin was orally administered in healthy pigs. The ileum content and plasma were both collected for the determination of marbofloxacin. The main parameters of Cmax, AUC0-24 h, AUC, Ke, t1/2ke, MRT and Clb were 11.28 μg/g, 46.15, 77.81 μg⋅h/g, 0.001 h-1, 69.97 h, 52.45 h, 0.026 kg/h in ileum content, and 0.55 μg/ml, 8.15, 14.67 μg⋅h/ml, 0.023 h-1, 30.67 h, 34.83 h, 0.14 L/h in plasma, respectively In total, 218 E. coli strains were isolated from most cities of China. The antibacterial activity in vitro and ex vivo of marbofloxacin against E. coli was determined following CLSI guidance. The MIC90 of sensitive strains (142) was calculated as 2 μg/ml. The minimum inhibitory concentration (MIC) of HB197 was 2 and 4 μg/ml in broth and ileum fluids, respectively. In vitro mutant prevention concentration, growth and killing-time in vitro and ex vivo of marbofloxacin against selected HB197 were assayed for pharmacodynamic studies. According to the inhibitory sigmoid Emax modeling, the value of AUC0-24 h/MIC produced in ileum content was achieved, and bacteriostatic, bactericidal activity, and elimination were calculated as 16.26, 23.54, and 27.18 h, respectively. Based on Monte Carlo simulations to obtain 90% target attainment rate, the optimal doses to achieve bacteriostatic, bactericidal, and elimination effects were 0.85, 1.22, and 1.41 mg/kg.bw for 50% target, respectively, and 0.92, 1.33, and 1.53 mg/kg.bw for 90% target, respectively, after oral administration. The results in this study provided a more optimized alternative for clinical use and demonstrated that the dosage 2 mg/kg of marbofloxacin by oral administration could have an effect on bactericidal activity against E. coli.
Introduction
Escherichia coli is a frequent and crucial pathogenic bacteria which can cause septicaemia, enterocolitis and diffuse peritonitis, resulting in high mortality rates, increased morbidity and devastating economic losses in the livestock industry (Burt and Reinders, 2003; Splíchal et al., 2005; Laghari et al., 2013; Ijaz et al., 2015).
Marbofloxacin (MBF) is a synthetic third-generation fluoroquinolone antibiotic developed exclusively for veterinary treatment (EMEA, 1996). With a broad spectrum of bactericidal activity, marbofloxacin acts primarily as a bactericidal antibiotic for Gram-negative pathogens, some Gram-negative pathogens and Mycoplasma (Haritova et al., 2006; Vallé et al., 2012; Tohamy and El-Gendy, 2013). It is proposed for oral or parenteral administration for the treatment of respiratory and archenteric disease in pigs or bovines, with a high bioavailability close to 100% (Ding et al., 2010). Its extensive spectrum of activity also includes infected canine pathogens such as Staphylococcus spp., Proteus spp., Streptococcus spp., and E. coli, which has been approved for treatment in pets at a dosage of 2.0 mg/kg.bw once per day via oral administration (Spreng et al., 1995; Thomas et al., 1997; Paradis et al., 2001; Yu et al., 2007).
The pharmacokinetics (PK) of MBF has been investigated in various livestock such as goats, cows, cats, sheep, pigs, and dogs (Waxman et al., 2001; Schneider et al., 2004; Albarellos et al., 2005; Ding et al., 2010; Sidhu et al., 2010), showing a high concentration in plasma and peripheral tissue, with up to 100% bioavailability, and wide and rapid distribution in tissues. Previous studies have shown MBF to have excellent pharmacokinetic characteristics such as being well-absorbed after oral and parenteral administration, higher concentrations in tissues than in the plasma, and weakly bound to plasma proteins (<10%) (Haritova et al., 2006; Andraud et al., 2011; Sun et al., 2015). MBF is distributed widely throughout the animals’ bodies, which could reach 1.6 times higher drug concentrations in the skin than in the plasma in dogs, and MBF concentrations in the plasma can remain above the MIC (>24 h) longer than the dose density (Cester et al., 1996; Schneider et al., 1996). Although some studies have reported the pharmacokinetics of MBF in animals including pigs (Ding et al., 2010; Schneider et al., 2014; Yang et al., 2016), the pharmacokinetic data of MBF in pigs plasma and intestinal content are not sufficient enough to precisely predict the efficacy of this drug.
For the evaluation of antimicrobial drugs, it is essential to optimize the dose schedule to attain clinical cures and reduce the emergence of antimicrobial drug resistance (Burgess, 1999). The pharmacokinetics-pharmacodynamics (PK/PD) integration model can reveal the relationship between antibiotics and bacterium in specific animals, and quantify the potency and efficacy of antibiotics against bacterium. Moreover, the PK/PD integration model can also prevent resistance development and provide optimal dosage strategies (Drusano, 2007; Nielsen and Friberg, 2013). As an effective tool for assessing the optimal dosage regimens, PK/PD analysis has been recommended in the development of new antimicrobial compounds by the Food and Drug Administration (FDA) and European Medicines Agency (EMA) (Yan et al., 2017).
Few researches have investigated antibiotic concentrations at the ileum content in pigs. Due to the difficulty in determining free drug concentrations at the infected site, the PK data were obtained from the plasma in previously described reports. However, it has been demonstrated that the concentration in the plasma is significantly different from that in the target sites, such as ileum content, epithelial lining fluid and interstitial fluid, which could be observed in the results of previous studies (Messenger et al., 2012; Foster et al., 2016; Wang et al., 2016; Yan et al., 2017). Thus, it is recommended to determine the drug concentrations at the target site for PK-PD modeling to achieve more rational dosage regimens.
Since there are contradictory values in PK/PD indices which have correlated with the prevention of resistant mutant selection and efficacy, great attention has been paid to specific PK/PD indices for specific pathogens and antimicrobial agents. Prior to this study, the integration of PK data in pigs with the time course activity ex vivo for MBF against E. coli had not been performed. The antibacterial activity in vivo of MBF against E. coli and PK in the ileum content were evaluated and a typical method simple-T cannulation was used to obtain the MBF concentrations in the ileum content. Moreover, the rational dosage regimen of MBF against E. coli was established for veterinary clinical guidance based on PK-PD integration modeling.
Materials and Methods
Chemicals and Reagents
Pure standard (>98% purity) MBF was purchased from Dr. Ehrenstorfer (Augsburg, Germany). The MBF bulk drug with a chemical purity of 100.3% (No. 201104005) was produced and provided by Wuhan Huishen Biotechnology, Co., Ltd. All chemical agents for this analysis were of the high performance liquid chromatography (HPLC) grade and other organic solvents were of analytical grade. For testing the susceptibility of these bacteria to MBF, each isolate was sub-cultured at least three times in LB broth (Luria-Bertani) and LB agar (Luria-Bertani agar; Qingdao Hai Bo Biological Technology, Co., Ltd, Shangdong, China).
Animals
Eight healthy pigs including four males and four females, weighing 15–20 kg and aged 4–5 weeks, were used for this study. These animals were placed in separate pens with free access to water, and no antibiotic feed premixes. Pigs were fed for 7 days to acclimatize prior to the study. The study was approved by the Ethical Committee of the Faculty of Veterinary Medicine at Huazhong Agricultural University. All animal care and experimental protocols were conducted in accordance with the Guide for the Care and Use of Laboratory Animals of Hubei Provincial Laboratory Animal Public Service Centre (permit number SYXK 2013-0044).
Bacterial Strain Isolation
Two hundred and eighteen E. coli strains were isolated from pigs in most provinces of China (Anhui, Henan, Hubei, Jiangxi, and Guangzhou) between 2015 and 2017. According to the MIC90 values of strains, the E. coli HB197 strain, with a MIC similar to MIC90, was selected to study the antimicrobial activity of MBF in vitro. E. coli ATCC 25922 strain was used as a reference strain for antibiotic susceptibility determination. The species of isolates was identified by polymerase chain reaction (PCR). Prior to testing the MIC, each isolate was sub-cultured at least three times in LB and LBA.
Antimicrobial Susceptibility Testing
Susceptibility determination of MBF against E. coli was performed using the agar dilution method in accordance with the CLSI recommendations from a previously described report. Strains (2–4 μl, about 108 CFU/ml) were inoculated onto LBA agar plates containing newborn calf serum, with twofold serial dilutions of marbofloxacin (0.0625–32 μg/ml). The strains over 32 μg/ml were screened to expand the range of twofold dilutions of MBF. Plates of strains were incubated for 48 h at 37°C. MICs were determined as the lowest drug concentrations that caused complete growth inhibition (100%). E. coli (ATCC 25922) was used as the quality control (QC) strain to verify the results of the susceptibility testing.
Determination of MIC, MBC, and MPC
The MIC of 218 E. coli was determined with the agar dilution method in accordance with the CLSI recommendations (Jorgensen, 1993; Lei et al., 2017a). Strains of E. coli (2–4 μl, about 108 CFU/ml) were inoculated onto LBA agar plates with twofold serial dilutions of MBF (0.0625–32 μg/ml). Plates of strains were incubated for 48 h at 37°C. MIC was the lowest concentration of MBF where visible bacterial growth was inhibited.
A 100 μl suspension from 96-well plates of MBF where the MIC value was determined by the broth dilution method, according to the guidance of clinical and laboratory standards institute (CLSI), was diluted 10-fold or more with LB and then 10 μl of each suspension dilution was spread and counted on the LBA plates for 48 h at 37°C. MBC was the lowest concentration of MBF inhibiting 99.9% bacterial density of E. coli.
Then, 1010 CFU/ml of concentrated E. coli (HB197) was prepared to determine the MPC on LBA plates (Blondeau et al., 2010). In addition, the suspension was spread onto LBA, including serial dilutions of MBF (1–32 MIC); the MPC was defined as the lowest concentration inhibiting bacterial growth for 96 h at 37°C.
Bacterial Growth Curves after Different Concentrations of MBF In Vitro and Ex Vivo
The HB197 isolate was chosen to determine the growth curve under optical density (OD600 nm). The OD600 nm values were determined from the LB and ileum content including HB197 at different points: 0, 2, 4, 6, 8, 10, 12, and 24 h.
According to the MIC of MBF against HB197 in MIC value (2 μg/ml), LBA plates were prepared with different MBF concentrations ranging from 1/4 to 32 MIC. From the bacteria-containing fluid, 100 μl was diluted with normal sterile saline (10-1 to 10-5 dilution ratio), then aliquots of the last four diluted samples were dropped onto the LBA plates at 0, 2, 4, 6, 8, 10, 12, and 24 h of culture, after which, samples were incubated for 48 h at 37°C.
For the ex vivo time-killing curves (bacterial growth curves after different concentrations of MBF), the bacteria (106 CFU/ml) were co-incubated with ileum content samples obtained from pigs at different points (0, 0.25, 0.5, 1, 2, 4, 6, 8, 10, 12, and 24 h) after treatment with 2 mg/kg MBF by oral administration. The ex vivo time-killing curve in vitro was fitted to a PD model with the hypothesis of a decrease in MBF concentration based on incubation time with the inhibitory sigmoid Emax model.
Dose Administration and Experimental Design
Pharmacokinetic Experimental Design in Plasma
Eight healthy (bisexual and half) pigs weighing 15–20 kg and aged 4–5 weeks were used for this study. All pigs received MBF by oral administration at a dose of 2 mg/kg. Blood samples (5 ml) were collected at 0.25, 0.5, 1, 2, 4, 6, 8, 10, 12, 24, 36, 48, and 72 h after oral administration.
Insertion of Ileac Cannulation and Sample Procedures
Cannulation was exteriorised on the right side of the pig between the last two ribs (Wubben et al., 2001). Anaesthesia was administered intravenously with 15 mg/kg ketamine. Cannulation was composed of 10 cm medical grade rubber plastic tubing (acetal homopolymer resin) with 2–3 cm inner–outer diameters. The large diameter end of the tubing was hand-tooled to provide a flanged end with a concave inner surface to conform to the shape of ileum. All unthreaded areas on the cannula were hand-finished to smooth the surfaces and edges where the cannula would make contact with the tissues. Pigs were recovered well for 2 weeks and kept in warm and comfortable rooms until the official test. Ileum contents (10–20 g) were collected into tubes from the ileac cannulation at 0.25, 0.5, 1, 2, 4, 6, 8, 10, 12, 24, 36, 48, and 72 h after oral administration of a dose of 2 mg/kg.
Blood and Ileum Contents Treatment
Blood samples collected with an anticoagulant were centrifuged for 10 min at 3000 rpm to obtain the plasma. Then, 0.5 ml plasma samples were selected and 2 ml of dichloromethane was added to the tubes, being vortexed for 2 min and centrifuged at 5000 rpm for 10 min. The above procedure was repeated twice. The dichlormethane phase was transferred to a clean tube and evaporated under nitrogen in thermostat water bath with 60°C. A sample of 0.5 ml of the mobile phase was added to the dried tube to dissolve the sample. The obtained samples were filtered through membrane filters with 0.22 μm pore size and analyzed by HPLC.
The vortexed ileum content (0.5 g) was extracted in sealed 50 ml tubes by shaking for 10 min and added 10 ml dichloromethane, being vortexed for 2 min and centrifuged at 5000 rpm for 10 min. The above procedure was repeated twice. The dichlormethane phase was transferred to a clean tube and evaporated under nitrogen in thermostat water bath with 60°C. 0.5 ml of mobile phase was used to dissolve the sample in the dried tube. The obtained samples were filtered through membrane filters with 0.22 μm pore size and analyzed by HPLC.
HPLC Conditions for MBF and Pharmacokinetic Analysis
A C18 reverse-phase column (250 mm × 4.6 mm, i.d., 5 μm, Agilent, United States) was used for HPLC, which was performed with a 295 nm detection wavelength at 30°C. The mobile phase consisted of acetonitrile (phase A) and 0.1% formic acid (phase B) (v:v, 82:28) with 1 ml/min flow rate of mobile phase. The HPLC method validations of MBF in plasma and ileum content were analyzed with external standard method. The MBF concentrations in the range of 0.05–20 μg/ml in plasma and ileum content, and the identical concentrations MBF standard were detected by HPLC to obtain recovery, linear regression curve and coefficient of variation.
Pharmacokinetic parameters were calculated from plasma and ileum content MBF concentrations by WinNonlin software (version 5.2.1, Pharsight Corporation, Mountain View, CA, United States). Drug concentrations were plotted on semi-logarithmic graphs to choose the appropriate PK models. The PK parameters, including Cmax, Tmax, AUC, and so on were obtained by least squares regression analysis and calculated by WinNonlin software.
PK/PD Integration Analysis
For antibiotics whose pharmacokinetic or pharmacodynamic parameters represented concentration dependent, the PK/PD index should be AUC0-24 h/MIC and Cmax/MIC (Andraud et al., 2011; Yohannes et al., 2015). The AUC0-24 h/MIC and Cmax/MIC were selected as the combined PK/PD parameters which were calculated in each dose of the time-killing curve. The inhibitory sigmoid Emax model was used to analyze the integration of AUC0-24 h/MIC ratio in vitro and bacteria count change (CFU/ml) in ileum contents during 24 h incubation with WinNonlin software (Aliabadi and Lees, 2001, 2002; Aliabadi et al., 2003). The model equation was described as shown in Eq. 1:
E denotes the effect of antimicrobial agent measured as the log10 difference in bacterial number before and after 24 h incubation in vitro, E0 and Emax indicate the changes in log10 difference between 0 and 24 h in the control samples and those containing MBF samples, EC50 shows the AUC0-24 h/MIC value reached at 50% of the Emax, C denotes the AUC0-24 h/MIC ratio, and N indicates the Hill coefficient.
Doses Estimation
The following formula was used to estimate dosages in different magnitudes of efficiency (E = 0, no change in bacterial count, E = -1, 99.9% reduction in count, E = -3, 99.99% reduction) to deduce an optimal regimen.
AUC/MIC indicates the targeted end-point for optimal efficacy, MIC denotes the minimum inhibitory concentration, CL shows clearance per day, fu indicates the free fraction of the drug in plasma, ignoring minimal binding, and F denotes the bioavailability.
The daily dose was calculated by Monte Carlo Simulations in Oracle Ball (Oracle Corporation, Redwood Shores, CA, United States).
Statistical Analysis
MIC90 was calculated by using SPSS software, and statistical analysis was performed with Student’s t-test and Bonferroni revision to compare the parameters of each group. P < 0.05 was considered to indicate statistical significance of the difference.
Results
MIC Distribution of E. coli
The MIC distribution of the 218 E. coli strains to MBF are shown in the Figure 1. Based on the CLSI breakpoints guidance document M 100-S23, 142 susceptible E. coli isolates (MIC ≤ 2 μg/ml) were selected. The MIC50 and MIC90 of these susceptible strains were 0.5 and 2 μg/ml, respectively. According to the MIC90 values of sensitive strains, an E. coli (HB197) whose MIC was similar to MIC90 was selected and used to study the antimicrobial activity of MBF both in vitro and ex vivo.
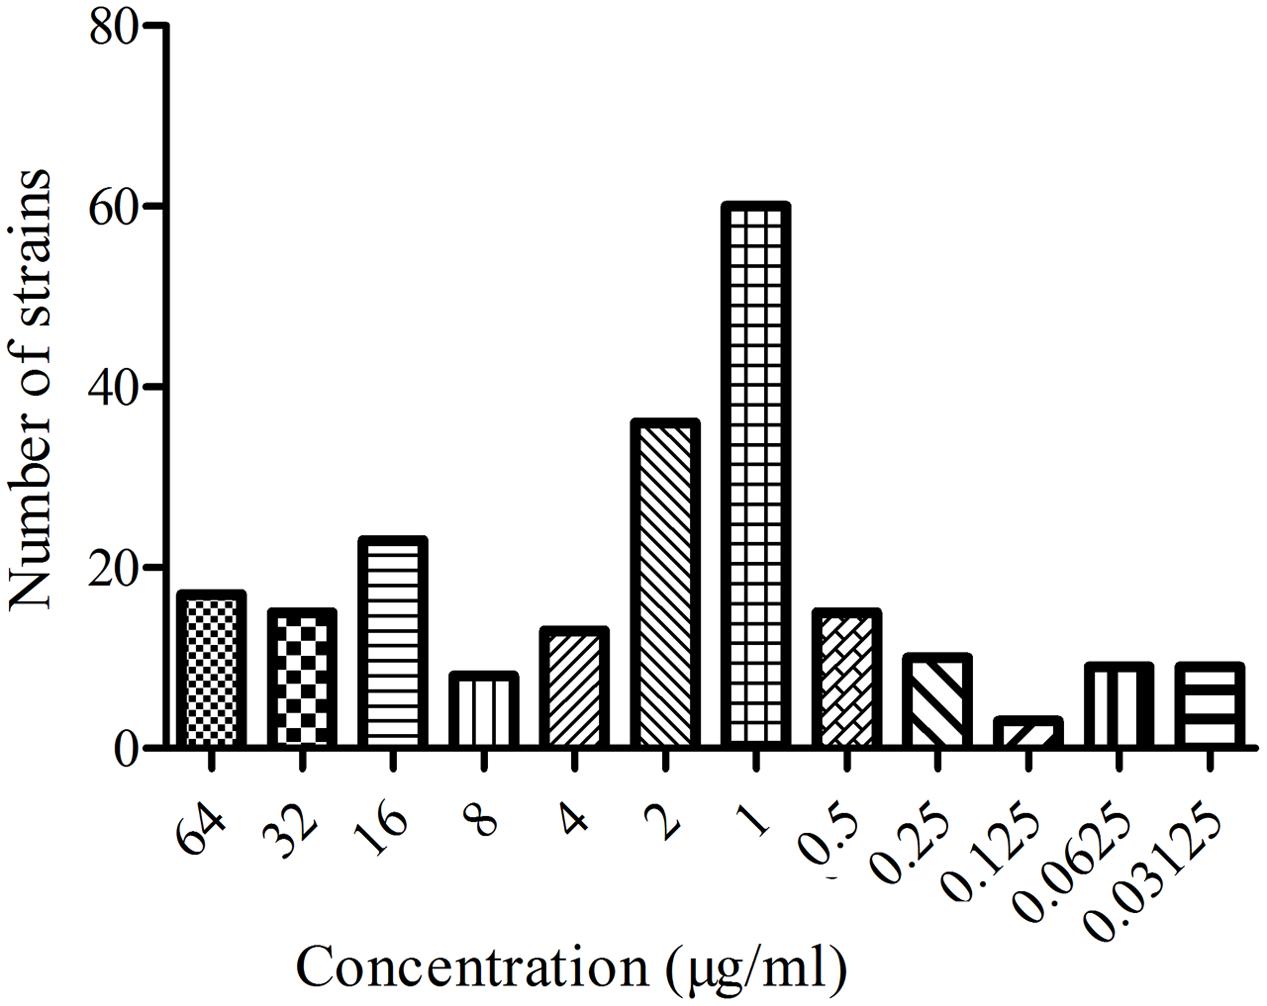
FIGURE 1. The MIC distribution of MBF against 218 E. coli.
MIC, MBC, and MPC of MBF against E. coli HB197
The MIC and MBC of MBF against HB197 were 2 and 4 μg/ml in LB, and 2 and 4 μg/ml in pig ileum content, respectively. The ratios of MBC/MIC were both 2. In addition, the MPC of MBF against HB197 was 8.19 μg/ml.
In Vitro and Ex Vivo Antimicrobial Activity of MBF
The time-growth curves of HB197 in vitro and ex vivo are shown in Figure 2. The logarithmic phases of HB197 in LB and ileum content were 2–12 h and 4–12 h, respectively. The time to reach logarithmic phase of HB197 in LB was quicker than that in ileum content. However, the total bacterial amount of HB197 in ileum content was higher than that in LB.
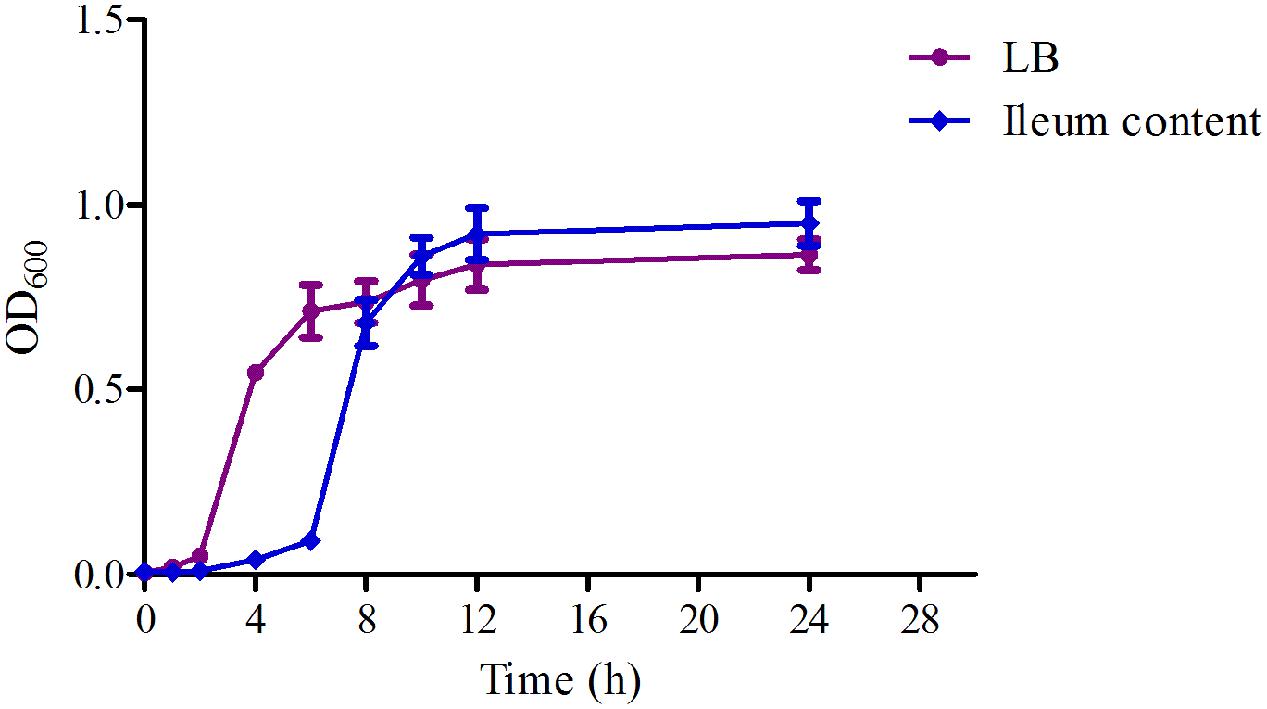
FIGURE 2. The growth-time curves HB197 in vitro and ex vivo.
The time-killing curves of MBF against HB197 in vitro and ex vivo are shown in Figures 3A,B. Obviously, MBF displayed a concentration-dependent bactericidal activity based on the characteristic of curves in vitro and ex vivo. In the curves, there was a positive correlation between the bactericidal effect of MBF and HB197 both in vitro and ex vivo. At the same time, according to the profiles shown in Figures 3A,B, after exposure to the 1 MIC of MBF for 12 h, the bacterial CFU was significantly decreased, but could still recover growth. Moreover, after exposure to MBF concentrations higher than 1 MIC for 8 h, bacterial CFU were significantly decreased to undetectable levels (<30 CFU). The time-killing characters in vitro and ex vivo were similar to each other. These results also revealed that MBF was a typically concentration-dependent action both in vitro and ex vivo and that a 2 MIC concentration of MBF could completely eliminate E. coli after 8 h.
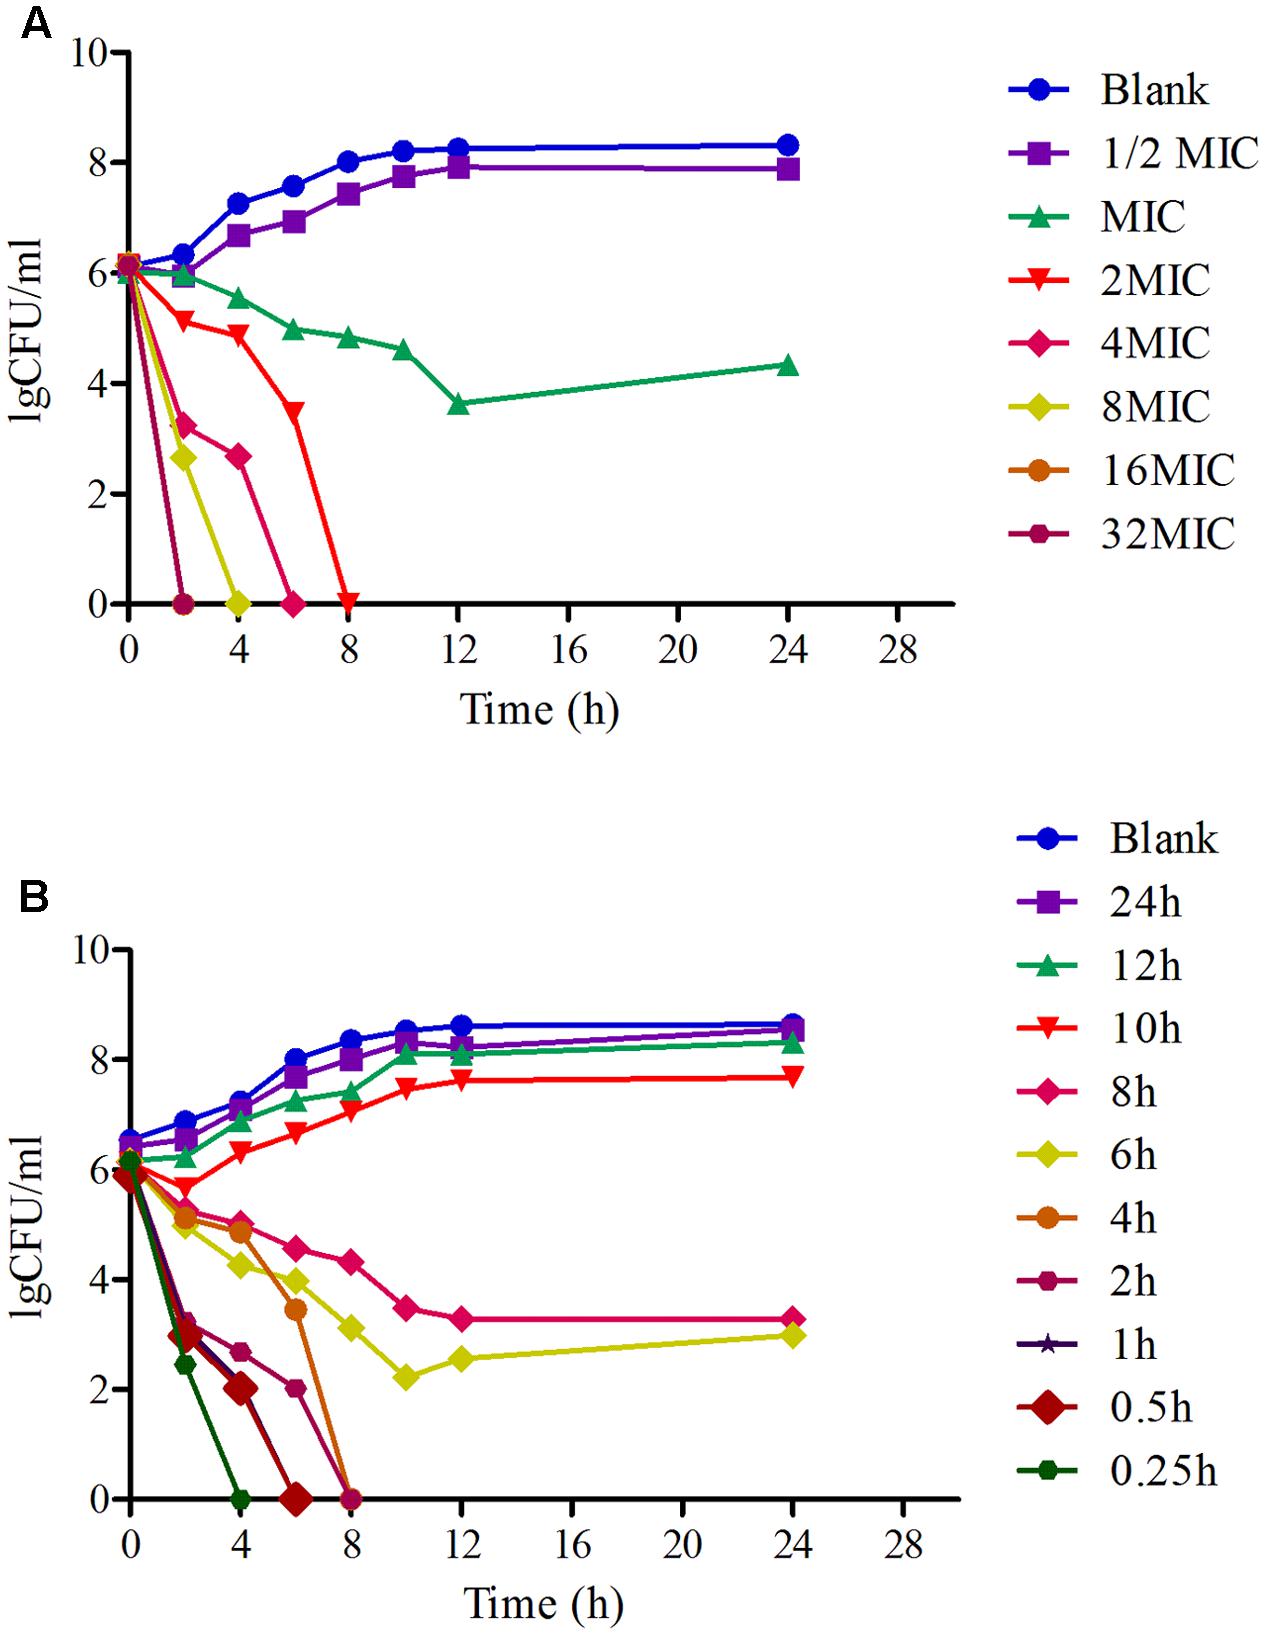
FIGURE 3. The time-killing curves of MBF against E. coli in vitro (LB) and ex vivo (ileum content). (A) Presented the curve in vitro, (B) presented the curve in ex vivo.
Pharmacokinetic Analysis of MBF in Plasma and Ileum Content
The proposed methods of HPLC were suitable for MBF quantification in plasma and ileum content. These showed specificity and recovery ratios of over 92% in the plasma and 84% in the ileum content, in accordance with the veterinary drug residue guidelines of the Agriculture department and United States Pharmacopeia (Gad, 2014; Lei et al., 2017b), with a good linear relationship from 0.05 to 20 μg/ml. The chromatograms in Figures 4A,B showed the blank Figure 4A1, LLOQ Figure 4A2 and measured samples Figure 4A3 in plasma, and blank Figure 4B1, LLOQ Figure 4B2, and measured samples Figure 4B3 in ileum content, respectively. These indicated that the proposed methods for MBF detection in plasma and ileum content were specific and accurate. The lower limit of determination (LLOD) in plasma and ileum content were both 0.025 μg/ml, the LLOQ were both 0.05 μg/ml, and the MBF was detected at the retention time of 6.5 min.
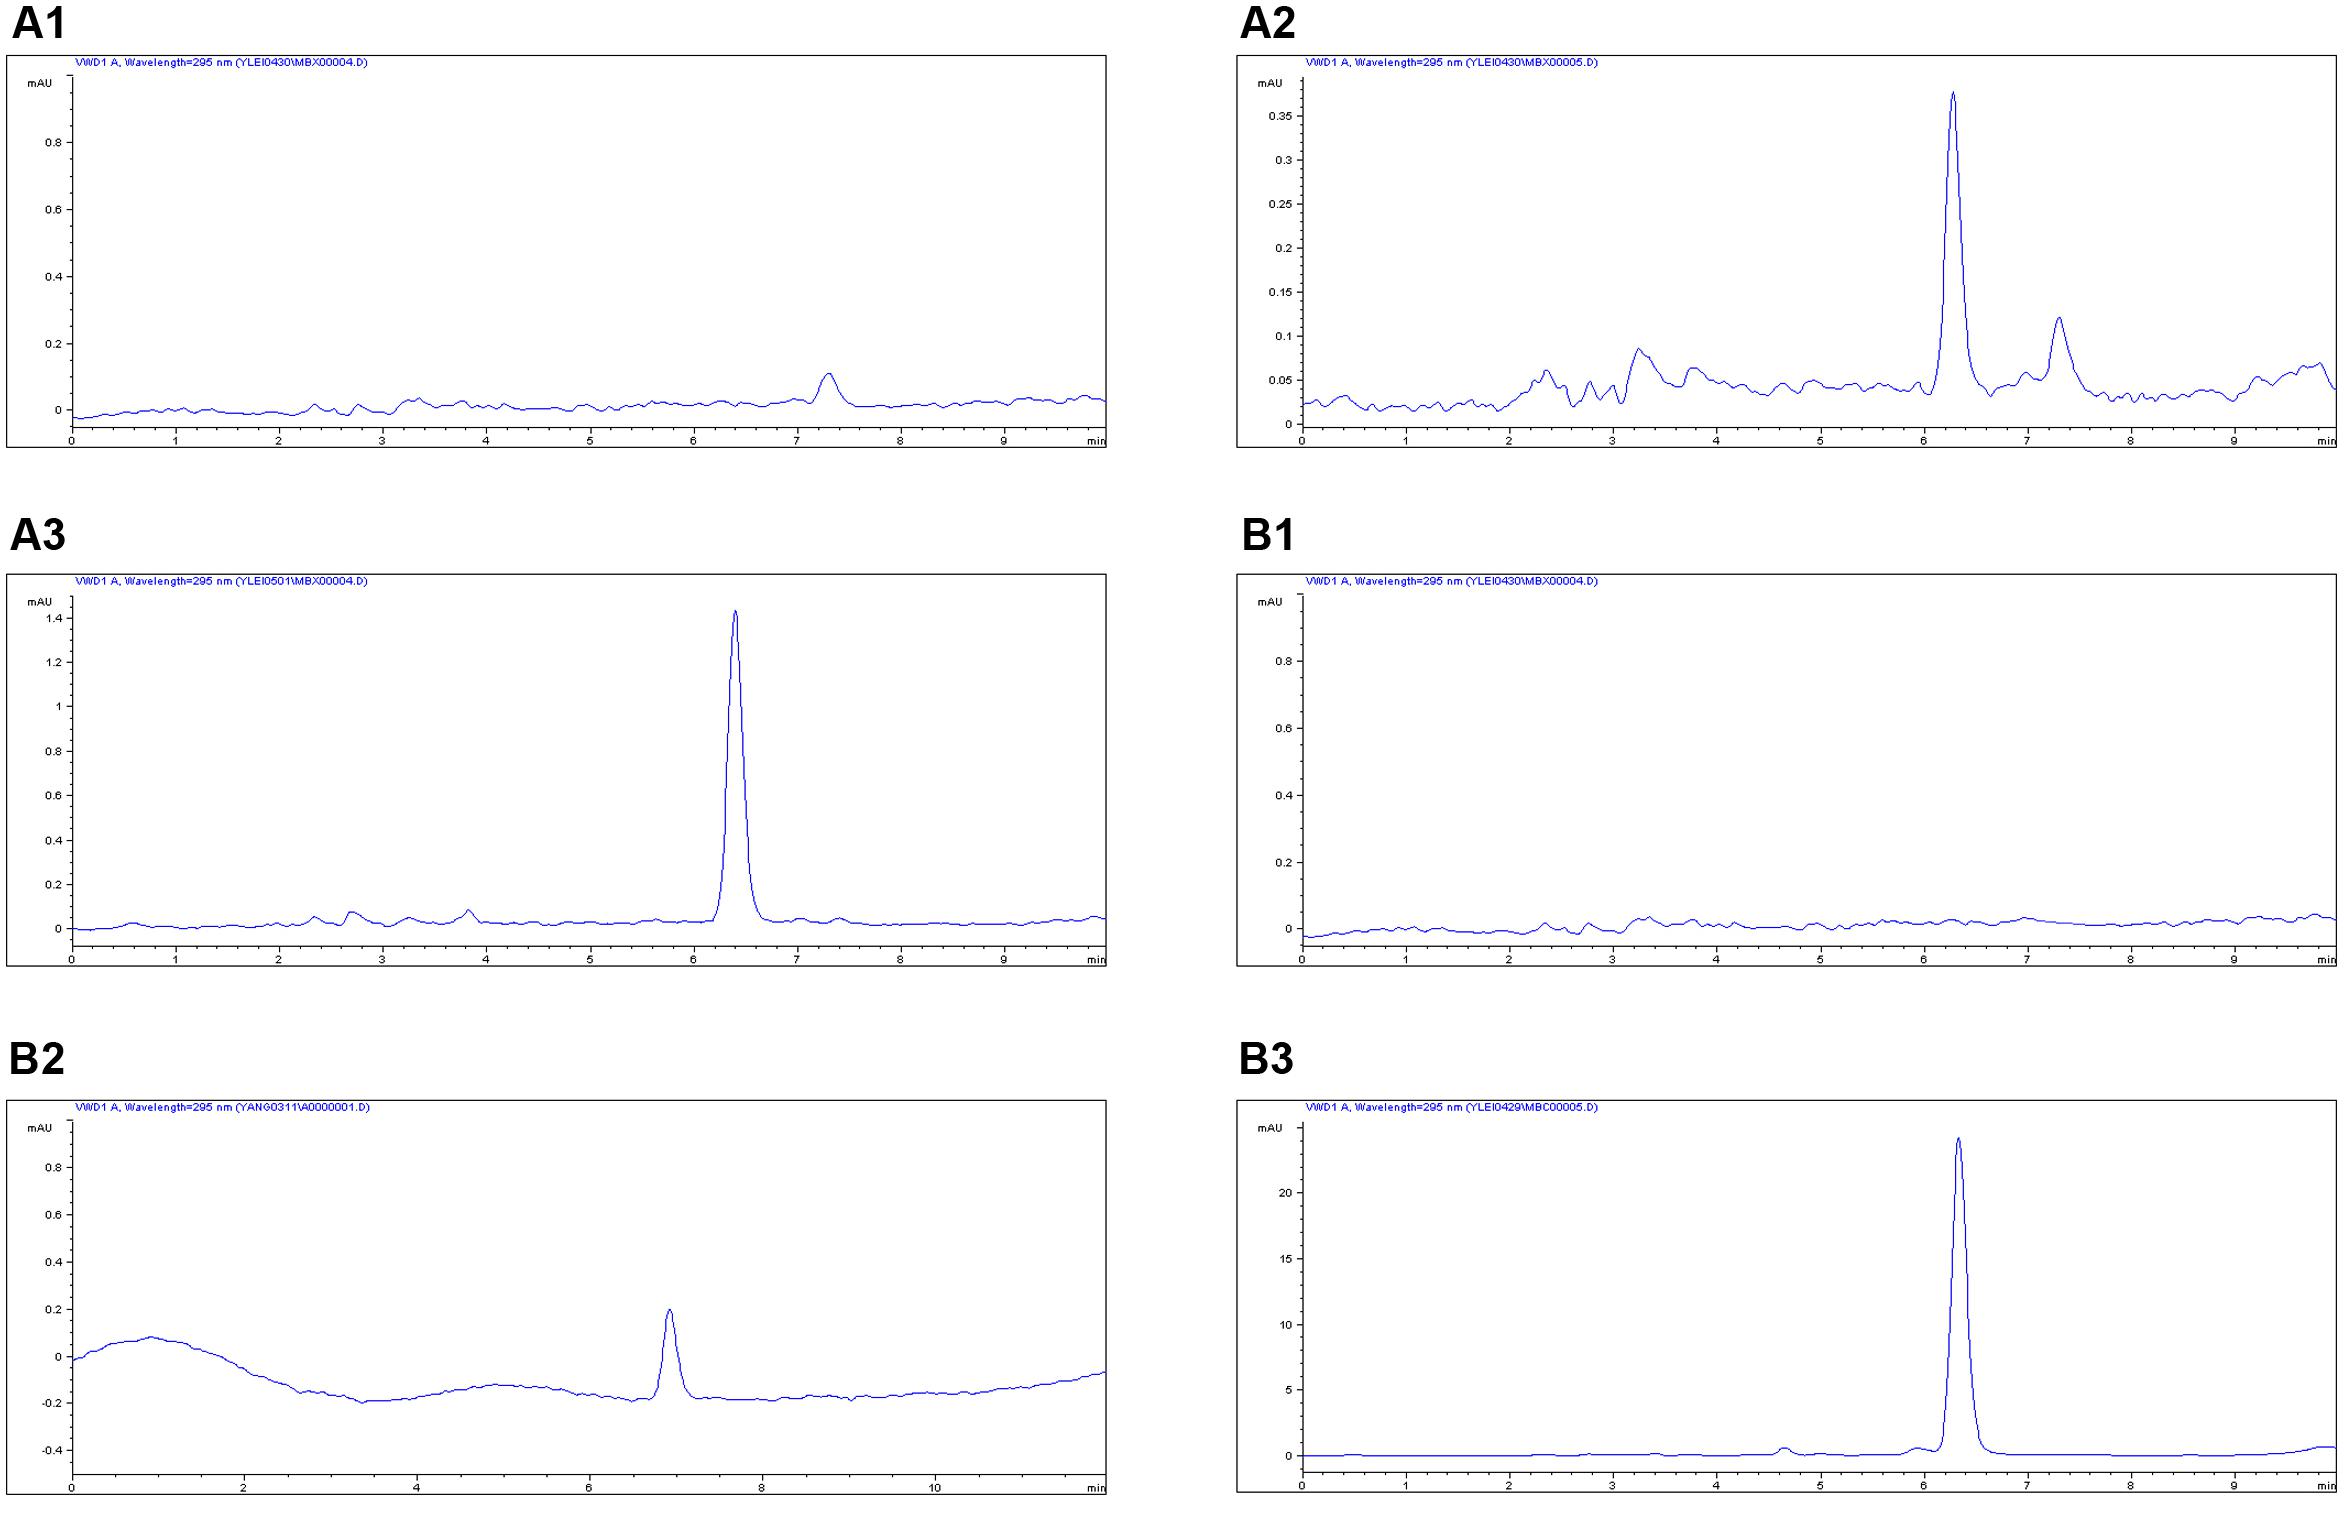
FIGURE 4. The HPLC method for MBF quantification in plasma and ileum content. The representative HPLC chromatograms of plasma were shown: (A1) blank sample, (A2) plasma sample at the LLOQ of 0.05 μg/ml, (A3) plasma sample after oral administration of MBF at the point of 1 h; the representative HPLC chromatograms of ileum content were shown: (B1) blank sample, (B2) ileum content sample at the LLOQ of 0.05 μg/ml, (B3) ileum sample after oral administration of MBF at the point of 1 h, the MBF at the retention time of 6.5 min.
The mean ± SD of MBF concentration-time profiles are shown in Figures 5A,B after oral gavage administration, and the main PK parameters are shown in Table 1 using non-compartment model both in plasma ileum content. The results in Table 1 showed that the main parameters of Cmax, AUC0-24 h, AUC, Ke, t1/2ke, MRT and Clb 11.28 μg/g, 46.15, 77.81 μg h/g, 0.001 h-1, 69.97 h, 52.45 h, 0.026 kg/h in ileum content, and 0.55 μg/ml, 8.15, 14.67 μg h/ml, 0.023 h-1, 30.67 h, 34.83 h, 0.14 L/h in plasma, respectively (Table 1).
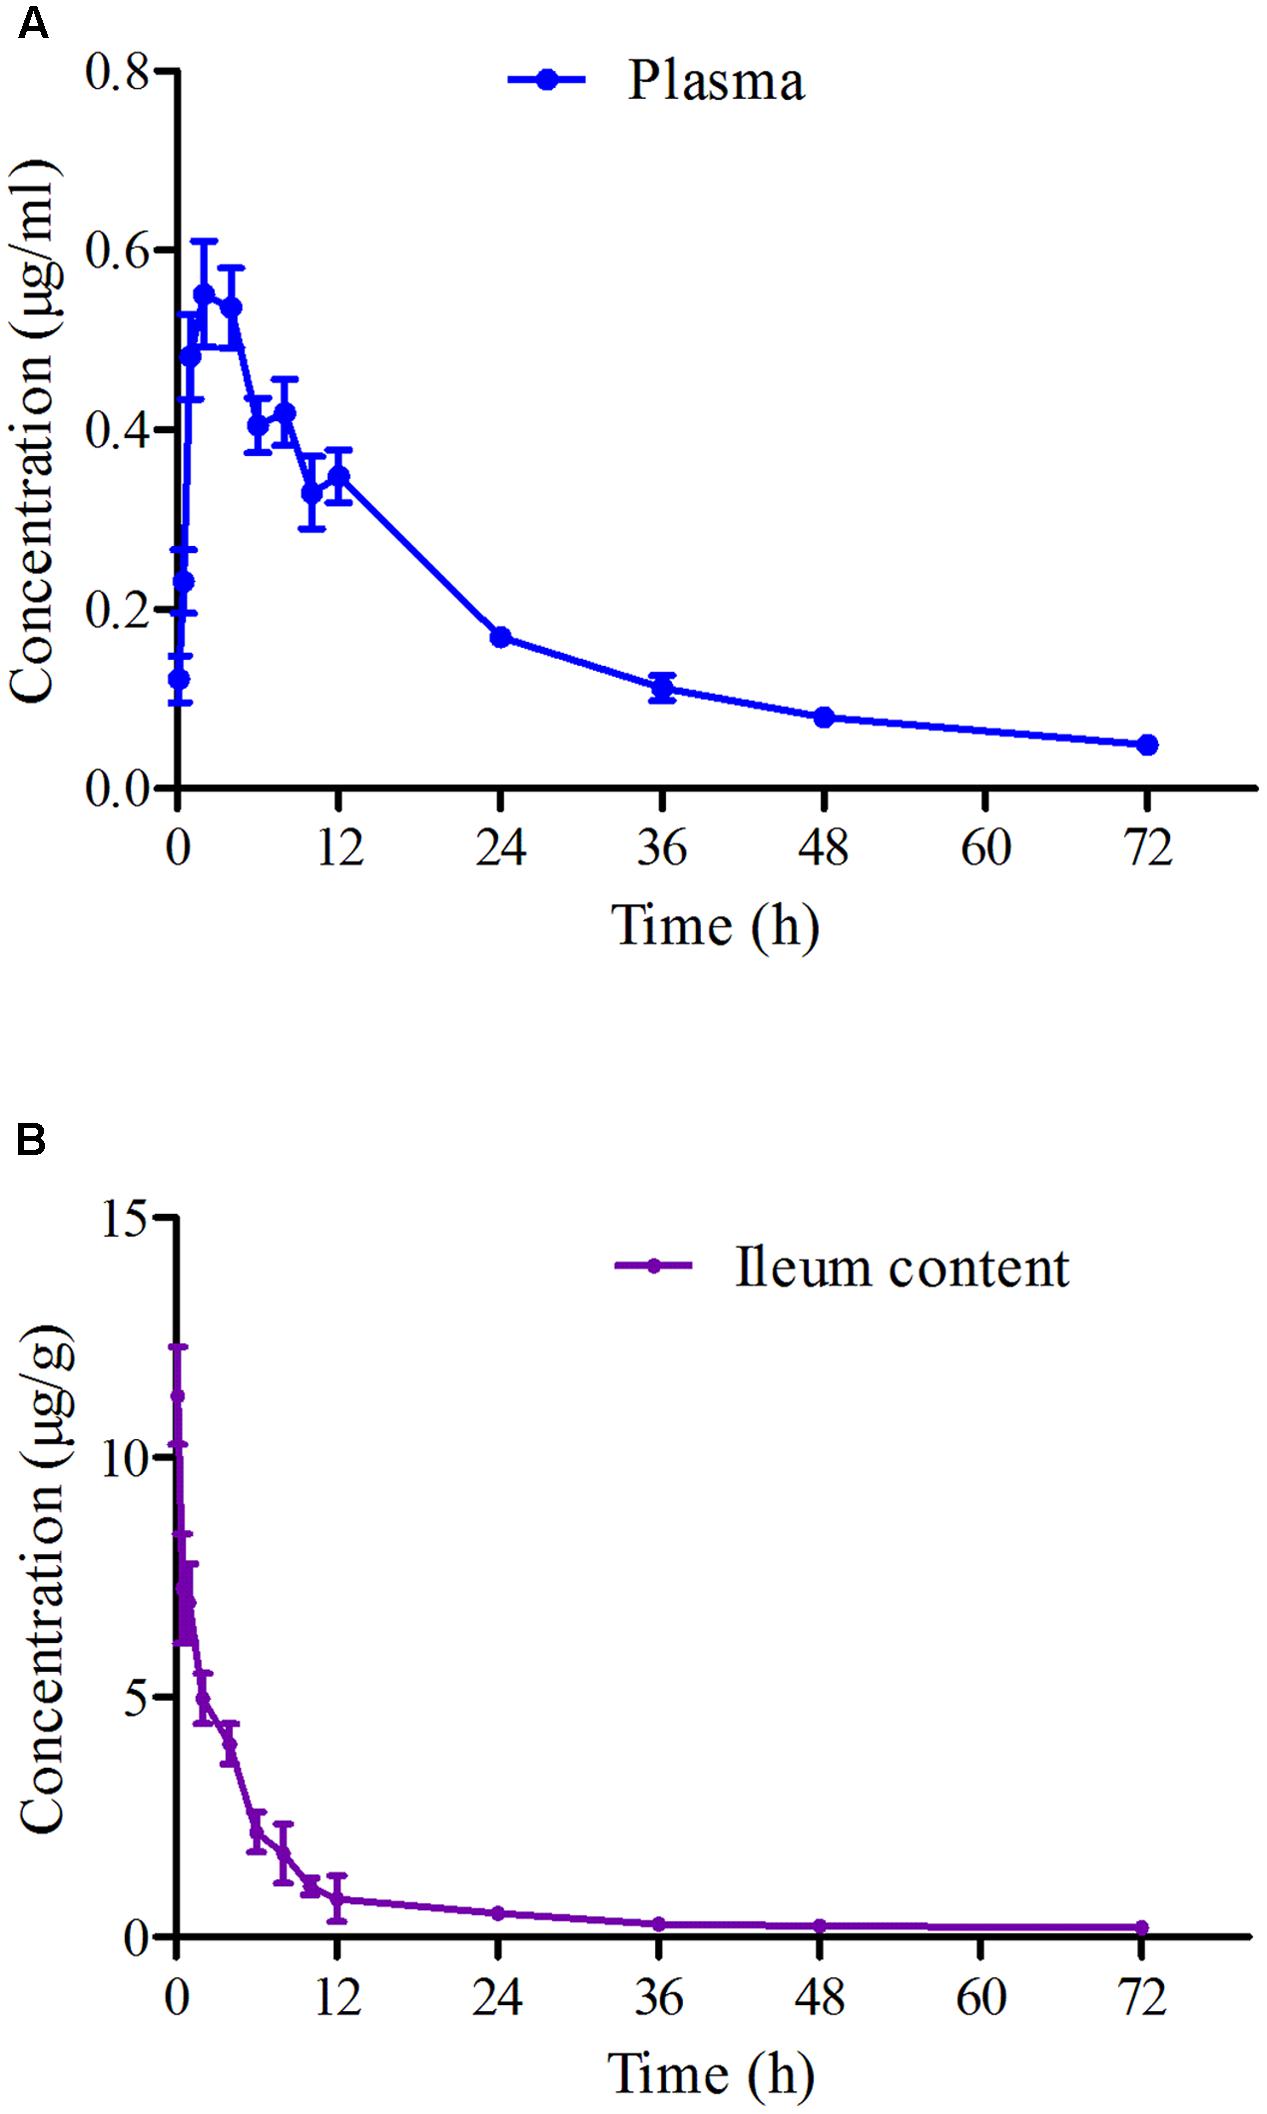
FIGURE 5. The curves of MBF concentration-time in plasma and ileum content of pigs at a dose of 2 mg/kg after oral administration at 0.25, 0.5, 1, 2, 4, 6, 8, 10, 12, 24, 36, 48, and 72 h. (A) Represented the curve in plasma; (B) represented the curve in ileum content.
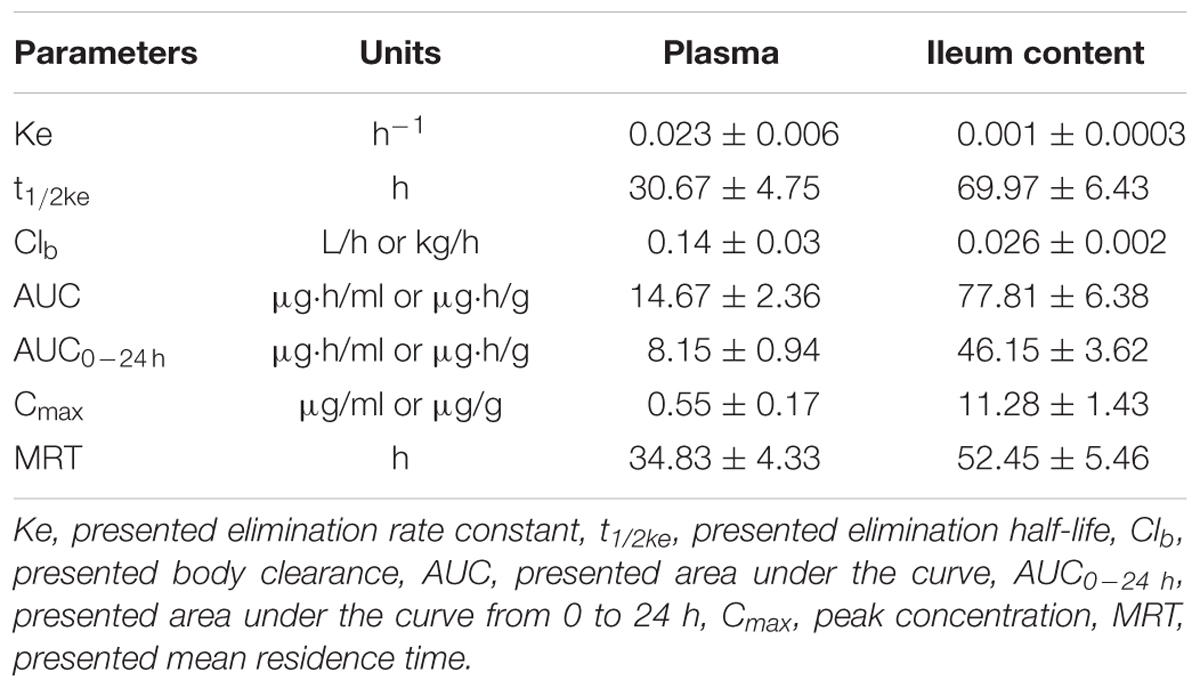
TABLE 1. The main pharmacokinetic parameters mean ± SD in pigs after a single oral dose of MBF (2 mg/kg.bw).
PK-PD Integration Modeling
As a concentration-dependent action, the selected PK/PD parameters achieved from PK data in vivo combined with MIC and MPC ex vivo are shown in Table 2. The ratios of Cmax/MIC, Cmax/MPC, AUC0-24 h/MIC and AUC0-24 h/MPC were 5.64, 1.37, 23.08, and 5.63, respectively, based on PK/PD data in ileum content (Table 1). Ex vivo antibacterial activity of MBF against E. coli (HB197) was determined in ileum content samples collected before and at 0.25, 0.5, 1, 2, 4, 6, 8, 10, 12, 24 h after oral administration. The relationship between antimicrobial efficacy and the ex vivo PK/PD parameter of AUC0-24 h/MIC ratios were simulated by using the inhibitory sigmoid Emax model. The model parameters of the Hill coefficient N, E0, Emax, and AUC0-24 h/MIC values are shown for three levels of growth inhibition in Table 3 and Figure 6. The values of the AUC0-24 h/MIC ratio needed for bacteriostatic activity (E = 0), bactericidal activity (E = -3), and bacterial elimination (E = -4) were 16.26, 23.54, and 27.18 h, as shown in Table 3.
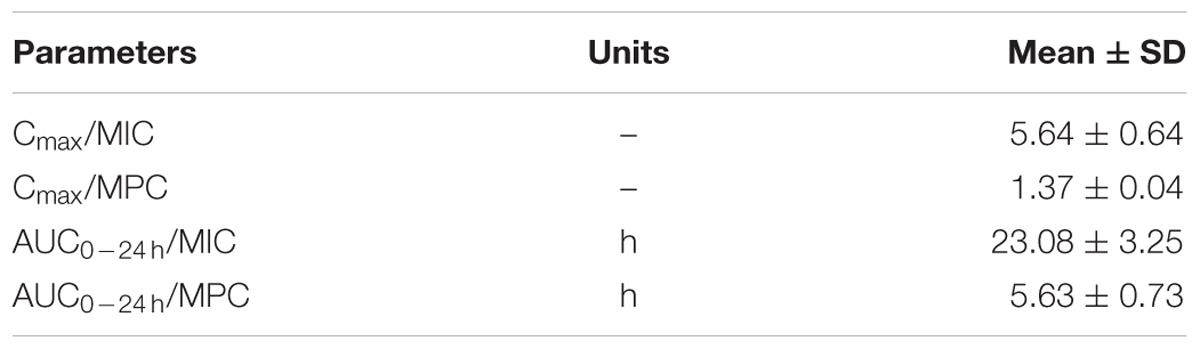
TABLE 2. The main PK/PD integration parameters for MBF in ileum content after a single oral dose of MBF (2 mg/kg).
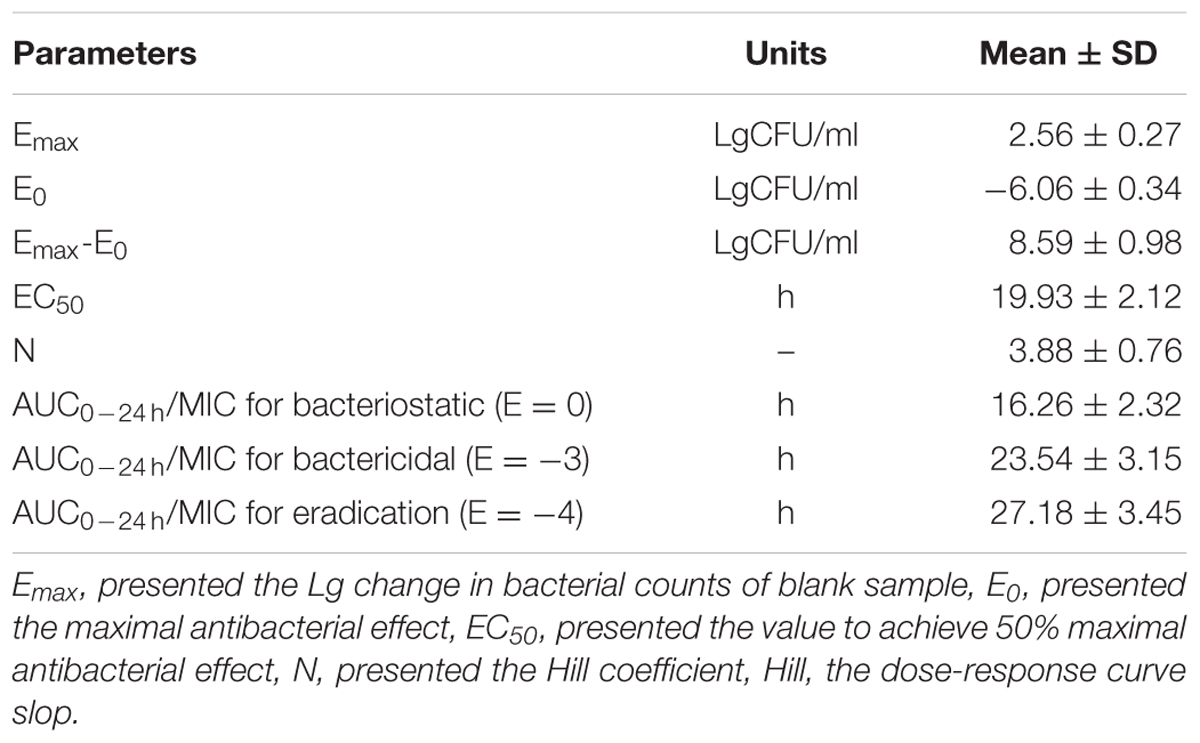
TABLE 3. The main parameters of PK/PD modeling of MBF ex vivo after a oral dose 2 mg/kg in pigs.
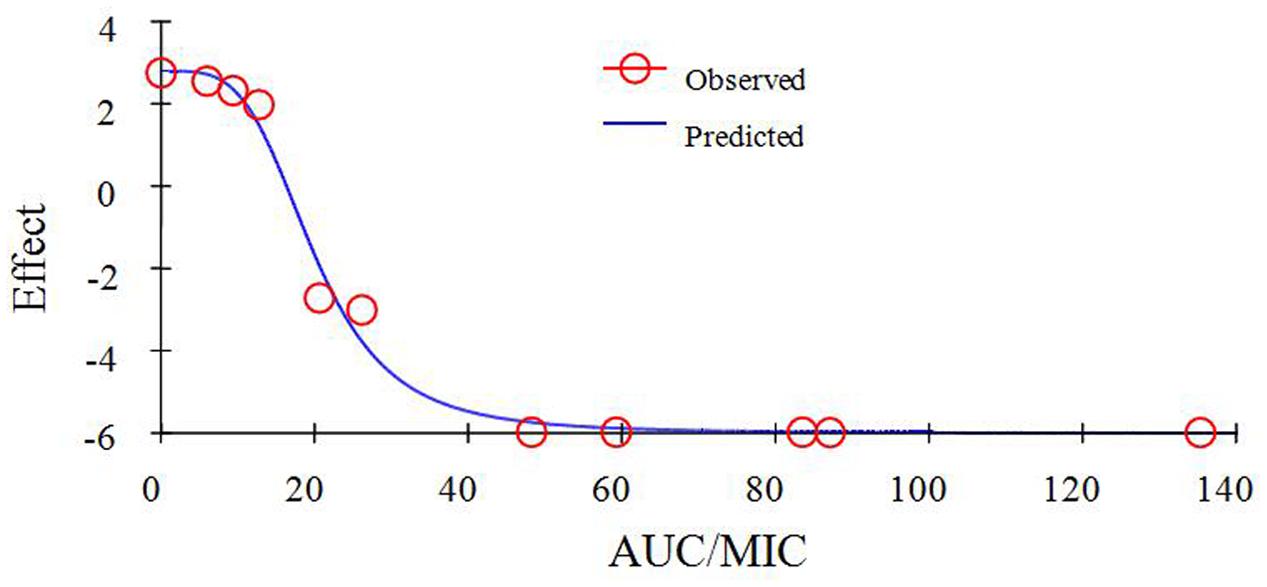
FIGURE 6. Plots of ex vivo AUC/MIC ratios versus the amount difference of E. coli HB197 within 24 h.
Estimation of Doses
The predicted once daily doses were shown in Table 4 according to the AUC0-24 h/MIC ratios and Clb for these three levels of antibacterial activity calculated from the PK/PD integrating model and the distribution of ex vivo MIC using Monte Carlo Simulations in Oracle Crystal Ball. The distribution of predicted population dose (AUC0-24 h/MIC) values of MBF curing E. coli for 50 and 90% targets could be observed, respectively, in Figure 7. In this study, based on the dose equations, the predicted doses for bacteriostatic, bactericidal and elimination activity of MBF against E. coli over 24 h were 0.85, 1.22, and 1.41 mg/kg.bw for 50% target, respectively, and 0.92, 1.33, and 1.53 mg/kg.bw for 90% target, respectively in Table 4.
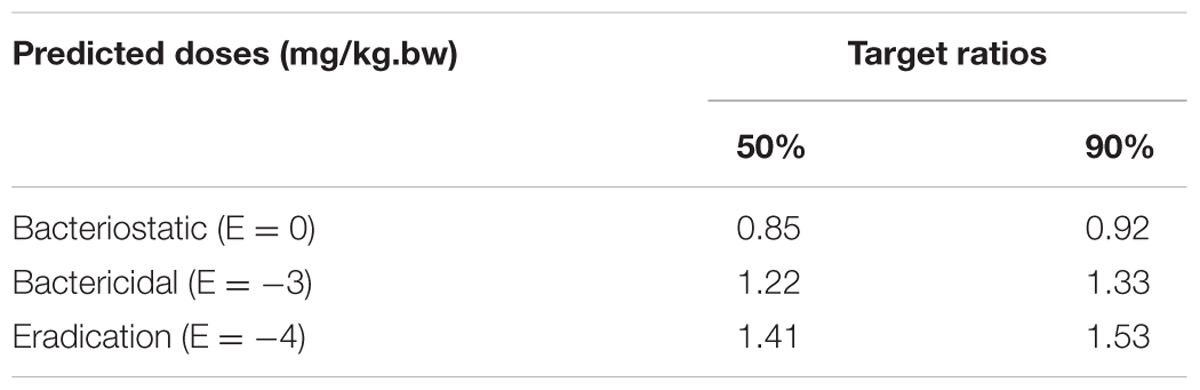
TABLE 4. The predicted daily doses of MBF curing E. coli.
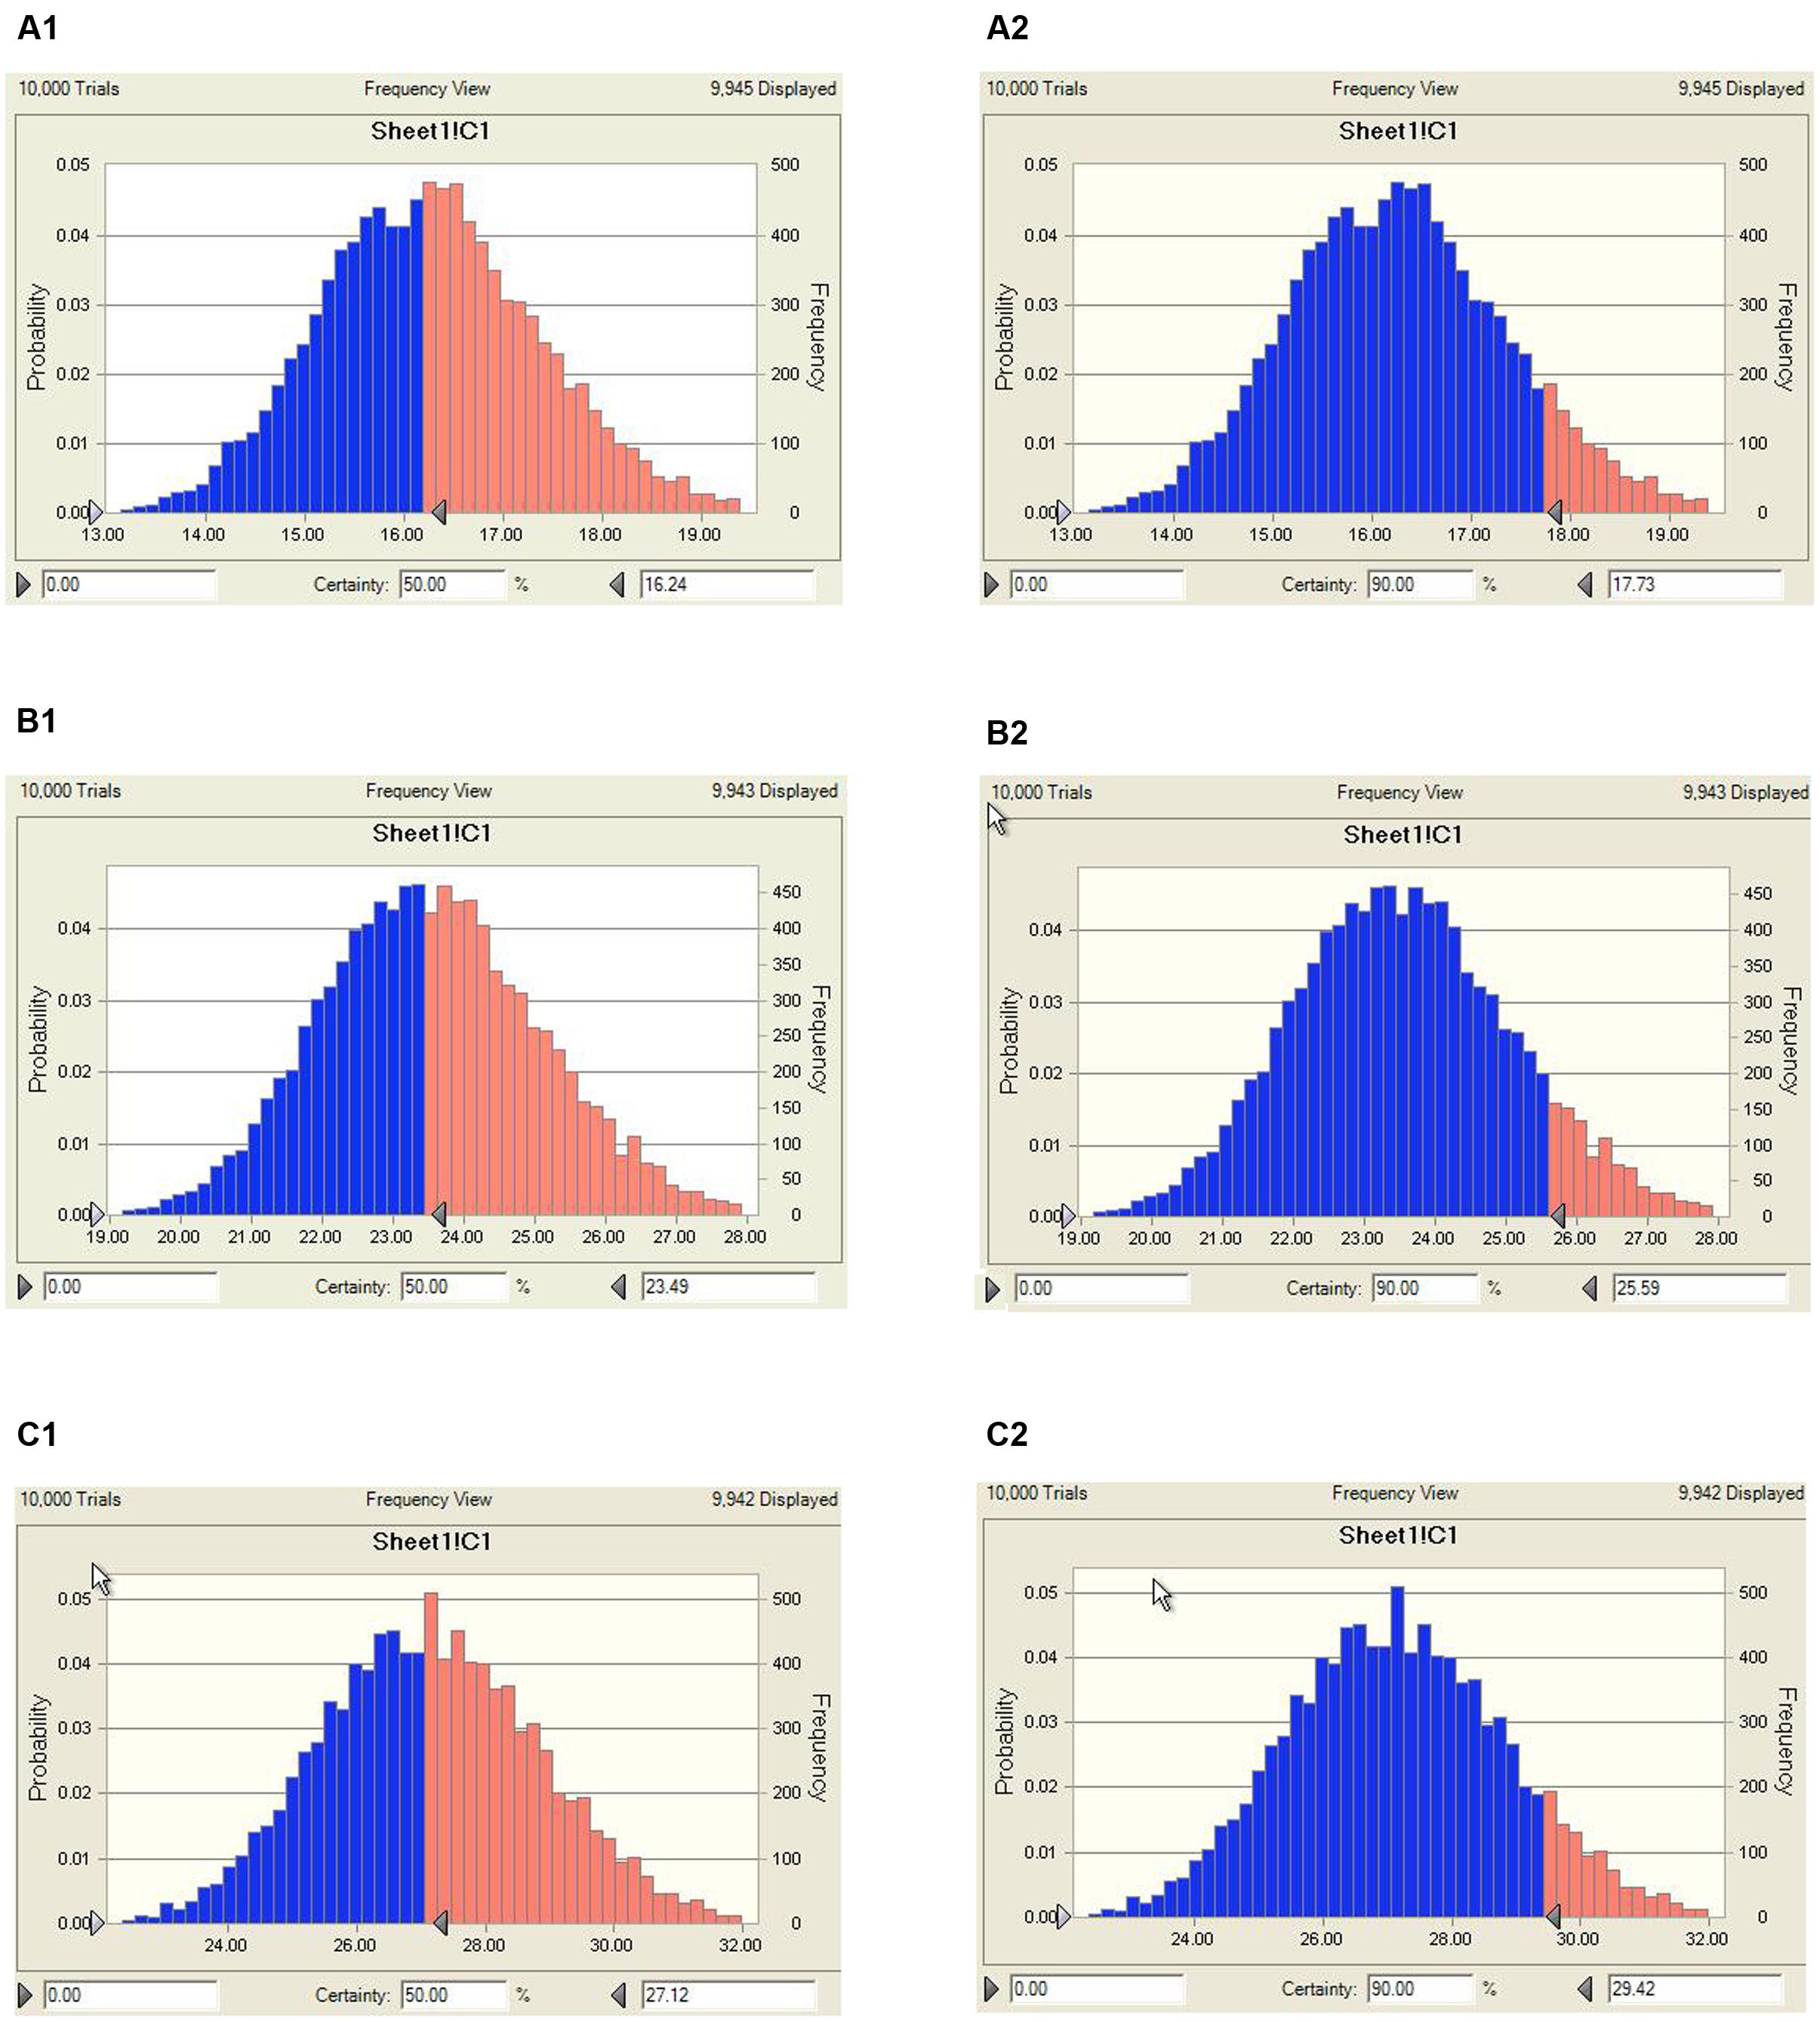
FIGURE 7. Distribution of predicted population doses (AUC0-24 h/MIC) of MBF against E. coli (HB197). (A1) Presented the predicted population dose for bacteriostatic at 50% target, (A2) presented the predicted population dose for bacteriostatic at 90% target, (B1) presented the predicted population dose for bactericidal at 50% target, (B2) presented the predicted population dose for bactericidal at 90%, (C1) presented the predicted population dose for elimination at 50% target, (C2) presented the predicted population dose for elimination at 90%.
Discussion
As a new fluoroquinolone, MBF had complete absorption, and high drug concentrations in ileum content, which was the target site infected by E. coli after oral administration, and high antimicrobial activity in vitro and ex vivo. However, due to the overuse and misuse of antimicrobial agents, the resistance of the pathogenic bacterium to fluoroquinolone or other drugs was increasingly more serious (Burgess, 1999). An increasing number of studies about E. coli resistance to fluoroquinolone including MBF have been reported in most countries, such as Europe, the United States, China, and so on (Liu et al., 2013, 2015; Cheng et al., 2014; El Garch et al., 2017). The cross-resistance to similar antibiotics was widespread, and the resistance mechanisms were complex. Thus, it was crucial to reasonably use and effectively manage these new generational antibacterial agents, and necessary to establish an optimal dosage for MBF curing E. coli in this study.
In this study, 218 isolated E. coli strains were selected for PD research, such MIC, MBC, MPC and time-killing curve evaluations when exposed to MBF. In total, 142 of all selected strains were screened as sensitive populations according to the CLSI breakpoint guidance document M100-S23 (MIC ≤ 2 μg/ml) and other published reports (Andraud et al., 2011). The MIC values were in the range from 0.03215 to 64 μg/ml in whole strain populations, and 0.03125 to 2 μg/ml in the sensitive populations, respectively. The MBF-resistant E. coli, which had been found in many other reports, were also identified (Pellet et al., 2006; Andraud et al., 2011); the results in this study were similar to those in published reports. The mechanism of resistance of E. coli to MBF may be the abuse of antibiotics and cross-resistance reduced by other earlier fluoroquinolone drugs (Huguet et al., 2013; Sato et al., 2013). In the sensitive E. coli populations, the MIC50 and MIC90 were 0.5 and 2 μg/ml, respectively (Figure 2). These results revealed that MBF had high antibacterial activity in vitro. A highly pathogenic clinical isolate, HB197, was selected in accordance with the pathogenicity experiment in mice (data not shown) and MIC90. The MIC values and growth curves of HB197 in LB and ileum content showed no significant difference (Figure 1), and the time-killing curves in vitro showed that MBF was bactericidal against E. coli, with a concentration-dependent type (Figure 3). The 2 MIC concentration of MBF could completely eliminate E. coli after 8 h, with results similar to those previously described by Pellet et al. (2006) and Andraud et al. (2011), and other fluoroquinolone-like Enrofloxacins against E. coli in the reports (Wang et al., 2016). According to the profiles of Figure 3B, the drug concentration of MBF at the different time points from 0.25 to 4 h achieved from the plasma in PK study, had strong bactericidal effect within 8 h. Moreover, it also had bacteriostasis effect at the time points from 6 to 8 h. All of these results demonstrated that MBF had strong antibacterial activity against E. coli in vitro and in the ileum.
As far as we know, PK/PD integration modeling was an effect approach to dose titration studies for selecting rational dosage regimens in veterinary medicine (Toutain and Lees, 2004). Furthermore, the measurement at the infection site for PK and PD was a preferred method to analyze and correlate PK/PD modeling (Liu et al., 2002; Mouton et al., 2008). The PK of drug concentrations was investigated in serum as the ex vivo data in most published PK/PD modeling studies, and there were also studies for MBF against Haemophilus parasuis and Pasteurella multocida in beagle, sheep, calves, turtles, broiler chicken, pigs, and so on (Sidhu et al., 2010; Vallé et al., 2012; Potter et al., 2013; Qu et al., 2015; Sun et al., 2015; Yohannes et al., 2015). However, the PK of MBF in the ileum content which was the target infection site by E. coli of pigs was the first to investigate using ileac cannulation. The ileac cannulation in vivo could keep target animals in a normal physiological state; this state for animals had the advantage of obtaining a more accurate concentration for PK data (Garrison et al., 2002).
The PK data in plasma after oral administration of the recommended dose of 2 mg/kg for Cmax, AUC0-24 h, AUC, Ke, t1/2ke, MRT and Clb were 0.55 μg/ml, 8.15, 14.67 μg⋅h/ml, 0.023 h-1, 30.67 h, 34.83 h, 0.14 L/h, respectively (Table 1). The value of t1/2ke (30.67 h) in this study was similar to that of a published report (23.14 h) both after orally administration (Ding et al., 2010), but higher than those in broilers (5.26 h), buzzards (4.11 h), beagle dogs (7.51 h), pigs (17.3 h), and turkeys (7.37 h) after intramuscular injection (Garciamontijano et al., 2001; Anadón et al., 2002; García-Montijano et al., 2003; Haritova et al., 2006). However, the value of Cmax (0.55 μg/ml) after oral administration was lower than that after intramuscular injection, but similar to that (0.67 μg/ml) after oral administration reported by Haritova et al. (2006). The differences in these results were due to the routes of administration, species and dosing differences. Moreover, the value of AUC (14.67 μg.h/ml) was similar to that (11.37 μg.h/ml) reported in beagle dogs by Yohannes et al. (2015) and that reported in poultry (10.86 μg.h/ml) by Haritova et al. (2006).
Compared to plasma, the drug concentrations in the ileum content were significantly higher, with Cmax and AUC of 11.28 μg/ml and 77.81 μg.h/ml, respectively, which were 20 and 5.3 times higher than those in plasma, respectively (Table 1). There were no other studies of the concentration of MBF in ileum content, and this was the first to evaluate the PK of MBF in the ileum content in this study. The difference in concentrations between plasma and intestinal contents could be due to the high lipophilicity of MBF; this could be the reason why the Clb (0.14 L/h) in plasma is much higher than that (0.026 kg/h) in intestinal contents in this study. These results revealed that MBF had a strong penetration ability for various tissues and easily accumulated in intestinal contents following oral administration. These characters were also similar to those of other studies of MBF in beagle dogs (0.17 L/h), pigs (0.21 L/h), and foals (0.34 L/h) (Vallé et al., 2012; Tohamy and El-Gendy, 2013; Yohannes et al., 2015). At the same time, MBF could also penetrate membranes and tissues, binding to solid parts of the ileum content. The drug concentration dissolved in the aqueous phase was the main activity and worth detecting. Due to the high drug concentrations in ileum content, the AUC (77.81 μg.h/ml) was much higher than that (22.56 μg.h/ml) in plasma by intravenous injection administration in the previously described report (Ding et al., 2010), the bioavailability was considered as 1 for calculation, and it also was reported in the published reports (Wang et al., 2016; Yan et al., 2017).
As a kind of concentration-dependent action for MBF, the parameters Cmax/MIC > 10 and AUC0-24 h/MIC > 125 were used as a threshold for the successful therapeutic outcome of fluoroquinolones against gram negative bacteria (Toutain et al., 2002). However, these thresholds may be different for different fluoroquinolones. There were differences in the immune status of target animals and pathogens. The published AUC0-24 h/MIC was 46 h for bactericidal action in PK/PD study of MBF against Mannheimia haemolytica, and 88 h for the bactericidal action of MBF against Haemophilus parasuis (Aliabadi and Lees, 2002; Sun et al., 2015). Therefore, it was of great importance to study the PK/PD indices of fluoroquinolones including MBF individually. In this study, the PD data were obtained from ileum content to predict dosage regimens since it was more clinically relevant than those from broth. The ratios of ex vivo Cmax/MIC, Cmax/MPC, AUC0-24 h/MIC, and AUC0-24 h/MPC were 5.64, 1.37, 23.08 h and 5.63 h, respectively in ileum content (Table 2). The inhibitory sigmoidal Emax model was used for PK/PD integration model and dosage prediction, and it showed a favorable correlation (0.995) between the observed and predicted antibacterial efficacy of MBF against E. coli ex vivo (Figure 6). The ex vivo AUC0-24 h/MIC ratios of MBF requiring bactericidal action and eradication of the clinical strain with MIC90 of 2 μg/ml were 23.54 and 27.18 h, which were similar to in vivo AUC0-24 h/MIC (23.08 h) achieved after oral administration (2 mg/kg). These results suggest that the recommended dosage of 2 mg/kg could guarantee clinical efficacy against infections associated with sensitive E. coli with an MIC90 of 2 μg/ml. Based on the Monte Carlo simulations, the predicted daily dose for 50 and 90% targets to achieve bactericidal effect were 1.22 and 1.33 mg/kg, respectively. The Monte Carlo simulation to predict dosage for clinical use had the advantage of taking into account the PK/PD parameters based on bacteriological outcome. Furthermore, it could set target percentage such as 90 and 50% for simulation models for all data in relation to incidence in pigs (Dorey et al., 2017). However, due to the animals’ immune system also being an important factor contributing to bacterial eradication, the bacterial endpoint in vivo conditions may differ from the predicted dosages ex vivo (Garrison et al., 2002; Yan et al., 2017).
Conclusion
Most studies have demonstrated that the increasing antimicrobial resistance in gut flora was due to the misuse of antibiotics in unsuitable and irrespective administration routes (Nguyen et al., 2012; Zhang et al., 2013). The PK/PD model in the infection target site could provide more reasonable dosages. According to our PK/PD parameters ex vivo, the single doses required to reach bacteriostatic, bactericidal, and eradication activity for 90% target were 0.92, 1.33, and 1.53 mg/kg, respectively. These results demonstrated that the administered dosage (2 mg/kg) of marbofloxacin by oral administration daily could have an effective bactericidal effect against E. coli. Furthermore, it provided an alternative optimal dosage regimen (1.33 mg/kg for bactericidal and 1.53 mg/kg for eradication) and avoided the emergence of resistance for clinical veterinary use. However, the predicted dosage regimens should be validated in clinical practice to evaluate the treatment effect of infected pigs in future research.
Author Contributions
JC conceived the study; JC and ZL designed the experiments; ZL, QL, and BY performed the experiments; ZL wrote the manuscript; QH, QZ, SY, KL, JX, and SZ improved the language. All authors reviewed the manuscript.
Conflict of Interest Statement
The authors declare that the research was conducted in the absence of any commercial or financial relationships that could be construed as a potential conflict of interest.
Acknowledgment
This work was supported by the China Agricultural Research System (CARS-35).
Abbreviations
AUC, area under the curve; AUC0-24 h, area under the curve from 0 to 24 h; bw, body weight; CFU, colony forming unit; Clb, body clearance; Co, presented the initial concentration; Cmax, peak concentration; E. coli, Escherichia coli; Emax, the Lg change in bacterial counts of blank sample; E0, the maximal antibacterial effect; EC50, the value to achieve 50% maximal antibacterial effect; Hill, the dose-response curve slop; Ke, elimination rate constant; MBC, minimum bactericidal concentration; MBF, marbofloxacin; MIC, minimum inhibitory concentration; MPC, mutant prevention concentration; MRT, mean residence time; N, the Hill coefficient; PK/PD, pharmacokinetic/pharmacodynamic; t1/2ke, elimination half-life; Vd, apparent distribution volume.
References
Albarellos, G. A., Montoya, L., and Landoni, M. F. (2005). Pharmacokinetics of marbofloxacin after single intravenous and repeat oral administration to cats. Vet. J. 28, 363–369. doi: 10.1016/j.tvjl.2004.05.011
Aliabadi, F. S., Ali, B. H., Landoni, M. F., and Lees, P. (2003). Pharmacokinetics and PK-PD modelling of danofloxacin in camel serum and tissue cage fluids. Vet. J. 165, 104–118. doi: 10.1016/S1090-0233(02)00258-7
Aliabadi, F. S., and Lees, P. (2001). Pharmacokinetics and pharmacodynamics of danofloxacin in serum and tissue fluids of goats following intravenous and intramuscular administration. Am. J. Vet. Res. 62, 1979–1989. doi: 10.2460/ajvr.2001.62.1979
Aliabadi, F. S., and Lees, P. (2002). Pharmacokinetics and pharmacokinetic/pharmacodynamic integration of marbofloxacin in calf serum, exudate and transudate. J. Vet. Pharmacol. Ther. 25, 161–174. doi: 10.1046/j.1365-2885.2002.00399.x
Anadón, A., Martínezlarrañaga, M. R., Díaz, M. J., Martínez, M. A., Frejo, M. T., Martínez, M., et al. (2002). Pharmacokinetic characteristics and tissue residues for marbofloxacin and its metabolite N-desmethyl-marbofloxacin in broiler chickens. Am. J. Vet. Res. 63, 927–933. doi: 10.2460/ajvr.2002.63.927
Andraud, M., Chauvin, C., Sanders, P., and Laurentie, M. (2011). Pharmacodynamic modeling of in vitro activity of marbofloxacin against Escherichia coli strains. Antimicrob. Agents Chemother. 55, 756–761. doi: 10.1128/AAC.00865-10
Blondeau, J. M., Zhao, X., Hansen, G., and Drlica, K. (2010). Mutant prevention concentrations of fluoroquinolones for clinical isolates of Streptococcus pneumoniae. Chin. J. Infect. Chemother. 45, 433–438.
Burgess, D. S. (1999). Pharmacodynamic principles of antimicrobial therapy in the prevention of resistance. Chest 115, 19S–23S. doi: 10.1378/chest.115.suppl_1.19S
Burt, S. A., and Reinders, R. D. (2003). Antibacterial activity of selected plant essential oils against Escherichia coli 0157:H7. Lett. Appl. Microbiol. 36, 162–167. doi: 10.1046/j.1472-765X.2003.01285.x
Cester, C. C., Schneider, M., and Toutain, P. L. (1996). Comparative kinetics of two orally administered fluoroquinolones in dog: enrofloxacin versus marbofloxacin. Rev. Méd. Vét. 147, 703–716.
Cheng, G., Dong, X., Wang, Y., Peng, D., Wang, X., Hao, H., et al. (2014). Development of a novel genetically modified bioluminescent-bacteria-based assay for detection of fluoroquinolones in animal-derived foods. Anal. Bioanal. Chem. 406, 7899–7910. doi: 10.1007/s00216-014-8228-3
Ding, H., Li, Y., Chen, Z., Rizwan-Ul-Haq, M., and Zeng, Z. (2010). Plasma and tissue cage fluid pharmacokinetics of marbofloxacin after intravenous, intramuscular, and oral single-dose application in pigs. J. Vet. Pharmacol. Ther. 33, 507–510. doi: 10.1111/j.1365-2885.2010.01164.x
Dorey, L., Pelligand, L., Cheng, Z., and Lees, P. (2017). Pharmacokinetic/pharmacodynamic integration and modelling of florfenicol for the pig pneumonia pathogens Actinobacillus pleuropneumoniae and Pasteurella multocida. J. Vet. Pharmacol. Ther. 12:e0177568. doi: 10.1371/journal.pone.0177568
Drusano, G. L. (2007). Pharmacokinetics and pharmacodynamics of antimicrobials. Clin. Infect. Dis. 45(Suppl. 1), S89–S95. doi: 10.1086/518137
El Garch, F., Kroemer, S., Galland, D., Morrissey, I., and Woehrle, F. (2017). Survey of susceptibility to marbofloxacin in bacteria isolated from diseased pigs in Europe. Vet. Rec. 180, 591. doi: 10.1136/vr.103954
EMEA (1996). Committee for Veterinary Medicinal Productions Marbofloxacin Summary Report (1). Available at: http://www.ema.europa.eu/docs/en_GB/document_library/Maximum_Residue_Limits_-_Report/2009/11/WC500014864.pdf
Foster, D. M., Martin, L. G., and Papich, M. G. (2016). Comparison of active drug concentrations in the pulmonary epithelial lining fluid and interstitial fluid of calves injected with enrofloxacin, florfenicol, ceftiofur, or tulathromycin. PLoS ONE 11:e0149100. doi: 10.1371/journal.pone.0149100
Gad, S. C. (2014). “United States Pharmacopoeia (USP),” in Encyclopedia of Toxicology (Cary, NC: Gad Consulting Services), 881–882. doi: 10.1016/b978-0-12-386454-3.00959-3
García-Montijano, M., González, F., Waxman, S., Sánchez, C., Lucas, J. J. D., Andrés, M. S., et al. (2003). Pharmacokinetics of marbofloxacin after oral administration to Eurasian buzzards (Buteo buteo). J. Avian Med. Surg. 17, 185–190. doi: 10.1647/2001-033
Garciamontijano, M., Waxman, S., Sánchez, C., Quetglas, J., San Andrés, M. I., González, F., et al. (2001). The disposition of marbofloxacin in Eurasian buzzards (Buteo buteo) after intravenous administration. J. Vet. Pharmacol. Ther. 24, 155–157. doi: 10.1046/j.1365-2885.2001.00327.x
Garrison, K. E., Pasas, S. A., Cooper, J. D., and Davies, M. I. (2002). A review of membrane sampling from biological tissues with applications in pharmacokinetics, metabolism and pharmacodynamics. Eur. J. Pharm. Sci. 17, 1–12. doi: 10.1016/S0928-0987(02)00149-5
Haritova, A. M., Rusenova, N. V., Parvanov, P. R., Lashev, L. D., and Finkgremmels, J. (2006). Integration of pharmacokinetic and pharmacodynamic indices of marbofloxacin in turkeys. Antimicrob. Agents Chemother. 50, 3779–3785. doi: 10.1128/AAC.00711-05
Huguet, A., Pensec, J., and Soumet, C. (2013). Resistance in Escherichia coli: variable contribution of efflux pumps with respect to different fluoroquinolones. J. Appl. Microbiol. 114, 1294–1299. doi: 10.1111/jam.12156
Ijaz, A., Hao, H., Huang, L., Pascal, S., Xu, W., Chen, D., et al. (2015). Integration of PK/PD for dose optimization of Cefquinome against Staphylococcus aureus causing septicemia in cattle. Front. Microbiol. 6:588. doi: 10.3389/fmicb.2015.00588
Jorgensen, J. H. (1993). NCCLS Methods for dilution antimicrobial susceptibility tests for bacteria that grow aerobically, approved standard. Infect. Dis. Clin. North Am. 7, 393–409.
Laghari, A. H., Samoo, A. H., Qureshi, K. A., Shaikh, G. S., and Shah, A. M. (2013). Isolation of E - coli in UTI cases with malnutrition in children of distant rural area of Sukkur, Sindh. Med. Forum Mon. 24, 18–21.
Lei, Z., Liu, Q., Yang, B., Ahmed, S., Xiong, J., Song, T., et al. (2017a). Evaluation of bioequivalence of two long-acting 20% oxytetracycline formulations in pigs. Front. Vet. Sci. 4:61. doi: 10.3389/fvets.2017.00061
Lei, Z., Liu, Q., Yang, B., Xiong, J., Li, K., Ahmed, S., et al. (2017b). Clinical efficacy and residue depletion of 10% enrofloxacin enteric-coated granules in pigs. Front. Pharmacol. 8:294. doi: 10.3389/fphar.2017.00294
Liu, H., Liu, X., Li, Y., and Hao, C. (2015). Effect of six fluoroquinolones on the expression of four efflux pumps in the multidrug resistant Escherichia coli isolates. World J. Microbiol. Biotechnol. 31, 1041–1048. doi: 10.1007/s11274-015-1854-x
Liu, P., Müller, M., and Derendorf, H. (2002). Rational dosing of antibiotics: the use of plasma concentrations versus tissue concentrations. Int. J. Antimicrob. Agents 19, 285–290. doi: 10.1016/S0924-8579(02)00024-9
Liu, X., Boothe, D. M., Jin, Y., and Thungrat, K. (2013). In vitro potency and efficacy favor later generation fluoroquinolones for treatment of canine and feline Escherichia coli uropathogens in the United States. World J. Microbiol. Biotechnol. 29, 347–354. doi: 10.1007/s11274-012-1188-x
Messenger, K. M., Papich, M. G., and Blikslager, A. T. (2012). Distribution of enrofloxacin and its active metabolite, using an in vivo ultrafiltration sampling technique after the injection of enrofloxacin to pigs. J. Vet. Pharmacol. Ther. 35, 452–459. doi: 10.1111/j.1365-2885.2011.01338.x
Mouton, J. W., Theuretzbacher, U., Craig, W. A., Tulkens, P. M., Derendorf, H., and Cars, O. (2008). Tissue concentrations: do we ever learn? J. Antimicrob. Chemother. 61, 235–237. doi: 10.1093/jac/dkm476
Nguyen, T. T., Chachaty, E., Huy, C., Cambier, C., Gunzburg, J. D., Mentré, F., et al. (2012). Correlation between fecal concentrations of ciprofloxacin and fecal counts of resistant Enterobacteriaceae in piglets treated with ciprofloxacin: toward new means to control the spread of resistance? Antimicrob. Agents Chemother. 56, 4973–4975. doi: 10.1128/AAC.06402-11
Nielsen, E. I., and Friberg, L. E. (2013). Pharmacokinetic-pharmacodynamic modeling of antibacterial drugs. Pharmacol. Rev. 65, 1053–1090. doi: 10.1124/pr.111.005769
Paradis, M., Abbey, L., Baker, B., Coyne, M., Hannigan, M., Joffe, D., et al. (2001). Evaluation of the clinical efficacy of marbofloxacin (Zeniquin) tablets for the treatment of canine pyoderma: an open clinical trial. Vet. Dermatol. 12, 163–169. doi: 10.1046/j.1365-3164.2001.00195.x
Pellet, T., Gicquel-Bruneau, M., Sanders, P., and Laurentie, M. (2006). Comparison of faecal and optimal growth conditions on in vitro pharmacodynamic activity of marbofloxacin against Escherichia coli. Res. Vet. Sci. 80, 324–335. doi: 10.1016/j.rvsc.2005.07.001
Potter, T., Illambas, J., Pelligand, L., Rycroft, A., and Lees, P. (2013). Pharmacokinetic and pharmacodynamic integration and modelling of marbofloxacin in calves for Mannheimia haemolytica and Pasteurella multocida. Vet. J. 195, 53–58. doi: 10.1016/j.tvjl.2012.08.027
Qu, Y., Qiu, Z., Cao, C., Lu, Y., Sun, M., Liang, C., et al. (2015). Pharmacokinetics/pharmacodynamics of marbofloxacin in a Pasteurella multocida serious murine lung infection model. BMC Vet. Res. 11:294. doi: 10.1186/s12917-015-0608-1
Sato, T., Yokota, S., Okubo, T., Ishihara, K., Ueno, H., Muramatsu, Y., et al. (2013). Contribution of the AcrAB-TolC efflux pump to high-level fluoroquinolone resistance in Escherichia coli isolated from dogs and humans. J. Vet. Med. Sci. 75, 407–414. doi: 10.1292/jvms.12-0186
Schneider, M., Paulin, A., Dron, F., and Woehrlé, F. (2014). Pharmacokinetics of marbofloxacin in pigs after intravenous and intramuscular administration of a single dose of 8 mg/kg: dose proportionality, influence of the age of the animals and urinary elimination. J. Vet. Pharmacol. Ther. 37, 523. doi: 10.1111/jvp.12125
Schneider, M., Thomas, V., Boisrame, B., and Deleforge, J. (1996). Pharmacokinetics of marbofloxacin in dogs after oral and parenteral administration. J. Vet. Pharmacol. Ther. 19, 56–61. doi: 10.1111/j.1365-2885.1996.tb00009.x
Schneider, M., Vallé, M., Woehrlé, F., and Boisramé, B. (2004). Pharmacokinetics of marbofloxacin in lactating cows after repeated intramuscular administrations and pharmacodynamics against mastitis isolated strains. J. Dairy Sci. 87, 202–211. doi: 10.3168/jds.S0022-0302(04)73159-8
Sidhu, P. K., Landoni, M. F., Aliabadi, F. S., and Lees, P. (2010). PK–PD integration and modeling of marbofloxacin in sheep. Res. Vet. Sci. 88, 134–141. doi: 10.1016/j.rvsc.2009.05.013
Splíchal, I., Fagerhol, M. K., Trebichavsky, I., Splíchalová, A., and Schulze, J. (2005). The effect of intestinal colonization of germ-free pigs with Escherichia coli on calprotectin levels in plasma, intestinal and bronchoalveolar lavages. Immunobiology 209, 681–687. doi: 10.1016/j.imbio.2004.09.009
Spreng, M., Deleforge, J., Thomas, V., Boisramé, B., and Drugeon, H. (1995). Antibacterial activity of marbofloxacin. A new fluoroquinolone for veterinary use against canine and feline isolates. J. Vet. Pharmacol. Ther. 18, 284–289. doi: 10.1111/j.1365-2885.1995.tb00592.x
Sun, J., Xiao, X., Huang, R. J., Yang, T., Chen, Y., Fang, X., et al. (2015). In vitro dynamic pharmacokinetic/pharamcodynamic (PK/PD) study and CO PD of marbofloxacin against Haemophilus parasuis. BMC Vet. Res. 11:293. doi: 10.1186/s12917-015-0604-5
Thomas, V. M., Guillardeau, L. D., Thomas, E. R., and Boisramé, B. (1997). Update on the sensitivity of recent European canine and feline pathogens to marbofloxacin. Vet. Q. 19, 52–53. doi: 10.1080/01652176.1997.9694812
Tohamy, M. A., and El-Gendy, A. A. M. (2013). Some pharmacokinetic aspects and bioavailability of marbofloxacin in foals. Beni Suef Univ. J. Basic Appl. Sci. 2, 46–50. doi: 10.1016/j.bjbas.2013.09.007
Toutain, P. L., Del Castillo, J. R., and Bousquetmélou, A. (2002). The pharmacokinetic-pharmacodynamic approach to a rational dosage regimen for antibiotics. Res. Vet. Sci. 73, 105–114. doi: 10.1016/S0034-5288(02)00039-5
Toutain, P. L., and Lees, P. (2004). Integration and modelling of pharmacokinetic and pharmacodynamic data to optimize dosage regimens in veterinary medicine. J. Vet. Pharmacol. Ther. 27, 467–477. doi: 10.1111/j.1365-2885.2004.00613.x
Vallé, M., Schneider, M., Galland, D., Giboin, H., and Woehrlé, F. (2012). Pharmacokinetic and pharmacodynamic testing of marbofloxacin administered as a single injection for the treatment of bovine respiratory disease. J. Vet. Pharmacol. Ther. 35, 519–528. doi: 10.1111/j.1365-2885.2011.01350.x
Wang, J., Hao, H., Huang, L., Liu, Z., Chen, D., and Yuan, Z. (2016). Pharmacokinetic and pharmacodynamic integration and modeling of enrofloxacin in swine for Escherichia coli. Front. Microbiol. 7:36. doi: 10.3389/fmicb.2016.00036
Waxman, S., Rodríguez, C., González, F., De Vicente, M. L., San Andrés, M. I., and San Andrés, M. D. (2001). Pharmacokinetic behavior of marbofloxacin after intravenous and intramuscular administrations in adult goats. J. Vet. Pharmacol. Ther. 24, 375–378. doi: 10.1046/j.1365-2885.2001.00357.x
Wubben, J. E., Smiricky, M. R., Albin, D. M., and Gabert, V. M. (2001). Improved procedure and cannula design for simple-T cannulation at the distal ileum in growing pigs. Contemp. Top. Lab. Anim. Sci. 40, 27–31.
Yan, L., Xie, S., Chen, D., Pan, Y., Tao, Y., Qu, W., et al. (2017). Pharmacokinetic and pharmacodynamic modeling of cyadox against Clostridium perfringens in swine. Sci. Rep. 7, 4064. doi: 10.1038/s41598-017-03970-9
Yang, F., Liu, Y., Li, Z., Wang, Y., Liu, B., Zhao, Z., et al. (2016). Tissue distribution of marbofloxacin in pigs after a single intramuscular injection. J. Vet. Sci. 18, 169–173. doi: 10.4142/jvs.2017.18.2.169
Yohannes, S., Awji, E. G., Lee, S. J., and Park, S. C. (2015). Pharmacokinetics and pharmacokinetic/pharmacodynamic integration of marbofloxacin after intravenous and intramuscular administration in beagle dogs. Xenobiotica 45, 264–269. doi: 10.3109/00498254.2014.969794
Yu, X., Susa, M., Weile, J., Knabbe, C., Schmid, R. D., and Bachmann, T. T. (2007). Rapid and sensitive detection of fluoroquinolone-resistant Escherichia coli from urine samples using a genotyping DNA microarray. Int. J. Med. Microbiol. 297, 417–429. doi: 10.1016/j.ijmm.2007.03.018
Keywords: Escherichia coli, marbofloxacin, pigs, pharmacokinetic, pharmacodynamic, PK/PD, optimal dose
Citation: Lei Z, Liu Q, Xiong J, Yang B, Yang S, Zhu Q, Li K, Zhang S, Cao J and He Q (2017) Pharmacokinetic and Pharmacodynamic Evaluation of Marbofloxacin and PK/PD Modeling against Escherichia coli in Pigs. Front. Pharmacol. 8:542. doi: 10.3389/fphar.2017.00542
Received: 11 July 2017; Accepted: 03 August 2017;
Published: 21 August 2017.
Edited by:
Yurong Lai, Gilead Sciences, Inc. (United States), United StatesReviewed by:
Stanislav Yanev, Institute of Neurobiology (BAS), BulgariaConstantin Ion Mircioiu, Carol Davila University of Medicine and Pharmacy, Romania
Copyright © 2017 Lei, Liu, Xiong, Yang, Yang, Zhu, Li, Zhang, Cao and He. This is an open-access article distributed under the terms of the Creative Commons Attribution License (CC BY). The use, distribution or reproduction in other forums is permitted, provided the original author(s) or licensor are credited and that the original publication in this journal is cited, in accordance with accepted academic practice. No use, distribution or reproduction is permitted which does not comply with these terms.
*Correspondence: Jiyue Cao, Y2Fvaml5dWUyQDE2My5jb20= Qigai He, aGU2MjhAbWFpbC5oemF1LmVkdS5jbg==