 Liang Dai
 Yingjue Tang
 Wenjun Zhou
 Yanqi Dang1
 Qiaoli Sun
 Mingzhe Zhu
 Guang Ji
- 1Institute of Digestive Diseases, China-Canada Center of Research for Digestive Diseases (ccCRDD), Longhua Hospital, Shanghai University of Traditional Chinese Medicine, Shanghai, China
- 2School of Public Health, Shanghai University of Traditional Chinese Medicine, Shanghai, China
Mesalamine has been well used in the improvement of ulcerative colitis (UC) in clinics, however, the underlying mechanisms were not well illustrated. To explore its efficacy from the perspective of gut microbiota and related metabolites, we employed 16S rRNA sequencing and metabolomics approaches in stool samples across 14 normal healthy controls (NC group), 10 treatment-naïve UC patients (UC group) and 14 UC patients responded to mesalamine treatment (mesalamine group). We noted that the gut microbiota diversity and community composition were remarkably perturbed in UC group and partially restored by mesalamine treatment. The relative abundance of 192 taxa in genus level were significantly changed in UC group, and 168 genera were significantly altered after mesalamine intervention. Meanwhile, a total of 127 metabolites were significantly changed in UC group and 129 metabolites were significantly altered after mesalamine treatment. Importantly, we observed that many candidates including 49 genera (such as Escherichia-shigella, Enterococcus and Butyricicoccus) and 102 metatoblites (such as isoleucine, cholic acid and deoxycholic acid) were reversed by mesalamine. Spearman correlation analysis revealed that most of the candidates were significantly correlated with Mayo score of UC, and the relative abundance of specific genera were significant correlated with the perturbation of metabolites. Pathway analysis demonstrated that genera and metabolites candidates were enriched in many similar molecular pathways such as amino acid metabolism and secondary metabolites biosynthesis. Importantly, ROC curve analysis identified a gut microbiota signature composed of five genera including Escherichia-Shigella, Streptococcus, Megamonas, Prevotella_9 and [Eubacterium] _coprostanoligenes _group which might be used to distinguish UC group from both NC and mesalamine group. In all, our results suggested that mesalamine might exert a beneficial role in UC by modulating gut microbiota signature with correlated metabolites in different pathways, which may provide a basis for developing novel candidate biomarkers and therapeutic targets of UC.
Introduction
Ulcerative colitis (UC) is a chronic inflammatory bowel disease characterized by relapsing and remitting mucosal inflammation. The affected site starts in the rectum and could extend to proximal segments of the colon (Ungaro et al., 2017). The typical symptoms of UC include bloody stools, diarrhoea and fatigue, which may severely impact work capacity and quality of life (Hoivik et al., 2013; Lynch and Hsu, 2020). The global incidence and prevalence of UC experienced a great increase in recent years, posing a significant burden on public health system (Kotze et al., 2020). Hence, it is urgent to explore underlying pathogenesis of UC and discover efficient therapies.
UC is consider as a disease of unknown aetiology, which is a multifactorial disorder (Shen et al., 2018; Kaur and Goggolidou, 2020). It has been reported that a variety of complex factors including genetics, environment, epithelial barrier defects and immune system disorders were related to the pathogenesis of ulcerative colitis (Porter et al., 2020). Meanwhile, abundant evidence have demonstrated that gut microbiota might play a crucial role in ulcerative colitis, and many studies have revealed that biodiversity and composition of gut microbiota were changed in UC patients and animal models (Bajer et al., 2017; Shang et al., 2017). However, the mechanisms of gut microbiota contributing to the pathogenesis of UC and efficient interventions need further investigation. The aim of UC treatment is to induce and maintain remission of the disease (Scaldaferri et al., 2016). Mesalamine has been used in controlling UC, which is recommended as the first-line therapy (Adams and Bornemann, 2013). As a free radical scavenger and an antioxidant, mesalamine could regulate inflammatory response by modulating the production of inflammatory cytokines and the functions of immune cells (Nakashima and Preuss, 2020). However, few studies have reported the influence of mesalamine on gut microbiota and related metabolites in UC patients.
In the present study, we employed 16S rRNA sequencing and LC-MS (liquid chromatography mass spectrometry) metabolomics, observed the changes of gut microbiota composition and the related metabolites among normal healthy controls, UC patients with no treatment and UC patients with mesalamine treatment, reported the effects of mesalamine in restoring perturbance of metabolites and gut microbiota, and identified the underlying functional pathways and biomarkers of UC. The present study will enhance the comprehension of gut microbiota in UC pathogenesis and mechanisms of mesalamine in treating UC, which may benefit development of novel therapeutic agents in future.
Materials and Methods
Study Design
This exploratory study composed of two sequential cross-sectional trials. Firstly, we designed a cohort contained 10 treatment-naïve UC patients (UC group) and 14 healthy volunteers (NC group), to investigate the potential difference in gut microbiota and related metabolites between UC and healthy status. Then, another cohort was established, which composed of all patients from UC group and 14 UC patients in mesalamine group who were well responded to mesalamine treatment, to discover underlying gut microbiota and related metabolites that mesalamine could modulate. All patients were screening from inpatient and outpatient of gastroenterology and anorectal departments in Longhua Hospital from January 2019 to August 2020. Healthy controls were recruited voluntarily from health examination department. The present study was approved by the Ethics Committee of Longhua Hospital, and informed consent was obtained from all participants.
Participants and Sample Collection
UC was diagnosed based on a combination of clinical symptoms, endoscopic and histological findings, and absence of other reasons induced colitis according to the Chinese consensus on diagnosis and treatment of inflammatory bowel disease (Beijing, 2018) (Wu et al., 2018). In brief, the following criteria were compulsory: 1) persistent or recurrent diarrhea with mucus and bloody purulent discharge for more than 6 weeks; 2) endoscopic findings of erythema, mucosal congestion, disappearance of vascular pattern, erosions, ulcerations and so on; 3) histological evidences of inflammatory cell infiltration, distortion of crypt architecture and mucosal erosion or ulceration; 4) exclusion of other pathologies including but not limited to infection, medications, radiation and ischemia.
Patients aged 18–65 years old who had mild and moderate UC with a modified Mayo score of 3–10 were screened. The additional inclusion criteria for UC group were treatment-naïve patients, who were defined as patients who were initially diagnosed as UC and received no treatment, or had a complete remission at least 6 months but experienced a recent relapse before any medication administration. On the other hand, the extra inclusion criteria for mesalamine group were mesalamine-responded UC patients. The administration rules should be oral intake of 1.0 g mesalazine enteric-coated tablets, three times a day, 1 h before three meals for at least continuous 3 months. The treatment response was set as a reduction from initial treatment in total Mayo score of at least 30%, with an accompanying decline in the dimension for rectal bleeding of at least one point or an absolute score for rectal bleeding of 0 or 1 (Rutgeerts et al., 2005). Patients were excluded if they met any of following criteria: breastfeeding or pregnant, participation in other clinical trials within the past 6 months, administration of antibiotics within the past 3 months, administration of immunosuppressive agents, biological agents, other non-steroidal (steroidal) anti-inflammatory drugs besides mesalamine, gastrointestinal mucosal protective agents, intestinal probiotics and prebiotics within the past 4 weeks. Besides, patients were also excluded if they combined with severe heart, liver, kidney and other important organ and blood system diseases, as well as gastroduodenal ulcer, history of intestinal surgery, intestinal obstruction, intestinal perforation, perianal abscess, severe hemorrhagic disease and mental disorders. This study also recruited age and gender matched healthy volunteers as NC group. The corresponding eligible criteria contained: 1) no administration of salicylic acid drugs in the past 4 weeks; 2) no history of gastrointestinal diseases in the past 6 months; 3) no existence of gastrointestinal symptoms such as abdominal distension, abdominal pain, diarrhea and constipation; 4) no combination with severe cardiovascular, hepatic, renal and digestive diseases. Based on above inclusion and exclusion criteria, the first cohort included 10 treatment-naïve UC patients and 14 healthy volunteers, then the second cohort contained 10 treatment-naïve UC patients and 14 mesalamine-responded UC patients.
Age, gender and body mass index (BMI) were recorded for all participants. Disease course, Montreal classification, Mayo score and corresponding disease severity were also documented for UC patients. In addition, Baron index was utilized to quantify the endoscopic activity in UC patients (Baron et al., 1964). Participants were informed to terminate administration of antibiotics, probiotics, prebiotics or other microbiota-related preparations at least 4 weeks before sampling. All participants were instructed to collect 3.0 g morning first feces using sterile fecal collection tubes. The fecal samples should avoid contamination from other mediums such as urine. The collected samples were stored at −80°C for further16S rRNA sequencing and untargeted metabonomics detection.
DNA Extraction and 16S rRNA Sequencing
Fecal samples were performed 16S rRNA sequencing in Shanghai Meiji Biomedical Technology Co., Ltd. (Shanghai, China) following the manufactures’ procedures. Briefly, DNA were extracted from fecal samples according to the instructions of E. Z.N.A®soil (Omega Bio-tek, Norcross, GA, United States). The quality of DNA was detected by 1% agarose gel electrophoresis, and the concentration and purity were detected by NanoDrop 2000. 16S rRNA genes were amplified using PCR with primers targeting the V3-V4 region (338F–806R). The amplicons were purified using AxyPrep DNA Gel Extraction Kit (Axygen Biosciences, Union City, CA, United States), and quantified by QuantiFluor™-ST (Promega, United States) to construct libraries and perform paired-end rRNA sequencing on Illumina MiSeq platform (Illumina, San Diego, United States) following the manufactures’ instructions.
16S rRNA Sequencing Data Analysis
The adapters and low-quality bases were trimmed using fastp tool to obtain clean reads (Chen et al., 2018), and then merged by FLASH software (Magoc and Salzberg, 2011). Sequences with 97% similarity were clustered in OTUs (operational taxonomic units) using UPARSE software (Edgar, 2013). Taxonomy was annotated and aligned with Silva 16S-rDNA database (v138) using RDP classifier (Wang et al., 2007). The Chao and Shannon index was used to estimate Alpha diversity and principle coordinates analysis (PCoA) using unweighted UniFrac distance was performed to reveal the Beta diversity among samples. ANOSIM (analysis of similarities) analysis was performed to assess the significance of difference in PCoA plots. Kruskal-Wallis H test or Wilcoxon rank-sum test were used to assess the significant difference of bacterial genera abundance among groups. The functional prediction of taxa was performed using PICRUSt analysis (Langille et al., 2013). p value less than 0.05 was considered as significantly different. The signature to discriminate UC group from NC and mesalamine group was identified using ROC (receiving operator curve) analysis by estimating AUC (area under curve) value.
Metabolomics Data Acquisition
Stool samples were performed metabolomics analysis in Shanghai Meiji Biomedical Technology Co., Ltd. (Shanghai, China) following the manufactures’ procedures. Briefly, 50 mg stool samples were added 400 Ul of cold methanol solution (methanol: water = 4:1), broken by a high-throughput tissue crusher at low temperature. After vortex mixing, the samples were extracted by ultrasound on ice for 10 min and three times, placed at −20°C for 30 min, centrifuged at 13,000 g, 4°C for 15 min, and the supernatant was performed metabolomics analysis using ultra performance liquid chromatography-triple time of flight mass spectrometry (UPLC-Triple TOF-MS, AB SCIEX Company, United States) following the manufactures’ protocols. The chromatographic column was BEHC18 column (100 × 2.1 mm i.d., 1.7 µm; Waters, Milford, United States). Mobile phase A was water (containing 0.1% formic acid), and mobile phase B was acetonitrile/isopropanol (1/1) (containing 0.1% formic acid). The flow rate was 0.4 ml/min, injection volume was 20 µl and column temperature was 40°C. The chromatographic elution gradient was 0.0 min, 95%A and 5% B; 3 min, 80%A and 20% B; 9.0 min, 5%A and 95% B; 13 min, 5%A and 95% B; 13.1 min, 95%A and 5% B and 16 min, 95%A and 5% B. The samples mass spectrometry signal acquisition was used positive and negative ion scanning mode. The electrospray capillary voltage, injection voltage and collision voltage were 1.0 kV, 40 V and 6 eV, respectively. The ion source temperature and desolvation temperature were 120 °C and 500 °C, carrier gas flow was 900 L/h, mass spectrometry scanning range was 50–1,000 m/z and resolution was 30,000. Quality control (QC) samples were pooled from all experimental samples and analyzed with the same procedure.
Metabolomics Data Analysis
Raw data were processed using Progenesis QI software (Waters Corporation, Milford, United States), then a data matrix of retention time, m/z and peak area was obtained. Only variables with a non-zero value of more than 50% in all samples were retained, and the missing values were filled with 1/2 of the minimum value in the original matrix. The total peaks were normalized, and variables with a relative standard deviation (RSD) of QC samples of more than 30% were deleted to obtain a data matrix for further analysis. To identify the structure of metabolites, raw data were imported to Progenesis QI software (Waters Corporation, Milford, United States) and the mass spectra were compared to an in-house standard library and public databases such as The Human Metabolome Database (HMDB) and METLIN.
Using R package ropls (version1.6.2), principle component analysis (PCA) and orthogonal partial least squares discriminant analysis (OPLS-DA) were performed for multivariate statistical analysis, and variable importance of projection (VIP) values were obtained. For univariate statistical analysis, Welch’s t test was used to calculate p values between groups. Fold changes of metabolites were calculated between groups based on the ratio of average normalized peak intensity. The differential metabolites between groups were identified with the threshold of VIP > 1 and p < 0.05. Venn diagram (R package, version1.6.2) was used to obtain the intersection of differential metabolites between pairwise groups. Hierarchical cluster was performed to reveal the expression patterns of differential metabolites among groups, and pathway enrichment was performed to reveal metabolites related biological functions using scipy (Python, version1.0.0).
Statistical Analysis
For baseline data, data were presented as median with interquartile range or number with percentage. Statistical analysis was performed using SPSS 24.0 software. The qualitative data among three groups were assessed using one-way analysis of variance (ANOVA) or Kruskal-Wallis test based on data distribution. The qualitative data was analyzed by Chi-square test. Difference between two groups were determined by Student’s T test or Wilcoxon rank sum test. For correlation analysis, Spearman rank correlation coefficient was calculated. p value less than 0.05 was considered as significant difference.
Results
Baseline Characteristic of Participants
A total of 14 normal healthy controls (NC group), 10 UC patients with no treatment (UC group), and 14 UC patients with mesalamine treatment (mesalamine group) were included in the present study. Detailed demographic and clinical characteristics of enrolled participants were shown in Table 1. No significant difference was found in age, gender and BMI among three groups. UC phenotypes based on Montreal Classification was comparable between UC group and mesalamine group. Patients in mesalamine group showed milder disease severity and endoscopic activity than UC groups, according to modified Mayo score and Baron index, respectively.
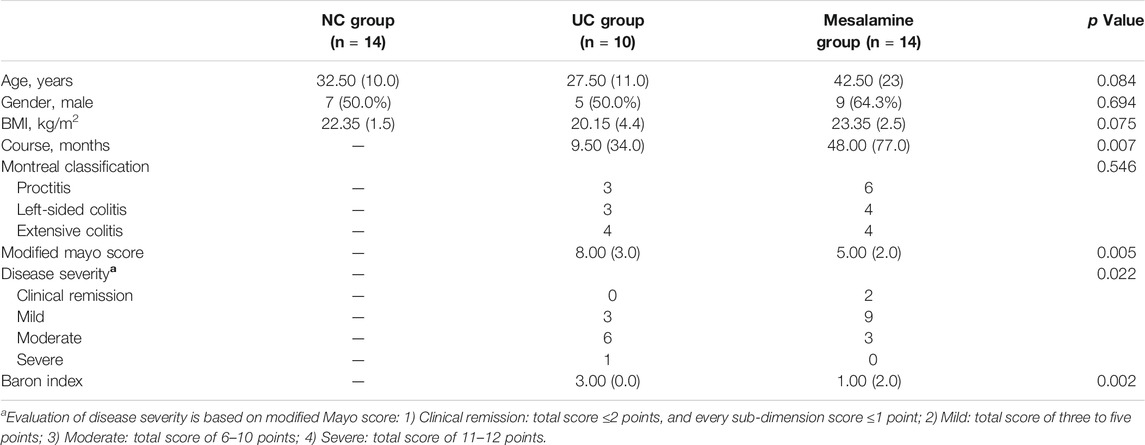
TABLE 1. Baseline characteristics of included participants.
Mesalamine Intervention Improved Gut Microbiota Diversity in UC Patients
The 16S rRNA sequencing of stool samples from three groups was performed to reveal the difference of gut microbial community structure. Analysis of Chao index indicated that there was a significant increase in taxa richness in UC group, while mesalamine could obviously restore the disturbance (Figure 1A). The Shannon index of taxa evenness exhibited a decreased trend in UC group, and mesalamine partially improved the perturbance (Figure 1B). PCoA plots revealed that there was remarkable difference in bacterial composition between UC group and NC group, while mesalamine intervention could ameliorate the difference (Figure 1C).
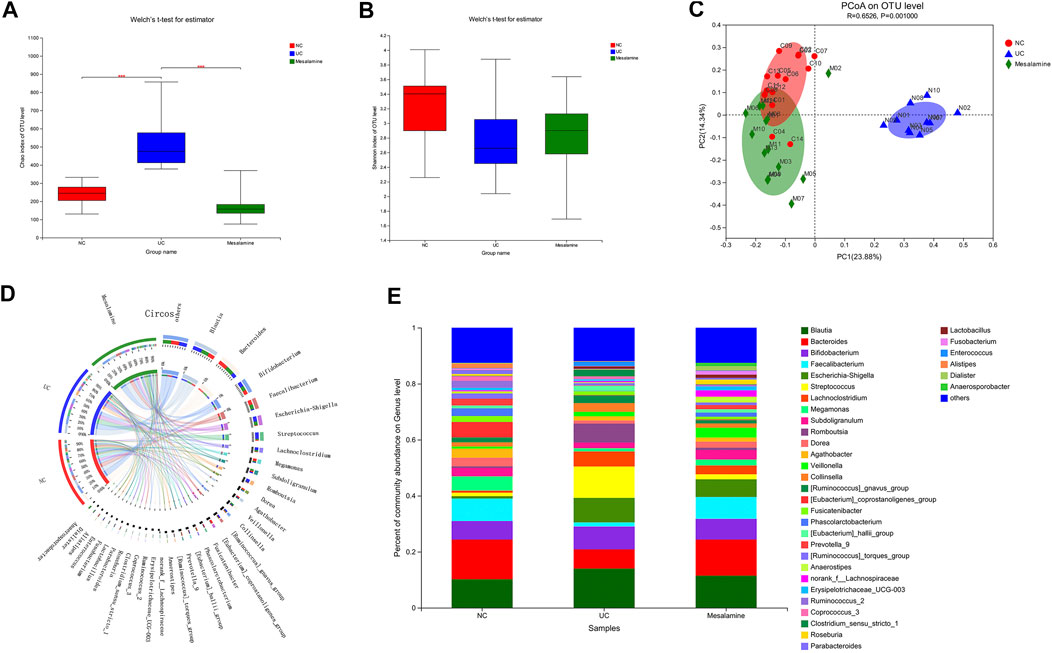
FIGURE 1. Gut microbiota diversity and composition analysis. (A) α-Diversity evaluated by Chao index (***p < 0.001) (B). α-Diversity evaluated by Shannon index. (C) PCoA plots based on unweighted UniFrac distance (D). Diagram of Circos analysis, the small semicircle (left half circle) represents the species composition in the sample, the color of outer ribbon represents the group from which the species came, the color of inner ribbon represents the species, and the length represents the relative abundance of the species in the corresponding samples; the large semicircle (right half circle) represents the distribution proportion of species in different samples at the taxonomic level, and the outer layer ribbon represents the species, the inner ribbon color represents different groups, and the length represents the distribution proportion of the sample in a certain species. (E) The overall percentage of gut microbiota community abundance on genus level.
Mesalamine Intervention Improved Gut Microbiota Abundance in UC Patients
To examine whether relative abundance of gut microbiota was associated with the diversity difference, Circos analysis (Figure 1D) and community bar plots (Figure 1E) at genus level were performed. The results showed that the relative abundance of various specific microbiotas at genus level were different between groups. For example, the relative abundance of genus Streptococcus in UC group, mesalamine group and NC group was 11.24, 1.81, and 1.27%, respectively. To test whether there was a significant difference of specific microbiota between UC group and NC group or between mesalamine group and UC group, the differential microbiota analysis based on relative abundance at genus level was performed using Wilcoxon rank-sum test. Our results showed that there were 192 significantly differential genera between UC group and NC group (Supplementary Table S1), and the representative top 15 genera were presented in Figure 2A. Meanwhile, mesalamine intervention significantly changed the relative abundance of 168 genera in UC patients (Supplementary Table S2), and the top 15 differential genera were revealed in Figure 2B. Interestingly, we observed that mesalamine intervention could significantly reverse the relative abundance of 49 genera in UC patients (Table 2), which were identified as candidate genera for further analysis. The top 15 mesalamine reversed genera were presented in Figure 2C, which revealed that the relative abundance of Escherichia-Shigella, Megamonas, Clostridium_ sensu_stricto_1, Enterococcus and Citrobacter was significantly increased in UC group compared to NC, and restored by mesalamine treatment. The relative abundance of genera including Megamonas [Eubacterium]_ventriosum_ group, Prevotella_9, Ruminococcus_2, Roseburia, Parabacteroides, Butyricicoccus, Dialister, Akkermansia and [Eubacterium]_coprostanoligenes_group were significantly reduced in UC group compared to NC, which was obviously increased by mesalamine intervention.
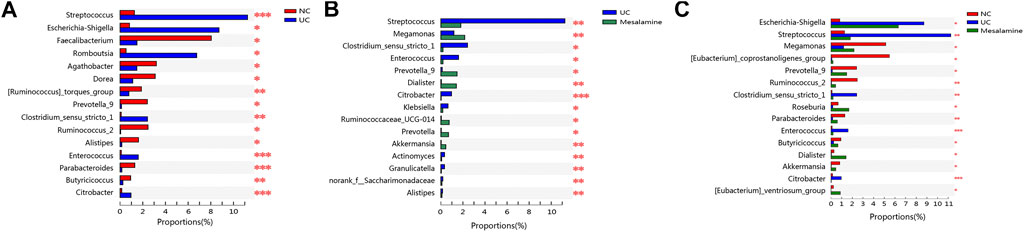
FIGURE 2. Significantly changed taxa on genus level among groups. (A) Top 15 differential genera between UC group and NC group. (B) Top 15 differential genera between UC group and mesalamine group (C). Top 15 mesalamine restored genera. *0.01 < p ≤ 0.05, **0.001 < p ≤ 0.01, ***p ≤ 0.001.
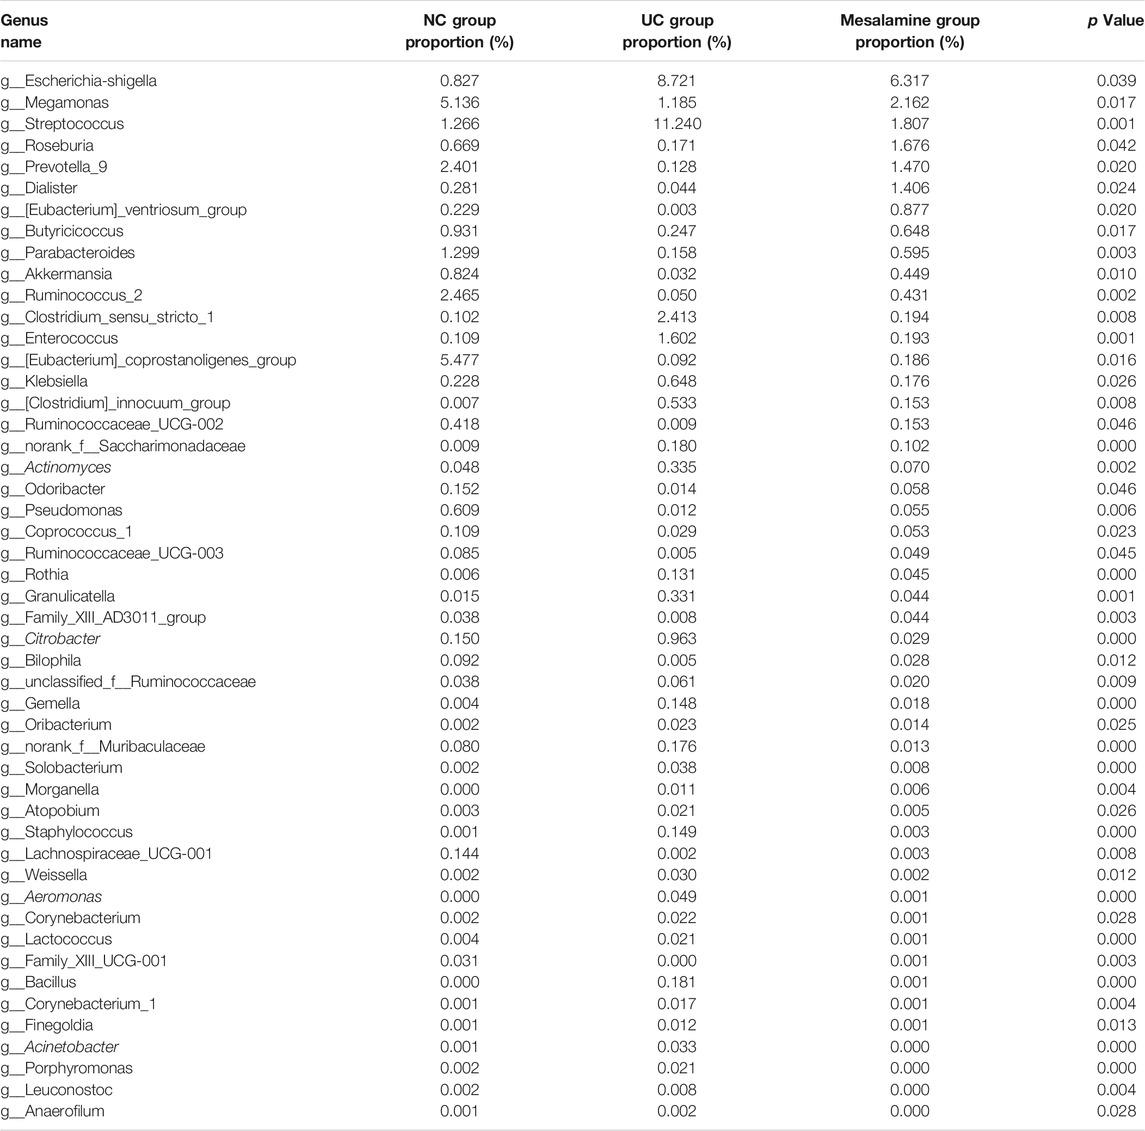
TABLE 2. 49 candidate genera reversed by mesalamine intervention.
Mesalamine Intervention Restored the Perturbance of Fecal Metabolites in UC Patients
Using UPLC-Triple TOF-MS, the fecal metabolites across NC, UC and mesalamine groups were profiled. As shown in Figure 3A, the PCA plots of three groups revealed that there was distinct separation among groups, and the plots of mesalamine group were close to NC group. The results indicated that the metabolites profile in UC group might be different from both NC and mesalamine group, and the metabolites profile of latter two groups might be similar. To identify the differential metabolites, OPLS-DA model was performed between pairwise groups (UC vs NC group, and mesalamine vs UC group). The results showed that the plots of UC group samples were obviously separated from NC or mesalamine group (Figures 3B,C). With the threshold of VIP more than 1, p value less than 0.05 and fold change not equal to 1, a total of 127 differential metabolites between UC group and NC were obtained, and 129 differential metabolites between mesalamine and UC group were identified (Figures 4A,B; Supplementary Table S3, S4). Importantly, a total of 102 metabolites reversed by mesalamine intervention in UC patients were filtered out as candidates for further analysis (Figure 4C; Table 3). For example, the level of ophthalmic acid, isoleucine, styrene and creatine was elevated in treatment-naïve UC patients compared to normal healthy controls, and restored by mesalamine treatment. The level of cholic acid, deoxycholic acid and enoxolone was reduced in treatment-naïve UC patients, and restored by mesalamine intervention.
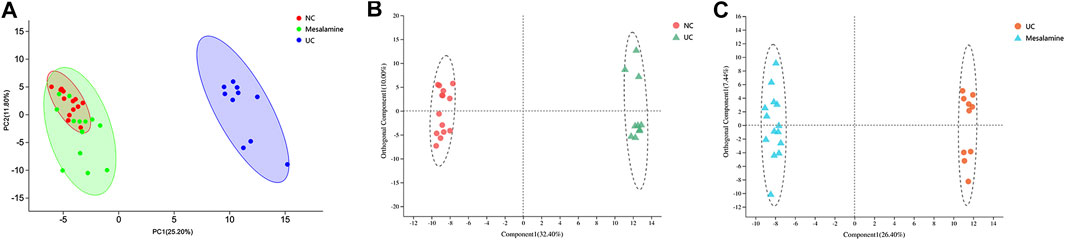
FIGURE 3. PCA and OPLS-DA plots among groups. (A) PCA score plots of NC, UC and mesalamine groups, red dots represented NC group, green dots represented mesalamine group and blue dots represented UC group. (B) OPLS-DA score plots of NC and UC groups, red dots represented NC group and green triangles represented UC group. (C) OPLS-DA score plots of UC and mesalamine groups, red dots represented UC group and blue triangles represented mesalamine group.
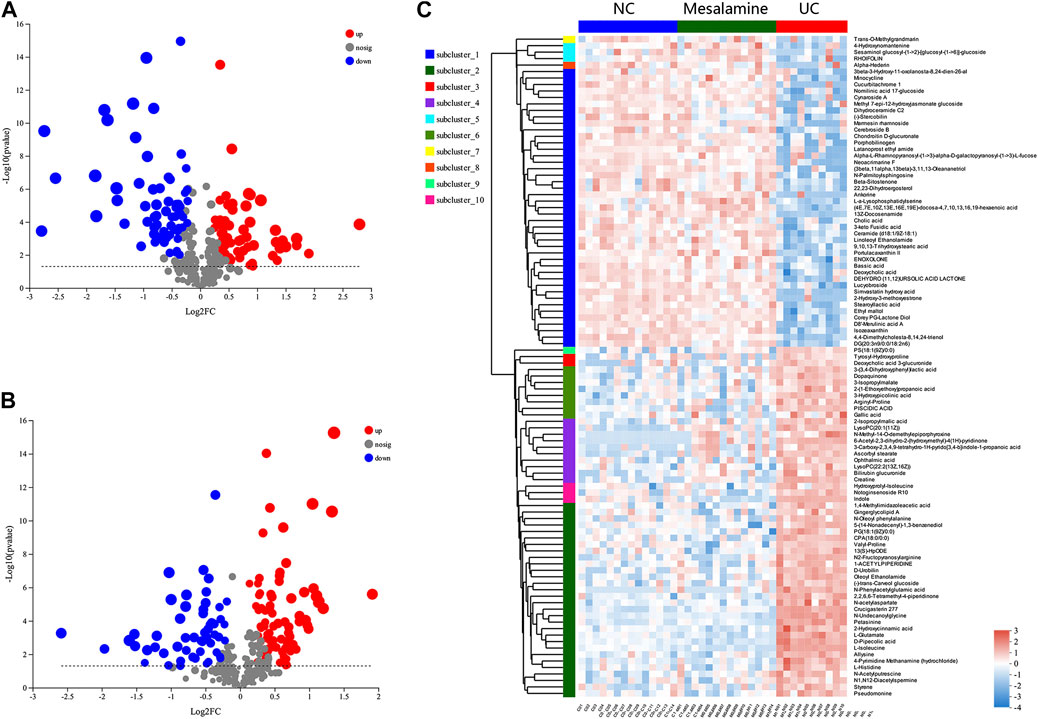
FIGURE 4. Significantly changed metabolites among groups. (A) Volcano plots of differential metabolites between UC group and NC group, grey dots represent metabolites with no significant change, red dots represent up-regulated metabolites and green dots represent down-regulated metabolites. (B) Volcano plots of differential metabolites between UC group and mesalamine group, grey dots represent metabolites with no significant change, red dots represent up-regulated metabolites and green dots represent down-regulated metabolites. (C) Hierarchical cluster of 102 candidate metabolites. The color indicates the relative expression level of metabolites in this group of samples, red indicates up-regulated and blue indicated down-regulated.
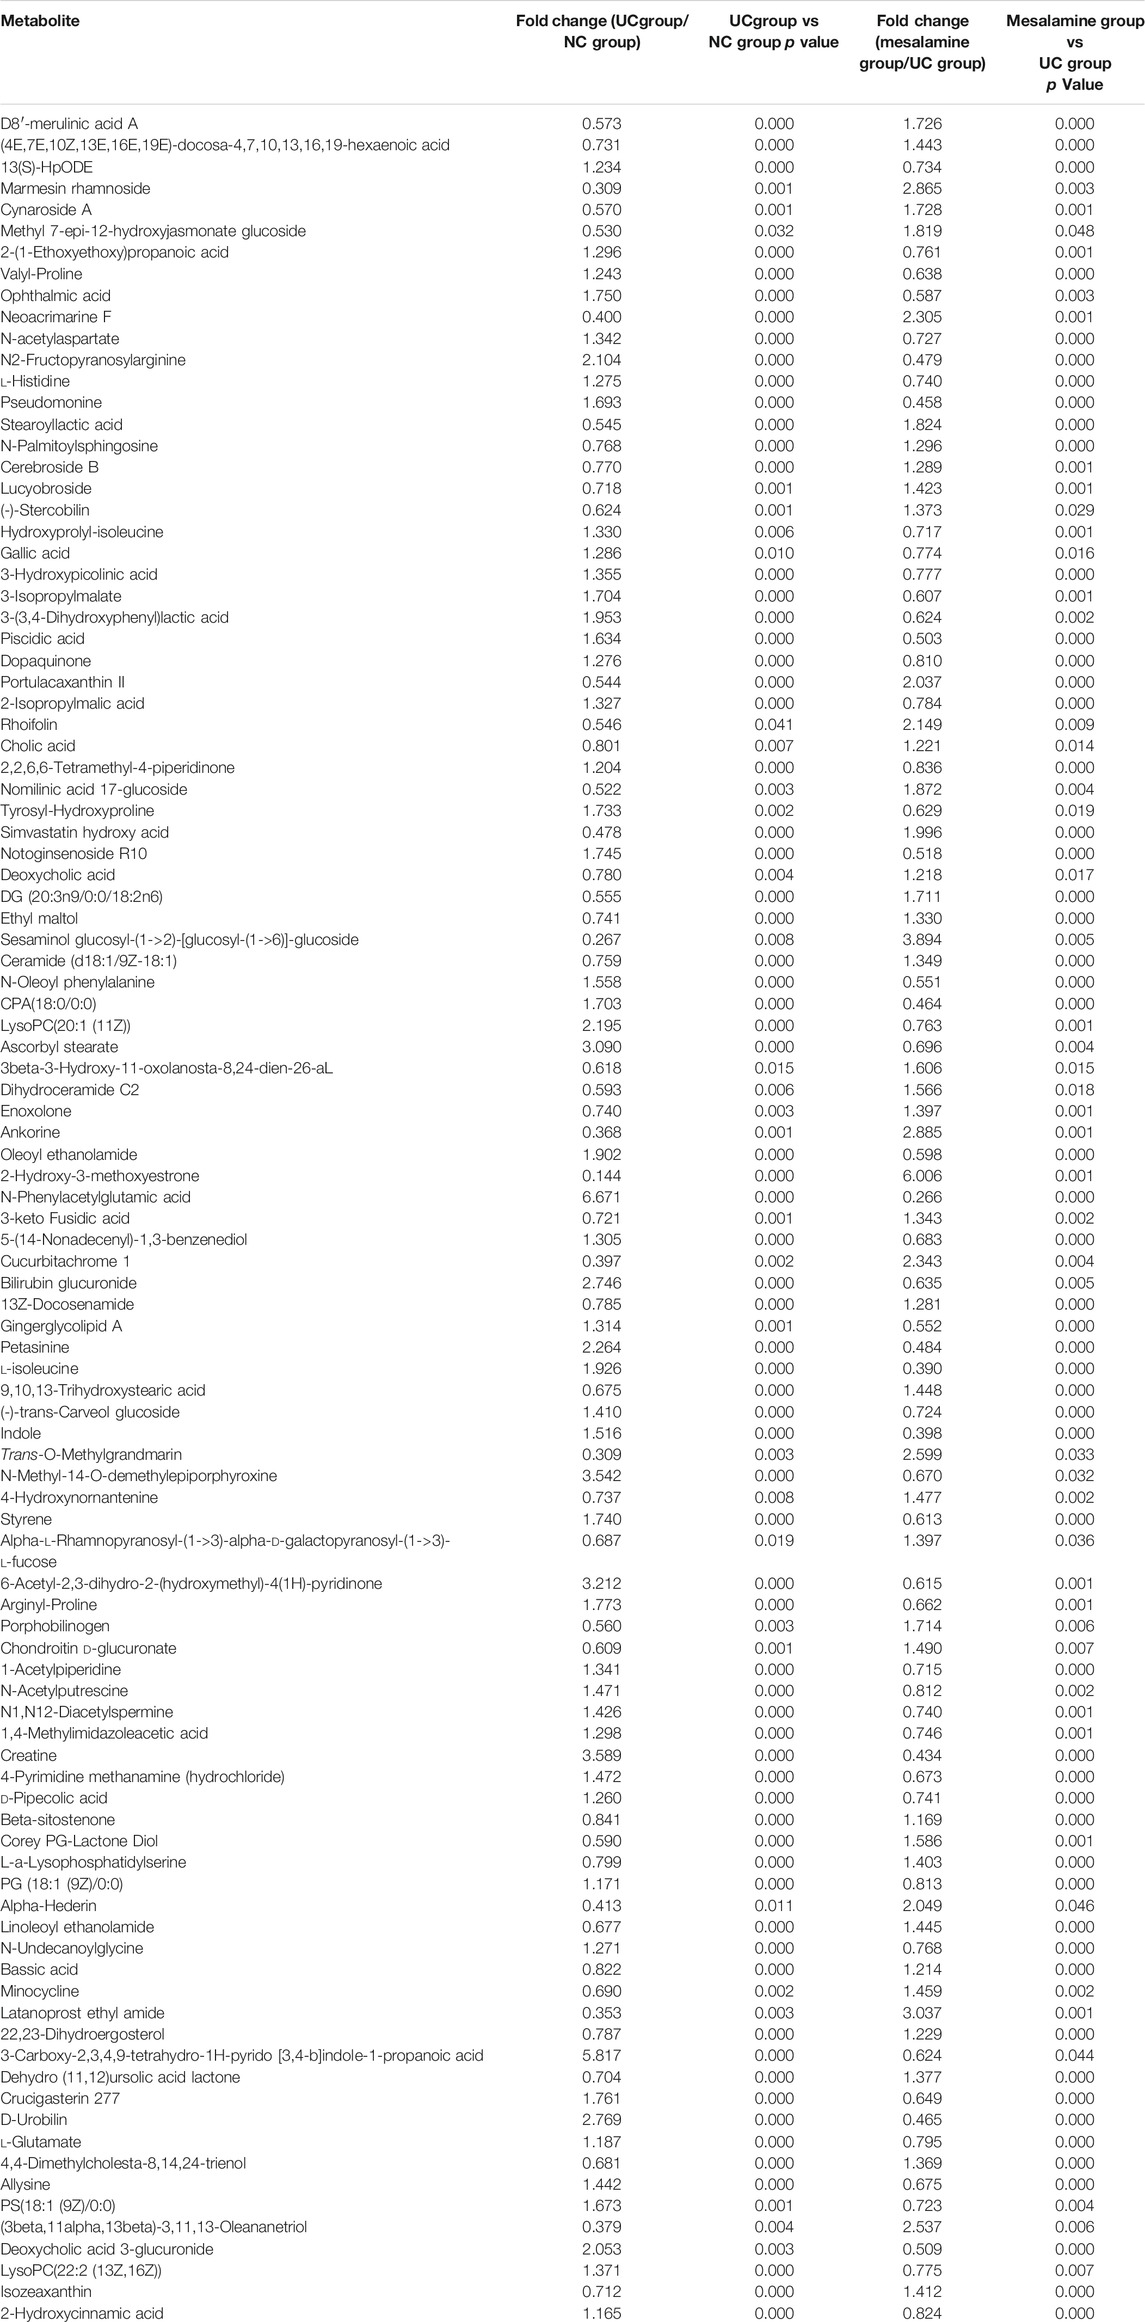
TABLE 3. 102 candidate metabolites reversed by mesalamine intervention.
Mesalamine Restored Gut Microbiota and Metabolites Correlated with UC Clinical Indexes
To explore whether mesalamine restored gut microbiota and metabolites were related to UC clinical features, Spearman correlation analysis was performed. As shown in Figure 5A total of 26 genera (such as Bacillus, Butyricicoccus and Streptococcus) was significantly correlated with both Mayo score and the course of disease (month). Interestingly, the genera decreased by mesalamine in UC patients were positively correlated with Mayo score and the course of disease, and vice versa. For instance, the relative abundance of Bacillus, Enterococcus and Streptococcus reduced by mesalamine exhibited a significant positive correlation with Mayo score and the course of disease. Whereas, Butyricicoccus, Parabacteroides and Pseudomonas were increased by mesalamine and had a negative correlation with Mayo score and the course of disease. The results indicated mesalamine might exert a beneficial role in UC by restoring the gut microbiota perturbance.
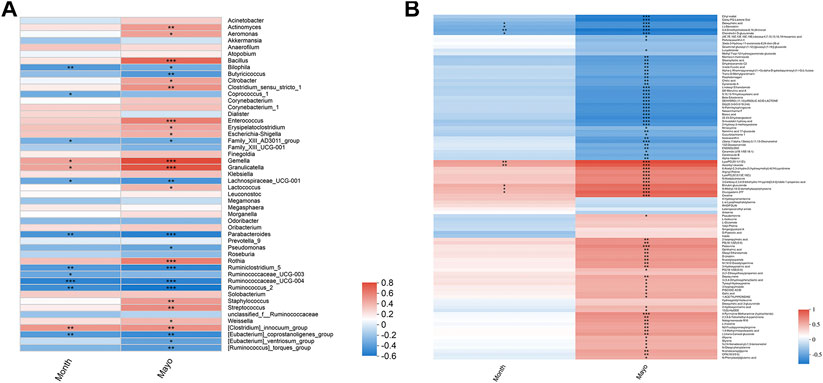
FIGURE 5. Spearman correlation analysis of candidate genera and metabolites with UC clinical indexes. (A) Spearman correlation of candidate genera with UC Mayo score and the course of disease (month). (B) Spearman correlation of candidate metabolites with UC Mayo score and the course of disease (month). Different colors represent the value of correlation coefficient, red indicates positive correlation and blue indicated negative correlation. *0.01 < p ≤ 0.05,**0.001 < p ≤ 0.01,***p ≤ 0.001.
Besides, most of the candidate metabolites (85/102) revealed a significant correlation with UC Mayo score (Figure 5B). It was worth noting that the metabolites decreased by mesalamine were also positively correlated with Mayo score, and vice versa. For example, the levels of ophthalmic acid, allysine and styrene were reduced by mesalamine and positively correlated with Mayo score. Whereas, several metabolites increased by mesalamine such as cholic acid, deoxycholic acid and enoxolone exhibited negative correlation with Mayo score. Interestingly, the correlation pattern of metabolites with Mayo score was consistent with that of gut microbiota, which suggested that the perturbance of gut microbiota might correlate with metabolites disturbance in UC.
Gut Microbiota Correlated with Metabolites Changes in Different Pathways
Spearman correlation analysis was also performed for 49 genera and 102 metabolites candidates to examine whether there is a correlation of gut microbiota with metabolites changes (Figure 6). Of interest, a batch of mesalamine increased metabolites were negatively correlated with mesalamine decreased genera, and vice versa. The metabolites such as ophthalmic acid and styrene that were reduced by mesalamine were positively correlated with mesalamine decreased Enterococcus genus, and mesalamine increased metabolites such as deoxycholic acid and enoxolone were positively correlated with mesalamine increased genera Butyricicoccus and Parabacteroides, respectively.
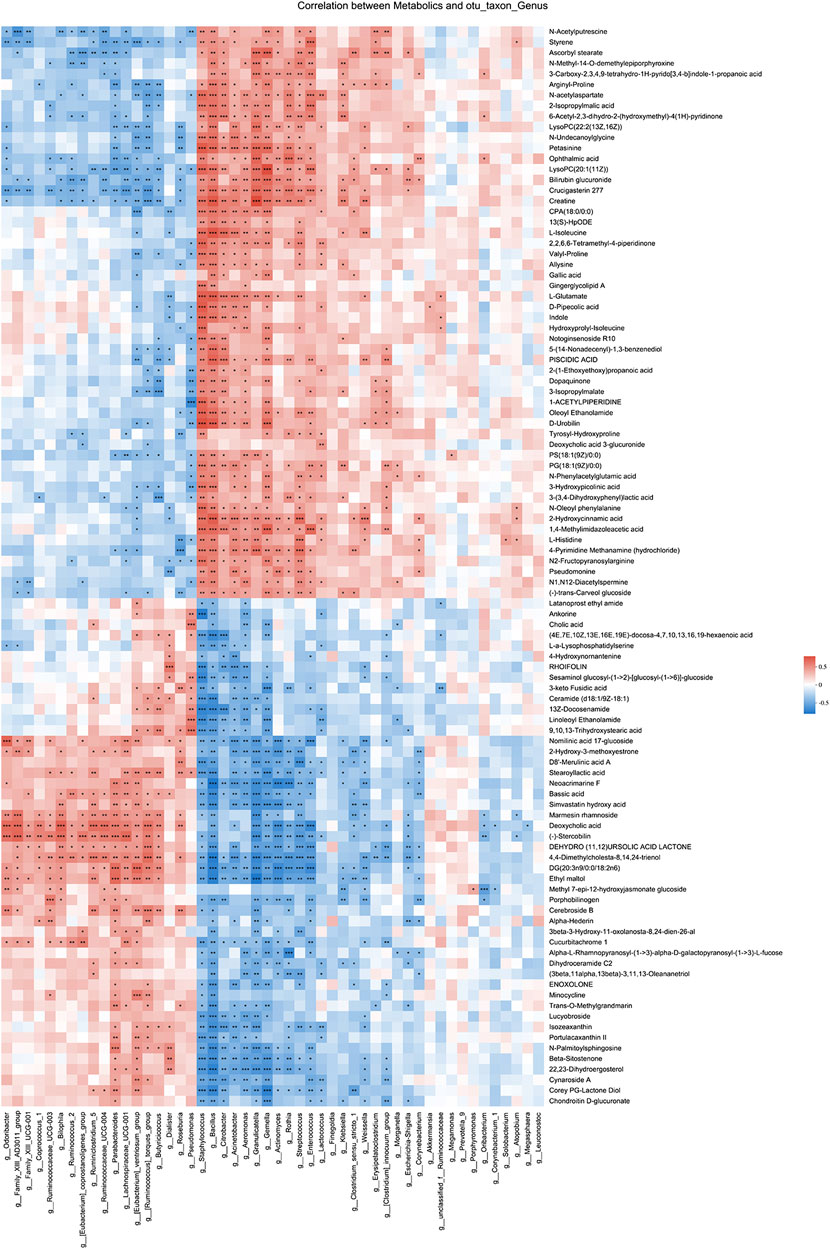
FIGURE 6. Spearman correlation between candidate genera and metabolites. Different colors represent the value of correlation coefficient, red indicates positive correlation and blue indicated negative correlation. *0.01 < p ≤ 0.05,**0.001 < p ≤ 0.01,***p ≤ 0.001.
Furthermore, the functional correlation between gut microbiota and metabolites changes was explored. Using PICRUSt analysis, the 49 candidate genera were enriched in 24 function classes including carbohydrate transport and metabolism, amino acid transport and metabolism, lipid transport and metabolism, signal transduction mechanisms, secondary metabolites biosynthesis, transport and catabolism, etc (Figure 7A). The 102 candidate metabolites were enriched in 14 KEGG pathway related items such as amino acid metabolism, biosynthesis of other secondary metabolites, lipid metabolism, carbohydrate metabolism, etc (Figure 7B). We observed that the candidate genera and metabolites were enriched in many similar molecular pathways such as amino acid metabolism and secondary metabolites biosynthesis, which might implicate the high functional correlation of gut microbiota with related metabolites.
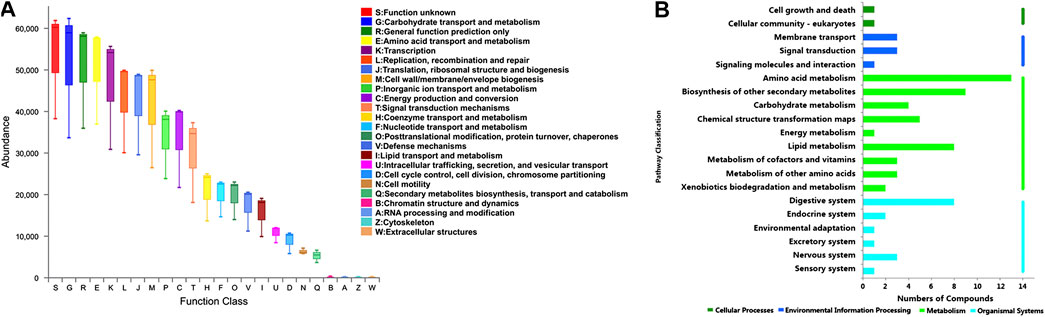
FIGURE 7. Pathway analysis of candidate genera and metabolites. (A) The candidate genera functional prediction by PICRUSt analysis. The horizontal axis represents the function number, and the vertical axis represents the functional abundance. (B) Pathway enrichment of candidate metabolites. The horizontal axis represents the number of enriched metabolites, and the vertical axis represents the enriched pathway items.
The Gut Microbiota Signature Discriminate Treatment-Naïve UC Patients from Both Normal Healthy Control and Mesalamine-Responded UC Patients
To evaluate whether gut microbiota could be used to distinguish treatment-naïve UC patients from normal healthy control or mesalamine-responded UC patients, ROC analysis was performed for 49 candidate genera. Our results indicated that a gut microbiota signature composed of five genera including Escherichia-Shigella, Streptococcus, Megamonas, Prevotella_9 and [Eubacterium]_coprostanoligenes _group might be used to distinguish treatment-naïve UC patients from normal healthy controls (AUC = 0.79, 95% CI 0.6–0.98, Figure 8A). Meanwhile, the five genera signature might also be used to discriminate treatment-naïve UC patients from mesalamine-responded UC patients (AUC = 0.73, 95% CI 0.52–0.94, Figure 8B).
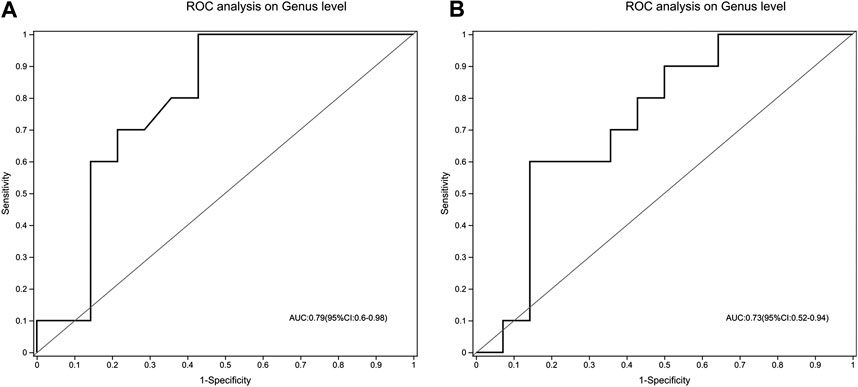
FIGURE 8. A signature composed of five genera discriminating UC group from both NC and mesalamine groups. (A) ROC curve analysis of UC group and NC group. (B) ROC analysis of UC group and mesalamine group.
Discussion
In the present study, 16S rRNA sequencing and LC-MS metabolomics were integrated to detect the perturbance of gut microbiota and metabolites in UC patients and observed the effect of mesalamine. We observed there were significant changes of gut microbiota and metabolites in UC patients, and mesalamine might exert beneficial effects in UC by partially restoring gut microbiota and correlated metabolites in different pathways.
The important role of gut microbiota in UC has been widely accepted, and disruptions to the microbiome have been implicated in the pathogenesis (Derikx et al., 2016). A recent study of fecal microbiota analysis revealed that the relative abundance of Escherichia-shigella and Streptococcus was elevated, whereas Bacteroides and Prevotella_9 was reduced in UC patients compared to healthy participants (Sun et al., 2019). Another study reported the gut microbial dysbiosis in Chinese inflammatory bowel disease patients, and found that the community of Megamonas and Butyricicoccus, which could produce short-chain fatty acids and modulate colonic regulatory T cells, was significantly repressed in UC patients stool samples (Ma et al., 2018). Here, we also observed significant changes of gut microbiota composition in treatment-naïve UC patients using 16S rRNA sequencing bacteria community analysis. We noted that the relative abundance of many genera such as Escherichia-shigella, Megamonas, Clostridium_sensu_stricto_1, Enterococcus and Citrobacter was increased, while a batch of genera such as Megamonas, Prevotella_9, Parabacteroides [Eubacterium]_ventriosum_ group, Ruminococcus_2, Roseburia, Butyricicoccus, Dialister, Akkermansia and [Eubacterium]_coprostanoligenes_group was reduced in UC patients. The results were partially consistent with previous studies. Importantly, we observed that the relative abundance of 49 candidate genera was significantly reversed by mesalamine intervention. It is interesting that most of the candidate genera were significantly correlated with Mayo score and the course of disease. Of which, several genera such as Enterococcus and Streptococcus exhibited a significant positive correlation with Mayo score and the course of disease, exerting their adverse effect in UC pathogenesis. Whereas, other genera such as Butyricicoccus, Parabacteroides and Pseudomonas were negatively correlated with Mayo score and the course of disease, which implicated their beneficial role in UC. It has been reported the amount of Enterococcus was higher in UC patients than in healthy subjects (Nemoto et al., 2012). Another longitudinal analyses of gut mucosal microbiotas in UC patients revealed that high clinical activity indices and sigmoidoscopy scores were associated with Enterococcus faecalis (Fite et al., 2013). Our results were partially consistent with these data. However, there were conflicting results concerning the role of Streptococcus in UC. For example, it is suggested that infection with highly-virulent specific types of Streptococcus mutans might be a potential risk factor in the aggravation of UC (Kojima et al., 2012), whereas, it has been reported that Streptococcus thermophilus strain might have the potential to reduce signs of colitis (Bailey et al., 2017). These results indicated that specific strain of Streptococcus might have different role in the development of UC. In the present study, we reported the association of Streptococcus genus level with UC and did not examine the specific Streptococcus species. Further extensive investigation of the identified candidate genera may obtain novel gut microbiota targets for UC treatment.
It is noted that the perturbation of gut microbial community may lead to metabolite alterations. The disordered metabolites may enter the host, then modulate intestine epithelial cells and inflammation in the disease progression (Arpaia et al., 2013). Therefore, we examined the metabolite profiles across fecal samples from normal healthy subjects, treatment-naïve UC patients and mesalamine-responded UC patients. By LC-MS metabolomics, we noted that a batch of metabolites were significantly different in treatment-naïve UC patients, and mesalamine restored the changes of 102 candidate metabolites. Many amino acids in serum such as leucine, isoleucine, glycine and histidine have been implicated in inflammatory bowel diseases (Dawiskiba et al., 2014; Probert et al., 2018). In the present study, l-isoleucine and l-histidine in fecal samples were remarkably changed in treatment-naïve UC patients and could be restored by mesalamine intervention. The findings indicated their potential role in UC and might serve as potential therapeutic targets. Dysmetabolism of bile acids has also been found in UC pathogenesis (Pavlidis et al., 2015). Duboc, et al., 2013 reported that the level of secondary bile acids was decreased in fecal and serum samples of UC patients, and Sinha, et al., 2020 observed lithocholic acid and deoxycholic acid were reduced in stool samples of UC patients (Duboc et al., 2013; Sinha et al., 2020). Our results partially conformed to their findings. We noted that cholic acid and deoxycholic acid concentrations were reduced in UC patients and could be restored by mesalamine intervention. Besides, we also obtained many other mesalamine reversed candidates which had been implicated in UC. For example, styrene is a benzenoid compound produced by decarboxylation of cinnamic acid and has been reported positively correlated with disease activity in UC (De Preter et al., 2015). In present study, we noted that the level of styrene was higher in treatment-naïve UC patients than normal healthy controls and positively correlated with UC Mayo score. It is worth noting that most of the candidate metabolites were not only significantly correlated with UC Mayo score, but also correlated with specific bacteria genera. Furthermore, we observed that the candidate genera and metabolites were enriched in many similar KEGG pathways such as amino acid metabolism and secondary metabolites biosynthesis, indicating their high functional correlation. The results suggested that mesalamine might exert a beneficial role in UC by modulating gut microbiota genera and relevant metabolites in different pathways. In-depth extensive investigation of the identified candidates may provide us novel targets for UC treatment.
Finally, we identified a gut microbiota signature composed of five genera that might be used to discriminate treatment-naïve UC patients from both normal healthy controls and mesalamine-responded UC patients. However, our study has some inherent limitations. Firstly, the findings in the present study were based on the limited samples with no further functional experiments, and the identified genera and metabolites candidates should be further verified in a comprehensive and large scale investigation. Second, this exploratory study composed of two cross-sectional trials. Current results could only support correlation, not the causality. Besides, the cross-sectional design ignored the pre-treatment clinical information of mesalamine group. Potential imbalance may exist between UC group and mesalamine group, which may affect the results. Longitudinal design should be considered in future studies. Third, the course of disease might affect the gut microbiota and metabolites, and further study should be performed in UC patients with matched course of disease to validate our findings.
Conclusion
In summary, 16S rRNA sequencing and metabolomics approaches were integrated to detect the perturbance of gut microbiota and metabolites in stool samples across normal healthy controls, treatment-naïve UC patients and mesalamine-responded UC patients. We observed significant changes of gut microbiota and metabolites in UC patients. Mesalamine might exert beneficial effects in UC by modulating gut microbiota and correlated metabolites in different pathways. We also identified a gut microbiota signature to discriminate treatment-naïve UC from normal healthy controls and mesalamine-responded UC patients. Our results may shed new lights on the mechanism of mesalamine in UC treatment and provide us novel therapeutic targets.
Data Availability Statement
The datasets presented in this study can be found in online repositories. The names of the repository/repositories and accession number(s) can be found below: NCBI SRA database, under the accession (BioProject PRJNA681685).
Ethics Statement
The studies involving human participants were reviewed and approved by Ethics Committee of Longhua Hospital. The patients/participants provided their written informed consent to participate in this study.
Author Contributions
LD and YT collected and prepared the samples, analyzed the data and wrote the manuscript. WZ, YD, and QS collected the samples. ZT interpreted the data. MZ and GJ designed the study, interpreted the data, wrote and revised the manuscript. All authors contributed to the article and approved the submitted version.
Funding
This work was supported by Three Year Action Plan of Shanghai Hygiene (ZY(2018-2020)-CCCX-2002-01) and Evidence-based Special Project of National Traditional Chinese Medicine (2019xzzx-xh012).
Conflict of Interest
The authors declare that the research was conducted in the absence of any commercial or financial relationships that could be construed as a potential conflict of interest.
Supplementary Material
The Supplementary Material for this article can be found online at: https://www.frontiersin.org/articles/10.3389/fphar.2020.620724/full#supplementary-material.
References
Arpaia, N., Campbell, C., Fan, X., Dikiy, S., Van Der Veeken, J., Deroos, P., et al. (2013). Metabolites produced by commensal bacteria promote peripheral regulatory T-cell generation. Nature 504, 451–455. doi:10.1038/nature12726
Bailey, J. R., Vince, V., Williams, N. A., and Cogan, T. A. (2017). Streptococcus thermophilus NCIMB 41856 ameliorates signs of colitis in an animal model of inflammatory bowel disease. Benef. Microbes. 8, 605–614. doi:10.3920/BM2016.0110
Bajer, L., Kverka, M., Kostovcik, M., Macinga, P., Dvorak, J., Stehlikova, Z., et al. (2017). Distinct gut microbiota profiles in patients with primary sclerosing cholangitis and ulcerative colitis. World J. Gastroenterol. 23, 4548–4558. doi:10.3748/wjg.v23.i25.4548
Baron, J. H., Connell, A. M., and Lennard-Jones, J. E. (1964). Variation between observers in describing mucosal appearances in proctocolitis. Br. Med. J. 1, 89–92. doi:10.1136/bmj.1.5375.89
Chen, S., Zhou, Y., Chen, Y., and Gu, J. (2018). Fastp: an ultra-fast all-in-one FASTQ preprocessor. Bioinformatics 34, i884–i890. doi:10.1093/bioinformatics/bty560
Dawiskiba, T., Deja, S., Mulak, A., Ząbek, A., Jawień, E., Pawełka, D., et al. (2014). Serum and urine metabolomic fingerprinting in diagnostics of inflammatory bowel diseases. World J. Gastroenterol. 20, 163–174. doi:10.3748/wjg.v20.i1.163
De Preter, V., Machiels, K., Joossens, M., Arijs, I., Matthys, C., Vermeire, S., et al. (2015). Faecal metabolite profiling identifies medium-chain fatty acids as discriminating compounds in IBD. Gut 64, 447–458. doi:10.1136/gutjnl-2013-306423
Derikx, L. A., Dieleman, L. A., and Hoentjen, F. (2016). Probiotics and prebiotics in ulcerative colitis. Best Pract. Res. Clin. Gastroenterol. 30, 55–71. doi:10.1016/j.bpg.2016.02.005
Duboc, H., Rajca, S., Rainteau, D., Benarous, D., Maubert, M. A., Quervain, E., et al. (2013). Connecting dysbiosis, bile-acid dysmetabolism and gut inflammation in inflammatory bowel diseases. Gut 62, 531–539. doi:10.1136/gutjnl-2012-302578
Edgar, R. C. (2013). UPARSE: highly accurate OTU sequences from microbial amplicon reads. Nat. Methods 10, 996–998. doi:10.1038/nmeth.2604
Fite, A., Macfarlane, S., Furrie, E., Bahrami, B., Cummings, J. H., Steinke, D. T., et al. (2013). Longitudinal analyses of gut mucosal microbiotas in ulcerative colitis in relation to patient age and disease severity and duration. J. Clin. Microbiol. 51, 849–856. doi:10.1128/JCM.02574-12
Hoivik, M. L., Moum, B., Solberg, I. C., Henriksen, M., Cvancarova, M., Bernklev, T., et al. (2013). Work disability in inflammatory bowel disease patients 10 years after disease onset: results from the IBSEN Study. Gut 62, 368–375. doi:10.1136/gutjnl-2012-302311
Kaur, A., and Goggolidou, P. (2020). Ulcerative colitis: understanding its cellular pathology could provide insights into novel therapies. J. Inflamm. 17, 15. doi:10.1186/s12950-02000246-4
Kojima, A., Nakano, K., Wada, K., Takahashi, H., Katayama, K., Yoneda, M., et al. (2012). Infection of specific strains of Streptococcus mutans, oral bacteria, confers a risk of ulcerative colitis. Sci. Rep. 2, 332. doi:10.1038/srep00332
Kotze, P. G., Steinwurz, F., Francisconi, C., Zaltman, C., Pinheiro, M., Salese, L., et al. (2020). Review of the epidemiology and burden of ulcerative colitis in Latin America. Therap. Adv. Gastroenterol. 13, 1756284820931739. doi:10.1177/1756284820931739
Langille, M. G., Zaneveld, J., Caporaso, J. G., Mcdonald, D., Knights, D., Reyes, J. A., et al. (2013). Predictive functional profiling of microbial communities using 16S rRNA marker gene sequences. Nat. Biotechnol. 31, 814–821. doi:10.1038/nbt.2676
Ma, H. Q., Yu, T. T., Zhao, X. J., Zhang, Y., and Zhang, H. J. (2018). Fecal microbial dysbiosis in Chinese patients with inflammatory bowel disease. World J. Gastroenterol. 24, 1464–1477. doi:10.3748/wjg.v24.i13.1464
Magoc, T., and Salzberg, S. L. (2011). FLASH: fast length adjustment of short reads to improve genome assemblies. Bioinformatics 27, 2957–2963.
Nemoto, H., Kataoka, K., Ishikawa, H., Ikata, K., Arimochi, H., Iwasaki, T., et al. (2012). Reduced diversity and imbalance of fecal microbiota in patients with ulcerative colitis. Dig. Dis. Sci. 57, 2955–2964. doi:10.1007/s10620-012-2236-y
Pavlidis, P., Powell, N., Vincent, R. P., Ehrlich, D., Bjarnason, I., and Hayee, B. (2015). Systematic review: bile acids and intestinal inflammation-luminal aggressors or regulators of mucosal defence? Aliment. Pharmacol. Ther. 42, 802–817. doi:10.1111/apt.13333
Porter, R. J., Kalla, R., and Ho, G. T. (2020). Ulcerative colitis: recent advances in the understanding of disease pathogenesis F1000Res. 9, F1000 Faculty Rev-294. doi:10.12688/f1000research.20805.1
Probert, F., Walsh, A., Jagielowicz, M., Yeo, T., Claridge, T. D. W., Simmons, A., et al. (2018). Plasma nuclear magnetic resonance metabolomics discriminates between high and low endoscopic activity and predicts progression in a prospective cohort of patients with ulcerative colitis. J. Crohns. Colitis. 12, 1326–1337. doi:10.1093/ecco-jcc/jjy101
Rutgeerts, P., Sandborn, W. J., Feagan, B. G., Reinisch, W., Olson, A., Johanns, J., et al. (2005). Infliximab for induction and maintenance therapy for ulcerative colitis. N. Engl. J. Med. 353, 2462–2476. doi:10.1056/NEJMoa050516
Scaldaferri, F., Gerardi, V., Mangiola, F., Lopetuso, L. R., Pizzoferrato, M., Petito, V., et al. (2016). Role and mechanisms of action of Escherichia coli Nissle 1917 in the maintenance of remission in ulcerative colitis patients: an update. World J. Gastroenterol. 22, 5505–5511. doi:10.3748/wjg.v22.i24.5505
Shang, Q., Sun, W., Shan, X., Jiang, H., Cai, C., Hao, J., et al. (2017). Carrageenan-induced colitis is associated with decreased population of anti-inflammatory bacterium, Akkermansia muciniphila, in the gut microbiota of C57BL/6J mice. Toxicol. Lett. 279, 87–95. doi:10.1016/j.toxlet.2017.07.904
Shen, Z. H., Zhu, C. X., Quan, Y. S., Yang, Z. Y., Wu, S., Luo, W. W., et al. (2018). Relationship between intestinal microbiota and ulcerative colitis: mechanisms and clinical application of probiotics and fecal microbiota transplantation. World J. Gastroenterol. 24, 5–14. doi:10.3748/wjg.v24.i1.5
Sinha, S. R., Haileselassie, Y., Nguyen, L. P., Tropini, C., Wang, M., Becker, L. S., et al. (2020). Dysbiosis-induced secondary bile acid deficiency promotes intestinal inflammation. Cell Host. Microbe. 27, 659–e5. doi:10.1016/j.chom.2020.01.021
Sun, M., Du, B., Shi, Y., Lu, Y., Zhou, Y., and Liu, B. (2019). Combined signature of the fecal microbiome and plasma Metabolome in patients with ulcerative colitis. Med. Sci. Mon. Int. Med. J. Exp. Clin. Res. 25, 3303–3315. doi:10.12659/MSM.916009
Ungaro, R., Mehandru, S., Allen, P. B., Peyrin-Biroulet, L., and Colombel, J. F. (2017). Ulcerative colitis. Lancet 389, 1756–1770. doi:10.1016/S0140-6736(16)32126-2
Wang, Q., Garrity, G. M., Tiedje, J. M., and Cole, J. R. (2007). Naive Bayesian classifier for rapid assignment of rRNA sequences into the new bacterial taxonomy. Appl. Environ. Microbiol. 73, 5261–5267. doi:10.1128/AEM.00062-07
Wu, K. C., Liang, J., Ran, Z. H., Qian, J. M., Yang, H., Chen, M. H., and He, Y. (2018). For inflammatory bowel disease group of Chinese society of gastroenterology of Chinese medical association Chinese consensus on diagnosis and treatment of inflammatory bowel disease (Beijing, 2018). Chin. J. Pract. Intern. Med. 38, 796–813. doi:10.19538/j.nk2018090106
Keywords: 16S rRNA sequencing, metabolomics, mesalamine, ulcerative colitis, gut microbiota
Citation: Dai L, Tang Y, Zhou W, Dang Y, Sun Q, Tang Z, Zhu M and Ji G (2021) Gut Microbiota and Related Metabolites Were Disturbed in Ulcerative Colitis and Partly Restored After Mesalamine Treatment. Front. Pharmacol. 11:620724. doi: 10.3389/fphar.2020.620724
Received: 23 October 2020; Accepted: 14 December 2020;
Published: 18 January 2021.
Edited by:
Ruixin Zhu, Tongji University, ChinaReviewed by:
Hao Wu, Zhongshan Hospital, Fudan University, ChinaLuqing Zhao, Beijing Hospital of Traditional Chinese Medicine, Capital Medical University, China
Copyright © 2021 Dai, Tang, Zhou, Dang, Sun, Tang, Zhu and Ji. This is an open-access article distributed under the terms of the Creative Commons Attribution License (CC BY). The use, distribution or reproduction in other forums is permitted, provided the original author(s) and the copyright owner(s) are credited and that the original publication in this journal is cited, in accordance with accepted academic practice. No use, distribution or reproduction is permitted which does not comply with these terms.
*Correspondence: Mingzhe Zhu, zhumingzhe@sibs.ac.cn; Guang Ji, jiliver@vip.sina.com
†These authors have contributed equally to this work