 Harmeet Singh-Bakala1,2
 Francia Ravelombola1
 Cheryl Adeva1
 Maiara Oliveira1
 Ru Zhang3Jessica Argenta1Grover Shannon1
 Feng Lin1*
- 1University of Missouri-Fisher Delta Research, Extension & Education Center, Portageville, MO, United States
- 2Division of Plant Science & Technology, University of Missouri, Columbia, MO, United States
- 3Donald Danforth Plant Science Center, St. Louis, MO, United States
Introduction: Drought stress is a major constraint for Soybean (Glycine max (L.) Merr.) productivity, exacerbating yield instability under current and predicted environments. Breeding drought resilient soybean varieties requires more robust selection markers for improved accuracy.
Methods: To identify the traits associated with field drought tolerance, we evaluated photosynthetic and other morpho-physiological traits in elite soybean germplasm at drought sensitive reproductive stage (R2-R3). Using chlorophyll fluorescence phenotyping and mixed model analysis, we assessed genotypic variability in various photosynthetic and morpho-physiological traits under irrigated and rainfed field conditions.
Results: Tolerant genotypes (higher yield stability) exhibited significantly higher SPAD, NPQt, and FvP/FmP under drought, along with reduced leaf thickness. Multivariate analyses suggested these photosynthetic and morpho-physiological traits as key indicators of yield stability under drought. By coupling with soil parameters, these traits were able to explain 74-79% of yield variance in predictive models.
Discussion: These findings suggest that SPAD, NPQt, FvP/FmP, and leaf thickness are valuable markers for identifying drought-tolerant genotypes. Integrating these traits into selection criteria could improve the accuracy of breeding programs aimed at developing drought-resilient soybean varieties. Future efforts should validate these markers across diverse environments and leverage genomic tools to accelerate allele discovery, offering a pathway to climate-resilient soybean production.
1 Introduction
Soybean (G. max) (1) is a globally important legume cash crop. It is the most widely cultivated oilseed crop, contributing over 60% of the world’s vegetable oil and protein supply (Graham and Vance, 2003; Martignone et al., 2023). It holds substantial economic importance, serving as a primary protein source for animal feed. The high protein and fiber content of soybean seeds make them more nutritious alternative compared to staple cereals. The United States, Brazil and Argentina collectively account for nearly 80% of global soybean production (USDA, 2024). However, future environmental stressors pose significant challenges to enhancing soybean productivity (Dijk et al., 2021). Drought is a major abiotic stressor significantly reducing soybean yield and quality around the world (Manavalan et al., 2009). Soybean is particularly sensitive to water shortages during the reproductive phase, where drought stress can result in yield losses of up to 80% (Sadeghipour and Abbasi, 2012; Brown et al., 1985; Desclaux et al., 2000). It can also severely impair seed size, weight and composition in addition to crop yield (He et al., 2017b; Frederick et al., 2001; Fang et al., 2010). Although elevated CO2 levels may have compensatory effects on soybean, this benefit can be negated by drought stress, which limits photosynthetic capacity and yield potential in soybean (Rezaei et al., 2023). Drought stress disrupts key metabolic and physiological processes such as oxidative stress mitigation, membrane integrity, and enzyme activities, which collectively inhibit plant growth and development. Additionally, drought stress also weakens the immune system of crop plants and enhances susceptibility to microbial infections (Atkinson and Urwin, 2012).
Developing varieties with improved yield under water deficit conditions has faced challenges due to intrinsic G×E interactions (Rauf et al., 2016). Direct selection for yield improvement under drought is often expensive, time consuming and complex. High yielding varieties may still suffer relative yield reductions during drought, despite their high yield potential (Ribaut et al., 1997). Consequently, indirect selection strategies using morpho-physiological or biochemical markers have gained attention (Lafitte et al., 2004; Parmley et al., 2019; Guzzo et al., 2021). However, effectiveness of these approaches depends on the development of reliable and reproducible markers. Identifying and validating drought tolerance traits are essential steps towards obtaining valuable markers for breeding programs and selecting superior lines. Traits such as water use efficiency (WUE) (He et al., 2017a), rate of canopy wilting (Ye et al., 2020), root morphology, leaf water loss and relative water content (RWC) have been evaluated with varying degrees of success (Fried et al., 2019; Toum et al., 2022).
While soybean exhibits genotypic variation in response to drought stress, studies connecting physiological insights to drought tolerance breeding remain limited. Previous research (Gilbert et al., 2011; Hossain et al., 2014) has reported significant variability in photosynthesis and stomatal conductance among drought tolerant genotypes. Although some progress has been made in enhancing drought tolerance in soybean, primarily through conventional breeding and improved agronomic practices (Dubey et al., 2019), the morpho-physiological traits such as photosynthesis and photoprotection, in terms of yield stability under limited field moisture remain underexplored (Guzzo et al., 2021). A deeper understanding of the morpho-physiological mechanisms and other traits could provide promising pathways to improve soybean productivity in water-limited environments (Koester et al., 2014). Thus, identifying key morpho-physiological traits that sustain or improve yield under limited moisture and their relationship to final seed yield under field conditions, could enhance soybean productivity in water-limited environments. Water availability during reproductive stages is critical for determining seed yield under stress conditions (Kato et al., 2008; Fang et al., 2010). Photosynthesis is significantly disrupted by water deficiency due to reduction in stomatal and mesophyll conductance (Chaves et al., 2009). Under such conditions, the fraction of light energy utilized for photochemistry declines, leading to an increase in excessive energy dissipation via non-photochemical quenching (NPQ). Examining drought-induced changes in physiological traits and their influence on agronomic performance is crucial for enhancing soybean resilience in water-limited environments (Guzzo et al., 2021; Dubey et al., 2019). Understanding the genetic variation underlying these physiological responses is essential for selecting superior genotypes and developing effective breeding strategies for drought tolerance in soybean.
Identifying key morpho-physiological traits associated with yield stability under drought stress can facilitate their further improvement through molecular breeding approaches (Dubey et al., 2019; Guzzo et al., 2021; Toum et al., 2022). This provides breeders with a quantitative framework for selecting genotypes that demonstrate consistent performance across varying moisture conditions. Integrating physiological insights into breeding programs enables a more strategic selection process, ultimately improving drought resilience in soybean. Therefore, the key objectives of this study were to: 1) Evaluate the genetic variation in seed yield, photosynthetic and other physiological traits under drought and irrigated conditions; 2) Investigate the relationships between photosynthetic traits and seed yield under both the water regimes and identify morpho-physiological parameters associated with seed yield potential under moisture-limited conditions; 3) Exploring predictive frameworks integrating photosynthetic traits, soil parameters, and environmental data to forecast soybean performance under variable moisture conditions, enabling trait-based selection to aid drought tolerance breeding efforts in soybean.
2 Material and methods
2.1 Plant material and experimental design
A total of nine genotypes including advanced breeding lines (MG IV) and commercial checks were used in this study (Table 1). All genotypes were evaluated under rainfed (RF) and irrigated (IR) conditions in Portageville, Missouri during 2024 season (approx. 36.4034°N, 89.6149°W). Both IR and RF trials were sown on 10th May 2024, using a randomized complete block design (RCBD) with five replicates per genotype under each treatment. The fields used for different water treatments had similar soil texture (i.e. silt loam). Each plot consists of 4 rows (2.1m row length and 0.76m row spacing). The seed rate used was 300,000 seeds per hectare. Furrow irrigation was applied whenever a slight wilting was observed in IR field during reproductive stages, while adequate rainfall during vegetative stages reduced the need for supplemental irrigation.
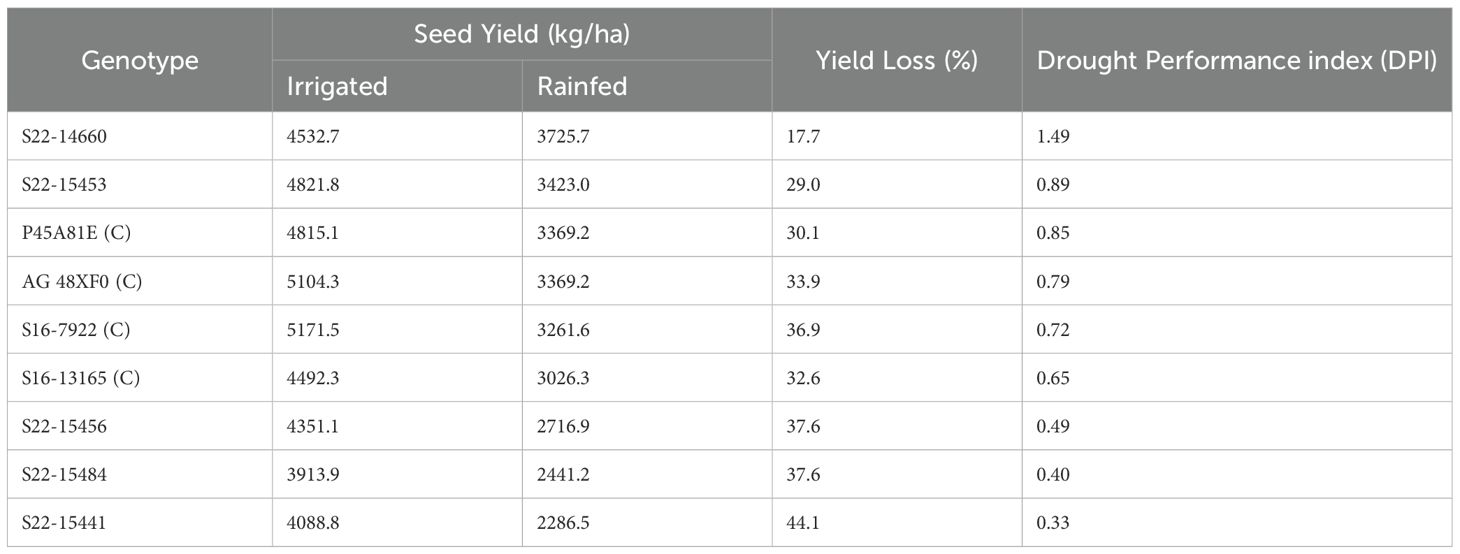
Table 1. Relative yield performance of all the genotypes along with drought performance index based on their relative yield loss under drought conditions.
2.2 Data collection
2.2.1 Physiological data collection
At the R2-R3 growth stage, photosynthesis related traits were measured using MultispeQ v2.0 (PhotosynQ Inc, California, USA) (Kuhlgert et al., 2016). Fluorescence yield and absorbance change were recorded at wavelengths ranging from 450 nm to 950 nm using the manufacturer-designed protocol (Photosynthesis RIDES 2.0), which provides photosynthetic (PS) and physiological traits such as Phi2 (quantum yield of PSII), SPAD, FvP/FmP (maximum quantum efficiency of PSII), LEF (Linear electron flow), NPQt (non-photochemical quenching). Additionally, it provides canopy and environmental parameters (light intensity (PAR), leaf angle, leaf temperature, leaf thickness, ambient temperature, and relative humidity). The data on a plot basis was collected from three different representative plants using their upper canopy leaves and all data points were collected between 10 AM and 2 PM. Data from both the rainfed (RF) and irrigated (IR) treatments were collected on the same day with clear weather conditions and minimal wind. As such, every genotype had 5 independent observations for each treatment.
2.2.2 Morpho-agronomic data collection
At the R2-R3 growth stage, the rainfed field experienced drought conditions due to ~6 weeks dry spell (approx. 50% soil moisture compared to irrigated field during reproductive stage, confirmed by soil moisture sensors). At this stage, the rate of canopy wilting was examined in RF treatment as canopy wilting score (CWS), with CWS = 1 (slow wilting) to CWS = 5 (fast wilting) based on visual observations of each plot. Final seed yield (kg/ha) was recorded for both IR and RF trials and the middle two rows were harvested for each plot to avoid the edge effect.
2.2.3 Environmental data collection
Soil moisture sensors (AquaTrac, Agesense) were used in both IR and RF fields covering up to 32 inches of soil depth, providing output in tensiometric units (cB). Multiple soil samples were collected from both IR and RF fields for their composition and nutrition profiling to account for experimental error and predictive modeling in the study (Supplementary Table S1).
2.3 Statistical analyses
Mixed effect linear models with lmer package (Bates et al., 2015) were used to partition variance for seed yield and physiological traits across genotypes and treatments. Data analyses were performed in R-studio (RStudio Team, 2020). For seed yield and morpho-physiological traits, the model was structured as:
Yijkl = μ + Gi + Tj + (G×T)ij + Rk + ϵijkl
Where: Y = Observed trait(s) for genotype i, treatment j within replication k.
μ: Overall mean
Gi: Fixed effect of genotype i
Tj: Fixed effect of treatment j (rainfed vs. irrigated).
(G×T)ij: Fixed interaction between genotype and treatment.
Rk: Random effect of replication k.
ϵijkl: Residual error.
Broad sense Heritability (H2) was calculated for all the traits under drought and irrigated conditions to assess their genetic control (Fehr, 1993).
Where σ2g is genotypic variance, σ2e is residual variance and r is replications.
2.4 Drought performance index
To evaluate relative yield stability of soybean genotypes under contrasting moisture regimes, Drought Performance Index (DPI) was computed. This index was used to integrate seed yield potential and stress resilience to identify genotypes with stable performance across environments. The DPI was determined as:
DPI = DTI/DSI
Drought tolerance index (DTI) was calculated as described in Fernandez (1992) and Poudel et al. (2023), which quantifies a genotype’s ability to maintain yield under drought relative to irrigated conditions while accounting for overall productivity:
where Ys = Mean yield of a genotype under drought stress, Yc = Mean yield of the same genotype under irrigation (control), Xc = Mean yield of all genotypes under irrigation.
Drought susceptibility index (DSI) was adapted from Fischer and Maurer (1978) and Zafer et al. (2023), which measures a genotype’s susceptibility to yield loss under drought:
D = Stress intensity, calculated as 1−(Xs/Xc), where Xs = Mean yield of all genotypes under drought stress.
2.5 Multivariate analyses and predictive modeling
Pearson correlations were computed between seed yield and other physiological traits including photosynthetic traits using the R package corrplot (Wei and Simko, 2024). The resulting P-values were considered statistically significant at α =0.05, unless otherwise mentioned. Other packages used for plotting graphs and data organization are agricolae (de Mendiburu, 2023), ggplot2 (Wickham, 2016) and dplyr (Wickham et al., 2023). Principal component analysis was performed using the package FactoMineR (Lê et al., 2008) to understand the contribution of different traits in the variables observed in the experiment. Structural equation model (SEM) analysis was performed using the package laavan (Rosseel, 2012) to understand the potential direct and indirect effects of various photosynthetic and environmental parameters on seed yield. For seed yield prediction modeling, partial least square regression (PSLR) and random forest (RNF) models were explored using packages pls (Mevik and Wehrens, 2007) and randomForest (Liaw and Weiner, 2002). These two models were chosen considering their interpretability and ability to address multicollinearity for complex traits. Different metrices such as Root Mean Squared Error (RMSE), Mean absolute Error (MAE), along with coefficient of determination (R2) were used to compare models’ performance. The selected photosynthetic, morpho-physiological and environmental traits were included as predictors (X1, X2, …) and seed yield as response variable (Y). Various matrices such as coefficient of determination (R2), root mean square error (RMSE) and mean absolute error (MAE) were computed to compare performance of the models.
3 Results
3.1 Genetic variation in yield components and physiological traits under drought conditions
In our field experiment, we observed a strong variation in yield and morpho-physiological traits including photosynthetic and leaf morphological parameters across irrigated and rainfed conditions (Table 2; Supplementary Table S2). ANOVA revealed significant treatment effects (IR vs RF) across multiple yield and physiological traits (P < 0.05; Figure 1), which demonstrated the impact of limited moisture conditions on the performance of all genotypes. Various traits including seed yield, HSW, PAR, SPAD, LEF, leaf angle, leaf thickness and leaf temperature differential exhibited marked differences (Figures 1, 2). Irrigated plots averaged 50% higher mean seed yield (4587 vs 3069 kg/ha) than rainfed plots. Also, hundred seed weight (HSW) was significantly higher in irrigated conditions (13.43g) than rainfed (12.29g), indicating better seed filling under optimal water availability. Relative chlorophyll content (SPAD) and some photosynthetic traits such as FvP/FmP, qL and vH+ were significantly higher in irrigated conditions (P < 0.05), indicating better mean photosynthetic performance. However, some canopy related traits such as PAR, Leaf thickness, leaf temperature differential, LEF, PhiNO and NPQt were higher in rainfed conditions Also, several morpho-physiological traits and yield components showed significant genotypic variability including SPAD, FvP/FmP, leaf thickness, leaf temperature, PhiNO, NPQt and vH+ (Table 2; Figure 3). Genotype × Treatment interactions were significant only for traits- NPQt (P < 0.001), PhiNO and vH+ (P < 0.05), indicating that the genotypic responses to environmental changes were more pronounced for light energy dissipation and utilization, especially under low moisture conditions.
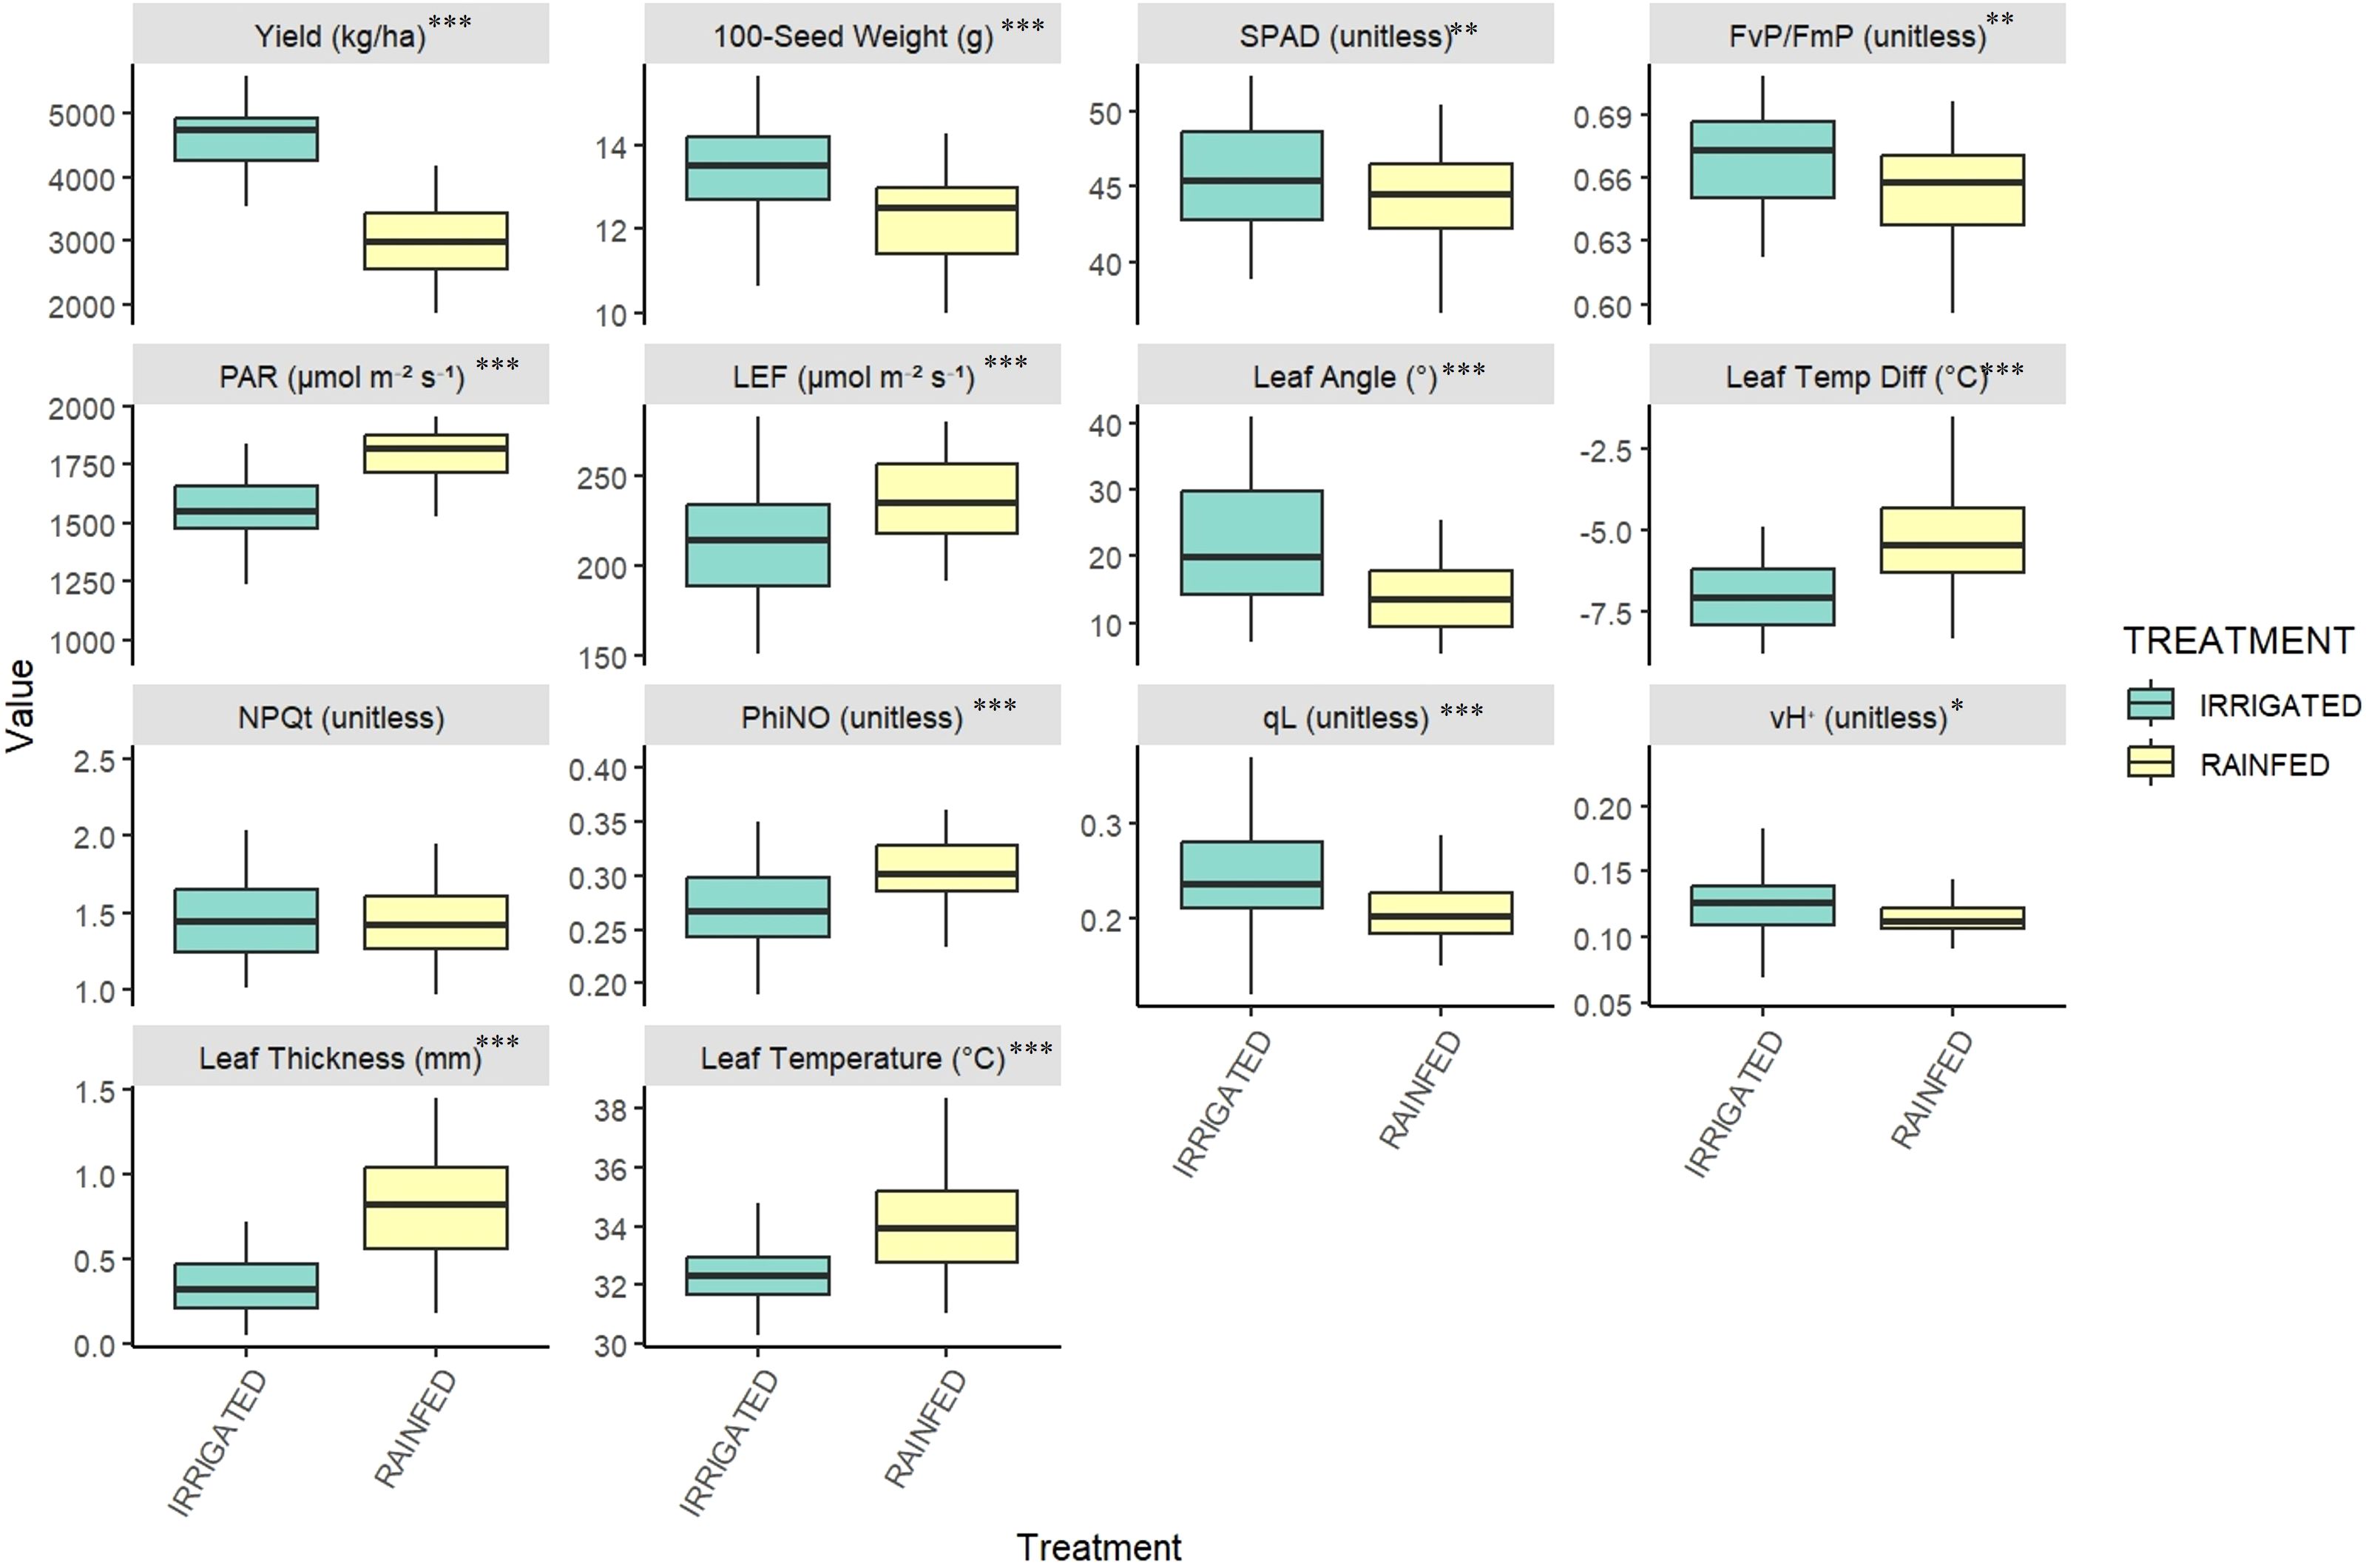
Figure 1. Boxplots showing overall comparison of Physiological and Yield parameters across irrigated and rainfed treatments (n=45) (***P < 0.001; **P < 0.01; *P < 0.05). Some physiological parameters without absolute units are marked unitless.
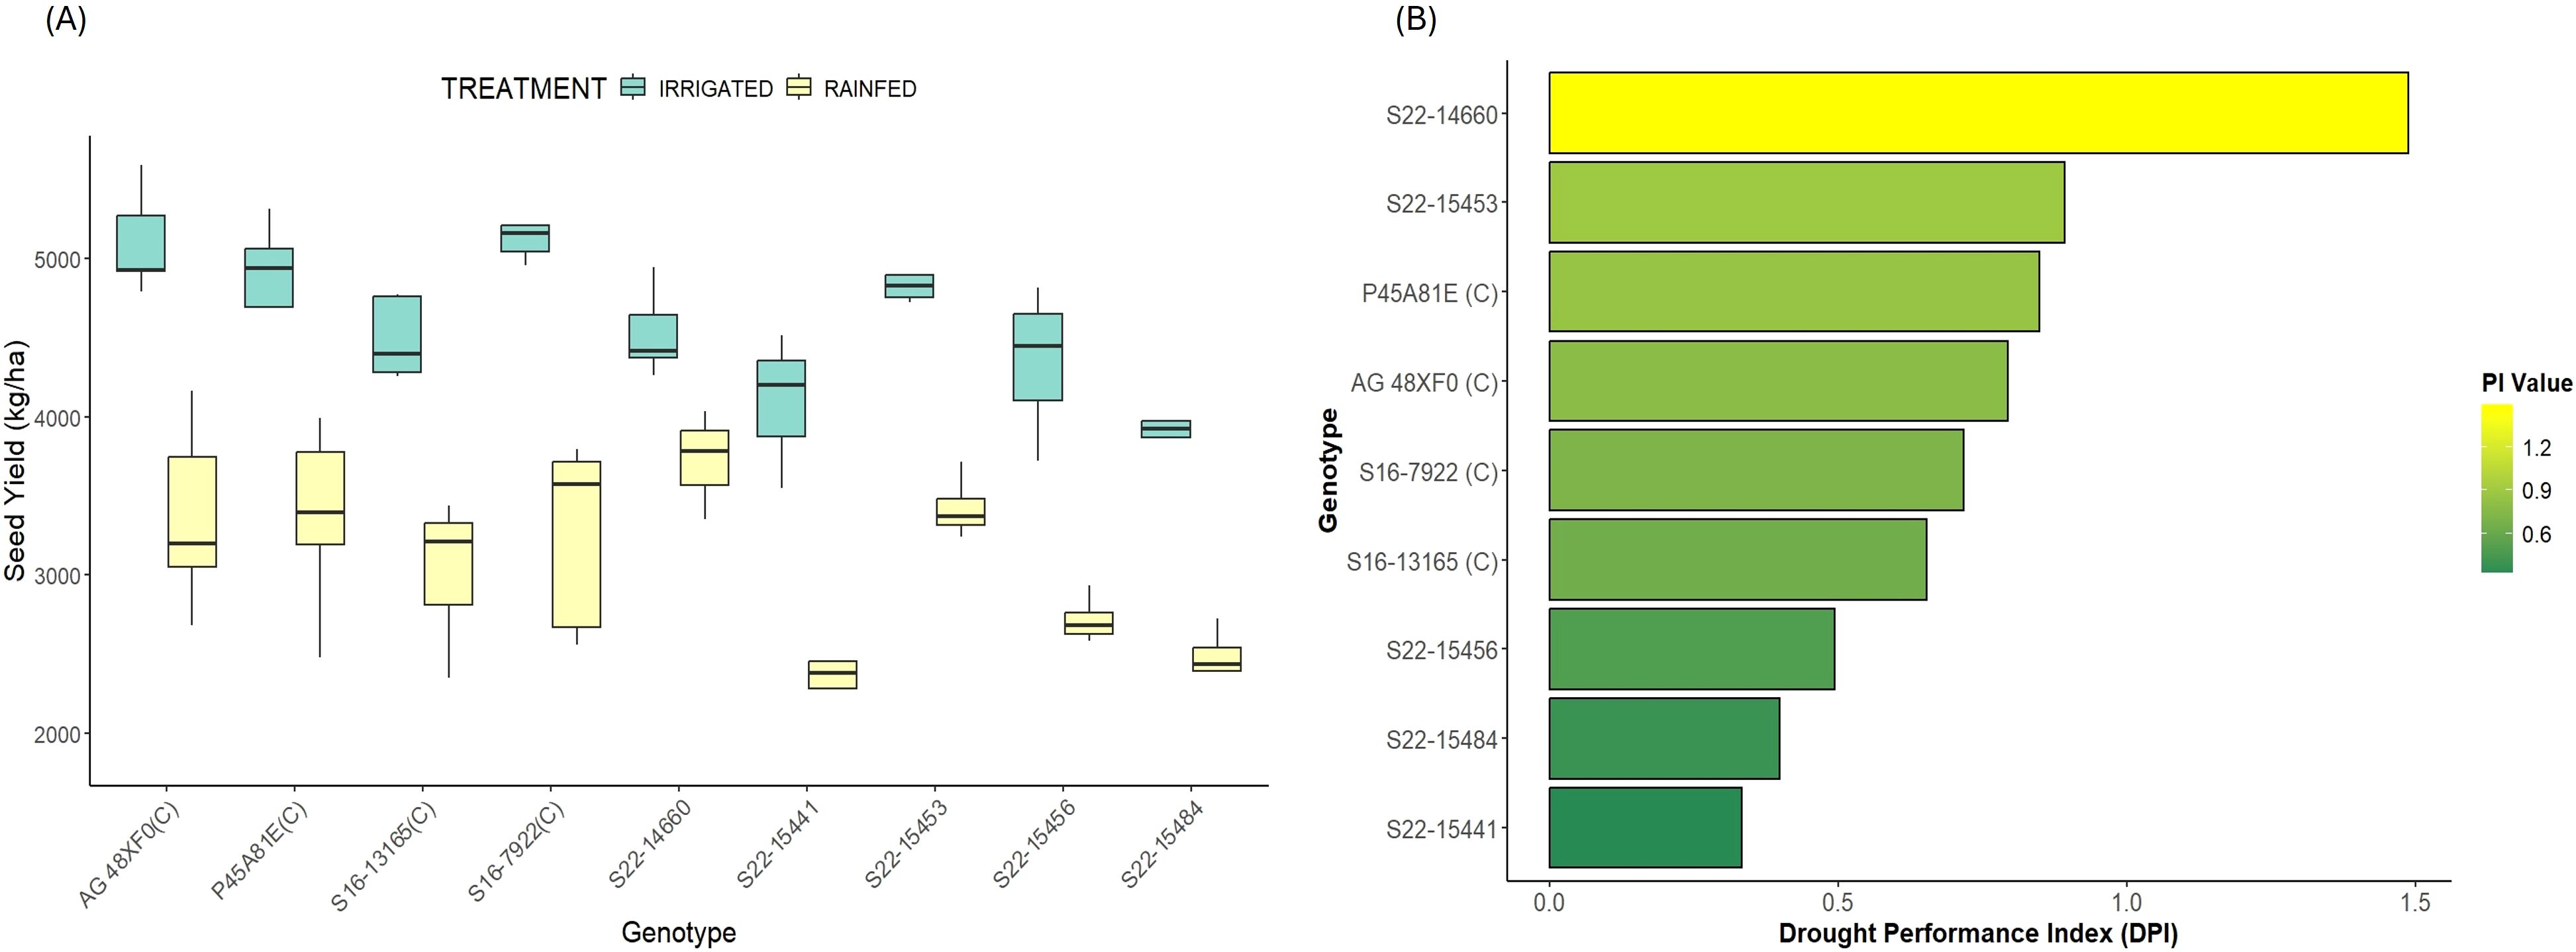
Figure 2. Relative yield performance (A) Boxplots showing seed yield for all the genotypes across both treatments; (B) Drought Performance index (DPI) based ranking of all the genotypes.
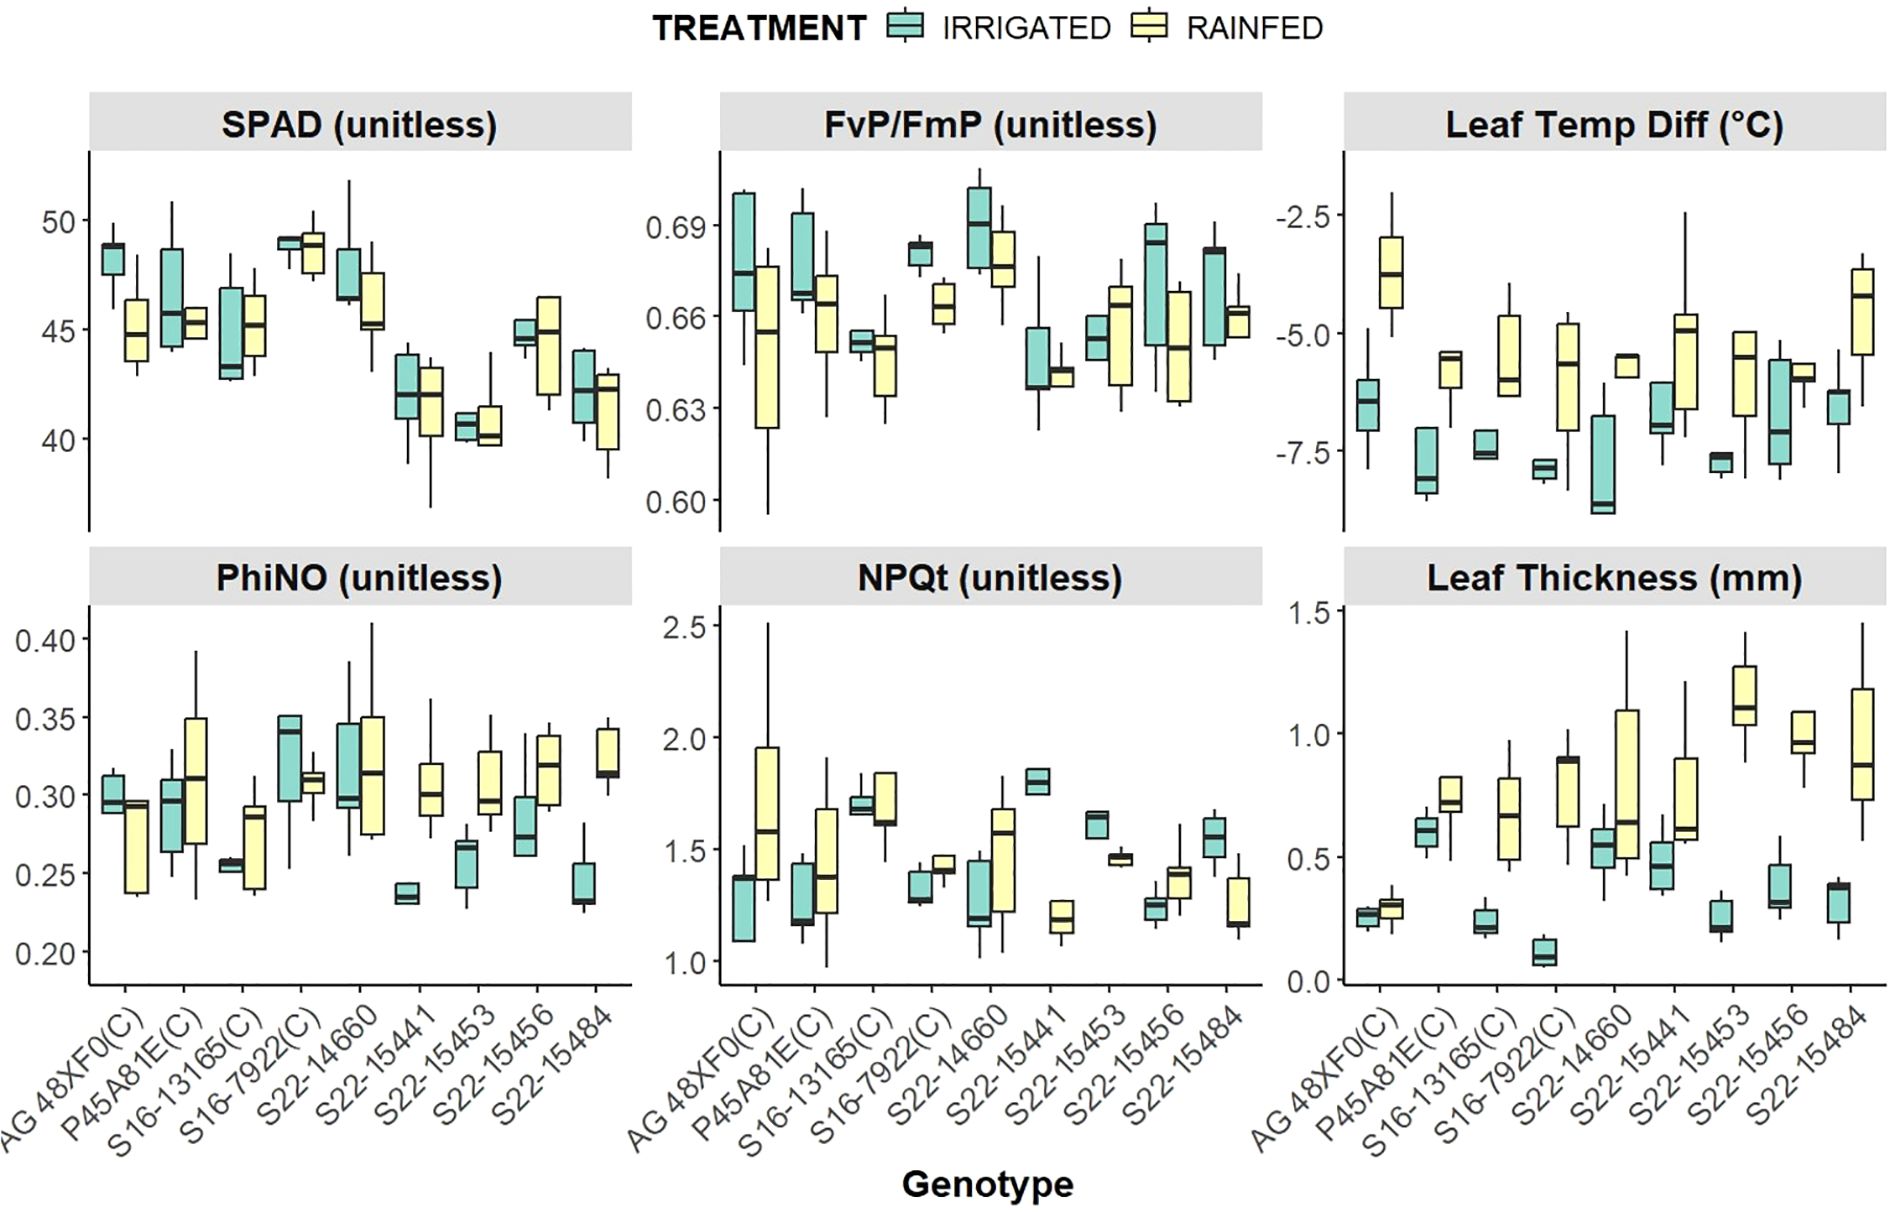
Figure 3. Genotypic Performance of Photosynthetic and Morpho-Physiological traits, across irrigated and rainfed conditions.
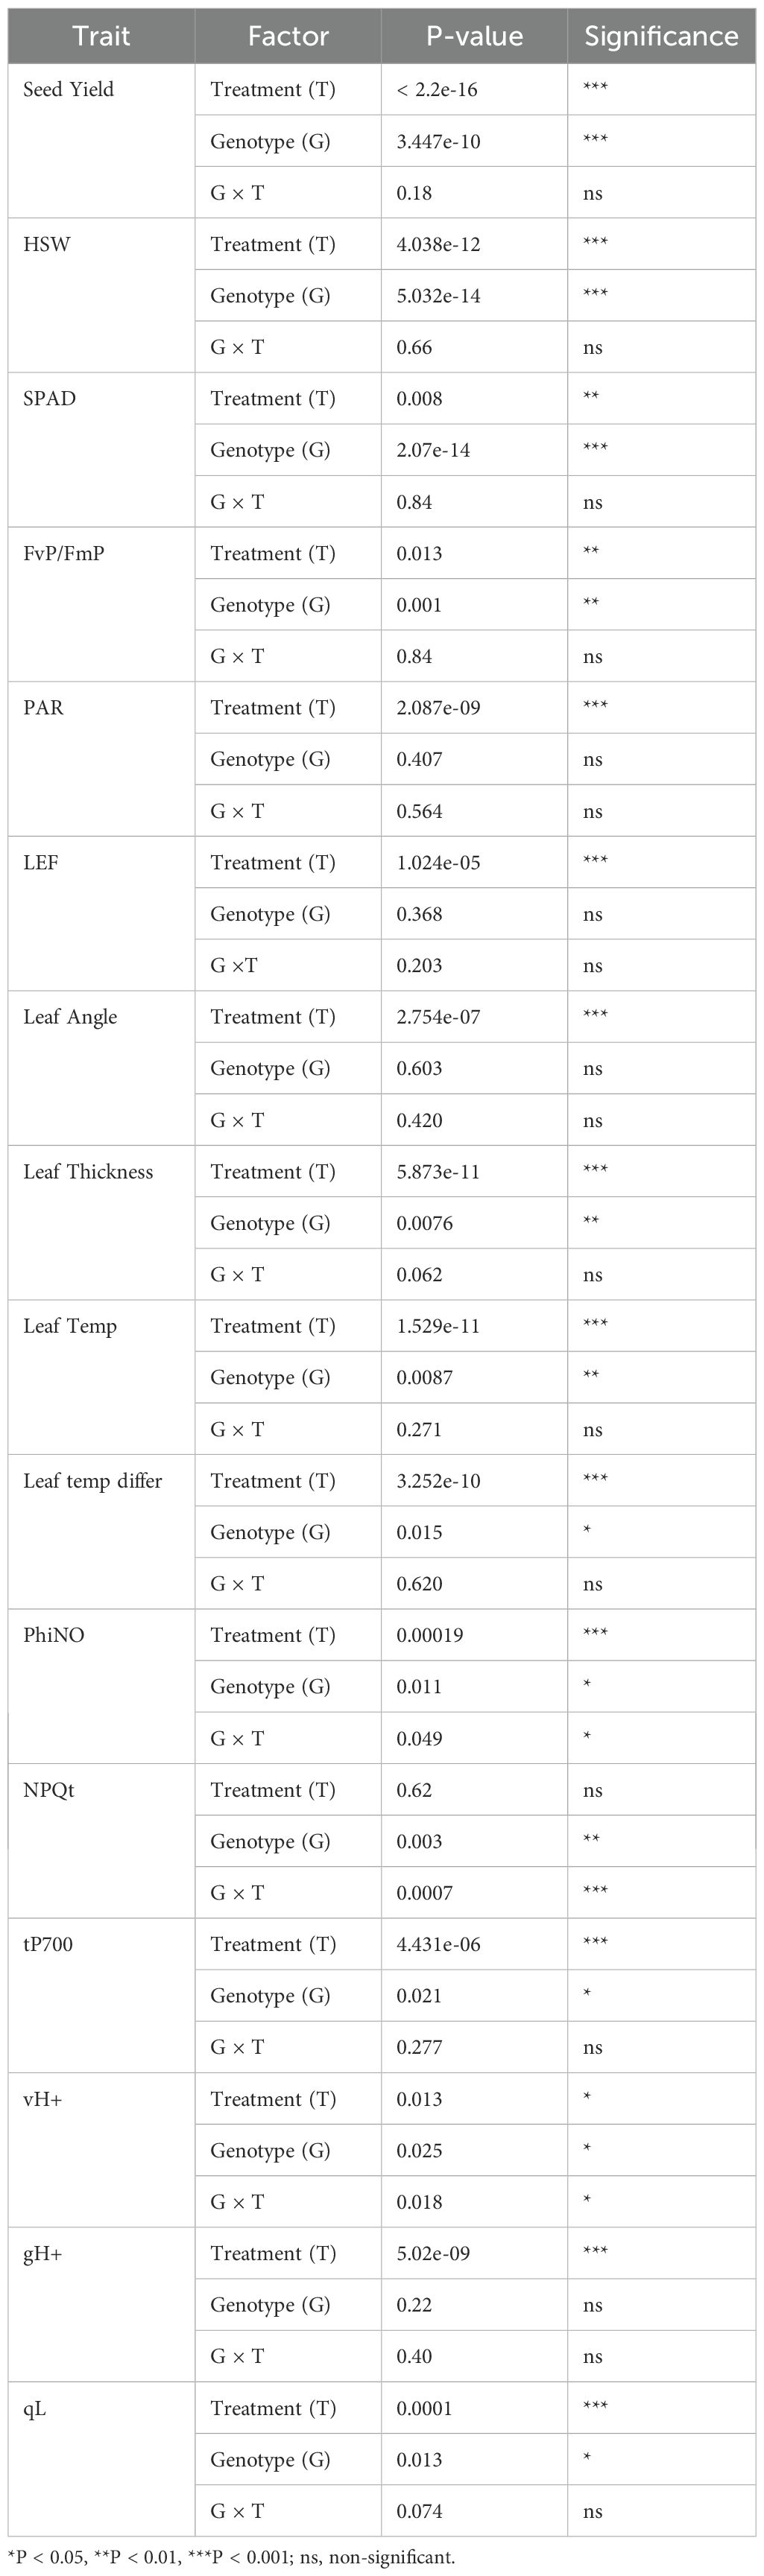
Table 2. Effects of genotype (G), treatment (T) and G×T on variability observed in seed yield and physiological traits.
Drought stress led to enhanced leaf thickness overall compared to well-watered conditions (Figure 1; Supplementary Table S2) (Aneja et al., 2025; Carrera et al., 2021). The mean difference between canopy and air temperatures (leaf temperature differential) in rainfed treatment was ~1.8°C higher than irrigated conditions (P < 0.001) (Supplementary Table S2, Table 2).
Significant variation was observed for seed yield across both treatments and among all genotypes (Figures 1, 2). In irrigated conditions, S16-7922 performed best (5171.5 kg/ha) and S22–15484 was the worst performing genotype (3913.9 kg/ha). However, under rainfed conditions, S22–14660 was the highest yielding genotypes (3725.7 kg/ha) while, S22–15441 was the lowest yielding genotype (2286.5 kg/ha). Considering the distinct responses of genotypes based on moisture availability, we deployed the Drought Performance Index (DPI) to rank test genotypes based on their overall performance. DPI was calculated by combining two stress response indicators- drought susceptibility index and drought tolerance index. The stress severity in terms of mean overall yield loss was 33%, indicating moderate drought stress. All the test genotypes showed a significant reduction in seed yield in rainfed conditions compared to irrigated conditions. The overall yield loss across genotypes ranged from 17.7% to 44.1% (Table 1; Figure 2). S22–14660 showed minimum yield reduction under drought conditions (17.7%) and competitive yield under irrigated conditions, hence achieving the highest drought performance index (DPI) of 1.49. S22–15441 suffered maximum yield loss (~44%) with the lowest DPI of 0.33. Among checks, P45A81E was most stable and had a better yield performance with a DPI of 0.85, followed closely by AG 48XF0 (0.79).
3.2 Heritabilities of morpho-physiological and yield traits across both water regimes
The seed yield consistently showed high heritability, even under drought conditions (0.88 in IR and 0.87 in RF). Relative chlorophyll content in terms of SPAD had high heritability (0.88 in IR and 0.90 in RF), which could be useful for maintaining photosynthetic machinery under stress. Among photosynthetic traits, PSII efficiency showed reduced heritability under drought conditions (0.36), compared to higher heritability under optimum water conditions (0.68) (Table 3). NPQt becomes more genetically controlled under water stress (0.51), while LEF heritability gets lowered under rainfed conditions (0.43). Among morpho-physiological traits, leaf thickness is especially interesting which showed high heritability in both IR (0.90) and RF conditions (0.76). Leaf temperature differential exhibited moderate heritability (0.47), and nearly stable across treatments. It reflects the cooling capacity of genotypes, critical for maintaining transpiration under water and heat stress. Leaf angle showed almost similar heritability (0.76-0.78) across both conditions. vH+, a biochemical parameter critical for ATP synthesis becomes highly heritable under drought (0.81), reflecting genetic divergence in energy management under stress. Heritability of non-regulated energy dissipation (PhiNO) was declined under RF conditions.
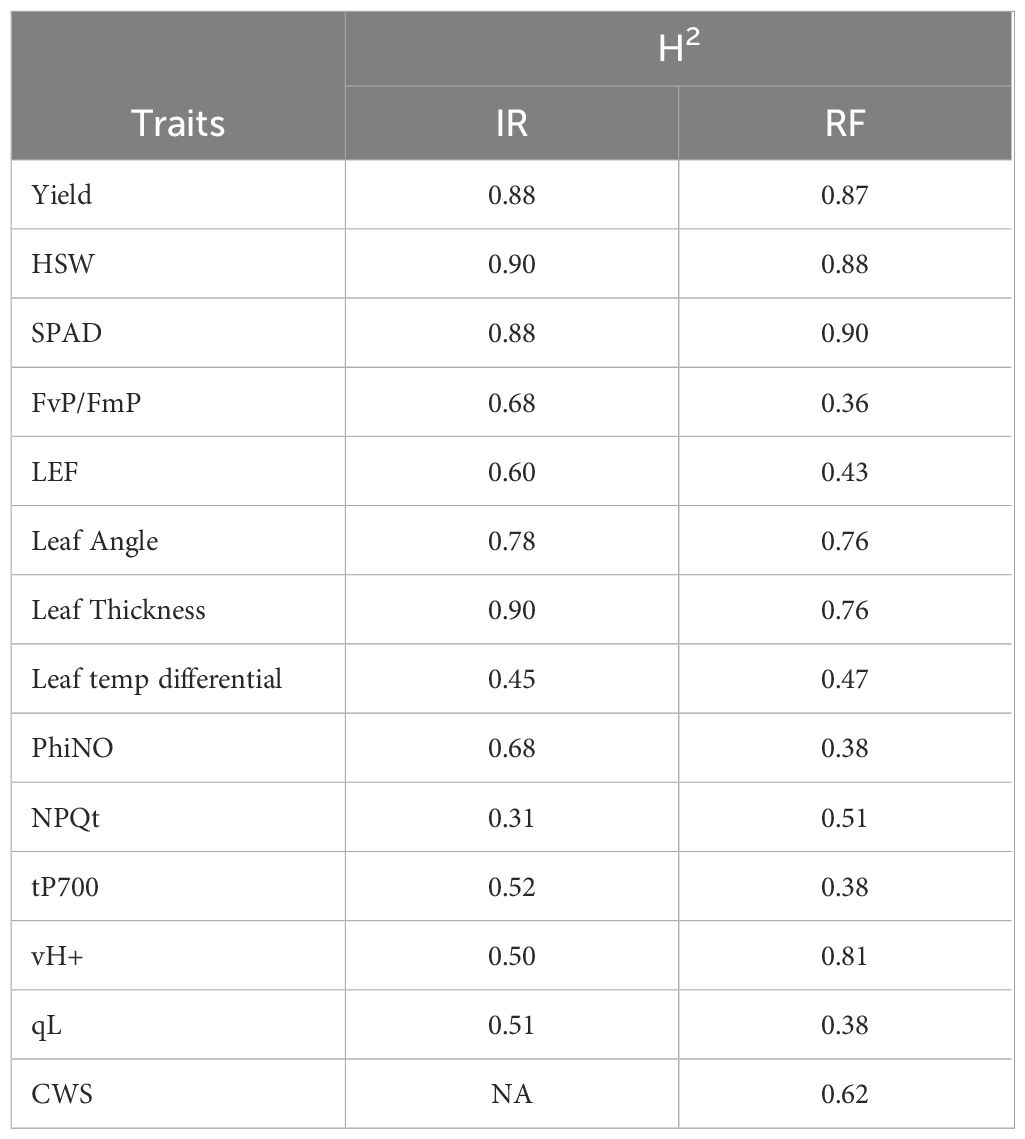
Table 3. Treatment-wise broad sense heritability (H2) for yield, photosynthetic and other morpho-physiological traits.
3.3 Relationships among morpho-physiological and yield traits in field conditions
Pearson correlation analyses were performed to understand how yield components and different physiological traits were related under irrigated and rainfed conditions. Trait correlations and coefficients varied significantly across both treatments (Supplementary Figure S1), indicating differential mean physiological responses depending upon field moisture availability. Under rainfed conditions, the correlations among photosynthetic and yield traits provided key insights into soybean responses to water limited environments. The seed yield showed significant positive correlations with SPAD (r = 0.42; P < 0.01), FvP/FmP (r = 0.34; P < 0.05) and PAR (r = 0.35; P < 0.05). A significant negative correlation with CWS (mentioned as CWS2 in Supplementary Figure S1) (r = -0.35; P < 0.005), indicates that genotypes with slower canopy wilting tend to achieve higher yields (Ye et al., 2020). SPAD, a key indicator of relative chlorophyll content and proxy for N-status was negatively correlated with soil moisture (r = -0.30), Leaf thickness (r = -0.28) and gH+ (r = -0.28). PSII efficiency (FvP/FmP) was correlated with NPQt (r = -0.49; P < 0.001), PhiNO (r = 0.32; P < 0.05), leaf temperature differential (r = -0.38; P < 0.01), qL (r = 0.38; P < 0.05) and slightly correlated with leaf thickness (r = 0.28). Leaf thickness was significantly correlated with soil moisture (r = 0.29; P < 0.05) and temperature (r = -0.31; P < 0.05), leaf temperature differential (r = -0.39; P < 0.01), NPQt (r = -0.38; P < 0.01), qL (r = -0.29; P < 0.01) and vH+ (r = 0.55; P < 0.001). Visual CWS was significantly associated with soil moisture (r = 0.55; P < 0.01); soil temperature (r = -0.39; P < 0.01); leaf temperature differential (r = -0.35; P < 0.05), leaf angle (r = -0.29; P < 0.01) and leaf thickness (r = 0.32; P < 0.05).
Under irrigated conditions, SPAD, exhibited a significant positive correlation with seed yield (r = 0.40, P < 0.05), underscoring its potential as a key trait for yield prediction under optimum water availability. Furthermore, SPAD showed significant associations with multiple photosynthetic traits including FvP/FmP (r = 0.54; P < 0.001), NPQt (r = -0.55; P < 0.001), PhiNO (r = 0.70; P < 0.001) and qL (r = -0.62; P < 0.001). Maximum photosystem II efficiency (FvP/FmP) also showed a strong negative correlation with non-photochemical quenching (r = -0.74; P < 0.001).
3.4 Multivariate trait-associations and drought adaptations
The PCA was conducted for the overall study (IR-RF combined) (Figure 4A) and for rainfed treatment individually, to get insights into key physiological and environmental traits influencing drought response in soybean breeding lines (Figure 4B). Under RF conditions, the first two principal components (PC1 and PC2) explained 62.10% of the total variation. These components captured most of the variability among traits under drought stress conditions, suggesting their importance in characterizing the differential drought responses. PC1 (37% contribution) was strongly influenced by ambient temperature (26%), soil moisture (27%) and leaf angle (~22%). These components represent environment and canopy related variability, where higher soil moisture and optimal ambient temperature help mitigate drought effects. PC2 (25.1% contribution) was primarily driven by NPQt (38.3%), FvP/FmP (28.6%) and leaf thickness (~15%). This suggests that photosynthetic energy dissipation mechanisms, quantum efficiency of PSII and leaf morphology are critical for differentiating drought tolerance under RF conditions. Contribution of PC3 (15%) can mostly be attributed to SPAD (68%), which emerged as a critical and independent contributor under drought, highlighting its genetic stability in maintaining photosynthetic ability under limited water. The strong contribution of photosynthetic parameters to PC2 underlines the need to prioritize photoprotective traits when selecting drought tolerant genotypes.
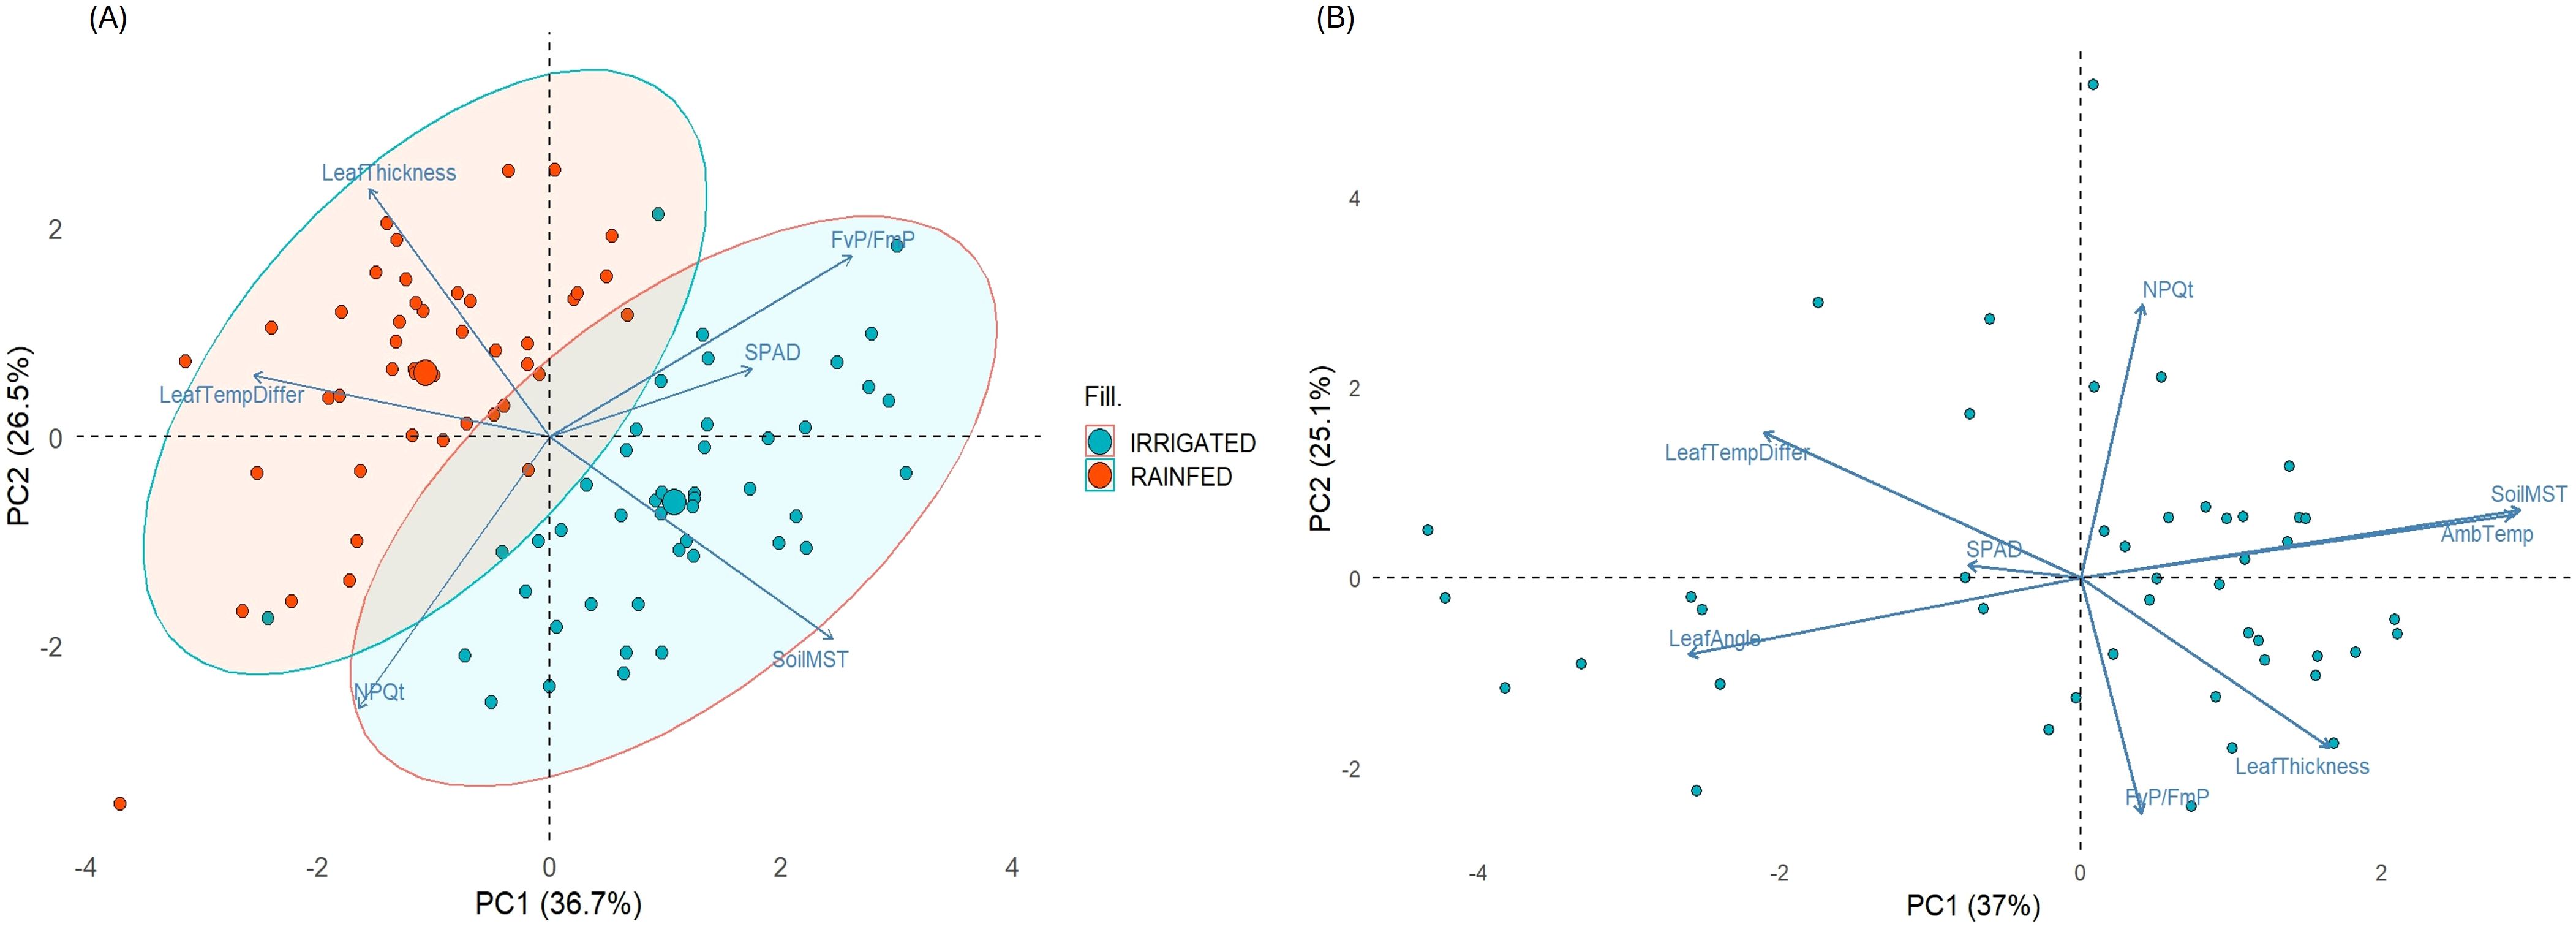
Figure 4. Principal Component analysis (PCA) biplots showing key traits contributing to variations observed (A) in the experiment, with colored eclipses separating both treatments, and (B) under rainfed conditions.
Combined PCA provided a holistic view of multiple trait relationships across both stress and non-stress environments (IR and RF). In this case, PC1 (36.7%) and PC2 (26.5%) explained 63.2% of total variation, showing substantial ability to capture significant patterns across both environments (IR and RF). In PC1, FvP/FmP (~25%), leaf temperature differential (~24%) and soil moisture (22%) were dominant, indicating that productivity and water availability remain key determinants across both treatments. NPQt (34%) and leaf thickness (28%) drove PC2, highlighting the importance of canopy architectural adjustments when variable moisture conditions were combined. Additionally, SPAD (55%) predominantly contributed to PC3, suggesting its important role in the variable environments. These patterns underscore the interplay of environmental sensing, photoprotection and morphological adaptation for drought resilience in soybean, providing actionable insights for trait-based selection strategies for breeding under water limited environments.
To elucidate the complex relationships between drought adaptive traits and the seed yield, we also conducted a path analysis using structural equation modeling (SEM) under rainfed conditions. The model demonstrated a strong fit, with a non-significant Chi-square test (P = 0.157), indicating an adequate representation of causal relationships between seed yield and environmental-physiological traits (Figure 5). Additional performance indices, including Comparative Fit Index (CFI) of 0.99, Tucker-Lewis Index (TLI) of 0.98 and standardized root mean square residual (SRMR) of 0.06, confirmed the model’s statistical robustness. The analysis highlighted that SPAD (std estimate (β) =0.303, P = 0.011), FvP/FmP (β= 0.48; P < 0.001) and NPQt (β= 0.50; P < 0.001) had significant positive effects on seed yield, while leaf temperature differential displayed a marginally negative effect (β = -0.14). These results underscore the importance of photosynthetic efficiency and canopy temperature regulation as drought adaptation strategies. For indirect relationships, SPAD was significantly influenced by soil moisture (β = -0.38; P = 0.006), leaf thickness (β = -0.42; P = 0.005), leaf temperature differential (std. estimate= -0.26; P = 0.09), and light intensity (PAR; β = 0.31, P = 0.03). NPQt was negatively associated with Leaf thickness (β = -0.43, P < 0.001), and Phi2 (β = -0.44; P < 0.001), while positively influenced by soil moisture (β = 0.23; P = 0.055). Soil moisture was a key environmental factor, strongly dependent on soil temperature (β = -1.05, P < 0.001) and soil EC (β = 1.03, P < 0.001). These results align well with findings from PCA, where SPAD, NPQt, soil characters and leaf thickness emerged as key parameters explaining most of the variation in the rainfed conditions. We additionally conducted random forest (RNF) regression analysis to explore the importance of these traits, and found that SPAD, NPQt and FvP/FmP were among top predictors of seed yield under low moisture conditions (Supplementary Figure S2).
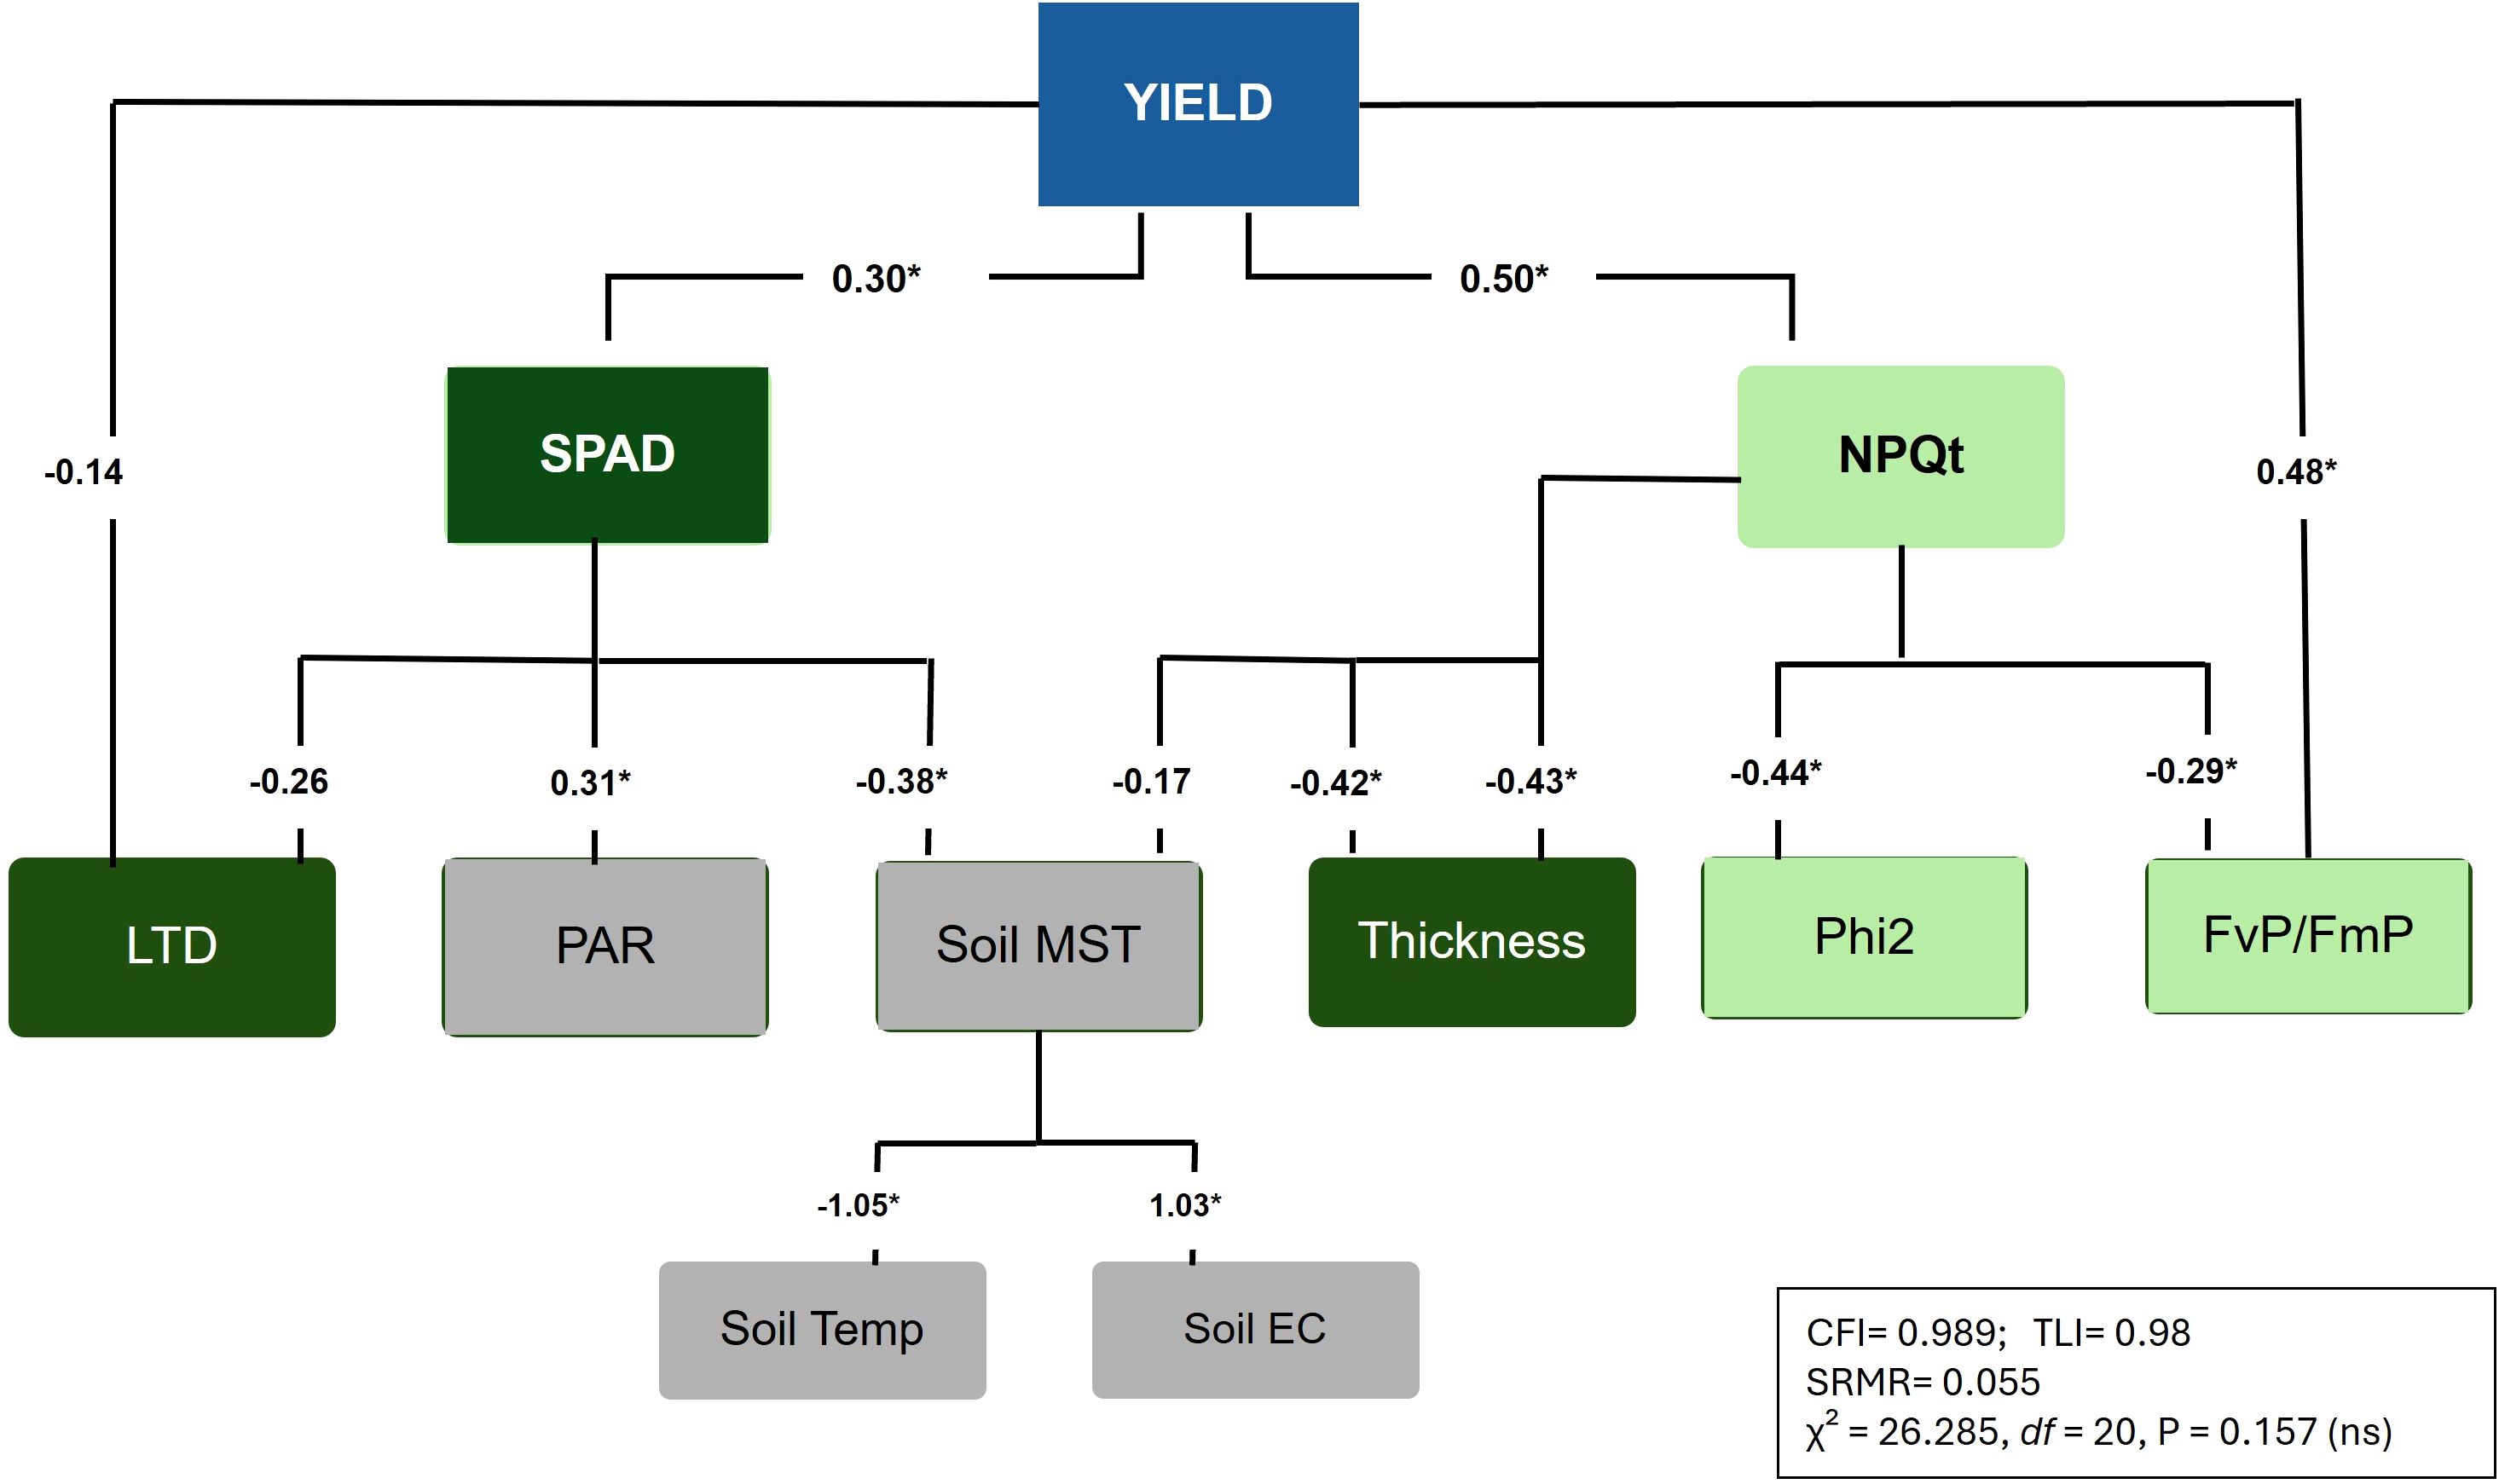
Figure 5. Structural equation model (SEM) illustrating the direct and indirect effects of morpho-physiological traits (dark green boxes), photosynthetic traits (light green boxes), and environmental parameters (grey boxes) on seed yield under drought stress conditions, with standardized path coefficients (β) and significance levels (P < 0.05) displayed by asterisks. Model fit indices (CFI, TLI, SRMR, χ², and P-value) are provided for overall model evaluation.
These findings highlight the critical role of soil properties, morpho-physiological and photosynthetic parameters in drought adaptation. While traits like NPQt and FvP/FmP showed associations with yield, we acknowledge their complex physiological nature and potential challenges in directly optimizing them through breeding. Collectively, these analyses provided insights into potential trait-based indicators of drought resilience in soybean.
3.5 Predictive modeling for seed yield under variable moisture
For developing prediction models for seed yield estimation across variable moisture conditions, two approaches- Partial least square regression (PLSR) and Random Forest (RNF), were deployed. PLSR explained approx. 79% of yield variability (R2 = 0.79) with an RMSE of 390 kg/ha and MAE was 327 kg/ha. Cross-validation (CV) was repeated 10 times to confirm the model stability via root mean squared error of prediction (RMSEP), which identified 1 latent component as optimal for the PLSR model. It balanced predictive accuracy (CV RMSEP= 510.4 kg/ha). Key traits that dominated this component included SPAD, soil P and N, soil moisture and leaf thickness. On the other hand, the RNF model showed slightly weak but decent performance (R2 = 0.74) with an RMSE of 443.9 kg/ha and MAE of 360 kg/ha. The CV for random forest was performed 10 times to ensure the model robustness (CV RMSE = 503.7 kg/ha). Overall, PLSR showed 11% more precision on unseen data compared to RNF in this experiment (Figure 6). So, in summary, PSLR outperformed RNF (R2 = 0.79 vs 0.74), but both models prioritized SPAD, soil moisture, soil nutrients (N and P) and morpho-physiological responses (PSII efficiency and leaf thickness) as robust predictors of seed yield under variable moisture conditions.
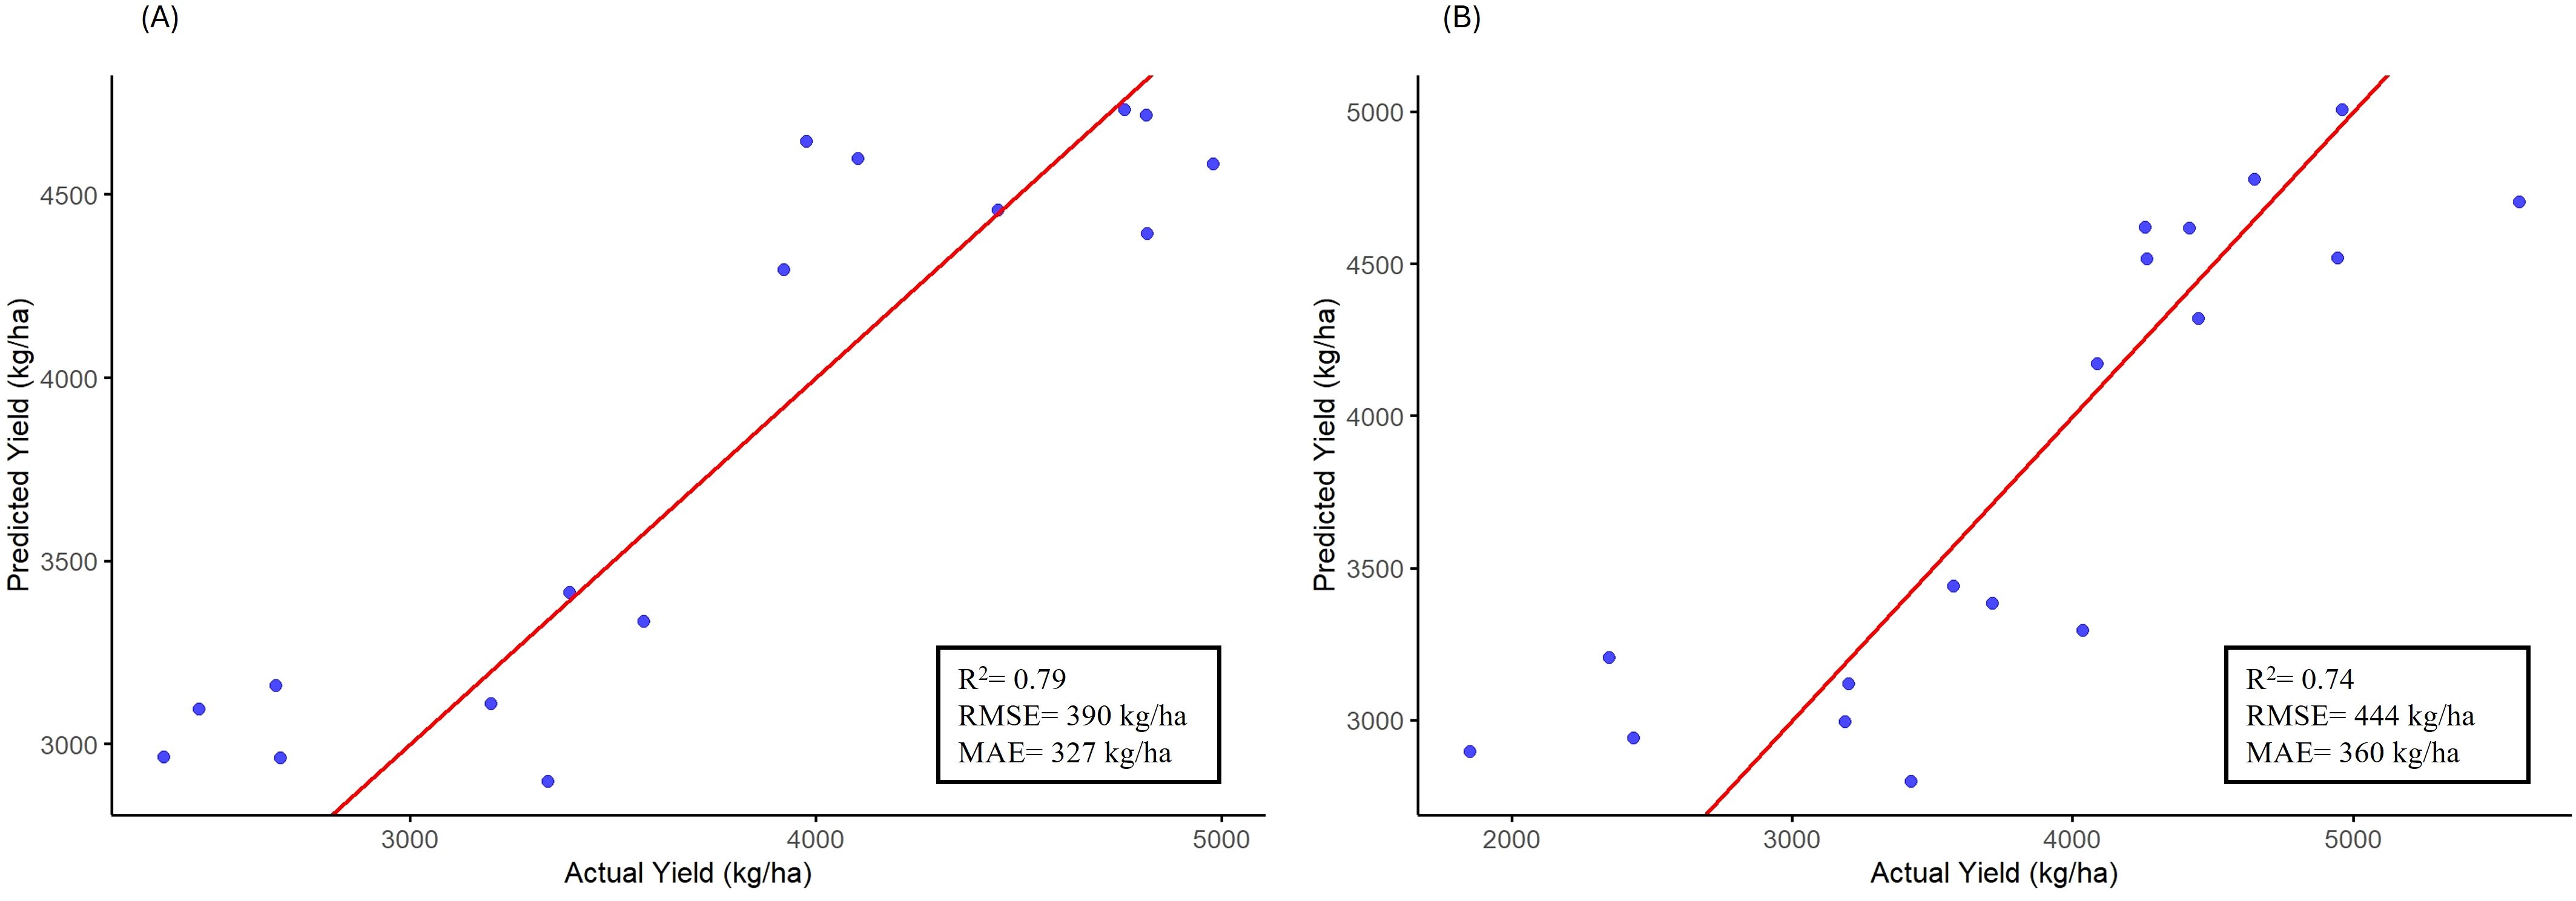
Figure 6. Scatter plots showing actual versus predicted seed yield values using the testing set (20% of total data) for (A) Partial Least Squares Regression (PLSR) and (B) Random Forest (RF) models. Performance metrics include- R², RMSE, and MAE are indicated within each panel.
4 Discussion
4.1 Moisture-induced variability in photosynthetic traits and yield under field conditions
Drought tolerance in plants is a highly complex trait and is an outcome of complicated networks of multiple genes, which influence various physiological and biochemical pathways (Ohashi et al., 2006; Tang et al., 2017; Desclaux et al., 2000; Guzzo et al., 2021). Such disruptions may be visibly reflected in agronomic performance, most importantly in the seed yield (Yan et al., 2020; Dubey et al., 2019). In this study, drought stress significantly modulated photosynthetic traits, morphological responses, and seed yield in soybean under field conditions (Table 2; Figure 1). These impacts have been demonstrated by several studies on soybean physiological and agronomic traits (Sadeghi et al., 2021; Basal et al., 2020; Fatema et al., 2023; Carrera et al., 2021). The upper canopy, responsible for ~70% of solar energy absorption (Song et al., 2013), exhibited significant genotypic variability in key morpho-physiological and photosynthetic traits including SPAD (chlorophyll content), maximum efficiency of PSII (FvP/FmP), and PSII quantum yield (Phi2). This variability highlights the opportunities to exploit genetic diversity in elite soybean germplasm for drought resilience breeding.
In our study, about 50% reduction in soil moisture (RF vs IR fields) eventually induced canopy wilting due to leaf dehydration and stomatal closure, a response widely documented in soybean (Basal et al., 2020; Fatema et al., 2023). Thus, plants have less available water for uptake under drought, resulting in the dehydration of leaf tissue. Drought induced stomatal closure can typically limit CO2 assimilation leading to reduced photosynthetic activity and carbon fixation (Flexas et al., 2006). Additionally, impairment in the electron transport, Rubisco activity and ATP synthesis also adversely affect the photosynthetic machinery and eventually plant growth and development (Fatema et al., 2023; Dubey et al., 2019). Several morpho-physiological, canopy and photosynthetic traits showed high and/or significant correlations with seed yield including SPAD, PAR and FvP/FmP, highlighting their critical role under drought stress conditions (Supplementary Figure S1). It was shown that the strength (and even direction in some cases) of relationships between photosynthesis and yield changes relied upon water availability. Drought stress also reduces cell division and end-reduplication, disrupting the photosynthetic rate by lowering chlorophyll synthesis and reducing photosynthetic enzymes activity such as Rubisco (Radwan, 2015). The seed yield relationship with SPAD was stable under both irrigated and rainfed conditions, indicating its strong potential to be proxy for drought resilience (Sadeghi et al., 2021; Basal et al., 2020). NPQt showed a low negative correlation with yield under optimum moisture, however, it exhibited a low positive correlation under drought conditions. This indicates the adaptive role of a photoprotective mechanisms in supporting resilience under moisture stress.
The seed yield was greatly affected (~18% to 44%) under low moisture conditions, however some genotypes including S22–14660 and S22–15453 showed outstanding performance under both moisture regimes (superior Drought Performance Index) among all lines. This exhibits better drought tolerance and yield performance stability of these genotypes across variable moisture conditions. These genotypes are good candidates to explore underlying genetics of morpho-physiological traits imparting field drought tolerance. Multivariate analyses i.e. PCA and SEM suggests that in addition to morpho-physiological and photosynthetic traits (SPAD, FvP/FmP and NPQt), soil characteristics (temperature, moisture) also played key roles in explaining seed yield variation and stress response, especially under drought conditions. The first two principal components clearly separate soil factors and photosynthetic performance into separate groups (Figure 4). It is possible that the highest performing genotypes under drought have deeper roots to leverage the P and N uptake despite low soil moisture in the rainfed conditions (Dubey et al., 2019; Valliyodan et al., 2017; Hansel et al., 2017). This substantial variability underscores the possibility to dissect the morpho-physiological adaptations that potentially support the yield stability under drought conditions in the field.
4.2 Morpho-physiological adaptations to drought stress in soybean
The ability to minimize seed yield or biomass loss under limited water is generally considered the optimal indicator of drought tolerance in crops (Fahad et al., 2017; Du et al., 2009; Fahad et al., 2017). Under drought stress, soybean employs different morphological and physiological adaptations to sustain its photosynthetic performance and yield (Guzzo et al., 2021; Toum et al., 2022; Dubey et al., 2019). The IR trial showed enhanced photosynthetic performance overall (FvP/FmP and SPAD). Interestingly, several canopy and morpho-physiological traits (PAR, Leaf thickness, LTD, LEF, PhiNO and NPQt) were higher under RF conditions, possibly reflecting drought-induced adaptations, aimed at enhanced protective energy dissipation, rather than enhanced light utilization. Our findings reveal genotypic variability in these mechanisms, highlighting traits with high heritability and mechanistic links to field drought tolerance. These insights are critical for breeding programs transitioning from subjective visual selection (plot-based canopy wilting) to objective, trait-based approaches. SPAD (relative chlorophyll content) remained genetically stable under both water regimes (H2 = 0.90, Table 3) and correlated strongly with yield (Supplementary Figure S1). Its direct role in driving yield under drought stress was also demonstrated by SEM (β = 0.30), enabling it as a robust marker for selection, bypassing subjective canopy wilting assessments (Guzzo et al., 2021; Toum et al., 2022). Another key photosynthetic trait- NPQt, exhibited increased genetic control under drought (H2 = 0.51), highlighting G×E interactions and prioritization of photoprotection mechanisms in stress tolerant genotypes. NPQt also showed a significant contribution to yield under drought (SEM: β = 0.50), highlighting its photoprotective role to dissipate excess light energy to protect the photosynthetic apparatus, especially under limited moisture. Genotypes like S22–15453 and S22–14660 with high NPQt also maintained high photosynthetic efficiency (FvP/FmP), potentially mitigating ROS damage due to stress (Tang et al., 2017). It indicates that these traits have potential for improving selection for drought tolerance in soybean. Moreover, LEF heritability gets reduced under RF conditions (0.43), possibly due to increased environmental disruption (water availability, available light), overshadowing genetic differences. Similarly, the heritability of PhiNO declines under RF conditions, suggesting that environmental factors dominated this alternative photoprotection approach.
Leaf thickness is crucial for plant functioning and is linked to strategies for resource acquisition and utilization (Jumrani et al., 2017). In general, it was found to be elevated under drought conditions compared to irrigated conditions (Figure 1; Supplementary Table S2). However, genotypes with higher drought resilience (higher Performance index) had thinner leaves compared to low yielding genotypes, which was already reported by Toum et al. (2022). Although this trait is strongly related to transpiration (Giuliani et al., 2013), there is limited knowledge about links between leaf thickness and its function under watered/stresses conditions (Afzal et al., 2017). It suggests a possible tradeoff i.e. thicker leaves may enhance water retention but reduce photosynthetic by increasing diffusion resistance for CO2 (Toum et al., 2022; Takai et al., 2013), as reflected in their negative association in SEM (β = −0.40). The high heritability of leaf thickness under both IR and RF conditions highlights its potential for effective selection. However, this trade-off suggests that selecting for optimal leaf thickness is crucial for balancing water conservation and photosynthetic performance in the soybean. Interestingly, despite significantly higher leaf thickness under drought, SPAD was just marginally elevated. It suggests that morphological changes may not always translate to functional chlorophyll status under stress. This could be attributed to internal leaf anatomy or pigment regulation, which needs further investigation.
In our study, soybean plants exhibited higher leaf angles under irrigated conditions, which was consistent with prior observations of canopy architecture optimization in well-watered conditions (Nagasuga et al., 2013; Rosa et al., 1991). Under drought, however, leaf angles decreased significantly (P < 0.001), correlating positively with yield. This reduction likely reflects genetic adaptation of genotypes transitioning to horizontal leaf angles under drought, minimizing transpirational water loss during critical flowering stages (Nagasuga et al., 2013). Also, it may exhibit passive responses (drought induced wilting or loss of turgor pressure), reducing the angle in rainfed conditions (Dubey et al., 2019). This midday leaf movement, usually observed under low moisture conditions, helps reducing leaf temperature and transpiration. Although no significant genotypic differences were observed for leaf angle in our lines, the response was consistent and positively correlated with yield under drought. This response suggests that environment induced variation in leaf angle could be contributing to stress adaptation by reflecting broader physiological adjustments e.g. stomatal conductivity, light use efficiency and NPQt. Some studies have reported the opposite trend (Yavas et al., 2024), which could possibly be due to genotype specific responses or differences in stress severity. So, given its high environmental sensitivity and limited genetic variation in this study, leaf angle alone may not be a robust selection trait in early screening unless measured across multiple timepoints or environments. However, including it as a complementary trait, could inform future breeding strategies targeting canopy architecture and drought resilience.
Leaf temp differential (LTD), defined as difference between canopy and surrounding air temperature, serves as reliable proxy for stomatal conductance and transpiration rate under drought stress (Manavalan and Nguyen, 2017). In our study, elevated LTD under drought stress reflected reduced transpiration due to stomatal closure- a water conservation strategy, that prioritizes hydration over CO2 uptake (Chowdhury et al., 2018). This response indirectly affected seed yield through its negative association with SPAD (SEM: β = -0.26), suggesting that sustained chlorophyll retention under stress mitigates heat-induced photosynthetic decline. LTD exhibited moderate but stable heritability (~0.47) across moisture regimes, reinforcing its utility as a selection target for drought resilience. Notably, the most drought tolerant genotypes (S22–15453 and S22-14660) maintained slightly cooler canopies (lower relative LTD) compared to most susceptible genotypes. This indicated optimizing transpiration that balances water conservation with evaporative cooling, a promising marker for drought adaptation (Fletcher et al., 2021).
FvP/FmP (maximum quantum efficiency of PSII) exhibited low heritability under drought stress (H2 = 0.36) (Table 3), indicating strong environmental modulation of PSII efficiency under stress. However, its direct positive impact on yield (SEM: β = 0.48) and high heritability under well-watered conditions (H2 = 0.68) underscores its potential as a stress-specific photosynthetic marker (Figures 4, 5) for germplasm evaluation (Ouma et al., 2024; Guo et al., 2022; Rico-Cambron et al., 2023). In general, genotypes with higher performance index under drought conditions, showed enhanced photosynthetic performance (FvP/FmP and SPAD), which could be an adaptive strategy to develop more robust root system to more efficiently absorb limited available moisture (Wu and Cosgrove, 2000; Dubey et al., 2019; Guzzo et al., 2021).
Multivariate analyses suggest soil moisture, morpho-physiological traits and nutrient availability were key yield determinants, emphasizing root plasticity in drought resilience (Figures 4, 5; Valliyodan et al., 2017). SEM showed the direct and indirect effects of several photosynthetic and morpho-physiological traits on yield, under drought stress conditions (Figure 5). It pointed out that SPAD, FvP/FmP, and NPQt differential are key drivers having direct impact on yield. LTD has both direct (low) and indirect (high) impacts on yield under drought. Other parameters like leaf thickness, PAR, Phi2, soil moisture, temperature and EC have indirect but significant impact on soybean yield under low moisture conditions. As such, morpho-physiologically important traits identified here- SPAD, NPQt, FvP/FmP and leaf thickness, which had substantial heritability, provide a foundation for predictive breeding strategies. Therefore, this holistic understanding can identify trait combinations that synergistically enhance drought tolerance. Such an objective and comprehensive approach can be valuable in making selection for drought resilience more accurate and robust. Moreover, by integrating these markers with environmental and soil parameters, breeders can predict the performance of elite germplasm under variable moisture conditions accelerating the breeding pipeline for improved drought tolerance.
4.3 Implications for drought tolerance breeding and predictive approaches
As we already pointed out that stable traits showing high heritability and correlation with yield in the field conditions can be useful selection markers for improved drought tolerance such as SPAD. There are also some stress specific markers such as NPQt, leaf thickness and FvP/FmP which can be useful indicators of tolerance under low moisture conditions. These objective markers and traits can be more informative and robust compared to conventional wilting scoring. To further determine the worth of these traits in determining the yield performance under variable moisture conditions, we explored two predictive models- PLSR and RNF. As environmental factors play key role in determining the genotypic performance under field conditions, both models prioritize soil moisture, soil N and P as major predictors of yield (Hansel et al., 2017). PLSR outperformed RNF by 11% higher precisions (in terms of RMSE) for yield prediction. Similar superior performance of PLSR over RNF for yield prediction has been observed by other studies (Xu et al., 2024; Mao et al., 2024). Both models were able to explain substantial yield variance in our testing set, with PLSR (R2 = 0.79) outperforming RNF by a 5% higher R2. While our models explained about 75-80% of the yield variation, it is important to acknowledge that this study was conducted over a single year. Therefore, results should be interpreted in context of specific environmental conditions during that season (soil nutrient levels, temporal weather variability). Validation of these predictive relationships across multiple environments and/or years will be critical for ensuring broader applicability. However, the study still shows promising insights on how the combination of photosynthetic, morpho-physiological and environmental traits during early reproductive stage can be leveraged to predict soybean yield in the target drought screening environments. Among morpho-physiological traits, SPAD emerged as a primary predictor of seed yield in this study, along with higher heritability (H2 = 0.90).
Apart from SPAD, PSLR preferred leaf thickness, leaf temperature differential and FvP/FmP. On the other hand, RNF preferred SPAD and leaf thickness as important predictors. The association of these identified morpho-physiological traits with yield can be validated by evaluating diverse germplasm under multi-environmental and/or multi-year trials. These findings emphasize the value of combining physiological insights with environmental and modeling data for targeting drought resilience. Incorporating both photosynthetic and morpho-physiological traits has potential to enhance the selection efficiency, especially under drought stress. While predictive models identified key markers, their utility hinges on balancing accuracy, cost and scalability. Once validated, these traits can be integrated with genomic tools to accelerate drought resilience breeding. The identification of robust morpho-physiological markers is critical for advancing drought tolerance breeding in soybean (Nadeem et al., 2017).
However, successful integration into breeding programs require validation of criteria such as accuracy in predicting yield stability, feasibility (cost effectiveness and non-destructive nature) and strength of association with drought resilience. In this study, we evaluated photosynthetic (FvP/FmP, NPQt) and morpho-physiological (SPAD, leaf thickness, angle, LTD) traits under both irrigated and rainfed conditions, to prioritize those traits that minimize yield loss under drought, balance precision with practicality, and to explain >70% yield variability in predictive models. High throughput phenotyping such as aerial imaging (RGB and multispectral) can play an important role in screening breeding germplasm for precise classification of drought responses, facilitating timely interventions and selection decisions (Jones et al., 2024). Furthermore, these promising morpho-physiological traits can be integrated with genomic data using quantitative genetics approaches (GWAS, Genomic selection, QTL mapping), which would be useful for pyramiding favorable alleles for drought resilience in soybean (Valliyodan et al., 2017; Tang et al., 2024).
5 Conclusion
This study highlights the pivotal role of photosynthetic traits and morpho-physiological adaptations in the field conditions to confer drought resilience in soybean. We identified SPAD, NPQt and FvP/FmP as critical morpho-physiological and photosynthetic markers for drought resilience in soybean, with substantial heritability and mechanistic relevance for better yield stability under drought. Consistency of SPAD across moisture regimes and NPQt’s photoprotective role under stress provide actionable targets for breeding. Morphological adaptations (e.g. optimized leaf angle and reduced leaf thickness) balance water conservation and photosynthesis. Key traits, including SPAD, NPQt, FvP/FmP, and leaf thickness, showed significant correlations with seed yield under drought conditions, underscoring their potential as selection markers. Moderate to high heritability of these traits further imply their multi-year validation and supports their utility in breeding programs aimed at enhancing drought tolerance. Genotypes such as S22–14660 and S22–15453 exhibited superior physiological performance under drought, maintaining high yield stability across variable moisture conditions, offering potential donors for these traits. By coupling subjective wilting scores with objective heritable markers, this framework has potential to enhance selection accuracy and scalability, addressing climatic challenges in soybean production. As this study was conducted over a single year, we emphasize that these findings are specific to environmental conditions of the growing season. It is important to integrate photosynthetic and morpho-physiological traits with environmental data to develop robust predictive models for drought resilience breeding in soybean. Future work should aim to validate these markers in multi-environmental and multi-year trials. Integration with high-throughput field based aerial imaging and genomic tools could accelerate drought resilience soybean breeding.
Data availability statement
The original contributions presented in the study are included in the article/Supplementary Material. Further inquiries can be directed to the corresponding author.
Author contributions
HS-B: Conceptualization, Data curation, Formal Analysis, Investigation, Methodology, Validation, Visualization, Writing – original draft, Writing – review & editing, Software. FR: Conceptualization, Investigation, Methodology, Project administration, Supervision, Writing – review & editing, Formal Analysis. CA: Writing – review & editing. MO: Writing – review & editing. RZ: Supervision, Writing – review & editing. JA: Writing – review & editing. GS: Funding acquisition, Project administration, Resources, Supervision, Visualization, Writing – review & editing. FL: Conceptualization, Funding acquisition, Project administration, Resources, Supervision, Writing – review & editing.
Funding
The author(s) declare that financial support was received for the research and/or publication of this article. We would also like to acknowledge the generous funding provided by the United Soybean Board (USB) grant # 59-6070-5-010 and the North Central Soybean Research Program (NCSRP) grant # 461896-19228.
Acknowledgments
We would like to thank all individuals in the MU-FDREEC Soybean Breeding and Genetics team involved in the planting, management, and harvesting of our research fields. We are also grateful to Dr. Jacob Washburn, USDA-ARS for his valuable feedback and proofreading the manuscript.
Conflict of interest
The authors declare that the research was conducted in the absence of any commercial or financial relationships that could be construed as a potential conflict of interest.
Generative AI statement
The author(s) declare that no Generative AI was used in the creation of this manuscript.
Publisher’s note
All claims expressed in this article are solely those of the authors and do not necessarily represent those of their affiliated organizations, or those of the publisher, the editors and the reviewers. Any product that may be evaluated in this article, or claim that may be made by its manufacturer, is not guaranteed or endorsed by the publisher.
Supplementary material
The Supplementary Material for this article can be found online at: https://www.frontiersin.org/articles/10.3389/fphgy.2025.1591146/full#supplementary-material
Abbreviations
cB, Centibar; CFI, Comparative Fit Index; CWS, canopy wilting score, CV, Cross Validation; DPI, Drought Performance Index; EC, Electrical Conductivity; HSW, Hundred Seed Weight; IR, Irrigated; FvP/FmP, Maximum efficiency of PSII; GWAS, Genome wide Association Study; gH+, proton conductivity; H2, Broad-sense heritability; LEF, Linear electron flow; LTD, Leaf Temperature Differential; MAE, Mean Absolute Error; MG, Maturity Group; NPQt, Non-photochemical quenching; PAR, Photosynthetically active radiation-light intensity; PCA, Principal Component Analysis; PhiNO, quantum yield of non-regulated NPQ; Phi2, PSII quantum yield; PLSR, Partial Least Square Regression, QTL, Quantitative Trait Loci; RCBD, Randomized Complete Block Design; RF, Rainfed; RGB, Red Green Blue; RMSE, Root Mean Square Error; RNF, Random Forest; SEM, Structural Equation Modeling; SPAD, Soil Plant Analysis Development; SRMR, Standardized Root Mean Square Residual; TLI, Tucker-Lewis Index; vH+, proton flux.
References
Afzal A., Duiker S. W., Watson J. E., and Luthe D. (2017). Leaf thickness and electrical capacitance as measures of plant water status. Trans. ASABE 60, 337–346. doi: 10.13031/trans.12083
Aneja P., Sanyal R., and Ranjan A. (2025). Leaf growth in third dimension: a perspective of leaf thickness from genetic regulation to ecophysiology. New Phytol. 245, 989–999. doi: 10.1111/nph.20246
Atkinson N. J. and Urwin P. E. (2012). The interaction of plant biotic and abiotic stresses: from genes to the field. J. Exp. Bot. 63, 3523–3543. doi: 10.1093/jxb/ers100
Basal O., Szabó A., and Veres S. (2020). Physiology of soybean as affected by PEG-induced drought stress. Curr. Plant Biol. 22, 100135. doi: 10.1016/j.cpb.2020.100135
Bates D., Mächler M., Bolker B., and Walker S. (2015). Fitting linear mixed-effects models using lme4. J. Stat. Software 67, 1–48. doi: 10.18637/jss.v067.i01
Brown E. A., Caviness C. E., and Brown D. A. (1985). Response of selected soybean cultivars to soil moisture deficit. Agron. J. 77, 274–278. doi: 10.2134/agronj1985.00021962007700020023x
Carrera C. S., Solís S. M., Ferrucci M. S., Vega C. C. R., Galati B. G., Ergo V., et al. (2021). Leaf structure and ultrastructure changes induced by heat stress and drought during seed filling in field-grown soybean and their relationship with grain yield. An. Acad. Bras. Cienc. 93, e20191388. doi: 10.1590/0001-3765202120191388
Chaves M. M., Flexas J., and Pinheiro C. (2009). Photosynthesis under drought and salt stress: regulation mechanisms from whole plant to cell. Ann. Bot. 103, 551–560. doi: 10.1093/aob/mcn125
Chowdhury J. A., Karim M. A., Khaliq Q. A., Ahmed A. U., and Mondol A. M. (2018). Effect of drought stress on water relation traits of four soybean genotypes. SAARC J. Agric. 15, 163–175. doi: 10.3329/sja.v15i2.35148
de Mendiburu F. (2023). agricolae: Statistical Procedures for Agricultural Research (R package version 1.3-7). Available online at: https://CRAN.R-project.org/package=agricolae (Accessed January 15, 2025).
Desclaux D., Huynh T. T., and Roumet P. (2000). Identification of soybean plant characteristics that indicate the timing of drought stress. Crop Sci. 40, 716–722. doi: 10.2135/cropsci2000.403716x
Dijk V. M., Morley T., Rau M. L., and Saghai Y. (2021). A meta-analysis of projected global food demand and population at risk of hunger for the period 2010–2050. Nat. Food 27, 494–501. doi 10.1038/s43016-021-00322-9
Du W., Yu D., and Fu S. (2009). Detection of quantitative trait loci for yield and drought tolerance traits in soybean using a recombinant inbred line population. J. Integr. Plant Biol. 51, 868–878. doi: 10.1111/j.1744-7909.2009.00855.x
Dubey A., Kumar A., Abd_Allah E. F., Hashem A., and Khan M. L. (2019). Growing more with less: Breeding and developing drought resilient soybean to improve food security. Ecol. Indic. 105, 425–437. doi: 10.1016/j.ecolind.2018.03.003
Fahad S., Bajwa A. A., Nazir U., Anjum S. A., Farooq A., Zohaib A., et al. (2017). Crop production under drought and heat stress: Plant responses and management options. Front. Plant Sci. 8. doi: 10.3389/fpls.2017.01147
Fang X. W., Turner N. C., Yan G. J., Li F. M., and Siddique K. H. M. (2010). Flower numbers, pod production, pollen viability, and pistil function are reduced and flower and pod abortion increased in chickpea (Cicer arietinum L.) under terminal drought. J. Exp. Bot. 61, 335–345. doi: 10.1093/jxb/erp307
Fatema M. K., Mamun M. A. A., Sarker U., Hossain M. S., Mia M. A. B., Roychowdhury R., et al. (2023). Assessing morpho-physiological and biochemical markers of soybean for drought tolerance potential. Sustainability 15, 1427. doi: 10.3390/su15021427
Fehr W. R. (1993). “Principles of Cultivar Development,” in Theory and Techniques, vol. 1. (Macmillian, New York, NY).
Fernandez G. C. J. (1992). “Effective selection criteria for assessing stress tolerance,” in Adaptation of Vegetables and Other Food Crops to Temperature and Water Stress. Ed. Kuo C. G. (AVRDC Publication, Tainan), 257–270.
Fischer R. A. and Maurer R. (1978). Drought resistance in spring wheat cultivars. I. Grain yield responses. Aust. J. Agric. Res. 29, 897–912. doi: 10.1071/AR9780897
Fletcher L. R. (2021). Evolution of Drought Tolerance within and across Species (Los Angeles, CA: University of California).
Flexas J., Bota J., Galmés J., Medrano H., and Ribas-Carbó M. (2006). Keeping a positive carbon balance under adverse conditions: Responses of photosynthesis and respiration to water stress. Physiol. Plant 127, 343–352. doi: 10.1111/j.1399-3054.2006.00621.x
Frederick J. R., Camp C. R., and Bauer P. J. (2001). Drought-stress effects on branch and mainstem seed yield and yield components of determinate soybean. Crop Sci. 41, 759–763. doi: 10.2135/cropsci2001.413759x
Fried H. G., Narayanan S., and Fallen B. (2019). Evaluation of soybean [Glycine max (L.) Merr.] genotypes for yield, water use efficiency, and root traits. PLoS ONE 14, e0212700. doi: 10.1371/journal.pone.0212700
Gilbert M. E., Zwieniecki M. A., and Holbrook N. M. (2011). Independent variation in photosynthetic capacity and stomatal conductance leads to differences in intrinsic water use efficiency in 11 soybean genotypes before and during mild drought. J. Exp. Bot. 62, 2875–2887. doi: 10.1093/jxb/err461
Giuliani R., Koteyeva N., Voznesenskaya E., Evans M. A., Cousins A. B., and Edwards G. E. (2013). Coordination of leaf photosynthesis, transpiration, and structural traits in rice and wild relatives (genus Oryza). Plant Physiol. 162, 1632–1651. doi: 10.1104/pp.113.217497
Graham P. H. and Vance C. P. (2003). Legumes: importance and constraints to greater use. Plant Physiol. 1313, 872–877. doi 10.1104/pp.017004
Guo C., Liu L., Sun H., Wang N., Zhang K., Zhang Y., et al. (2022). Predicting Fv/Fm and evaluating cotton drought tolerance using hyperspectral and 1D-CNN. Front. Plant Sci. 13. doi: 10.3389/fpls.2022.1007150
Guzzo M. C., Costamagna C., Salloum M. S., Rotundo J. L., Monteoliva M. I., and Luna C. M. (2021). Morpho-physiological traits associated with drought responses in soybean. Crop Sci. 61, 672–688. doi: 10.1002/csc2.20314
Hansel F. D., Amado T. J. C., Ruiz Diaz D. A., Rosso L. H. M., Nicoloso F. T., and Schorr M. (2017). Phosphorus fertilizer placement and tillage affect soybean root growth and drought tolerance. Agron. J. 109, 2936–2944. doi: 10.2134/agronj2017.04.0202
He J., Du Y., Wang T., Turner N. C., and Li F. M. (2017a). Conserved water use improves the yield performance of soybean (Glycine max (L.) Merr.) under drought. Agric. Water Manage. 179, 236–245. doi: 10.1016/j.agwat.2016.07.014
He J., Jin Y., Du Y. L., Wang T., Turner N. C., Siddique K. H. M., et al. (2017b). Genotypic variation in yield, yield components, root morphology and architecture, in soybean in relation to water and phosphorus supply. Front. Plant Sci. 8. doi: 10.3389/fpls.2017.01499
Hossain M. M., Liu X., Qi X., Lam H. M., and Zhang J. (2014). Differences between soybean genotypes in physiological response to sequential soil drying and rewetting. Crop J. 2, 366–380. doi: 10.1016/j.cj.2014.08.001
Jones S. E., Ayanlade T. T., Fallen B., Jubery T. Z., Singh A., Ganapathy Subramanian B., et al. (2024). Multi-sensor and multi-temporal high-throughput phenotyping for monitoring and early detection of water-limiting stress in soybean. Plant Phenome J. 7, e70009. doi: 10.1002/ppj2.70009
Jumrani K., Bhatia V. S., and Pandey G. P. (2017). Impact of elevated temperatures on specific leaf weight, stomatal density, photosynthesis and chlorophyll fluorescence in soybean. Photosynth. Res. 131, 333–350. doi: 10.1007/s11120-016-0326-y
Kato Y., Kamoshita A., and Yamagishi J. (2008). Preflowering abortion reduces spikelet number in upland rice (Oryza sativa L.) under water stress. Crop Sci. 48, 2389–2395. doi: 10.2135/cropsci2007.11.062
Koester R. P., Skoneczka J. A., Cary T. R., Diers B. W., and Ainsworth E. A. (2014). Historical gains in soybean (Glycine max Merr.) seed yield are driven by linear increases in light interception, energy conversion, and partitioning efficiencies. J. Exp. Bot. 65, 3311–3321. doi: 10.1093/jxb/eru187
Kuhlgert S., Austic G., Zegarac R., Osei-Bonsu I., Hoh D., Chilvers M. I., et al. (2016). MultispeQ Beta: A tool for large-scale plant phenotyping connected to the open PhotosynQ network. R. Soc Open Sci. 3, 160592. doi: 10.1098/rsos.160592
Lafitte H. R., Price A. H., and Courtois B. (2004). Yield response to water deficit in an upland rice mapping population: associations among traits and genetic markers. Theor. Appl. Genet. 109, 1237–1246. doi: 10.1007/s00122-004-1731-8
Lê S., Josse J., and Husson F. (2008). FactoMineR: A package for multivariate analysis. J. Stat. Softw. 25, 1–18. doi: 10.18637/jss.v025.i01
Liaw A. and Wiener M. (2002). Classification and regression by random forest. R News 2, 18–22. Available online at: https://CRAN.R-project.org/doc/Rnews/ (Accessed December 18, 2024).
Manavalan L. P., Guttikonda S. K., Tran L. S. P., and Nguyen H. T. (2009). Physiological and molecular approaches to improve drought resistance in soybean. Plant Cell Physiol. 50, 1260–1276. doi: 10.1093/pcp/pcp082
Manavalan L. P. and Nguyen H. T. (2017). “Drought tolerance in crops: Physiology to genomics,” in Plant Stress Physiology. Ed. Shabala S. (CABI, Wallingford), 1–23.
Mao B., Cheng Q., and Chen L. (2024). Multi-random ensemble on partial least squares regression to predict wheat yield and its losses across water and nitrogen stress with hyperspectral remote sensing. Comput. Electron. Agric. 222, 109046. doi: 10.1016/j.compag.2024.109046
Martignone G. M. B., Ghosh B., Papadas D., and Behrendt K. (2023). The rise of soybean in international commodity markets: A quantile investigation. Heliyon 10, e34669. doi: 10.1016/j.heliyon.2023.e34669
Mevik B.-H. and Wehrens R. (2007). The pls package: Principal component and partial least squares regression in R. J. Stat. Software 18, 1–23. doi: 10.18637/jss.v018.i02
Nagasuga K., Uchida S., Kaji H., and Kubota F. (2013). Water condition controls inclination angles of leaflets and petioles of soybean (Glycine max L.). Environ. Control Biol. 51, 79–84. doi: 10.2525/ecb.51.79
Ohashi Y., Nakayama N., Saneoka H., and Fujita K. (2006). Effects of drought stress on photosynthetic gas exchange, chlorophyll fluorescence and stem diameter of soybean plants. Biol. Plant 50, 138–141. doi: 10.1007/s10535-005-0089-3
Ouma B. O., Mburu K., Kirui G. K., Muge E. K., and Nyaboga E. N. (2024). Integrating morpho-physiological, biochemical, and molecular genotyping for selection of drought-tolerant pigeon pea (Cajanus cajan L.) genotypes at seedling stage. Plants 13, 3228. doi: 10.3390/plants13223228
Parmley K. A., Higgins R. H., Ganapathysubramanian B., Sarkar S., Singh A., and Singh A. K. (2019). Machine learning approach for prescriptive plant breeding. Sci. Rep. 9, 17132. doi: 10.1038/s41598-019-53451-4
Poudel S., Vennam R. R., Shrestha A., Reddy K. R., Wijewardane N. K., and Bheemanahalli R. (2023). Resilience of soybean cultivars to drought stress during flowering and early-seed setting stages. Sci. Rep. 13, 1277. doi: 10.1038/s41598-023-28354-0
Radwan O. (2015). Genomics improvement of agronomic crops to abiotic stress. J. Investig. Genom. 2, 26. doi: 10.15406/jig.2015.02.00026
Rauf S., Al-Khayri J. M., Zaharieva M., Monneveux P., and Khalil F. (2016). Breeding strategies to enhance drought tolerance in crops. In: Al-Khayri J., Jain S., and Johnson D. (eds) Advances in Plant Breeding Strategies: Agronomic, Abiotic and Biotic Stress Traits. Springer, Cham, 397–445. doi: 10.1007/978-3-319-22518-0_11
Rezaei E. E., Webber H., Asseng S., and Gaiser T. (2023). Climate change impacts on crop yields. Nat. Rev. Earth Environ. 4, 831–846. doi: 10.1038/s43017-023-00491-0
Ribaut J. M., Jiang C., Gonzalez-de-Leon D., Edmeades G. O., and Hoisington D. (1997). Identification of quantitative trait loci under drought conditions in tropical maize. 2. Yield components and marker-assisted selection strategies. Theor. Appl. Genet. 94, 887–896. doi: 10.1007/s001220050492
Rico-Cambron T. Y., Bello-Bello E., Martínez O., and López-Romero J. M. (2023). A non-invasive method to predict drought survival in Arabidopsis using quantum yield under light conditions. Plant Methods 19, 127. doi: 10.1186/s13007-023-01107-w
Rosa L. M., Dillenburg L. R., and Forseth I. N. (1991). Responses of soybean leaf angle, photosynthesis and stomatal conductance to leaf and soil water potential. Ann. Bot. 67, 51–58. doi: 10.1093/oxfordjournals.aob.a088099
Rosseel Y. (2012). lavaan: An R package for structural equation modeling. J. Stat. Software 48, 1–36. doi: 10.18637/jss.v048.i02
RStudio Team (2020). RStudio: Integrated Development for R (Boston, MA: RStudio, PBC). Available online at: http://www.rstudio.com/ (Accessed December 05, 2024).
Sadeghi L., Rafiee M., and Daneshian J. (2021). Effect of drought stress and aerosols on yield and some physiological traits of soybean (Glycine max L.). Plant Process Funct. 10, 263–278. Available online at: http://jispp.iut.ac.ir/article-1-1431-en.html (Accessed February 12, 2025).
Sadeghipour O. and Abbasi S. (2012). Soybean response to drought and seed inoculation. World Appl. Sci. J. 17, 55–60.
Song Q., Zhang G., and Zhu X.-G. (2013). Optimal crop canopy architecture to maximise canopy photosynthetic CO₂ uptake under elevated CO₂ – a theoretical study using a mechanistic model of canopy photosynthesis. Funct. Plant Biol. 40, 108–124. doi: 10.1071/FP12056
Takai T., Adachi S., Taguchi-Shiobara F., Sanoh-Arai Y., Iwasawa N., Yoshinaga S., et al. (2013). A natural variant of NAL1, selected in high-yield rice breeding programs, pleiotropically increases photosynthesis rate. Sci. Rep. 3, 2149. doi: 10.1038/srep02149
Tang Y., Sun X., Wen T., Liu M., Yang M., and Chen X. (2017). Implications of terminal oxidase function in regulation of salicylic acid on soybean seedling photosynthetic performance under water stress. Plant Physiol. Biochem. 112, 19–28. doi: 10.1016/j.plaphy.2016.11.016
Tang X. F., Xue Y. G., Cao D., Luan X. Y., Liu Q., Zhu Z. F., et al. (2024). Marker-assisted selection strategies for drought tolerance in soybean and future perspectives. Legume Genom. Genet. 15, 291–302. doi: 10.5376/lgg.2024.15.0028
Toum L., Perez-Borroto L. S., Peña-Malavera A. N., and Rotundo J. L. (2022). Selecting putative drought-tolerance markers in two contrasting soybeans. Sci. Rep. 12, 10872. doi: 10.1038/s41598-022-14334-3
USDA. (2024). Oil Crops Outlook: December 2024, OCS‑24l. (Washington, DC: United States Department of Agriculture). (Accessed December 12, 2024)
Valliyodan B., Ye H., Song L., Murphy M., Shannon J. G., and Nguyen H. T. (2017). Genetic diversity and genomic strategies for improving drought and waterlogging tolerance in soybeans. J. Exp. Bot. 68, 1835–1849. doi: 10.1093/jxb/erw433
Wei T. and Simko V. (2024). R package ‘corrplot’: Visualization of a Correlation Matrix (R package version 0.95). Available online at: https://github.com/taiyun/corrplot (Accessed January 26, 2025).
Wickham H. (2016). ggplot2: Elegant Graphics for Data Analysis (New York, NY: Springer-Verlag). doi: 10.1007/978-3-319-24277-4
Wickham H., François R., Henry L., Müller K., and Vaughan D. (2023). dplyr: A Grammar of Data Manipulation (R package version 1.1.4). Available online at: https://github.com/tidyverse/dplyr (Accessed January 10, 2025).
Wu Y. and Cosgrove D. J. (2000). Adaptation of roots to low water potentials by changes in cell wall extensibility and cell wall proteins. J. Exp. Bot. 51, 1543–1553. doi: 10.1093/jexbot/51.350.1543
Xu X. B., Teng C., Zhu H. C., Feng H. K., Zhao Y., and Li Z. H. (2024). Comparison of three models for winter wheat yield prediction based on UAV hyperspectral images. Int. J. Agric. Biol. Eng. 17, 260–267. doi: 10.25165/j.ijabe.20241702.8340
Yan C., Song S., Wang W., Wang Y., Li F., Li Z., et al. (2020). Screening diverse soybean genotypes for drought tolerance by membership function value based on multiple traits and drought-tolerant coefficient of yield. BMC Plant Biol. 20, 321. doi: 10.1186/s12870-020-02519-9
Yavas I., Yıldırım A., and Ilker E. (2024). Evaluation of three soybean genotypes under drought stress. Pol. J. Environ. Stud. 34, 1–8. doi: 10.15244/pjoes/191005
Ye H., Song L., Schapaugh W. T., Ali M. L., Sinclair T. R., Riar M. K., et al. (2020). The importance of slow canopy wilting in drought tolerance in soybean. J. Exp. Bot. 71, 642–652. doi: 10.1093/jxb/erz150
Keywords: chlorophyll fluorescence, drought tolerance, multivariate analysis, photosynthesis, physiological markers, predictive modeling, yield stability
Citation: Singh-Bakala H, Ravelombola F, Adeva C, Oliveira M, Zhang R, Argenta J, Shannon G and Lin F (2025) Harnessing photosynthetic and morpho-physiological traits for drought-resilient soybean: integrating field phenotyping and predictive approaches. Front. Plant Physiol. 3:1591146. doi: 10.3389/fphgy.2025.1591146
Received: 10 March 2025; Accepted: 08 July 2025;
Published: 01 August 2025.
Edited by:
Eloy Navarro-Leon, University of Granada, SpainReviewed by:
Mohammad Jan Shamim, University of Kentucky, United StatesEsteban Mariano Pardo, Instituto de Tecnología Agroindustrial del Noroeste Argentino (ITANOA), Argentina
Copyright © 2025 Singh-Bakala, Ravelombola, Adeva, Oliveira, Zhang, Argenta, Shannon and Lin. This is an open-access article distributed under the terms of the Creative Commons Attribution License (CC BY). The use, distribution or reproduction in other forums is permitted, provided the original author(s) and the copyright owner(s) are credited and that the original publication in this journal is cited, in accordance with accepted academic practice. No use, distribution or reproduction is permitted which does not comply with these terms.
*Correspondence: Feng Lin, ZmxibjdAbWlzc291cmkuZWR1