- 1State Key Laboratory of Genetic Engineering and Innovation Center of Genetics and Development, School of Life Sciences, Fudan University, Shanghai, China
- 2Human Phenome Institute, Fudan University, Shanghai, China
- 3The School of Mathematic Sciences, Fudan University, Shanghai, China
- 4School of Public Health, The University of Texas Health Science Center at Houston, Houston, TX, United States
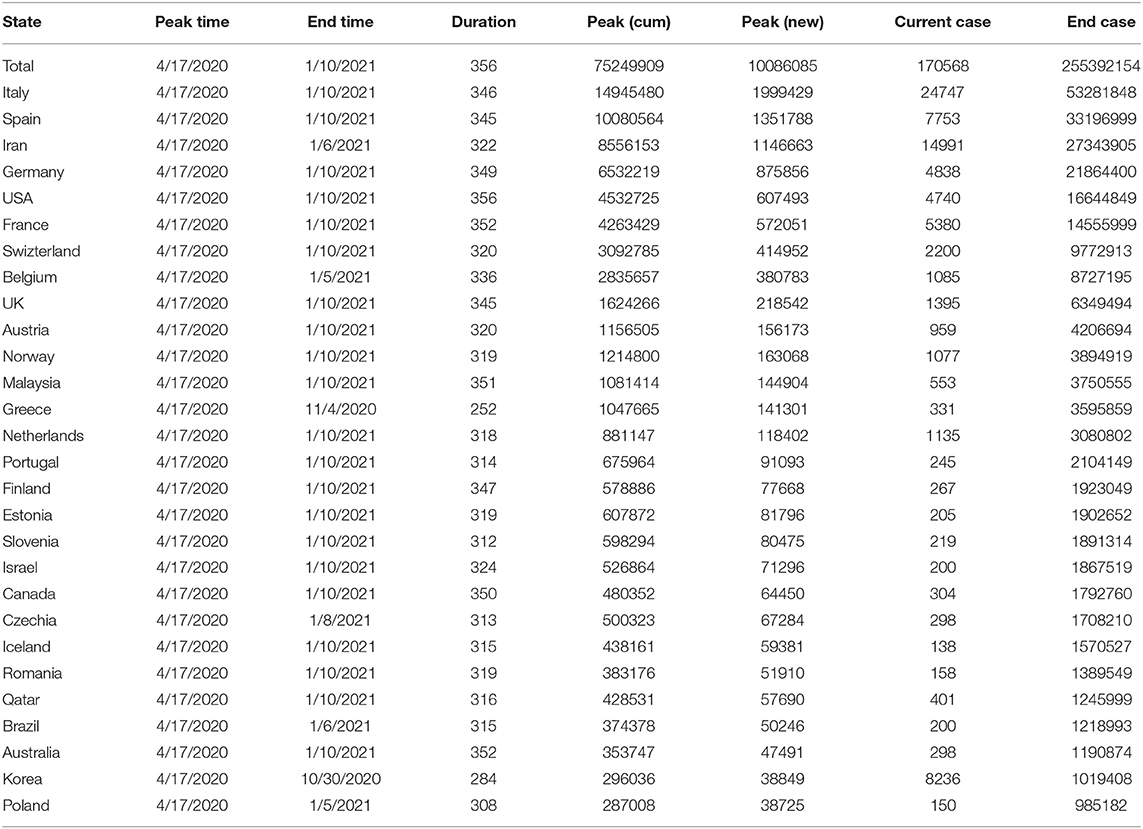
As the Covid-19 pandemic surges around the world, questions arise about the number of global cases at the pandemic's peak, the length of the pandemic before receding, and the timing of intervention strategies to significantly stop the spread of Covid-19. We have developed artificial intelligence (AI)-inspired methods for modeling the transmission dynamics of the epidemics and evaluating interventions to curb the spread and impact of COVID-19. The developed methods were applied to the surveillance data of cumulative and new COVID-19 cases and deaths reported by WHO as of March 16th, 2020. Both the timing and the degree of intervention were evaluated. The average error of five-step ahead forecasting was 2.5%. The total peak number of cumulative cases, new cases, and the maximum number of cumulative cases in the world with complete intervention implemented 4 weeks later than the beginning date (March 16th, 2020) reached 75,249,909, 10,086,085, and 255,392,154, respectively. However, the total peak number of cumulative cases, new cases, and the maximum number of cumulative cases in the world with complete intervention after 1 week were reduced to 951,799, 108,853 and 1,530,276, respectively. Duration time of the COVID-19 spread was reduced from 356 days to 232 days between later and earlier interventions. We observed that delaying intervention for 1 month caused the maximum number of cumulative cases reduce by −166.89 times that of earlier complete intervention, and the number of deaths increased from 53,560 to 8,938,725. Earlier and complete intervention is necessary to stem the tide of COVID-19 infection.
Introduction
As of March 16th, 2020, the number of confirmed cases of COVID-19 worldwide surpassed 170,568, and the occurrence has spread to more than 152 countries. As this coronavirus has become classed as a pandemic (Callaway, 2020), a number of questions have arisen among the populous as well as government and business leaders: How many cases will there be worldwide? How many deaths can be expected? When will a peak in the number of cases occur? When will this pandemic end? How will the recommended immediate action slow the spread?
A number of statistical and dynamic models of COVID-19 outbreaks, including the SEIR model and branching processes, have been previously applied to analyze its transmission dynamics (Hellewell et al., 2020; Kucharski et al., 2020; Tuite and Fisman, 2020; Wu et al., 2020; Zhao et al., 2020; Li Q. et al., 2020). These epidemiological models are useful for estimating the dynamics of transmission, targeting resources, and evaluating the impact of intervention strategies, but the models require values for unknown parameters and depend on many assumptions (Funk et al., 2018; Johansson et al., 2019; Li R. et al., 2020).
Most analyses used hypothesized parameters and hence do not fit the data very well. The accuracy of forecasting the future cases of Covid-19 using these models may not be very high. The non-pharmaceutical interventions (NPIs) that attempt to reduce the reproduction number are the major strategies to curb the spread of Cvid-19. The NPIs include home quarantine, keeping social distancing, stopping mass gatherings, and the closure of schools and universities. We can simulate the effect of each single intervention. However, it is difficult to associate each single intervention with the real data. The intervention strategies that have been developed by these models cannot be evaluated by real data. Only comprehensive interventions can be associated with the real data.
To overcome limitations of the epidemiological model approach and assist public health planning and policy making, we developed the modified auto-encoder (MAE) (Yuan et al., 2018; Charte et al., 2019), an artificial intelligence (AI)-based method for real-time forecasting of the new and cumulative confirmed cases of Covid-19 worldwide and evaluating the impact of the comprehensive public health interventions and their implementation times on curbing the spread of Covid-19. The MAE does not consider single intervention but can model mandatory and voluntary comprehensive public health interventions while still using real data for evaluation of interventions.
Transfer learning was used to train the MAE (Zhuang et al., 2019). An intervention variable was introduced as an input variable for the MAE. We viewed the China type of intervention as the fully comprehensive intervention and assigned 1 to the intervention variable. We assigned 0 to the intervention variable if there was no intervention. The weights between 0 and 1 were assigned to the intervention variable for the different degrees of interventions. The values that were assigned to the intervention variable was called weight. Taking time for intervention into account, we considered different comprehensive intervention scenarios. We investigated how the degree of intervention and starting intervention time determine the peak time and case ending time, the peak number and maximum number of cases, and the forecast for the peak and maximum number of new and cumulative cases in more than 152 countries across the world. The analysis is based on the surveillance data of confirmed and new Covid-19 cases worldwide up to March 16th, 2020.
In this study, we aimed to develop an AI -nspired method for real-time forecasting and evaluation of the impact of comprehensive interventions on the curbing the spread of Covid-19 and show that earlier and complete intervention is necessary to stem the tide of COVID-19 infection. We estimated the maximum number of cumulative cases under earlier complete intervention to be 1,530,276; under later intervention the number of cases increased to a frightening 255,392,154, the number of deaths increased from 53,560 to 8,938,725, and the case ending time was significantly delayed. We concluded that, if there is no immediate aggressive action to intervene, we will face serious consequences.
Materials and Methods
Modified Auto-Encoder for Modeling Time Series
The MAE were used to forecast the number of the accumulative and new confirmed cases of Covid-19 and evaluate the impact of the comprehensive public health interventions on the spread of Covid-19. Unlike the classical auto-encoder where the number of nodes in the layers usually decreases from the input layer to the latent layers, the numbers of the nodes in the input, the first latent layer, the second latent layer, and the output layers in the MSAE were eight, 32, four, and one, respectively (Figure 1).
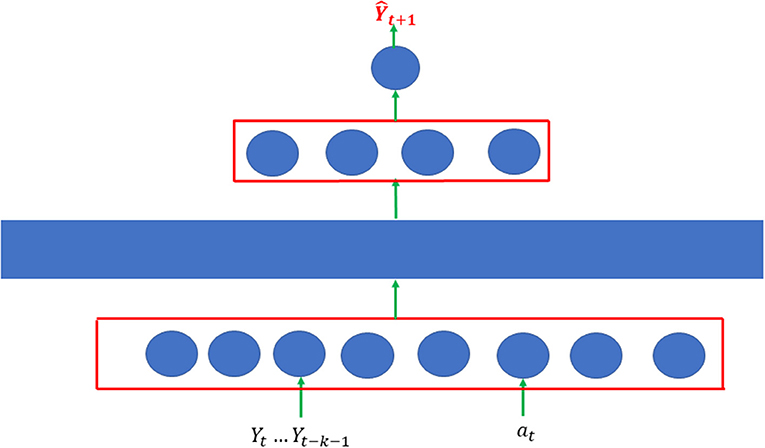
Figure 1. Architecture of modified autoencoder which consisted of two single AE. Each single AE was a three-layer feedforward neural network.
MAE consisted of two single AE. Each single AE was a three-layer feedforward neural network. The first layer is the input layer, the third layer is the reconstruction layer, and the second layer is the hidden layer. The input vector is denoted by , where Yt is the number of cases at the time t, and 0 ≤ at ≤ 1 is the public health intervention indicator variable. If there is no intervention, then at = 0. For the strongest intervention, 1 is assigned to the variable at = 1. The input vector is mapped to the hidden layer to capture the features of the transmission dynamics of Covid-19 with public health intervention:
where h(X) is the hidden vector, Whx are the weights connecting the input vector to the hidden layer, bh is a bias vector, and σ1 is element-wise non-linear activation function ReLU.
AE attempts to generate an output that reconstructs its input by mapping the hidden vector to the reconstruction layer:
where is the output, Woh are the weights connecting hidden layer to the output layer, bo is a bias vector, and σ2 is element-wise non-linear activation function ReLU. The single layer AE attempts to minimize the error between the input vector and the reconstruction vector. The loss function is defined as
We develop stacked autoencoders with four layers that consist of two single-layer AEs stacked layer by layer [1]. The dimensions of the input layer, the first hidden layer, and the second hidden layer are eight, 32, and four, respectively (Figure 1). The first single-layer autoencoder maps the input vector into the first hidden vector by minimizing the reconstruction errors via gradient descent algorithm (Charte et al., 2019). After the first single-layer AE was trained, we removed the reconstruction layer of the first single layer AE and kept the hidden layer of the first single AE as the input layer of the second single- layer AE. In other words, the input vector of the subsequent AE was the hidden vector of the previous AE [1]. We repeated the training process for the second single-layer AE. The output of the final node that fully connects to the hidden layer of the second single-layer AE was the predicted number of cases Ŷtn = f(Hn) for the nth sample, where Hn is the hidden vector of the second single-layer AE for the nth sample. Our goal was to make the predicted Ŷn as close to the observed Yn as possible. The loss function for prediction is
where weight Wn will be defined in Data-preprocessing Section.
An intervention variable was introduced as an input variable for the MAE. We viewed the China-type intervention as the fully comprehensive intervention and assigned 1 to the intervention variable. We assigned 0 to the intervention variable if there was no intervention. Weights between 0 and 1 were assigned to different degrees of interventions—zero being no intervention and one being complete—including social distancing, hand washing, wearing face mask, strict travel restriction, no large group gatherings, mandatory quarantine, restricted public transportation, closing schools, and closure of all non-essential businesses, including manufacturing. We considered four intervention scenarios, which were described in Table S2. For each scenario, we investigated how the degree and timing of the intervention determined the peak and case-ending time, the number of cases at the peak, and the maximum number of cases.
Data Pre-processing
We considered 152 time series (number of new cases collected for each day)—one time series for each country. The data were organized in a matrix with the rows representing the country and columns representing the number of the new confirmed cases of each day. Let m be the number of days. Let tij be the number of the confirmed new cases of the jth day within the ith country. Let Z be a 152 × m dimensional matrix. The element Zij is the number of the confirmed new cases of Covid-19 on the jth day—starting with January 20th, 2020—in the ith country.
One time series for the country in the training set was divided into a k = 44 subsegment of time series, each subsegment of time series with the number of new cases in 8 successive days. We viewed a subsegment of time series with 8 days as a sample of data.
One element from the data matrix Z is randomly selected as a start day of the subsegment and select its 7 successive days as the other days to form a subsegment of time series. Let i be the index of the time series and ji be the column index of the matrix Z that was selected as the starting day. The subsegment of time series can be represented as {Zji,, Zji+1, …, Zji+7}. Data were normalized to , where . Let be the normalized number of new cases to forecast. If S = 0, then set Yji = 0. The ji started with 9 and ended with k+8, the last day for the training, where k is the number of subsegments. The loss function was defined as
where Yji was the observed number of the new cases in the forecasting day of the subsegment time series, and Ŷji was its forecasted number of new cases by the MAE, and Wji were weights. If ji was in the interval [1, 12], then Wi = 1. If ji was in the interval [13, 24], then Wi = 2, etc. The back-propagation algorithm was used to estimate the weights and bias in the MAE. Repeat training processed five times. The average forecasting Ŷji, i = 1, …, 152 will be taken as a final forecasted number of the confirmed new cases for each country.
Forecasting Procedures
To forecast each day, we needed to take a matrix of the data that consisted of a subsegment of time series (number of new cases with 8 days) from each country and denoted the number of new cases in the jth day for the ith country by xij . The trained MAE was used for forecasting the future number of new cases of Covid-19 for some day (jth day) in the each country. Consider the ith country. Assume that the number of new confirmed cases of Covid-19 on the jth day that needs to be forecasted is xij. Let H be a 152 × 8 dimensional matrix that was used for forecasting, hil = xij−9+l, i = 1, …, 152, and l = 1, …, 8 . Let be the average of the ith row of the matrix H. Let U be the normalized matrix of H, where . The output of the MAE is the forecasted number of new confirmed cases and is denoted as , where θ represents the estimated parameters in the trained MAE. The one-step forecasting of the number of new confirmed cases of Covid-19 for each country is given by Ŷi
The recursive multiple-step forecasting involved using a one-step model multiple times where the prediction for the preceding time step was used as an input for making a prediction on the following time step. For example, to forecast the number of new confirmed cases for the next day, the predicted number of new cases in one-step forecasting were used as observational input in order to predict day 2. The above process was then be repeated to obtain the two-step forecasting. The summation of the final forecasted number of new confirmed cases for each country was taken as the prediction of the total number of new confirmed cases of Covid-19 worldwide.
Data Collection
The analysis is based on surveillance data of confirmed cumulative and new COVID-19 cases worldwide as of March 16th, 2020. Data on the number of cumulative and new cases and COVID-19-attributed deaths across 152 countries from January 20th to March 16th, 2020, were obtained from WHO (https://www.who.int/emergencies/diseases/novel-coronavirus-2019/situation-reports).
Results
Later Intervention Makes It Difficult to Stop the Spread of COVID-19
To demonstrate that the MAE is an accurate forecasting method, the MAE was applied to confirmed accumulated cases of COVID-19 across 152 countries. The intervention indicator for China and other countries was set to 1 and 0, respectively. Table 1 presents the one- to five-step errors for forecasting cumulative number of cases starting from March 12th, 2020. In all scenarios, the average forecasting accuracies of the MAE were <2.5% (Table 1). Table S1 presented the one- to five-step errors for forecasting cumulative number of cases of Covid-19 in China using MAE and ARIMAX, starting from March 4th, 2020. The maximum of average errors of one- to 5-step forecasting using MAE and ARIMAX was 0.0195% and 0.625%, respectively. The forecasting accuracy of MAE was much smaller than that of ARIMAX.
Table 2 shows the forecasting results of COVID-19 in 30 countries and worldwide under a later stepwise intervention scenario (Scenario 4). The worldwide cumulative number of cases and the number of new cases at the peak with later intervention could reach 75,249,909 and 10,086,085, respectively. If every country in the world undertook such a later intervention scenario, the total number of cases in the world could reach as high as 255,392,154, and the community transmission of COVID-19 would continue until January 10th, 2021. The top 10 countries with a high average number of cases were Italy, Spain, Iran, Germany, USA, France, Switzerland, Belgium, UK, and Austria. To show the dynamics of COVID-19 development, Figures 2G,H shows the curves of the number of cumulative cases and new cases in seven major infected countries: Iran, Spain, Italy, Germany, USA, France, and China under scenario 4.
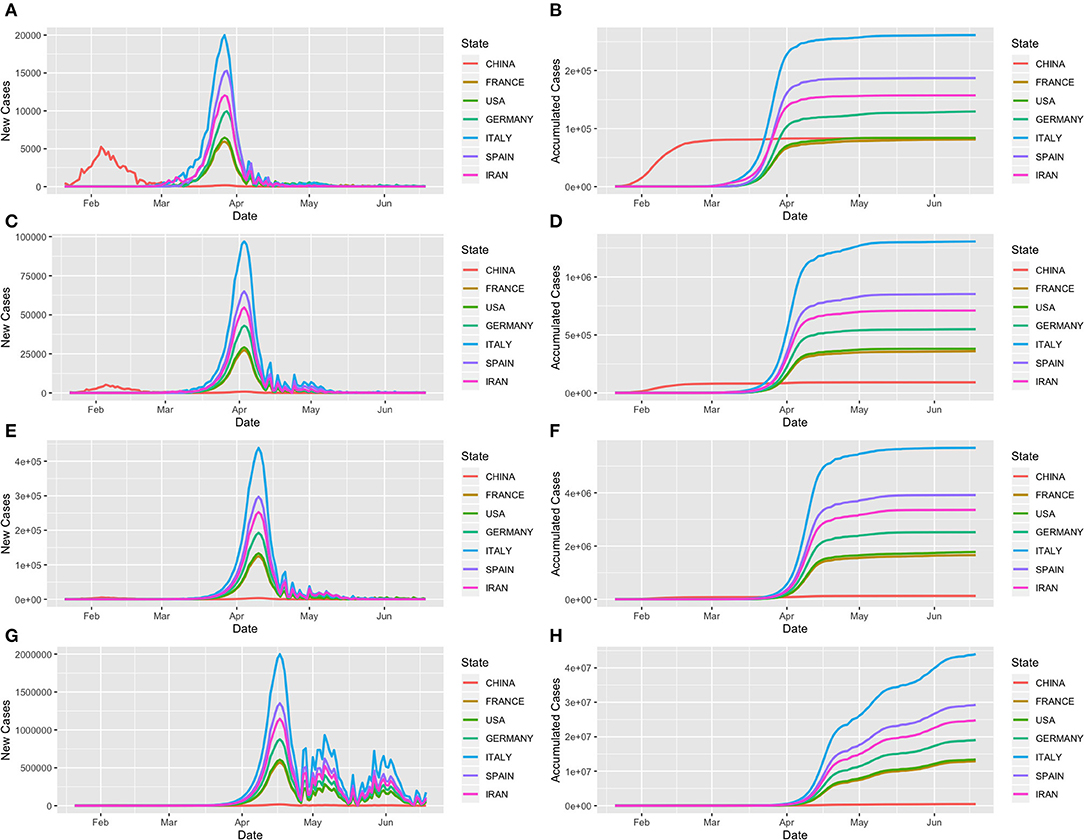
Figure 2. Trajectory of COVID-19 in the seven most infected countries—Iran, Spain, Italy, Germany, USA, France and China as a function of days from January 21st to June 19th, 2020. (A,C,E,G) Forecasted curves of the newly confirmed cases of COVID-19 under scenarios 1, 2, 3, and 4, respectively. (B,D,F,H) Forecasted curves of the cumulative confirmed cases of COVID-19 under scenarios 1, 2, 3, and 4, respectively.
New Strategies Are Needed to Curb the Spread of COVID-19
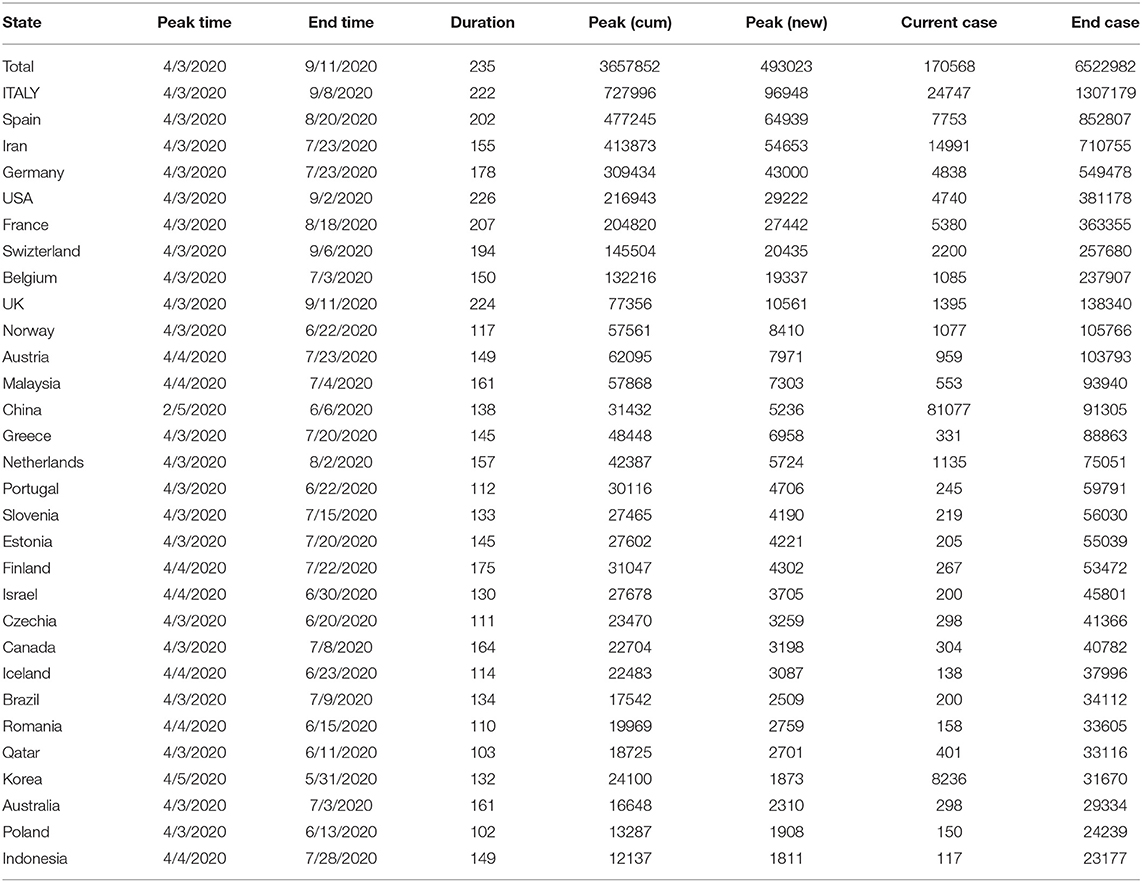
There is an urgent need to develop new strategies to curb the spread of COVID-19 (Callaway, 2020). We investigated whether early complete interventions would reduce the peak time, cumulative case numbers, and the final total number of cases worldwide. Table 3 shows the forecasted results of COVID-19 in 30 countries and worldwide under early complete intervention (Scenario 1). We observed dramatic reduction in the number of COVID-19 cases. The forecasted total number of cases worldwide was reduced by early complete intervention to 1,530,276 from nearly 255 million with later intervention (Scenario 4). In other words, 99.4% of the potential cases could be eliminated by early complete intervention. The duration time was reduced from 356 days to 232 days, and the end time changed from January 10th, 2021, to September 8th, 2020. Figures 2A,B plot curves of the number of cumulative cases and new cases in six major infected countries—Iran, Spain, Italy, Germany, USA, and France—under Scenario 1.
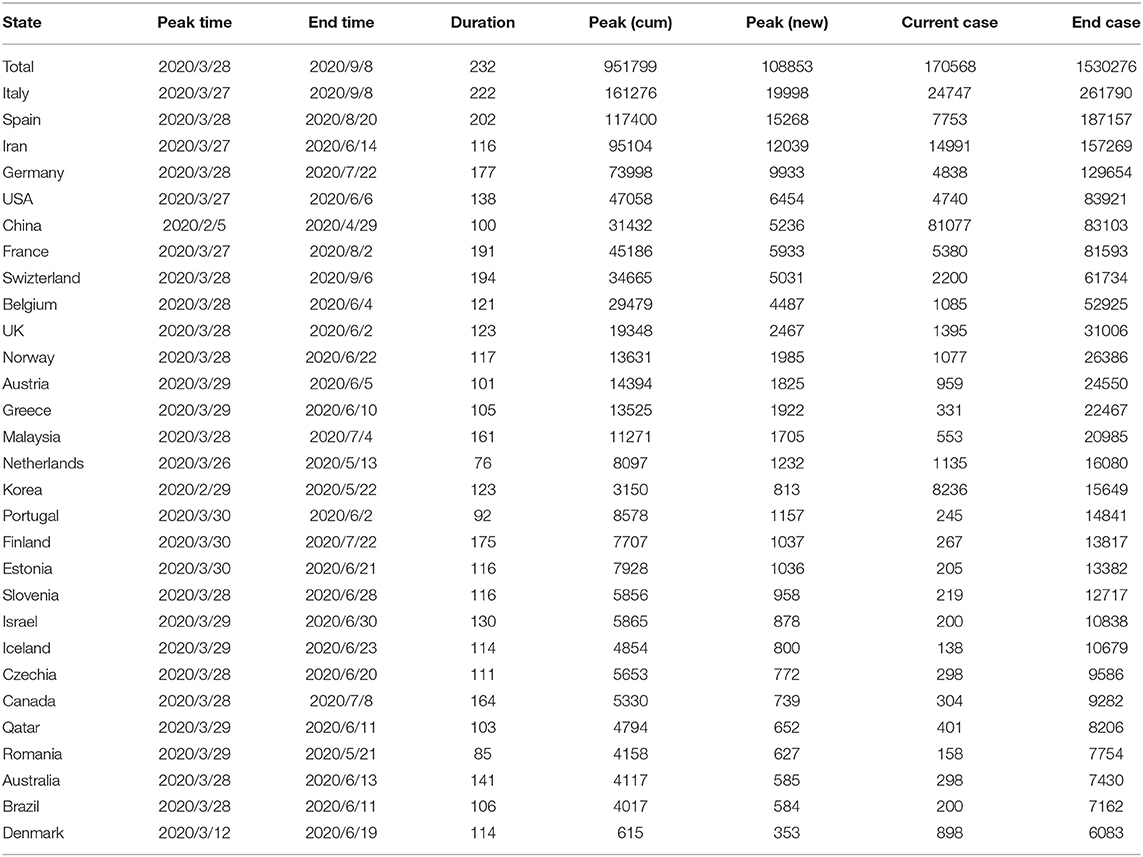
Table 3. Spread of Covid-19 in 30 countries and worldwide under early complete intervention (1 week from March 16th intervention).
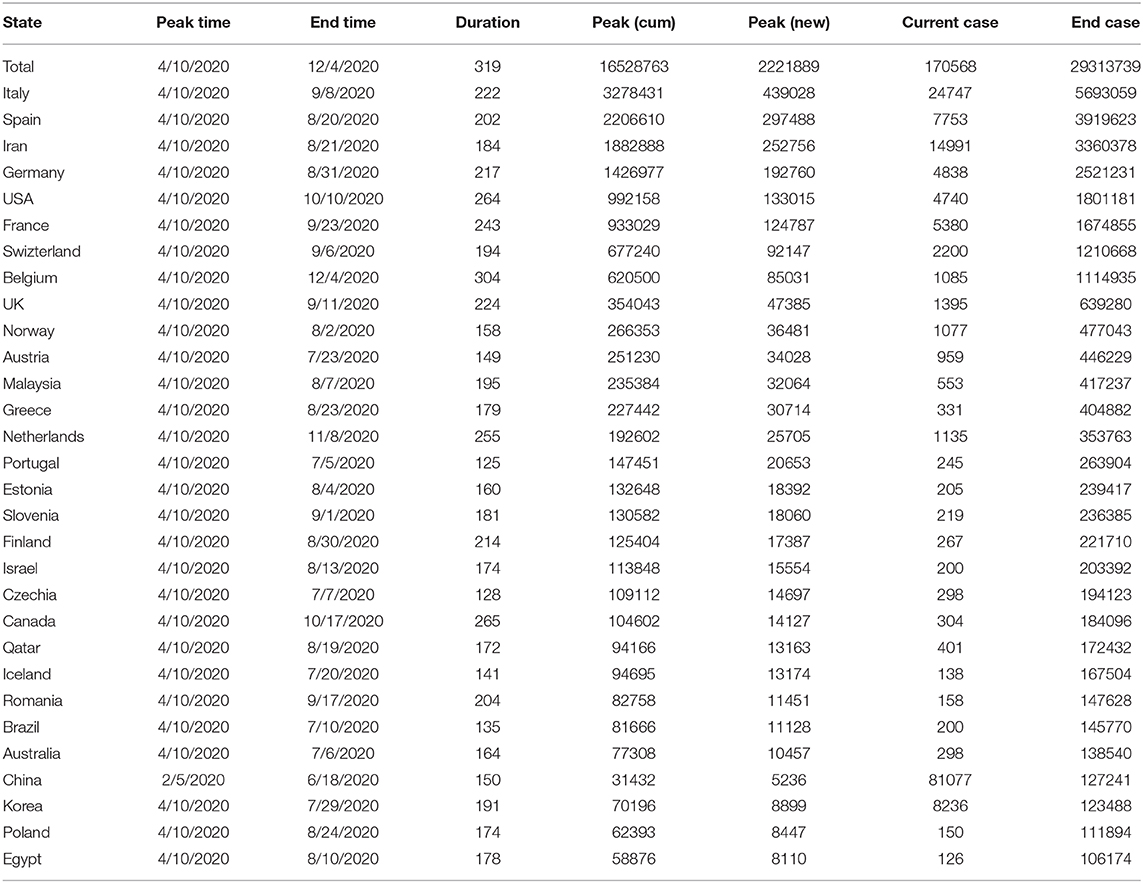
To investigate intervention measures between early complete and a 4-week delay intervention, Tables 4, 5 show the results under scenarios 2 and 3, respectively. Figures 2C–F plot transmission dynamics of COVID-19 with curves of the cumulative cases and new cases in the six major infected countries under scenarios 2 and 3, respectively.
Comparisons Among Intervention Strategies
To further illustrate the impact of interventions on the spread of COVID-19, we compared the effects of four intervention scenarios on the transmission dynamics of COVID-19 across the world. Figure 3 plots the worldwide reported and forecasted time curves of the cumulative and newly confirmed cases of COVID-19 under the four intervention scenarios. The ratios of the world number of final cases across the four scenarios were 1:4.26:19.16:166.9, and the ratios of case duration under the four intervention scenarios were 1:1:01.1.38:1.53. These results demonstrate that intervention time delays have serious consequences.
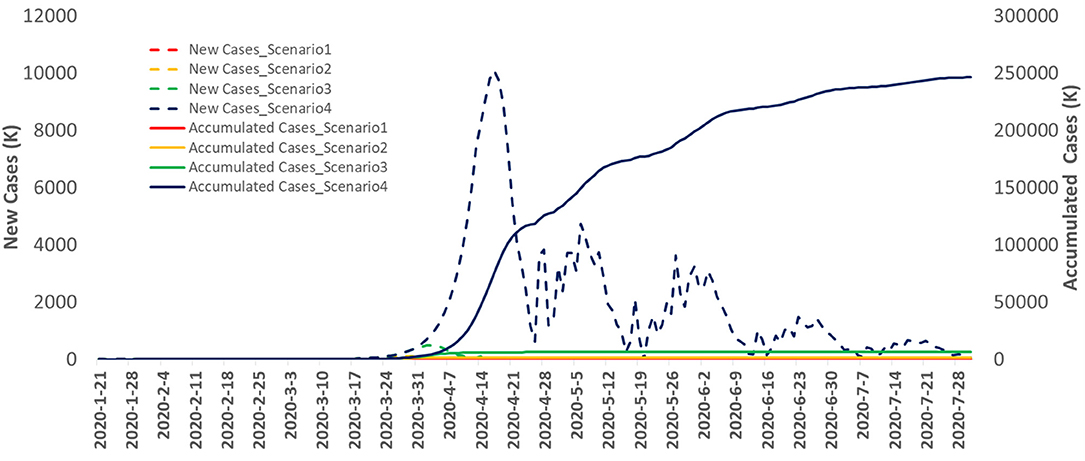
Figure 3. The reported and forecasted curves of the cumulative and new confirmed cases of Covid-19 in the world as a function of days from January 20th, to July 28th, 2020.
Figure 4 plots the time-case curves for the top six infected countries: Iran, Spain, Italy, Germany, USA, France, and China. The time-case curve under the 4 week delay intervention was shifted more than 1 month to the right and was much steeper than that of under the early intervention. Delaying intervention will substantially increase the number of cumulative cases of COVID-19.
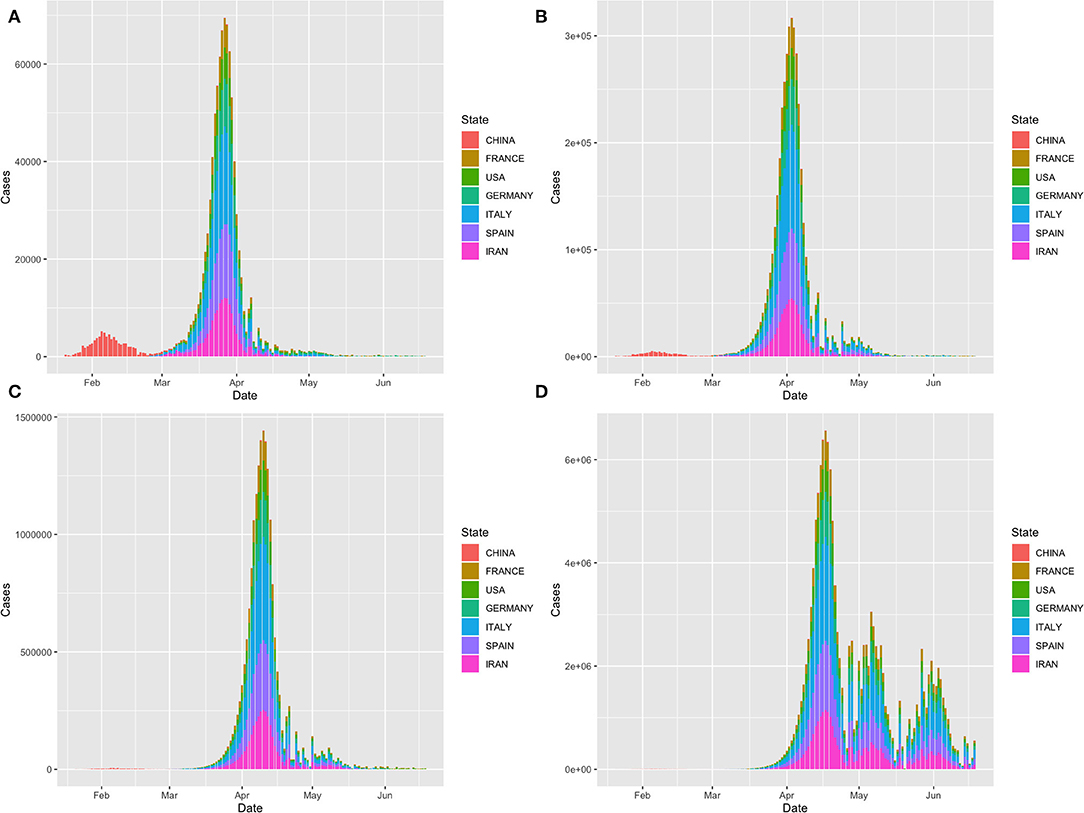
Figure 4. Time-case plot of the top seven infected countries: Iran, Spain, Italy, Germany, USA, France and China. (A) Time-case plot under intervention scenario 1; (B) Time-case plot under intervention scenario 2; (C) Time-case plot under intervention scenario 3 and (D) Time-case plot under intervention scenario 4.
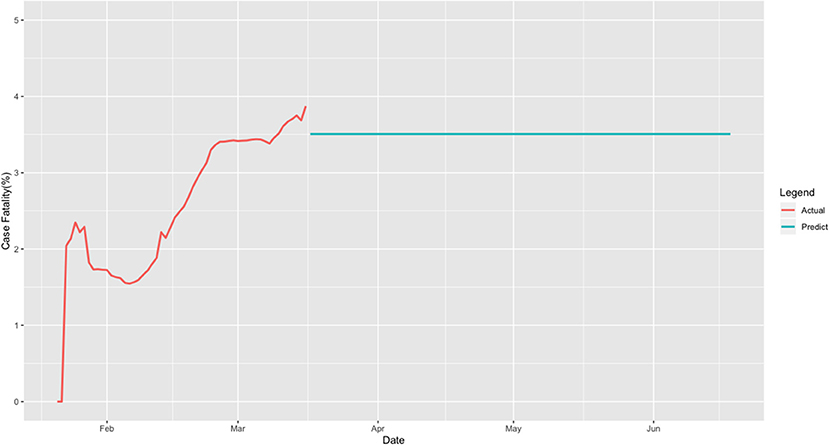
Figure 5 shows the case-fatality rate curve as a function of time, where the case-fatality rate is defined as the ratio of the number of deaths over the number of cumulative cases in the world. The average case-fatality rate was 3.5%.
Comparison With the SEIR Epidemiological Model
To illustrate the performance of the MAE for forecasting the transmission dynamics of COVID-19, we compared the MAE with the widely used epidemiological models. The susceptible-exposed-infected-recovered (SEIR) model is a standard mathematical compartmental model based on the average behavior of a population under study (Sameni, 2020). We compared the results of MAE for forecasting the peak time, peak number of new cases, and the maximum number of the cumulative cases of COVID−19 in China with a modified SEIR epidemiological model (Yang et al., 2020). The estimated peak time and peak number of new cases using the MAE method were February 5th, 2020, and 5,236, respectively. The estimated peak time and peak number of new cases using the modified (SEIR) epidemiological model were February 7th, 2020, and 4,169, respectively. The reported numbers of new cases from February 5th, 2020, to February 9th, 2020, in the WHO dataset were 5,229, 4,947, 4,158, 4593, and 3,534. It was clear that the peak time was February 5th, 2020. The MAE method precisely estimated peak time. The error of forecasting the peak number of new cases using the MAE method and modified SEIR model were 0.00134 and −0.203, respectively. The estimation using the MAE was much accurate than using the modified SEIR model.
The estimated maximum numbers of cumulative cases without inflow from abroad using the MAE and modified SEIR model were 83,103, and 122,122, respectively. The reported number of cumulative cases on May 2nd, 2020, was 84,338. The errors of forecasting the maximum number of cumulative cases using the MAE and modified SEIR model were −0.015 and 0.447, respectively. Again, the MAE substantially outperformed the modified SEIR model for forecasting the maximum number of cumulative cases of COVID-19 in China.
Discussion
As an alternative to the epidemiologic transmission model, we used MAE to forecast the real-time trajectory of the transmission dynamics and generate the real-time forecasts of Covid-19 across the world. The results showed that the accuracies of prediction and subsequently multiple-step forecasting were high. This approach allows us to address two important questions: Is comprehensive NPIs required or not? How important is the intervention time? Since interventions are complicated and are difficult to quantify, we designed four intervention scenarios to represent the degrees of interventions and delay of interventions. The proposed methods combine the real data and some assumptions. This allowed us to evaluate the consequences of intervention while keeping the analysis as close to the real data as possible.
The MAE models allow us to input the interventions information, investigate the impact of interventions on the size, duration, and time of the virus outbreak, and recommend the intervention time.
Our results showed that real-time forecasting is more accurate than epidemiologic transmission model where the model parameters may not be applicable in practice. We estimated the duration, peak time, ending time, peak number, and maximum number of cumulative cases of COVID-19 under four intervention scenarios for 152 countries in the world. The forecasted total number of cases worldwide was reduced by early complete intervention to 1,530,276 from nearly 255 million with later intervention. In other words, 99.4% of the potential cases could be eliminated by early complete intervention. A delay of 4 weeks will substantially speed the spread of coronavirus, delay the ending time by almost 4 months, and increase the number of deaths from 53,560 to 8,938,725. These data provide critical information for government leaders and health authorities to consider urgent public health response to slow the spread of Covid-19. We have demonstrated that aggressive intervention is urgently needed.
Data Availability Statement
These data can be downloaded from WHO Coronavirus disease (COVID-2019) situation reports at https://www.who.int/emergencies/diseases/novel-coronavirus-2019/situation-reports.
Author Contributions
ZH performed data analysis. QG assist data analysis. SL pre-processing data. EB wrote paper. LJ designed project. MX designed project and wrote paper.
Funding
LJ was partially supported by National Natural Science Foundation of China 91846302.
Conflict of Interest
The authors declare that the research was conducted in the absence of any commercial or financial relationships that could be construed as a potential conflict of interest.
Supplementary Material
The Supplementary Material for this article can be found online at: https://www.frontiersin.org/articles/10.3389/frai.2020.00041/full#supplementary-material
References
Callaway, E. (2020). Time to use the p-word? Coronavirus enters dangerous new phase. Nature. doi: 10.1038/d41586-020-00551-1. [Epub ahead of print].
Charte, D., Charte, F., García, S., Jesus, M. J. D., and Herrera, F. (2019). A practical tutorial on autoencoders for nonlinear feature fusion: taxonomy, models, software and guidelines. Informat. Fusion. 44, 78–96. doi: 10.1016/j.inffus.2017.12.007
Funk, S., Camacho, A., Kucharski, A. J., Eggo, R. M., and Edmunds, W. J. (2018). Real-time forecasting of infectious disease dynamics with a stochastic semi-mechanistic model. Epidemics 22, 56–61. doi: 10.1016/j.epidem.2016.11.003
Hellewell, J., Abbott, S., Gimma, A., Bosse, N. I., Jarvis, C. I., Russell, T. W., et al. (2020). Centre for the Mathematical Modelling of Infectious Diseases COVID-19 Working Group, Funk S1, Eggo RM2. Feasibility of controlling COVID-19 outbreaks by isolation of cases and contacts. Lancet Glob Health 8, e488–e496. doi: 10.1016/S2214-109X(20)30074-7
Johansson, M. A., Apfeldorf, K. M., Dobson, S., Devita, J., Buczak, A. L., Baugher, B., et al. (2019). An open challenge to advance probabilistic forecasting for dengue epidemics. Proc. Natl. Acad. Sci. U.S.A. 116(48):24268–24274. doi: 10.1073/pnas.1920071116
Kucharski, A., Russell, T., Diamond, C., Liu, Y., CMMID nCo V working group, Edmunds, J., et al. (2020). Analysis and Projections of Transmission Dynamics of nCoV in Wuhan. Available online at: https://cmmid.github.io/ncov/wuhan_early_dynamics/index.html (accessed February 26, 2020).
Li, Q., Guan, X., Wu, P., Wang, X., Zhou, L., Tong, Y., et al. (2020). Early transmission dynamics in Wuhan, China, of novel Coronavirus-infected pneumonia. N. Engl. J. Med. 382, 1199–1207. doi: 10.1056/NEJMoa2001316
Li, R., Pei, S., Chen, B., Song, Y., Zhang, T., Yang, W., et al. (2020). Substantial undocumented infection facilitates the rapid dissemination of novel coronavirus (SARS-CoV2). Science 368, 489–493. doi: 10.1126/science.abb3221
Sameni, R. (2020). Mathematical modeling of epidemic diseases; a case study of the COVID-19 coronavirus. arxiv [Preprint] arXiv:2003.11371.
Tuite, A. R., and Fisman, D. N. (2020). Reporting, epidemic growth, and reproduction numbers for the 2019 novel coronavirus (2019-nCoV) epidemic. Ann. Intern. Med. 21, 567–568. doi: 10.7326/M20-0358
Wu, J. T., Leung, K., and Leung, G. M. (2020). Nowcasting and forecasting the potential domestic and international spread of the 2019-nCoV outbreak originating in Wuhan, China: a modelling study. Lancet 395, 689–697. doi: 10.1016/S0140-6736(20)30260-9
Yang, Z., Zeng, Z., Wang, K., Wong, S. S., Liang, W., Zanin, M., et al. (2020). Modified SEIR and AI prediction of the epidemics trend of COVID-19 in China under public health interventions. J. Thorac. Dis. 12, 165–174. doi: 10.21037/jtd.2020.02.64
Yuan, X., Huang, B., Wang, Y., Yang, C., and Gui, W. (2018). Deep learning-based feature representation and its application for soft censor modeling with variable-wise weighted SAE. IEEE Trans. Indust. Informatics 14, 3235–3243. doi: 10.1109/TII.2018.2809730
Zhao, S., Musa, S. S., Lin, Q., Ran, J., Yang, G., Wang, W., et al. (2020). Estimating the unreported number of novel Coronavirus (2019-nCoV) cases in China in the first half of January 2020: a data-driven modelling analysis of the early outbreak. J. Clin. Med. 9:20388. doi: 10.3390/jcm9020388
Keywords: COVID-19, artificial intelligence, transmission dynamics, forecasting, time series, auto-encoder
Citation: Hu Z, Ge Q, Li S, Boerwinkle E, Jin L and Xiong M (2020) Forecasting and Evaluating Multiple Interventions for COVID-19 Worldwide. Front. Artif. Intell. 3:41. doi: 10.3389/frai.2020.00041
Received: 28 March 2020; Accepted: 12 May 2020;
Published: 22 May 2020.
Edited by:
Thomas Hartung, Johns Hopkins University, United StatesReviewed by:
Issam El Naqa, University of Michigan, United StatesGregory R. Hart, Yale University, United States
Copyright © 2020 Hu, Ge, Li, Boerwinkle, Jin and Xiong. This is an open-access article distributed under the terms of the Creative Commons Attribution License (CC BY). The use, distribution or reproduction in other forums is permitted, provided the original author(s) and the copyright owner(s) are credited and that the original publication in this journal is cited, in accordance with accepted academic practice. No use, distribution or reproduction is permitted which does not comply with these terms.
*Correspondence: Momiao Xiong, bW9taWFvLnhpb25nQHV0aC50bWMuZWR1
 Zixin Hu
 Qiyang Ge
 Shudi Li
 Eric Boerwinkle
 Li Jin1,2
 Momiao Xiong
