 Xiaozhi Yang
 Chris Retzler
 Ian Krajbich
 Roger Ratcliff1†
 Marios G. Philiastides
- 1Department of Psychology, The Ohio State University, Columbus, OH, United States
- 2Department of Psychology, University of Huddersfield, Huddersfield, United Kingdom
- 3Department of Economics, The Ohio State University, Columbus, OH, United States
- 4Department of Psychology, University of California, Los Angeles, Los Angeles, CA, United States
- 5School of Psychology and Neuroscience, University of Glasgow, Glasgow, United Kingdom
When considering whether to purchase consumer products, people consider both the items' attractiveness and their brand labels. Brands may affect the decision process through various mechanisms. For example, brand labels may provide direct support for their paired products, or they may indirectly affect choice outcomes by changing the way that people evaluate and compare their options. To examine these possibilities, we combined computational modeling with an eye-tracking experiment in which subjects made clothing choices with brand labels either present or absent. Subjects' choices were consistent with both the attractiveness of the clothing items and, to a smaller extent, the appeal of the brands. In line with the direct support mechanism, subjects who spent more time looking at the brands were more likely to choose the options with the preferred brands. When a clothing item was more attractive, subjects were more likely to look longer at the associated brand label, but not vice versa. In line with indirect mechanisms, in the presence of brand labels subjects exerted more caution and showed marginally less attentional bias in their choices. This research sheds light on the interplay between gaze and choice in decisions involving brand information, indicating that brands have both direct and indirect influences on choice.
Introduction
Brand labels are ubiquitous in daily life (e.g., Consumer packaged goods: Lewis et al., 2016; Fashion: Stokburger-Sauer and Teichmann, 2013; Services: Brodie et al., 2009; Durables: Brucks et al., 2000), are a crucial dimension of consumer choice (Fournier, 1998; Keller, 2003; Anand and Shachar, 2004; Ataman et al., 2010; Avery and Keinan, 2016) and attract heavy investment from corporations (Mottram, 1998; Rao et al., 2004; Murray, 2013). Brands provide a signal of quality that might otherwise be difficult to discern (Wernerfelt, 1988; Kirmani and Rao, 2000). They also carry value in and of themselves, as they signal the wealth of the owner to others (Bushman, 1993), induce pride (Bellezza and Keinan, 2014), and can represent the values and beliefs of a culture (Aaker et al., 2001). Branding clearly plays an important role in the marketplace. But how does branding affect the decision process?
There are multiple mechanisms through which brands might affect decisions. First, brands might be treated like an attribute of a product. In this case, brand labels would be evaluated separately from other attributes and provide direct support for their paired product. Alternatively, brand labels might operate indirectly, by redirecting attention to other attributes or otherwise changing how people evaluate and compare their options.
In support of the separate, direct effect of brand labels, Keller's brand equity model argues that consumers have brand associations in memory that become activated when they see those brands (Keller, 1993; Schwarz, 2004; Keller and Lehmann, 2006). In this model, familiar brands provide information that is fast and automatic because it is easily accessible in memory. In contrast, product evaluations are often slower and more effortful because they require goal-directed value construction on the spot (Castegnetti et al., 2021). Familiar brands also elicit activity in brain networks associated with affect and reward (Esch et al., 2012), supporting the idea that they provide direct evidence for their paired products.
Evidence that brands also have indirect effects on how products are evaluated comes from studies in which branding enables consumers to easily identify a product's features and benefits, which in turn increases the likelihood of purchasing (Keller and Lehmann, 2006). Schmitt (2012) suggests that there are multiple brand-related processes, including how brands affect the evaluation of products. For example, circular vs. angular logos affect product perception by activating softness vs. hardness associations, such as comfort vs. durability (Jiang et al., 2016). Other brand features such as the degree of logo symmetry (Luffarelli et al., 2019) and orientation (Zhong et al., 2018) are all related to brand-product associations. There is also a “halo effect,” where a better brand leads consumers to evaluate the associated product more favorably (Beckwith and Lehmann, 1975). Thus, brand labels may indirectly affect the way that consumers evaluate and compare the products themselves.
Eye tracking is a useful tool for gaining a better understanding of how brand information might influence the choice process. Indeed, past work has argued that eye movements help us to understand choices involving branding (Payne, 1976; Payne et al., 1988; Lohse, 1997; Pieters and Wedel, 2004, 2007; Plassmann et al., 2012). For example, Pieters and Wedel (2007) studied print ads and found that one of the most effective ways to ensure that consumers will transfer their attention to other details of an advertisement is to first ensure that they pay attention to the brand, suggesting that gaze to the brand may influence how we evaluate the option itself.
Here we leverage eye-tracking to explore the interdependence of brand labels and clothing items in the choice process. Previous research has suggested that sampling a higher-valued dimension (i.e., more favorable brand) may increase the chance of searching for other dimensions (i.e., clothing appearance) within an option (e.g., Fiedler and Glöckner, 2012). If brands function as cues to direct attention to their associated products, we will observe a positive effect of brand attractiveness on gaze toward the paired item. Similarly, we may also observe the effect from the other direction: an attractive clothing item may increase attention to the brand label.
Therefore, we test the following:
H1: consumers will gaze more at a brand label if it is associated with a higher valued product and will also gaze more at a product if it is associated with a favored brand.
In addition, brand labels may be incorporated into the decision process in other ways. For instance, the presence of brand labels might allow consumers to make their decisions more quickly. Alternatively, brands might facilitate comparison of the products by giving consumers labels to which they can mentally refer. These are just some of the ways in which brands could conceivably alter the choice process.
To investigate these possibilities, we employ process models from cognitive psychology that use measures like response times (RT) and eye movements to understand the choice process. Specifically, we use the diffusion decision model (DDM; Ratcliff, 1978; Ratcliff and Smith, 2004; Ratcliff and McKoon, 2008). The DDM is used to decompose the decision process into different processing components such as prior biases, evaluations of the options, response caution, and non-decision processes. It has traditionally been used in perception and memory, but more recently it (and other related models) has been used for preferential choice (e.g., Krajbich and Rangel, 2011; Dai and Busemeyer, 2014; Fisher, 2017; Smith and Krajbich, 2018; Amasino et al., 2019; Zhao et al., 2020).
Of particular relevance, Philiastides and Ratcliff (2013) used the DDM to study brand influence on consumer choice. They found that brand information changed the evaluation of the options, with more preferred brands leading to more positive evaluations of the options. Results of this work indicate that brand information and clothing attractiveness are integrated into a single source of evidence in the choice process. However, this study did not employ eye tracking and so could not address the questions about how brand labels may alter the choice process.
Recent research has combined computational models (i.e., DDM) and eye-tracking tools to study how gaze interacts with value-based decision making (e.g., Fisher, 2017; Gluth et al., 2018; Amasino et al., 2019; Krajbich, 2019; Yang and Krajbich, 2022). These studies have extended the DDM to include gaze as an input to the evaluation process [attentional DDM (aDDM); Krajbich et al., 2010; multi-attribute aDDM (maDDM/maaDDM); Fisher, 2021; Yang and Krajbich, 2022]. They have documented the important role of gaze in the choice process: gaze amplifies the value of the focal information. In other words, gaze temporarily increases the weight of the focal attribute/option until shifting elsewhere. These weights are similar to how more important attributes have permanently larger weights in standard utility models [e.g., weighted-additive decision rule (Keeney et al., 1993)]. This modeling framework may help us understand how the presence of brand labels (as an attribute) affects choice. For instance, brand labels may alter the way that people inspect the items (Rramani et al., 2020), or they may add support for their associated items. The mere presence of brand labels may also change the way that people approach the choice problems, perhaps altering their response caution, attentional biases, or non-decision processes. Using these gaze-based decision models, we additionally test the following hypotheses:
H2: Evaluations (i.e., drift rates) will depend on both item attractiveness and brand quality.
H3: More gaze on the brand labels will correspond to a greater probability of choosing the preferred-brand option.
Finally, in a set of more explorative analyses we test the extent to which the presence of brand labels will change the size of the option-level attention bias, response caution, or non-decision time.
In summary, we use eye-tracking and computational modeling to understand how brand labels affect the consumer choices. To preview the results, we find partial support for H1: consumers gaze longer at brand labels that are paired with attractive clothing items, but they do not gaze longer at items paired with better brands. We also find support for H2 and H3: drift rates depend on both item attractiveness and brand quality, and spending more time looking at brands correlates with the probability of choosing the preferred brand. However, the weight that people put on the brands (approximately half of the weight on item attractiveness) is higher than we would expect based on the gaze patterns alone. Additionally, the choice advantage for the longer fixated clothing items is marginally reduced in the presence of brand labels. Finally, when brands are present, people tend to exert more caution in their choices. These results indicate that the effect of brand not only manifests in the choice outcomes, but also in attentional processes and other underlying decision mechanisms.
Method
Participants
Thirty-one subjects were recruited at a large public university the University of Glasgow. All subjects were female and between 18 and 24 years of age. To prevent potential gender interactions by intermixing female and male clothing items and to avoid using separate stimuli for male and female participants (with likely different visual properties/features that could have impacted choice behavior), we recruited only female participants and tailored the stimuli to fit this cohort. The study was approved by the local ethics board. Data were collected between April and May 2014.
Stimuli
A set of 180 images of clothing items from high-street vendors (i.e., popular retail clothing stores) was obtained from the internet. Images were placed on a uniform gray background and any visible branding information (e.g., tags and labels) removed. To account for individual preferences and seasonality we included a range of items which were not specific to a particular season. In addition, 24 images of UK high-street fashion-wear logos were obtained from the Web. We purposely avoided using expensive luxury brands to minimize implicit associations with pricing during the choice task. Prior to the experiment we presented participants with a collage of all brand logos used in the experiment to ensure they were familiar with our brand selections (also see below).
Experiment paradigm
Participants initially provided preference ratings for each of the 180 items of clothing, using scales that ranged from −3 (really dislike) to 3 (really like) in increments of 1. Each item was presented in the center of the screen without branding information along with a rating slider. Participants used the arrow keys on a keyboard to move the slider and submit a preference rating. Subsequently, participants were instructed to rank-order a set of 24 brand logos based on subjective preference (1 = most preferred, 24 = least preferred). Indifference was not allowed when subjects ranked the brand logos. Based on this rank ordering, the logos were split into a more-preferred-brand group (ranks 1–10) and a less-preferred-brand group (ranks 15–24). If participants were unfamiliar with a small number of brands (< 5) we instructed them to rank them in the middle of the scale. The four logos in the middle of the scale (ranks 11–14) were removed to create a distance between the more preferred and less preferred brands and to remove any unfamiliar brands. No time limits were imposed in the rating task.
During the main task (Figure 1), we asked participants to make binary choices between two options. In the brand-present trials (Figure 1A), a clothing item with a more preferred brand was pitted against an item with a less preferred brand. The pairings of item and brand were determined by the participant's preferences in the rating task. For the brand-absent trials (Figure 1B), we used phase-scrambled versions of the original logos. Importantly, we used an independent set of clothing items in each of the brand-present and brand-absent trials to prevent participants from memorizing brand/item associations in brand-present trials and using them in brand-absent trials. Given the rating scale for the items (from −3 to 3), the difference in ratings between the two clothing items could range from −6 to 6 (for a total of 13 rating-difference conditions). Rather than using all of these possible conditions, we only used rating differences from −3 to 3, to ensure that we had enough trials per condition to obtain reliable behavioral performance as estimated from Philiastides and Ratcliff (2013). Specifically, we generated 350 unique pairings (50 trials per rating difference) for each of the labels-present and labels-absent trial types; that is 700 trials in total. In the brand-present condition, once we generated all possible pairs of clothing items and brands, we divided them into the seven rating difference levels (i.e.,−3 to +3), and then randomly selected 50 trials per level. The two blocks of trials were counterbalanced across participants. The position of the preferred-brand and less-preferred-brand items on the screen (left or right) was also randomized.
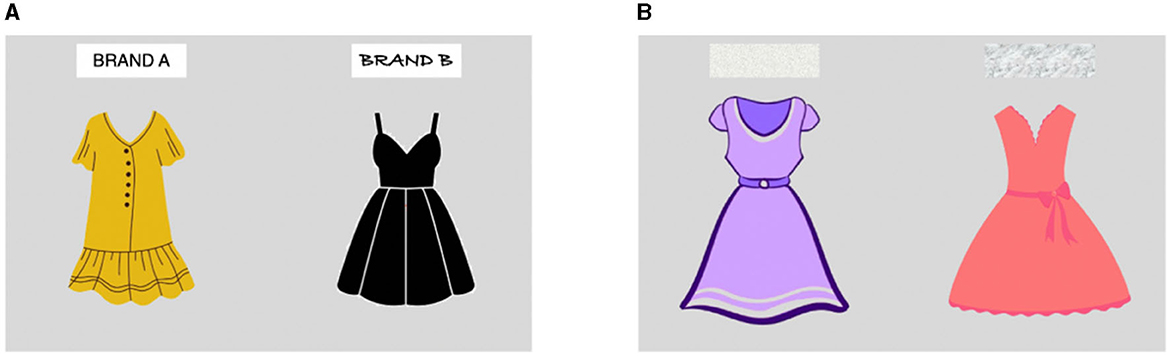
Figure 1. Choice task. The choice task contained (A) brand-present and (B) brand-absent (scrambled) conditions. Pictured here are mockup images; the study used real clothing photographs and brand labels.
Each trial started after an intertrial 1 s enforced central fixation. Participants indicated their choice by clicking either the right or the left button of a mouse, corresponding to the position of the chosen item on the screen. They had 5 s to make each choice. Items were removed from the screen as soon as a choice was made, and their offset was followed by an interstimulus interval, which lasted for 1.2 s. Eye-movement data was recorded with an EyeLink1000 eye-tracker sampled at 1,000 Hz. The main task took ~30 min to complete and the overall study was completed in under an hour.
We excluded three subjects for not choosing in line with their brand rankings. We made this determination based on a logistic regression of choice (left vs. right) on the difference in clothing ratings and brand rankings between options (left—right) for each subject. Subjects who had a positive coefficient on the brand rankings (i.e., subjects who seemed to be choosing the worse brand) were excluded.
Model fit
Before fitting the gaze-based diffusion models to the current data, we first fit the standard diffusion model used in Philiastides and Ratcliff (2013) as a baseline model to assess possible parameter differences between the two datasets (see Supplementary Analyses and Supplementary Table 1). The gaze-based models we employed were the aDDM and maaDDM mentioned above. Both aDDM and maaDDM are extensions of the DDM, which model the link between gaze and choice. The DDM is used to decompose the decision process into different processing components: drift rate represents the strength of evidence for one option over the other. In our context, it refers to how much one likes the preferred-brand option vs. the less preferred-brand option. Boundary separation represents response caution, i.e., how much net evidence one must accumulate before making a decision. Non-decision time represents other perceptual and motor processes that don't involve evidence accumulation but contribute to RT (e.g., stimulus encoding). The starting point represents any bias that was present prior to the beginning of the decision process. Specifically, in the standard DDM there are two choice options: the option with the more-preferred (Option 1) and less-preferred (Option 2) brand label. Each option has an underlying subjective value ri. These values determine the rate at which evidence is accumulated for each option; the higher the value, the more evidence is accumulated. At each moment in time, the subject samples a piece of evidence si for each option and takes the difference between them. These samples are distributed . This net evidence is then added to the cumulative total up to that point in time. This cumulative net evidence, which we refer to as the relative decision value (Vt), evolves over time until it reaches a predetermined threshold value of a or 0, indicating a choice for the more-preferred-brand (Option 1) or less-preferred-brand option (Option 2), respectively. We can write down a difference equation for this process as follows:
where d is a free parameter controlling the rate of evidence accumulation (i.e., drift rate v) and ε is a normally distributed random variable with mean 0 and variance σ2, where σ is a fixed constant in this paper (σ = 1).
With the aDDM, we additionally assume that the drift rate depends on where the subject is looking. In particular, we assume that the rate of evidence accumulation for the non-fixated option is discounted by a factor θ (this is mathematically equivalent to increasing the weight on the fixated option). So, when the subject is looking at Option 1 we have:
and when the subject is looking at Option 2 we have:
Now, to extend the aDDM to multi-attribute choice we allow ri to be a vector, with each element representing the subjective value of option i on attribute j. In this context, we let ra be the rating of the clothing item, and rb be the rating of the brand label. As before, we assume that the rate of evidence accumulation for the non-fixated option is discounted by a factor θ. We now also assume that the rate of evidence accumulation for the non-fixated attribute is discounted by a factor ϕ. So, for instance, if the subject is looking at Option 1′s clothing item we have:
Note that in this case there are four possible drift rates, depending on the fixated option and attribute.
To account for possible attribute weights that are not linked to gaze, an additional parameter ω is added to the model. Here, we assume that ω is the weight on the brand label, and 1−ω is the weight on the clothing item. This weight is not affected by the gaze location. In other words, when looking at Option 1′s clothing item the drift rate is:
and when looking at Option 1′s brand label the drift rate is:
In this version of the model, the non-fixated option of the non-fixated attribute gets a discount factor θϕ (Yang and Krajbich, 2022). For robustness, we estimate a version of the model where this discount parameter is a free parameter γ. To estimate the model, we approximate the dynamic multi-stage drift rate with a single constant drift rate by using gaze-weighted attribute values (see Supplementary Methods). This approximation facilitates model fitting, has little impact on parameter recovery (Smith et al., 2019; Yang and Krajbich, 2022), and has been used in several other studies (Cavanagh et al., 2014; Smith and Krajbich, 2019; Westbrook et al., 2020; Thomas et al., 2021).
The RT on trial i follows the Wiener first passage time distribution
where a is the boundary separation, ndt is the non-decision time, z is the starting-point bias, and v is the drift rate. We fix z at 0.5a in all the models, assuming no starting-point bias toward the more-preferred-brand or less-preferred-brand option. We employed this simplifying assumption after finding no starting-point bias with the standard DDM (from Philiastides and Ratcliff, 2013; see Supplementary Table 1). The other parameters were freely estimated.
Because hypotheses 2–3 and the exploratory analyses presented earlier are related to the above-mentioned model, here we rewrite those hypotheses based on the model parameters:
H2: Evaluations will depend on both item attractiveness and brand quality. That is, the drift rate is a function of both item attractiveness (ra) and brand quality (rb). Therefore, the attribute weight ω on the branding label is larger than zero.
H3: More gaze on the brand labels will correspond to more choice of the preferred-brand option. That is, when subjects are dwelling on the brand labels, they will accumulate more evidence on the brand dimension than the item attractiveness dimension. Therefore, the attribute attentional discount factor ϕ is smaller than one.
Exploratory analyses: Option-level attentional discount factor (θ), response caution (a), or non-decision time (ndt) are different when brands are present vs. absent.
Results
Basic choice behavior
Before testing our hypotheses, we conducted two standard checks of the DDM: subjects' choices aligned with the item ratings and brand rankings (Figure 2A; Supplementary Analysis 3), and subjects' RT decreased with strength of preference (Figure 3A; Supplementary Analysis 3).
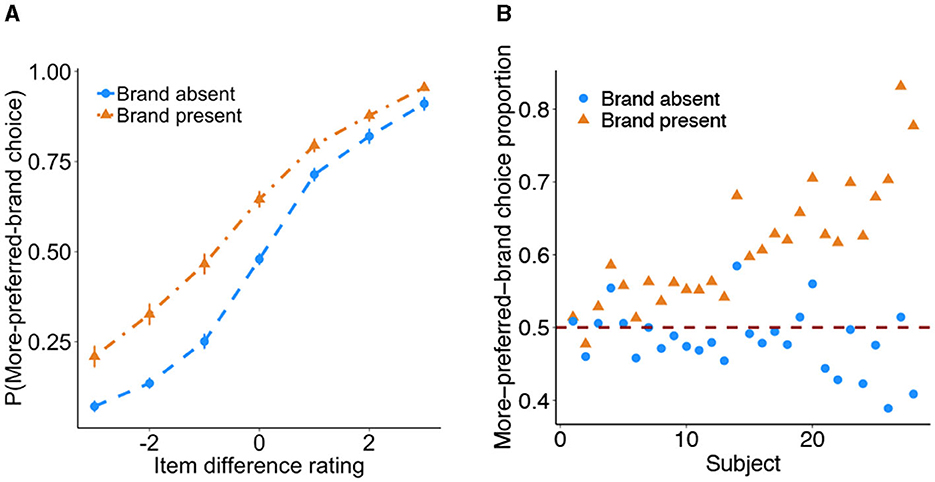
Figure 2. Choices depend on both clothing attractiveness and brand labels. (A) The probability of choosing the option with the more preferred brand as a function of the item rating difference. The item rating difference is computed as the more preferred brand item's rating minus the less preferred brand item's rating. Bars are s.e.m. (B) The average probability of choosing the option with the preferred brand, at the subject level. Subjects are ordered by the size of the difference in the better brand choice proportion between the brand-present and brand-absent conditions.
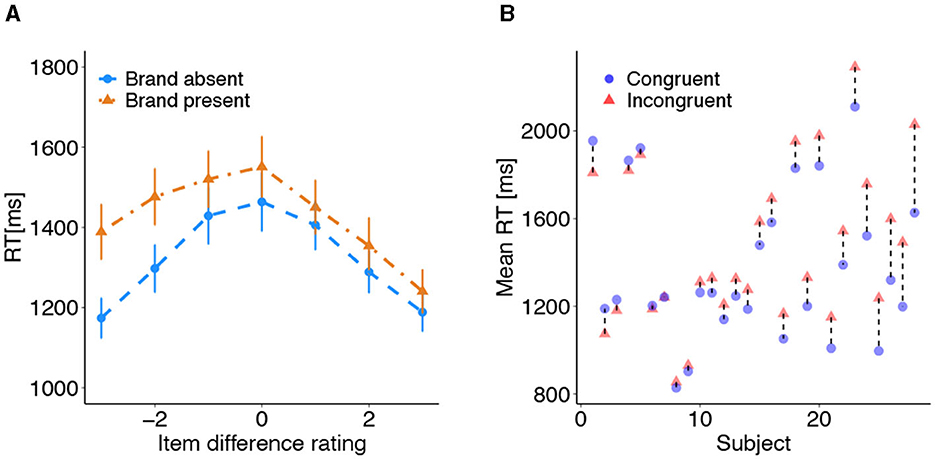
Figure 3. Reaction times (RT) depend on both clothing attractiveness and brand labels. (A) RT as a function of the item rating difference. The item rating difference is computed as the more preferred brand item's rating minus the less preferred brand item's rating. Positive differences correspond to congruent trials while negative differences correspond to incongruent trials. Bars are s.e.m. (B) The average RT (congruent trials vs. incongruent trials), at the subject level. Subjects are ordered on the x-axis by the relative size of the difference in mean RT between the congruent and incongruent conditions.
In addition, we found that being paired with the preferred brand increased choice probability by an average of 12.8% [paired t-test, t(27) = 7.32, p = 10−8, Cohen's d: 1.38, Figure 2B]. When comparing trials where the preferred item was paired with the preferred brand (congruent trials) to the trials where the preferred item was paired with the least preferred brand (incongruent trials), we found that incongruent trials were significantly slower [paired t-test, t(27) = 4.03, p = 10−4, Cohen's d = 0.76], with an average difference of 95 ms (Figure 3B).
Basic gaze properties
We first considered how total dwell time was allocated between the clothing items and the brand labels in the brand-present condition. In the brand-absent condition, subjects had a mean of 2.82 dwells (SD = 1.07) while in the brand-present condition they had a mean of 3.13 dwells (SD = 1.41).
In terms of total dwell time, subjects spent 6% (SD = 41%) on the brands, and in terms of the number of dwells, subjects also spent 6% (SD = 41%) on the brands. After excluding trials where neither brand was looked at, subjects spent 24% (SD = 16%) of the time looking at the brands, and in terms of the number of dwells, subjects spent 33% (SD = 12%) on the brands. Both numbers were nearly identical depending on whether the trial was congruent or incongruent (Figure 4B). In summary, we found little difference in dwell time on clothing as a function of whether brands were present or absent.
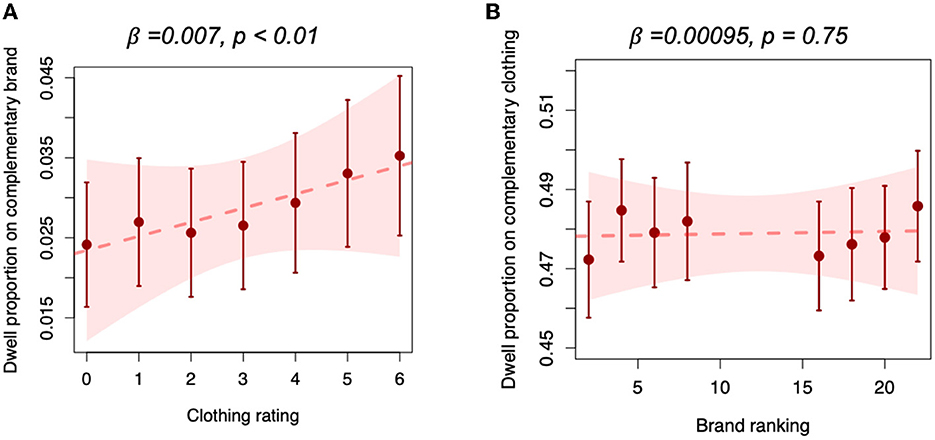
Figure 4. The effect of attribute value on complementary gaze proportions. (A) The proportion of total dwell time allocated to a brand label as a function of the paired clothing item's rating. (B) The proportion of total dwell time allocated to a clothing item as a function of the paired brand's ranking. Bars are s.e.m. The red bands represent the 95% confidence intervals for the regression lines.
To test our first hypothesis (H1), we investigated whether the attractiveness of the brands affected gaze allocation to the clothing items, or conversely, whether the attractiveness of the clothing items affected gaze allocation to the brands. If brands function as cues to direct attention to their products, we should observe a positive effect of brand attractiveness on gaze toward the paired item. We observed no such effect in our data, based on a mixed-effects regression of log(dwell proportion) for a clothing item as a function of the associated brand ranking (β = 0.00095, p = 0.75; Figure 4B). We did find the opposite effect. Using an analogous mixed-effects regression, we found a positive effect of clothing rating on log(dwell proportion) for the paired brand (β = 0.007, p = 0.0002; Figure 4A). In summary, we found that how subjects attended to the brands depended on the value of the clothing items, but not vice versa.
Model fitting results
As noted in the method section, we first fit the standard DDM used in Philiastides and Ratcliff (2013) to examine potential differences between their dataset and ours (see Supplementary Analyses). In short, we did not find a starting point bias toward the more- or less-preferred-brand option [Brand absent: t(27) = −0.81, p = 0.42, Cohen's d = 0.15; Brand present: t(27) = −1.01, p = 0.32, Cohen's d = 0.19]. We also found no difference in non-decision time between the brand-present and brand-absent conditions [t(27) = −1.69, p = 0.10, Cohen's d = 0.32]. However, we found that boundary separation was significantly, though only slightly higher in the brand-present condition than in the brand-absent condition [t(27) = 3.30, p = 0.003, Cohen's d = 0.62].
For the gaze-based models, we fit the aDDM to the brand-absent condition, and the maaDDM to the brand-present condition (see Table 1 for the group-level parameter estimates). We then compared the model parameters between the brand-absent and brand-present conditions to test our remaining hypotheses.
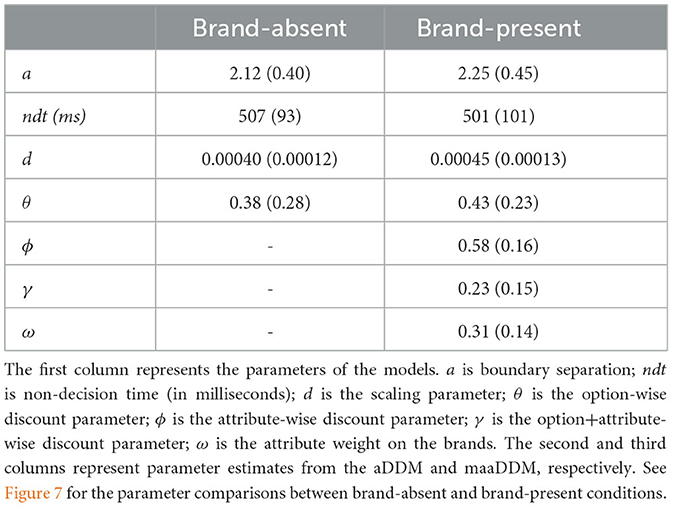
Table 1. Model results: means and SDs (in parentheses) of parameter values from the gaze-based DDMs.
To test our second hypothesis (H2) we examined the parameter ω in the maaDDM. This parameter captures the weight on the brands in the drift rates. We expected ω>0. Indeed, we found ω = 0.31, indicating a substantial weight on the brand rankings in these decisions. However, item attractiveness and brand quality do not equally contribute to the drift rate: the average weight on the brands (ω = 0.31) was just less than half of that on the clothing ratings.
To test our third hypothesis (H3) we examined the parameter ϕ in the maaDDM. This parameter captures the gaze discount factor on the non-fixated attribute. We expected ϕ < 1. Indeed, we found ϕ = 0.58, indicating substantial attribute level gaze discounting. The weight on the non-fixated attribute was just more than half of that on the fixated attribute.
We further investigated the attribute-level prediction of the maaDDM, which is that consumers will be more likely to choose the option with the better brand, the more time they spend looking at the brands. Here we ran a mixed-effects logistic regression of choose Option 1 as a function of absolute brand label value difference, clothing item value difference (relative to brand label's value, i.e., positive when it is in line with the brand label), and gaze proportion on brand labels. The coefficient on gaze proportion was positive (β = 0.079, p = 0.0096; Figure 5A). The attribute level prediction suggests that a 100% increase in gaze proportion on the brand is associated with an ~8.2% increase in the odds of choosing the preferred-brand option.
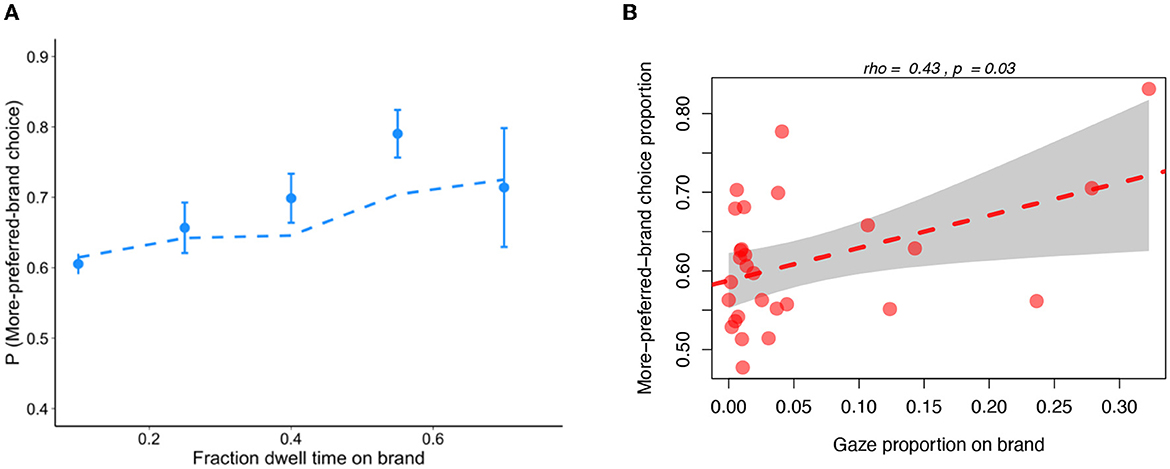
Figure 5. Relationship between attribute-level gaze and choice. (A) Choice as a function of relative gaze to the brand vs. the clothing items. Dashed lines are maaDDM fits. Bars are s.e.m. (B) Across-subject correlation between attention to brands and choices in line with brand rankings using all trials. Each dot is one subject. The gray band represents the 95% confidence interval.
The maaDDM accurately captured the size of this effect across subjects (Supplementary Figure 2). Moreover, we find that subjects who spent more time overall on the brands were more likely to choose the item with the better brand (more-preferred brand choice proportion as a function of gaze proportion on brands (using all trials): [r(28) = 0.43, p = 0.03; Figure 5B].
In a more exploratory set of analyses we examined the other parameters in the aDDM and maaDDM. Specifically, we examined the boundary separation a, non-decision time ndt, drift-rate multiplier d, and the option-level gaze discounting factor θ (Figure 6).
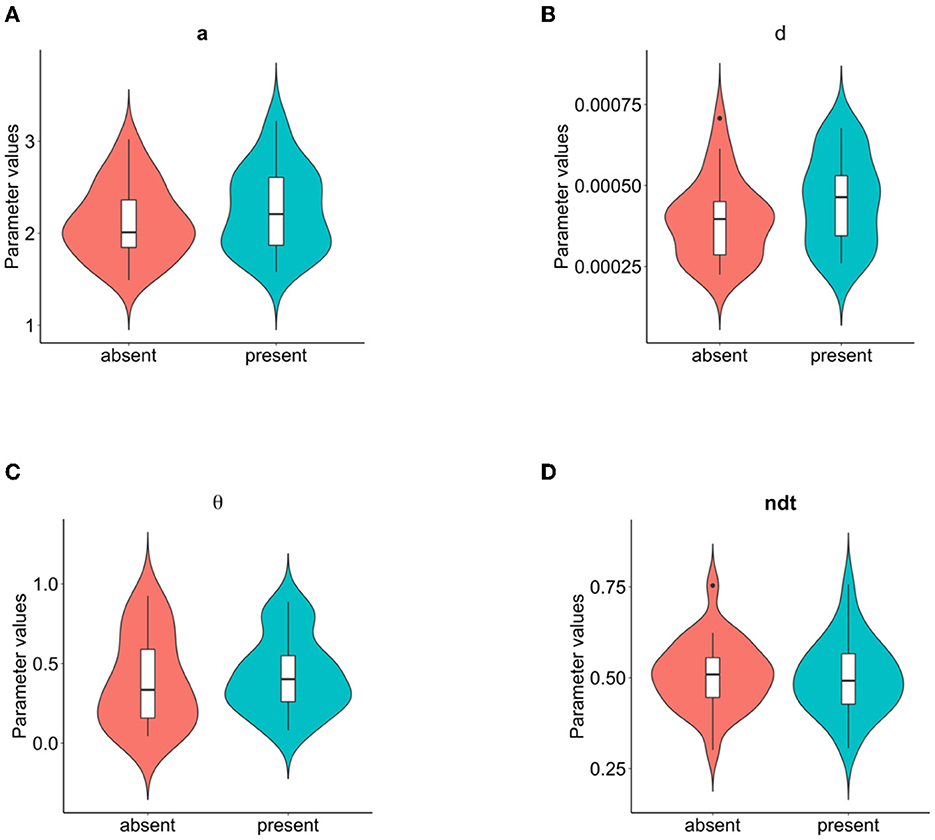
Figure 6. Best fitting model parameters by condition. (A) Boundary separation, (B) drift rate multiplier, (C) option-wise discounting parameter, and (D) non-decision time. See mean parameter values in Table 1.
The most noticeable difference was in the boundary separation parameter a, which was significantly lower without the brands [t(27) = −4.81, p = 10−5, Cohen's d = 0.92; Figure 6A]. This result is also consistent with the boundary separation estimated with the standard DDM (Supplementary Table 1). The option-level attentional discount θ was marginally lower without the brands [t(27) = −1.12, p = 0.055, Cohen's d = 0.31; Figure 6C]. There was no significant difference in the non-decision time between conditions [t(27) = 0.68, p = 0.49, Cohen's d = 0.13; Figure 6D].
We found that the drift-rate multiplier d was also significantly smaller without the brands [t(27) = −3.72, p = 10−4, Cohen's d = 0.71; Figure 6B]. However, this result is difficult to interpret because drift rate is a product of d and the gaze-weighted ratings, which themselves differ across conditions. To provide a better sense of whether the drift-rate magnitudes differed between conditions, we turned to the standard DDM (Supplementary Table 1). In that model, a separate drift rate is estimated for each difference in the clothing item ratings. Consistent with Philiastides and Ratcliff (2013), we found that drift rates actually differed more across the rating-difference levels for the brand-absent trials compared to the brand-present trials. Thus, the difference in d does not actually indicate the expected difference in drift rates, because the drift rates are functions of different variables across conditions.
We next examined if any of the differences in parameter values were related to behavioral measures. The first key question is whether subjects who spent more time looking at the brand labels in the brand-present condition needed more time to decide (i.e., higher boundary separation). Because a was highly correlated between conditions (as were other parameters, Figures 7A–D), we examined the change in a (brand present – brand absent) as a function of mean brand gaze proportion, across subjects. We found that change in a and mean brand gaze proportion were strongly correlated [Pearson/Spearman, r(28) = 0.77/0.65, p = 10−6/10−4, Figure 8A; Supplementary Table 2]. However, one potential issue with this analysis is that there were many trials where subjects did not look at either brand at all (M = 23% trials per subject, SD = 27%). As a robustness check, we excluded all such trials, and then recomputed each subject's mean brand gaze proportion across the remaining trials. This measure of brand attention still correlated strongly with differences in a [Pearson/Spearman, r(28) = 0.76/0.68, p = 10−6/10−3; Figure 8B; Supplementary Table 2]. These results indicate that subjects who placed more emphasis on the brands in their brand-present choices, required more evidence in those trials (i.e., they were exercising more caution).
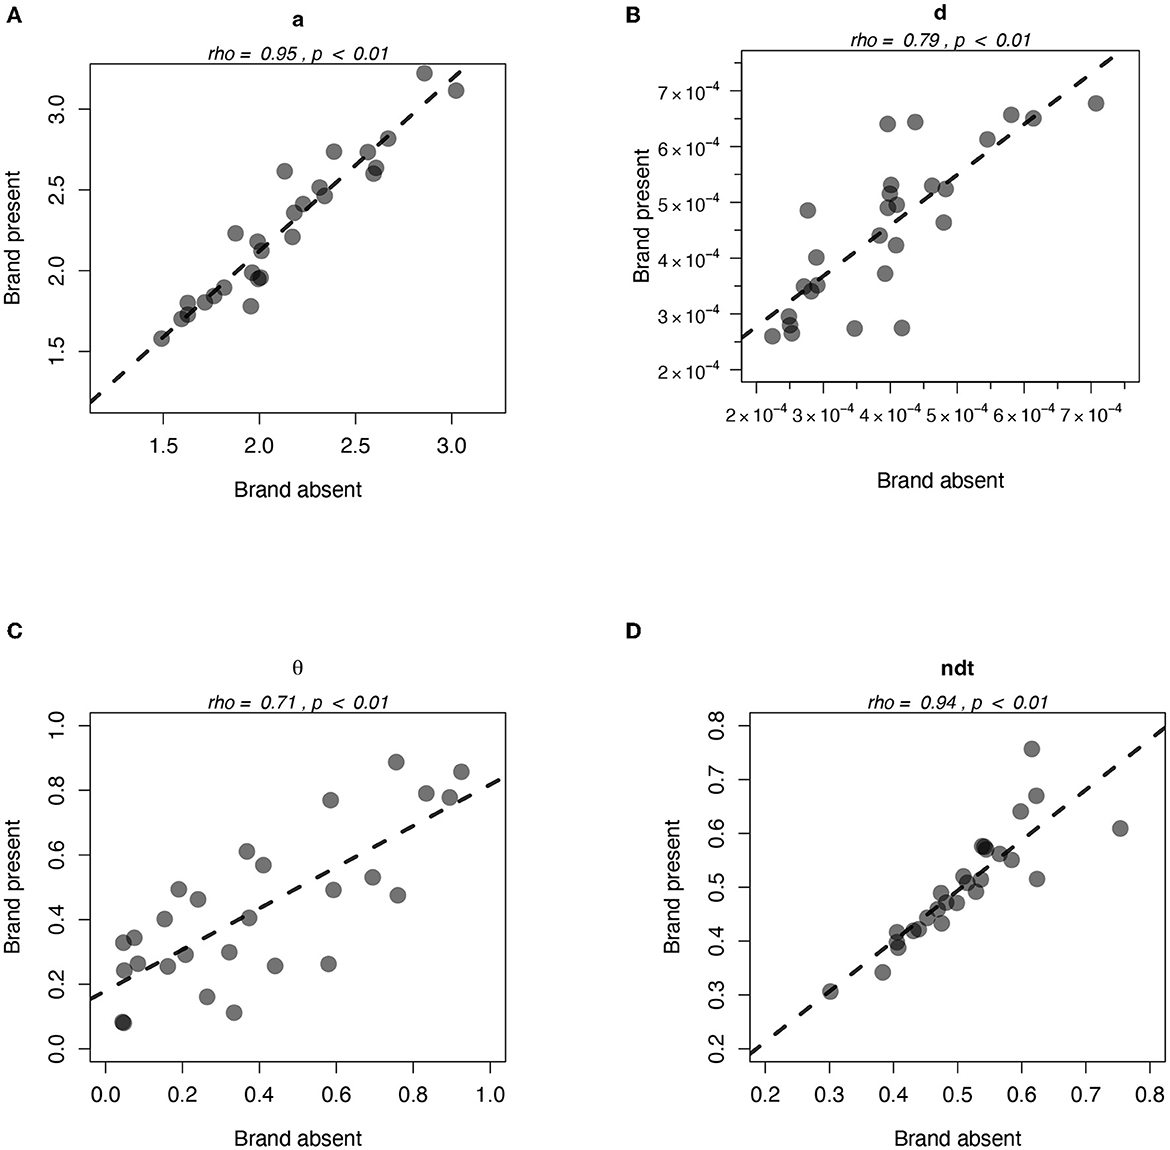
Figure 7. Relations between best-fitting model parameters by condition. (A) Boundary separation, (B) drift rate multiplier, (C) option-wise discounting parameter, and (D) non-decision time. Each dot is one subject.
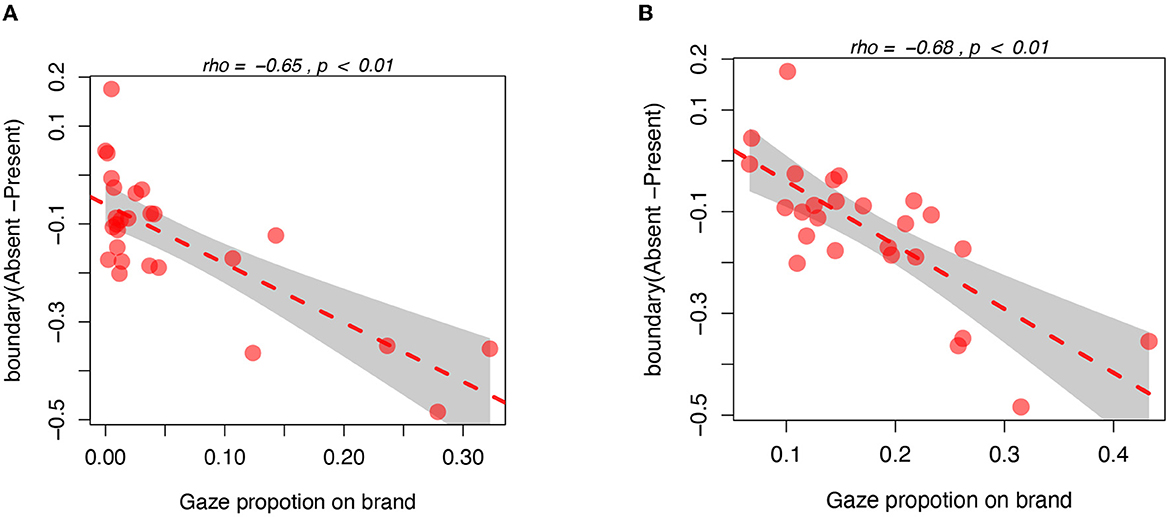
Figure 8. Relations between each subject's mean gaze proportion on the brand (brand-present condition) and their change in boundary separation according to the models. (A) Using all trials. (B) Excluding trials where neither brand was fixated. Each dot is one subject. The gray bands represent the 95% confidence intervals for the predicted values.
Interestingly, we also found that dwell time on the brands was positively correlated with the difference in θ going from the brand-absent to brand-present condition [using all trials: Pearson/Spearman, r(28) = 0.32/0.32, p = 0.04/0.09; using partial trials: Pearson/Spearman, r(28) = 0.38/0.33, p = 0.05/0.09; Supplementary Table 2]. In other words, subjects who allocated more gaze to the brands were also less affected by option-level gaze allocation in their choice outcomes.
The second key question is whether subjects who allowed themselves more time (i.e., wider boundaries) when brands were present, were more likely to have a branding bias in choice. We answered this question by computing each subject's probability of choosing the clothing item paired with the preferred brand. We found that this probability was marginally correlated with the increase in boundary separation from the brand-absent to the brand-present condition [Pearson/Spearman: r(28) = 0.31/0.17, p = 0.08/0.25; Supplementary Table 2], providing some evidence that those individuals with wider boundaries chose more in line with the brands.
We also observed a significant correlation between choosing the item with the preferred brand and the increase in θ from the brand-absent to the brand-present condition [Pearson/Spearman r(28) = 0.42/0.41, p = 0.028/0.034; Supplementary Table 2]. Consistent with the gaze result above, subjects whose choices were more influenced by the brands were also less affected by option-level gaze allocation.
Together, these results suggest that when brand information is present, subjects who paid more attention to the brands and thereby made choices more in line with the brands, were less affected by option-level gaze allocation in their choice and may have increased their boundaries more.
Correlation between parameter differences
Based on these results, we asked whether the discounting effects are related to boundary adjustments. In other words, we examined whether subjects with larger boundary adjustments were also the ones with larger changes in option-level attentional discounting. We found a significant correlation between a differences (present - absent) and θ differences (present - absent) [Pearson/Spearman r(28) = 0.37/0.50, p = 0.06/0.008; Supplementary Table 2], implying that a larger increase in the boundaries corresponds to being less affected by option-level gaze allocation.
Relation between gaze and choice
Last, we turn to the key predictions of the attentional DDM. The basic aDDM makes two key predictions about the relationship between gaze and choice. The first prediction is that people will tend to choose the option that they look at last, except when the last-seen option is substantially worse than the alternative. Turning to the data, we see that this prediction was confirmed in both brand-absent and brand-present conditions. Controlling for clothing rating difference, subjects were more likely to choose the option they looked at last (Figures 9A, B). When the two clothing images were equally liked, subjects chose the last-seen option 71.9/72.0% of the time when brands were absent/present, consistent with prior work (Krajbich, 2019).
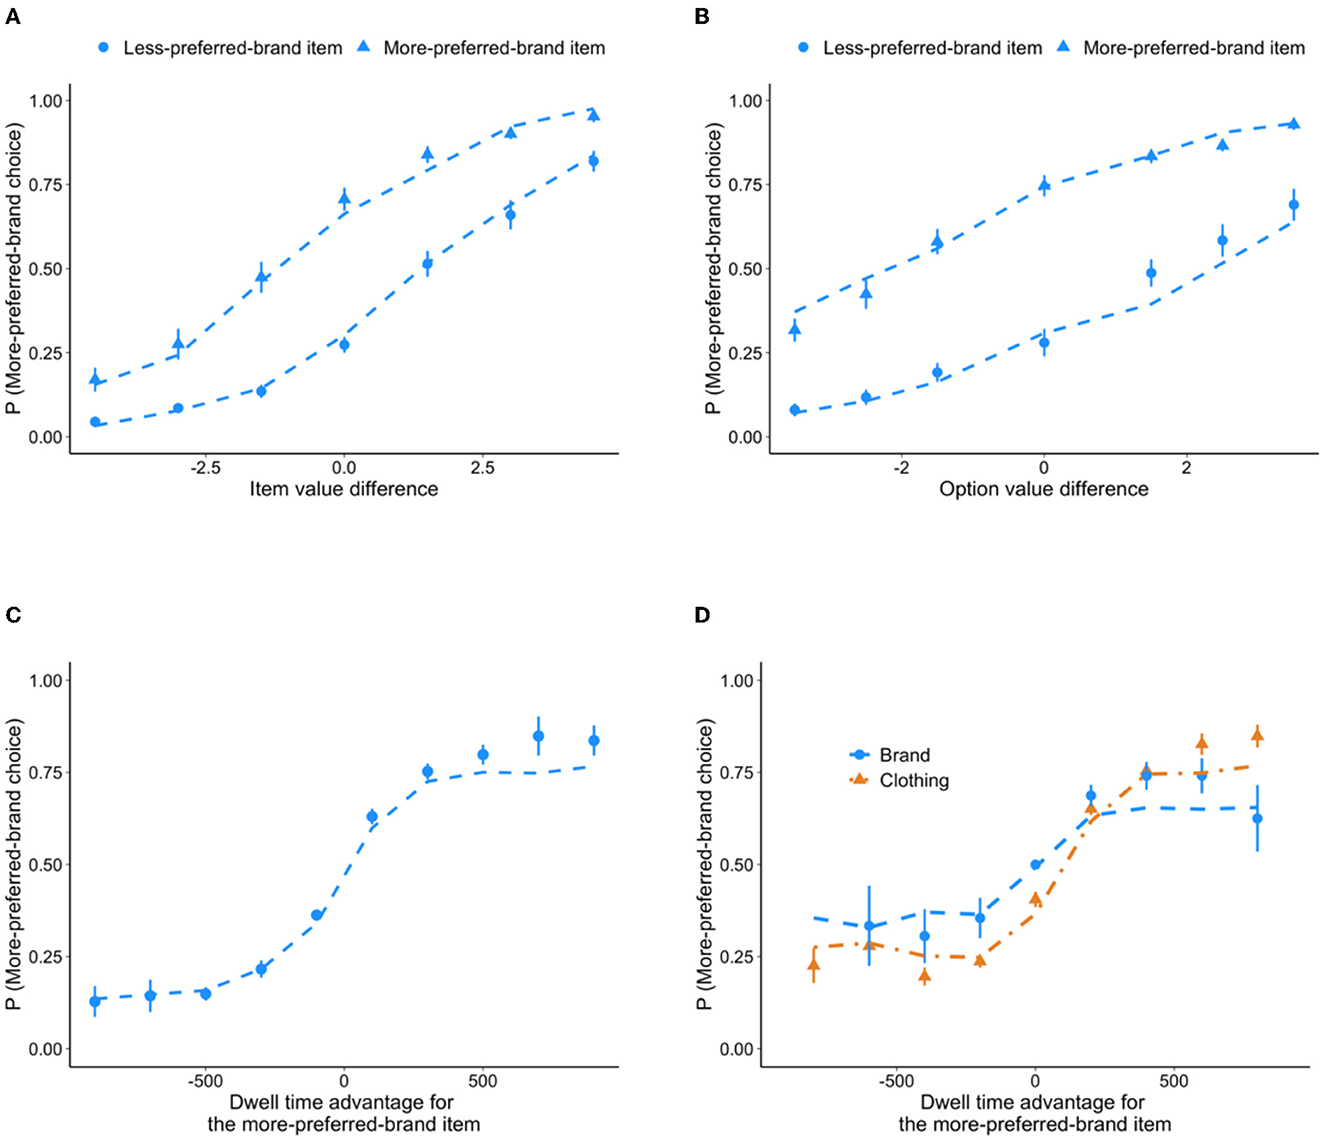
Figure 9. Relationships between option-level gaze and choice. (A, C) Brand absent. (B, D) Brand present. (A, B) Choice as a function of clothing rating or option value difference (left—right), split by last fixation location. (C, D) Choice as a function of total dwell time (left—right) on an attribute. Dashed lines are (ma)aDDM fits. Error bars are s.e.m.
A second prediction of the aDDM is that people will tend to choose the option that they look at most over the course of the decision. To test this, we ran a mixed effects logistic regression of choosing Option 1 as a function of clothing item value difference and dwell time difference between Options 1 and 2. Note that when brands were present, we considered dwell time differences for clothing and brands separately. Again, the data confirmed this prediction, showing a significant relationship between relative dwell time and choice probability in both conditions [absent: β = 1.35, p < 10−16; present: β(clothing) = 1.22, p < 10−16; β(brand) = 0.29, p = 10−16; Figures 9C, D].
Note that the maaDDM did fit slightly worse when only considering dwells on the brand labels (Figure 9D). This is likely because gaze was mostly allocated to the clothing items, leading to high variability in the tails of the brand dwell-time distributions. Considering all dwells, the aDDM and maaDDM both accurately captured the strength of the relationship between dwell time and choice across subjects (Supplementary Figure 1).
Discussion
In this study we compared consumer clothing choice in the presence or absence of brand labels. We found evidence that brands provide both direct and indirect support for their paired items. We found that overt attention (gaze) to brand labels correlates with the weight that consumers put on brands in their choices, suggesting that brand labels are evaluated separately from the clothing items and provide direct support for choices. We also found that gaze to brand labels partly depends on the value of their associated clothing items, but not vice versa, indicating that brand labels may also affect choices indirectly via attention reallocation. While brands are looked at less than items, they do still have a substantial impact on choice. This work aligns with previous research demonstrating the importance of attention in multi-attribute choices (e.g., Payne, 1976; Payne et al., 1978, 1988; Reutskaja et al., 2011; Fiedler and Glöckner, 2012; Diederich and Oswald, 2014; Fisher, 2017, 2021; Reeck et al., 2017; Amasino et al., 2019; Glickman et al., 2019; Rramani et al., 2020).
Our result linked to the first hypothesis indicates that a preferred brand doesn't necessarily lead consumers to pay more attention to the associated clothing item. This finding deviates from the typical halo effect, where a more-preferred brand tends to enhance the evaluation of a less-preferred product. However, here we are measuring gaze and not preference. It is possible that good brands increased the value of their paired items, but without redirecting gaze.
To model the decision process in this study, we employed sequential sampling models, in particular the attentional drift diffusion model (aDDM; Krajbich et al., 2010) and its multi-attribute generalizations (maDDM; Fisher, 2021; maaDDM; Yang and Krajbich, 2022). Unlike in earlier work with this paradigm (Philiastides and Ratcliff, 2013), in which no differences in boundaries were found, here we found that subjects exerted slightly more caution (i.e., had wider boundaries) when brand labels were present. Given the blocked design, subjects had plenty of opportunity to adjust their boundaries. Note that subjects could only view the options for a maximum of 1,750 ms in the previous study (and mean RTs were in the 650–750 ms range) but were allowed more time in the current study (up to 5 s). This suggests that under time pressure branding effects are more likely to manifest in drift rates, while with increased deliberation time other effects may emerge, such as changes in boundary separation. These additional changes in boundary separation may then lead to the other attentional effects we observed in the present study. For example, the attentional discount on the unattended option was marginally stronger when brand labels were absent than when they were present. These results are discussed in more detail below.
Our results indicate that the weight that consumers put on brand labels in their choices is more than one would expect based on how long they look at the labels. Specifically, the gaze model fits indicate that consumers put around 30% weight on brands (compared to 70% on the products), after accounting for attention; while the total dwell times would suggest that consumers put around 6% attention on brands. This indicates that brand information may be processed more efficiently (or automatically) than product attractiveness, possibly due to strong prior associations with the familiar brands, or that brands are easier to think about when looking at the items. Consumers may need time to process the product information but be able to easily retrieve brand information from memory. Therefore, they may not need to allocate much gaze time toward brands to extract the relevant information. We know that higher brand accessibility boosts the impact of those brands on behavior (Hoyer and Brown, 1990). We also know that consumer products with higher accessibility are more likely to be chosen, controlling for their attractiveness (Gwinn and Krajbich, 2020). Future research could measure brand accessibility and include it in the drift rate formulation. For example, one could use a multi-attribute, time dependent DDM (mtDDM; Maier et al., 2020; Sullivan and Huettel, 2021) to study how brand accessibility influences the latency with which that attribute enters the drift rate. Nonetheless, the current results suggest that companies and institutions may want to place special emphasis on brand design and awareness to promote strong associations with their brands (Philiastides and Ratcliff, 2013). On the other hand, our finding that clothing attractiveness affects attention to the brand, but not vice versa, suggests that companies should not neglect the important role of product attractiveness on brand perception.
Another interesting finding is that the attentional discount on the options seems to decrease when there is more information, i.e., when brands are present. Intuitively, one would think that when there is more information on the screen, attention would be more divided and so the attentional discount would worsen, not improve. One possible explanation for this effect is that it is easier to evaluate two brands at the same time than it is to evaluate two clothing items at the same time. In the maaDDM, θ corresponds to the discount factor on the other option, within the same attribute. Thus, θ in the maaDDM reflects the average option-level discount factor across the two attributes. If it is easier to evaluate two brands in parallel, that would mean a higher θ for the brand labels, and thus a higher θ overall. We found some evidence for this possibility: subjects who spent more time looking at the brands displayed a larger increase in θ from brand-absent to brand-present conditions. Another possible explanation for this effect is that subjects also seemed to exert more response caution when brands were present. Perhaps people widen their attentional scope by taking more time to evaluate the options. We found some evidence for this as well, as subjects with larger boundary increases also showed larger θ increases from brand-absent to brand-present conditions.
The links that we have identified between boundary separation and attention to the brands suggest the possibility that encouraging consumers to spend more time on their choices could increase (rather than decrease) their reliance on brand labels. This is a counterintuitive prediction if one thinks of relying on brand labels as a heuristic to avoid properly evaluating the clothing items themselves. Alternatively, it is also possible that consumers may initially intend to integrate information across all attributes but when it comes to more difficult decisions, they might place more emphasis on the brands. Those possibilities should be investigated in more detail in future research.
Our results suggest that branding likely influences the decision-making process at multiple levels. The subjective evaluations of decision options have been shown to be represented in the ventromedial prefrontal cortex (vmPFC), orbitofrtonal cortex (OFC), striatum, and posterior cingulate cortex (Bartra et al., 2013; Clithero and Rangel, 2014). These regions have also been shown to reflect the rate of evidence accumulation in the DDM (Basten et al., 2010; Philiastides et al., 2010; Hare et al., 2011; Gluth et al., 2012; Rodriguez et al., 2015). Thus, it seems likely that brand associations are combined with clothing attractiveness judgments in this reward network, to drive the accumulation of evidence. At the same time, the actual accumulation of evidence has been shown to occur in more dorsal, lateral, and posterior regions of the PFC, as well as in parietal cortex (Philiastides et al., 2010; Rodriguez et al., 2015; Pisauro et al., 2017). The additional branding effects on boundary separation (i.e., response caution) and attentional biases might therefore indicate that brands exert a direct influence on activity in these accumulator regions (Arabadzhiyska et al., 2021).
While the correspondence between gaze and weight on the brands is not one-to-one, eye-tracking data does provide a useful metric for predicting how much a given person will be influenced by brand information in their choices. This is consistent with work that has shown that consumers' eye movements can reflect their attention, and further leads to perceptions about brand attractiveness (Pieters and Warlop, 1999). For example, Mundel et al. (2018) found that subjects looked longer at branded items compared to unbranded items, though their probability of purchasing a product didn't vary with the presence/absence of brands. Another line of research relates attention to brand recall (Peters and Bijmolt, 1997; Rosbergen et al., 1997; Wedel and Pieters, 2000). For example, Wedel and Pieters (2000) modeled eye-fixations to advertisements and their effect on subsequent memory for the brands. They suggested that fixations to a brand promote accurate brand memory. This research provides an account of the processing that takes place to store brand information in memory. Future research should consider the strength of brand memory in the decision-making process.
In behavioral economics, overt attention has been recognized as a crucial part of the choice process across various contexts, including individual decision making under uncertainty (Arieli et al., 2011; Glöckner and Herbold, 2011; Sheng et al., 2020), consumer choice (Armel et al., 2008; Reutskaja et al., 2011), intertemporal choice (Amasino et al., 2019), social preferences (Fiedler et al., 2013; Teoh et al., 2020), strategic decisions (Hristova and Grinberg, 2005; Wang et al., 2010; Polonio et al., 2015; Chen and Krajbich, 2017; Hausfeld et al., 2021), and familiarity in financial decision making (Chew et al., 2008; Hüsser and Wirth, 2014). In line with that work, our study demonstrates the important role of visual attention in shaping the choice process. Specifically, we demonstrate how overt attention reveals choice dynamics in multi-attribute consumer choice. However, one limitation of our study, relative to many of those above, is that the task was hypothetical. Ideally subjects would have been making real choices but that would not have allowed us to independently manipulate clothing attractiveness and brand.
Previous research in the consumer choice literature has examined the individual effects of branding and product characteristics on consumers' willingness to pay for energy drinks (Lewis et al., 2016). Additionally, other studies have explored the influence of brand placement and positioning on consumer choices using eye-tracking (e.g., Husić-Mehmedović et al., 2017). However, our study makes a unique contribution to the literature by investigating the separate (and interactive) effects of branding and product characteristics on consumer choice.
In conclusion, eye tracking and computational modeling provide useful insights into how consumers integrate item attractiveness and brand information into their choices. Consumers attend to both pieces of information but tend to focus more on item attractiveness than brand quality. Due to limited attention capacity, these attentional patterns correspond (roughly) to the behavioral weights that they put on these factors in their decisions.
Data availability statement
The raw data supporting the conclusions of this article will be made available by the authors, without undue reservation.
Ethics statement
The studies involving humans were approved by University of Glasgow Ethics Committee. The studies were conducted in accordance with the local legislation and institutional requirements. The participants provided their written informed consent to participate in this study.
Author contributions
IK: Conceptualization, Investigation, Methodology, Supervision, Writing – original draft. XY: Investigation, Methodology, Software, Writing – original draft. CR: Conceptualization, Methodology, Writing – review & editing. RR: Conceptualization, Investigation, Methodology, Writing – review & editing. MP: Conceptualization, Investigation, Methodology, Project administration, Supervision, Writing – original draft.
Funding
The author(s) declare financial support was received for the research, authorship, and/or publication of this article. IK gratefully acknowledges financial support from National Science Foundation Grant No. 2148982 and from the Cattell Sabbatical Foundation. RR gratefully acknowledges financial support from National Institutes of Health R01-AG057841 and R01-AG041176. MP gratefully acknowledges financial support from the European Research Council (865003; MP) and the Biotechnology and Biological Sciences Research Council (BB/J015393/2; MP).
Conflict of interest
The authors declare that the research was conducted in the absence of any commercial or financial relationships that could be construed as a potential conflict of interest.
The author(s) MP and CR declared that they were an editorial board member of Frontiers, at the time of submission. This had no impact on the peer review process and the final decision.
Publisher's note
All claims expressed in this article are solely those of the authors and do not necessarily represent those of their affiliated organizations, or those of the publisher, the editors and the reviewers. Any product that may be evaluated in this article, or claim that may be made by its manufacturer, is not guaranteed or endorsed by the publisher.
Supplementary material
The Supplementary Material for this article can be found online at: https://www.frontiersin.org/articles/10.3389/frbhe.2023.1274815/full#supplementary-material
References
Aaker, J. L., Benet-Martinez, V., and Garolera, J. (2001). Consumption symbols as carriers of culture: a study of Japanese and Spanish brand personality constucts. J. Personal. Soc. Psychol. 81, 492–508. doi: 10.1037/0022-3514.81.3.492
Amasino, D. R., Sullivan, N. J., Kranton, R. E., and Huettel, S. A. (2019). Amount and time exert independent influences on intertemporal choice. Nat. Hum. Behav. 3, 383–392. doi: 10.1038/s41562-019-0537-2
Anand, B. N., and Shachar, R. (2004). Brands as beacons: a new source of loyalty to multiproduct firms. J. Market. Res. 41, 135–150. doi: 10.1509/jmkr.41.2.135.28670
Arabadzhiyska, D. H., Garrod, O. G. B., Fouragnan, E., Luca, E. D., Schyns, P. G., and Philiastides, M. G. (2021). A common neural currency account for social and non-social decisions (p. 2021.10.18.464762). BioRxiv. doi: 10.1101/2021.10.18.464762
Arieli, A., Ben-Ami, Y., and Rubinstein, A. (2011). Tracking decision makers under uncertainty. Am. Econ. J. 3, 68–76. doi: 10.1257/mic.3.4.68
Armel, K., Beaumel, A., and Rangel, A. (2008). Biasing simple choices by manipulating relative visual attention. Judgment Decision Mak. 3, 396–403. doi: 10.1017/S1930297500000413
Ataman, M. B., Van Heerde, H. J., and Mela, C. F. (2010). The long-term effect of marketing strategy on brand sales. J. Market. Res. 47, 866–882. doi: 10.1509/jmkr.47.5.866
Avery, J., and Keinan, A. (2016). “Consuming brands,” in The Cambridge Handbook of Consumer Psychology, 209–232. doi: 10.1017/CBO9781107706552.008
Bartra, O., McGuire, J. T., and Kable, J. W. (2013). The valuation system: a coordinate-based meta-analysis of BOLD fMRI experiments examining neural correlates of subjective value. NeuroImage 76, 412–427. doi: 10.1016/j.neuroimage.2013.02.063
Basten, U., Biele, G., Heekeren, H. R., and Fiebach, C. J. (2010). How the brain integrates costs and benefits during decision making. Proc. Natl. Acad. Sci. U. S. A. 107, 21767–21772. doi: 10.1073/pnas.0908104107
Beckwith, N. E., and Lehmann, D. R. (1975). The importance of halo effects in multi-attribute attitude models. J. Market. Res. 12, 265–275.
Bellezza, S., and Keinan, A. (2014). Brand tourists: how non–core users enhance the brand image by eliciting pride. J. Consumer Res. 41, 397–417. doi: 10.1086/676679
Brodie, R. J., Whittome, J. R., and Brush, G. J. (2009). Investigating the service brand: a customer value perspective. J. Bus. Res. 62, 345–355. doi: 10.1016/j.jbusres.2008.06.008
Brucks, M., Zeithaml, V. A., and Naylor, G. (2000). Price and brand name as indicators of quality dimensions for consumer durables. J. Acad. Market. Sci. 28, 359–374. doi: 10.1177/0092070300283005
Bushman, B. J. (1993). What's in a name? The moderating role of public self-consciousness on the relation between brand label and brand preference. J. Appl. Psychol. 78, 857–861. doi: 10.1037/0021-9010.78.5.857
Castegnetti, G., Zurita, M., and De Martino, B. (2021). How usefulness shapes neural representations during goal-directed behavior. Sci. Adv. 7, eabd5363. doi: 10.1126/sciadv.abd5363
Cavanagh, J. F., Wiecki, T. V., Kochar, A., and Frank, M. J. (2014). Eye tracking and pupillometry are indicators of dissociable latent decision processes. J. Exp. Psychol. 143, 1476–1488. doi: 10.1037/a0035813
Chen, W. J., and Krajbich, I. (2017). Computational modeling of epiphany learning. Proc. Natl. Acad. Sci. U. S. A. 114, 4637–4642. doi: 10.1073/pnas.1618161114
Chew, S. H., Li, K. K., Chark, R., and Zhong, S. (2008). Source preference and ambiguity aversion: models and evidence from behavioral and neuroimaging experiments. Adv. Health Econ. Health Serv. Res. 20, 179–201. doi: 10.1016/S0731-2199(08)20008-7
Clithero, J. A., and Rangel, A. (2014). Informatic parcellation of the network involved in the computation of subjective value. Soc. Cogn. Affect. Neurosci. 9, 1289–1302. doi: 10.1093/scan/nst106
Dai, J., and Busemeyer, J. R. (2014). A probabilistic, dynamic, and attribute-wise model of intertemporal choice. J. Exp. Psychol. 143, 1489. doi: 10.1037/a0035976
Diederich, A., and Oswald, P. (2014). Sequential sampling model for multiattribute choice alternatives with random attention time and processing order. Front. Hum. Neurosci. 8:697. doi: 10.3389/fnhum.2014.00697
Esch, F.-R., Möll, T., Schmitt, B., Elger, C. E., Neuhaus, C., and Weber, B. (2012). Brands on the brain: do consumers use declarative information or experienced emotions to evaluate brands? J. Consumer Psychol. 22, 75–85. doi: 10.1016/j.jcps.2010.08.004
Fiedler, S., and Glöckner, A. (2012). The dynamics of decision making in risky choice: an eye-tracking analysis. Front. Psychol. 3, 335. doi: 10.3389/fpsyg.2012.00335
Fiedler, S., Glöckner, A., Nicklisch, A., and Dickert, S. (2013). Social value orientation and information search in social dilemmas: an eye-tracking analysis. Organiz. Behav. Hum. Dec. Process. 120, 272–284. doi: 10.1016/j.obhdp.2012.07.002
Fisher, G. (2017). An attentional drift diffusion model over binary-attribute choice. Cognition 168, 34–45. doi: 10.1016/j.cognition.2017.06.007
Fisher, G. (2021). A multiattribute attentional drift diffusion model. Org. Behav. Hum. Decision Process. 165, 167–182. doi: 10.1016/j.obhdp.2021.04.004
Fournier, S. (1998). Consumers and their brands: Developing relationship theory in consumer research. J. Consumer Res. 24, 343–373. doi: 10.1086/209515
Glickman, M., Sharoni, O., Levy, D. J., Niebur, E., Stuphorn, V., and Usher, M. (2019). The formation of preference in risky choice. PLoS Comput. Biol. 15:e1007201. doi: 10.1371/journal.pcbi.1007201
Glöckner, A., and Herbold, A.-K. (2011). An eye-tracking study on information processing in risky decisions: evidence for compensatory strategies based on automatic processes. J. Behav. Decision Mak. 24, 71–98. doi: 10.1002/bdm.684
Gluth, S., Rieskamp, J., and Büchel, C. (2012). Deciding when to decide: time-variant sequential sampling models explain the emergence of value-based decisions in the human brain. J. Neurosci. 32, 10686–10698. doi: 10.1523/JNEUROSCI.0727-12.2012
Gluth, S., Spektor, M. S., and Rieskamp, J. (2018). Value-based attentional capture affects multi-alternative decision making. ELife 7, e39659. doi: 10.7554/eLife.39659
Gwinn, R., and Krajbich, I. (2020). Attitudes and attention. J. Exp. Soc. Psychol. 86, 103892. doi: 10.1016/j.jesp.2019.103892
Hare, T. A., Malmaud, J., and Rangel, A. (2011). Focusing attention on the health aspects of foods changes value signals in vmPFC and improves dietary choice. J. Neurosci. 31, 11077–11087. doi: 10.1523/JNEUROSCI.6383-10.2011
Hausfeld, J., von Hesler, K., and Goldlücke, S. (2021). Strategic gaze: an interactive eye-tracking study. Exp. Econ. 24, 177–205. doi: 10.1007/s10683-020-09655-x
Hoyer, W. D., and Brown, S. P. (1990). Effects of brand awareness on choice for a common, repeat-purchase product. J. Consumer Res. 17, 141–148.
Hristova, E., and Grinberg, M. (2005). “Information acquisition in the iterated prisoner's dilemma game: an eye-tracking study,” in Proceedings of the 27th Annual Conference of the Cognitive Science Society, 983–988.
Husić-Mehmedović, M., Omeragić, I., Batagelj, Z., and Kolar, T. (2017). Seeing is not necessarily liking: advancing research on package design with eye-tracking. J. Bus. Res. 80, 145–154. doi: 10.1016/j.jbusres.2017.04.019
Hüsser, A., and Wirth, W. (2014). Do investors show an attentional bias toward past performance? An eye-tracking experiment on visual attention to mutual fund disclosures in simplified fund prospectuses. J. Fin. Serv. Market. 19, 169–185. doi: 10.1007/978-3-319-30886-9_5
Jiang, Y., Gorn, G. J., Galli, M., and Chattopadhyay, A. (2016). Does your company have the right logo? How and why circular-and angular-logo shapes influence brand attribute judgments. J. Consumer Res. 42, 709–726. doi: 10.1093/jcr/ucv049
Keeney, R. L., Raiffa, H., and Meyer, R. F. (1993). Decisions With Multiple Objectives: Preferences and Value Trade-Offs. Cambridge: Cambridge University Press.
Keller, K. L. (1993). Conceptualizing, measuring, and managing customer-based brand equity. J. Market. 57, 1–22.
Keller, K. L. (2003). Brand synthesis: the multidimensionality of brand knowledge. J. Consum. Res. 29, 595–600. doi: 10.1086/346254
Keller, K. L., and Lehmann, D. R. (2006). Brands and branding: research findings and future priorities. Market. Sci. 25, 740–759. doi: 10.1287/mksc.1050.0153
Kirmani, A., and Rao, A. R. (2000). No pain, no gain: a critical review of the literature on signaling unobservable product quality. J. Market. 64, 66–79. doi: 10.1509/jmkg.64.2.66.18000
Krajbich, I. (2019). Accounting for attention in sequential sampling models of decision making. Curr. Opin. Psychol. 29, 6–11. doi: 10.1016/j.copsyc.2018.10.008
Krajbich, I., Armel, C., and Rangel, A. (2010). Visual fixations and the computation and comparison of value in simple choice. Nat. Neurosci. 13, 1292–1298. doi: 10.1038/nn.2635
Krajbich, I., and Rangel, A. (2011). Multialternative drift-diffusion model predicts the relationship between visual fixations and choice in value-based decisions. Proc. Natl. Acad. Sci. U. S. A. 108, 13852–13857. doi: 10.1073/pnas.1101328108
Lewis, K. E., Grebitus, C., and Nayga Jr, R. M. (2016). The impact of brand and attention on consumers' willingness to pay: evidence from an eye tracking experiment. Can. J. Agri. Econ. 64, 753–777. doi: 10.1111/cjag.12118
Lohse, G. L. (1997). Consumer eye movement patterns on yellow pages advertising. J. Advertising 26, 61–73. doi: 10.1080/00913367.1997.10673518
Luffarelli, J., Stamatogiannakis, A., and Yang, H. (2019). The visual asymmetry effect: an interplay of logo design and brand personality on brand equity. J. Market. Res. 56, 89–103. doi: 10.1177/0022243718820548
Maier, S. U., Raja Beharelle, A., Polanía, R., Ruff, C. C., and Hare, T. A. (2020). Dissociable mechanisms govern when and how strongly reward attributes affect decisions. Nat. Hum. Behav. 2020, 1–15. doi: 10.1038/s41562-020-0893-y
Mottram, S. (1998). “Branding the corporation,” in Brands: The New Wealth Creators, eds S. Hart and J. Murphy (London: Palgrave Macmillan UK), 63–71.
Mundel, J., Huddleston, P., Behe, B., Sage, L., and Latona, C. (2018). An eye tracking study of minimally branded products: Hedonism and branding as predictors of purchase intentions. J. Product Brand Manag. 2016, 1282. doi: 10.1108/JPBM-07-2016-1282
Murray, D. P. (2013). Branding “real” social change in Dove's Campaign for Real Beauty. Feminist Media Stud. 13, 83–101. doi: 10.1080/14680777.2011.647963
Payne, J. W. (1976). Task complexity and contingent processing in decision making: an information search and protocol analysis. Org. Behav. Hum. Perform. 16, 366–387. doi: 10.1016/0030-5073(76)90022-2
Payne, J. W., Bettman, J. R., and Johnson, E. J. (1988). Adaptive strategy selection in decision making. J. Exp. Psychol. 14, 534–552. doi: 10.1037/0278-7393.14.3.534
Payne, J. W., Braunstein, M. L., and Carroll, J. S. (1978). Exploring predecisional behavior: an alternative approach to decision research. Org. Behav. Hum. Perform. 22, 17–44. doi: 10.1016/0030-5073(78)90003-X
Peters, R. G. M., and Bijmolt, T. H. A. (1997). Consumer memory for television advertising: a field study of duration, serial position, and competition effects. J. Consumer Res. 23, 362–372. doi: 10.1086/209489
Philiastides, M. G., Biele, G., and Heekeren, H. R. (2010). A mechanistic account of value computation in the human brain. Proc. Natl. Acad. Sci. U. S. A. 107, 9430–9435. doi: 10.1073/pnas.1001732107
Philiastides, M. G., and Ratcliff, R. (2013). Influence of branding on preference-based decision making. Psychol. Sci. 24, 1208–1215. doi: 10.1177/0956797612470701
Pieters, R., and Warlop, L. (1999). Visual attention during brand choice: the impact of time pressure and task motivation. Int. J. Res. Market. 16, 1–16. doi: 10.1016/S0167-8116(98)00022-6
Pieters, R., and Wedel, M. (2004). Attention capture and transfer in advertising: brand, pictorial, and text-size effects. J. Market. 68, 36–50. doi: 10.1509/jmkg.68.2.36.27794
Pieters, R., and Wedel, M. (2007). Goal control of attention to advertising: the yarbus implication. J. Consumer Res. 34, 224–233. doi: 10.1086/519150
Pisauro, M. A., Fouragnan, E., Retzler, C., and Philiastides, M. G. (2017). Neural correlates of evidence accumulation during value-based decisions revealed via simultaneous EEG-fMRI. Nat. Commun. 8, 15808. doi: 10.1038/ncomms15808
Plassmann, H., Ramsøy, T. Z., and Milosavljevic, M. (2012). Branding the brain: a critical review and outlook. J. Consumer Psychol. 22, 18–36. doi: 10.1016/j.jcps.2011.11.010
Polonio, L., Di Guida, S., and Coricelli, G. (2015). Strategic sophistication and attention in games: an eye-tracking study. Games Econ. Behav. 94, 80–96. doi: 10.1016/j.geb.2015.09.003
Rao, V. R., Agarwal, M. K., and Dahlhoff, D. (2004). How is manifest branding strategy related to the intangible value of a corporation? J. Market. 68, 126–141. doi: 10.1509/jmkg.68.4.126.42735
Ratcliff, R. (1978). A theory of memory retrieval. Psychol. Rev. 85, 59–108. doi: 10.1037/0033-295X.85.2.59
Ratcliff, R., and McKoon, G. (2008). The diffusion decision model: theory and data for two-choice decision tasks. Neural Comput. 20, 873–922. doi: 10.1162/neco.2008.12-06-420
Ratcliff, R., and Smith, P. L. (2004). A comparison of sequential sampling models for two-choice reaction time. Psychol. Rev. 111, 333–367. doi: 10.1037/0033-295X.111.2.333
Reeck, C., Wall, D., and Johnson, E. J. (2017). Search predicts and changes patience in intertemporal choice. Proc. Natl. Acad. Sci. U. S. A. 114, 11890–11895. doi: 10.1073/pnas.1707040114
Reutskaja, E., Nagel, R., Camerer, C. F., and Rangel, A. (2011). Search dynamics in consumer choice under time pressure: an eye-tracking study. Am. Econ. Rev. 101, 900–926. doi: 10.1257/aer.101.2.900
Rodriguez, C. A., Turner, B. M., Van Zandt, T., and McClure, S. M. (2015). The neural basis of value accumulation in intertemporal choice. Eur. J. Neurosci. 42, 2179–2189. doi: 10.1111/ejn.12997
Rosbergen, E., Pieters, R., and Wedel, M. (1997). Visual attention to advertising: a segment-level analysis. J. Consumer Res. 24, 305–314. doi: 10.1086/209512
Rramani, Q., Krajbich, I., Enax, L., Brustkern, L., and Weber, B. (2020). Salient nutrition labels shift peoples' attention to healthy foods and exert more influence on their choices. Nutr. Res. 6, 13. doi: 10.1016/j.nutres.2020.06.013
Schmitt, B. (2012). The consumer psychology of brands. J. Consumer Psychol. 22, 7–17. doi: 10.1016/j.jcps.2011.09.005
Schwarz, N. (2004). Metacognitive experiences in consumer judgment and decision making. J. Consumer Psychol. 14, 332–348. doi: 10.1207/s15327663jcp1404_2
Sheng, F., Ramakrishnan, A., Seok, D., Zhao, W. J., Thelaus, S., Cen, P., et al. (2020). Decomposing loss aversion from gaze allocation and pupil dilation. Proc. Natl. Acad. Sci. U. S. A. 117, 11356–11363. doi: 10.1073/pnas.1919670117
Smith, S. M., and Krajbich, I. (2018). Attention and choice across domains. J. Exp. Psychol. 147, 1810–1826. doi: 10.1037/xge0000482
Smith, S. M., and Krajbich, I. (2019). Gaze amplifies value in decision making. Psychol. Sci. 30, 116–128. doi: 10.1177/0956797618810521
Smith, S. M., Krajbich, I., and Webb, R. (2019). Estimating the dynamic role of attention via random utility. J. Econ. Sci. Assoc. 5, 97–111. doi: 10.1007/s40881-019-00062-4
Stokburger-Sauer, N. E., and Teichmann, K. (2013). Is luxury just a female thing? The role of gender in luxury brand consumption. J. Bus. Res. 66, 889–896. doi: 10.1016/j.jbusres.2011.12.007
Sullivan, N. J., and Huettel, S. A. (2021). Healthful choices depend on the latency and rate of information accumulation. Nat. Hum. Behav. 5, 1698–1706. doi: 10.1038/s41562-021-01154-0
Teoh, Y. Y., Yao, Z., Cunningham, W. A., and Hutcherson, C. A. (2020). Attentional priorities drive effects of time pressure on altruistic choice. Nat. Commun. 11:3534. doi: 10.1038/s41467-020-17326-x
Thomas, A. W., Molter, F., and Krajbich, I. (2021). Uncovering the computational mechanisms underlying many-alternative choice. ELife 10, e57012. doi: 10.7554/eLife.57012
Wang, J. T. Y., Spezio, M., and Camerer, C. F. (2010). Pinocchio's pupil: using eyetracking and pupil dilation to understand truth telling and deception in sender-receiver games. Am. Econ. Rev. 100, 984–1007. doi: 10.1257/aer.100.3.984
Wedel, M., and Pieters, R. (2000). Eye fixations on advertisements and memory for brands: a model and findings. Market. Sci. 19, 297–312. doi: 10.1287/mksc.19.4.297.11794
Wernerfelt, B. (1988). Umbrella branding as a signal of new product quality: an example of signalling by posting a bond. RAND J. Econ. 19, 458–466. doi: 10.2307/2555667
Westbrook, A., van den Bosch, R., Määttä, J. I., Hofmans, L., Papadopetraki, D., Cools, R., et al. (2020). Dopamine promotes cognitive effort by biasing the benefits versus costs of cognitive work. Science 367, 1362–1366. doi: 10.1126/science.aaz5891
Yang, X., and Krajbich, I. (2022). A dynamic computational model of gaze and choice in multi-attribute decisions. Psychol. Rev. 2022, 350. doi: 10.1037/rev0000350
Zhao, W. J., Walasek, L., and Bhatia, S. (2020). Psychological mechanisms of loss aversion: a drift-diffusion decomposition. Cogn. Psychol. 123, 101331. doi: 10.1016/j.cogpsych.2020.101331
Keywords: decision-making, eye-tracking, gaze, diffusion model, branding, multi-attribute
Citation: Yang X, Retzler C, Krajbich I, Ratcliff R and Philiastides MG (2024) Attention to brand labels affects, and is affected by, evaluations of product attractiveness. Front. Behav. Econ. 2:1274815. doi: 10.3389/frbhe.2023.1274815
Received: 08 August 2023; Accepted: 05 December 2023;
Published: 09 January 2024.
Edited by:
Elena Reutskaja, University of Navarra, SpainReviewed by:
Anastasia Buyalskaya, HEC Paris, FranceEnrico Petracca, University of Bologna, Italy
King King Li, Shenzhen University, China
Copyright © 2024 Yang, Retzler, Krajbich, Ratcliff and Philiastides. This is an open-access article distributed under the terms of the Creative Commons Attribution License (CC BY). The use, distribution or reproduction in other forums is permitted, provided the original author(s) and the copyright owner(s) are credited and that the original publication in this journal is cited, in accordance with accepted academic practice. No use, distribution or reproduction is permitted which does not comply with these terms.
*Correspondence: Ian Krajbich, a3JhamJpY2hAdWNsYS5lZHU=
†These authors share senior authorship