 Haoran Zhang
 Yiming Yang
 Jiahao Zhou
 Atif Shamim
- 1Electrical and Computer Engineering, King Abdullah University of Science and Technology, Thuwal, Saudi Arabia
- 2Electronic Science and Engineering, University of Electronic Science and Technology of China, Chengdu, China
This paper presents a compact and wearable frequency-modulated continuous-wave (FMCW) radar on a semi-flexible printed circuit board (PCB) for an anti-collision system. This can enable visually impaired people to perceive their environment better and more safely in their everyday lives. In the proposed design, a multiple-input multiple-output (MIMO) antenna array with four receivers (RXs) and three transmitters (TXs) has been designed to achieve obstacle-detection ability in both horizontal and vertical planes through a specific geometrical configuration. Operating at 76–81 GHz, an aperture coupled wide-beam patch antenna with two parasitic patches is proposed for each channel of RXs and TXs. The fast Fourier transform (FFT) algorithm has been implemented in the radar chip AWR1843 for intermediate frequency (IF) signals to generate a range-Doppler map and search precise target angles in high sensitivity. The complete system, which includes both the MIMO antenna array and the radar chip circuit, is utilized on a six-layer semi-flexible PCB to ensure compactness and ease in wearability. Field testing of the complete system has been performed, and an obstacle-detection range of 7 m (for humans) and 19 m (for larger objects) has been obtained. A wide angular detection range of 64-degree broadside view (±32°) has also been achieved. A voice module has also been integrated to deliver the obstacle’s range and angle information to visually impaired persons.
1 Introduction
The estimated number of people visually impaired in the world today is 285 million, which includes 39 million blind and 246 million with poor vision (Pascolini and Mariotti, 2011). One of the major challenges in the everyday life of a visually impaired person is to avoid collisions while walking in an unknown environment. For this reason, there has been global interest in developing an efficient and inexpensive anti-collision system for visually impaired people. Currently, the majority relies on the white cane, which is range-limited. Furthermore, users need to hold the white cane with their dominant hands, which restricts users’ mobility. This is problematic for most users, according to research conducted among visually impaired people (Kiuru et al., 2018). Others adopt a guide dog; however, this is an expensive option, and it also takes a long time to train a guide dog (Lloyd et al., 2016). Moreover, the guide dog is also a “handheld” solution. Recently, more technological devices—referred to as electronic travel aids (ETA)—have been developed to assist visually impaired people.
There are three major types of ETAs: ultrasonic sensor-based (Park et al., 2009; Andò et al., 2015; Jawale et al., 2017; Kim et al., 2020), optic sensor-based (Liyanage and Perera, 2012; Villanueva and Farcy, 2012; Yu and Ganz, 2012; Lakde and Prasad, 2015), and electromagnetic (EM)-based systems (Cardillo et al., 2018; Jardak et al., 2019; Long et al., 2019; Orth et al., 2020). It is well known that the ultrasonic sensor-based ETA suffers from limited detection angle and limited detection range, especially when it is detecting a highly reflective surface at a low incident angle (Cardillo et al., 2018). In contrast to the ultrasonic sensor-based ETA, the optic sensor-based ETA has a detection range that is not affected by the highly reflective surface; however, it has a very high sensitivity to the natural ambient light and the optical characteristics of the object (Cardillo and Caddemi, 2019). Both strong light and darkness can significantly affect the optical sensor-based ETA’s detection accuracy. Moreover, it is typically bulky as it usually requires the use of the optical camera. During the past decade, the EM-based ETA has attracted considerable research interest as a device for assisting visually impaired people (Cardillo et al., 2018; Jardak et al., 2019; Long et al., 2019; Meredov et al., 2020). The ambient light does not affect the EM waves’ propagation. Its detection range and angle can also be improved by a proper design of the antenna system. Though radar systems are well-known for obstacle detection, they are typically bulky, rigid, expensive, and not suitable for wearable applications. However, with the advancement in highly integrated and low-cost radar integrated circuits (IC, also known as a chip), flexible antennas and PCB, a low-cost and wearable radar system can now be envisioned. FMCW is the typical mode of operation for most EM-based ETA systems. For example, in (Jardak et al., 2019), a 24-GHz linear FMCW radar system is designed to assist the visually impaired during their outdoor journeys. However, it is not integrated with any modules that can send the obstacle information to the user. Furthermore, this radar system, along with other EM-based ETAs in the literature, are all implemented on the rigid board, which are not flexible and cannot be attached to the human body conformally as a wearable device.
This paper presents a unique wearable radar system that will help visually impaired people to better perceive the environment so that they can walk more freely and conveniently. For visually impaired people, the most significant parameters are the distance and the direction of the obstacles. Speed also becomes an important parameter if the object is moving. This radar system aims to detect targets in the range of 10 m or less while covering a 60° broadside view (±30°). The system can provide the obstacle’s information to the user in different acoustic prompts to enhance their environment sensing experience. The radar system is lightweight, low cost, and designed to be worn on a human chest. The antenna and circuits are designed on a six-layer semi-flexible PCB to enhance wearability comfort. Section 2 describes in detail the overall system structure and the detailed detection theory of this radar system. Section 3 explains the designs of the MIMO antenna array and its feeding network. Then, Section 4 discusses the prototype’s fabrication and reports the field tests carried out by using the fabricated prototype for testing the system’s performance. Section 5 concludes with a discussion and suggestions for proposed future improvements.
2 Theory of the Radar System
The radar system structure is illustrated in Figure 1. The chirp signals are generated and amplified by the radio-frequency (RF) front end in the AWR1843 radar chip (AWR, 2020), which is then radiated by the transmitter antenna arrays. The propagating signals are later reflected and modulated by the obstacles within the detection range. The receiver antenna array captures the reflected wave for amplification, IQ demodulation, and sampling in the RF front end. The digital signal processor (DSP) processes the sampled data with the algorithm (as shown in Figure 1) into a four-dimensional data graph, describing the obstacles’ distances, horizontal and vertical angles, and velocities. In the following section, the theory of the radar system is presented in detail.
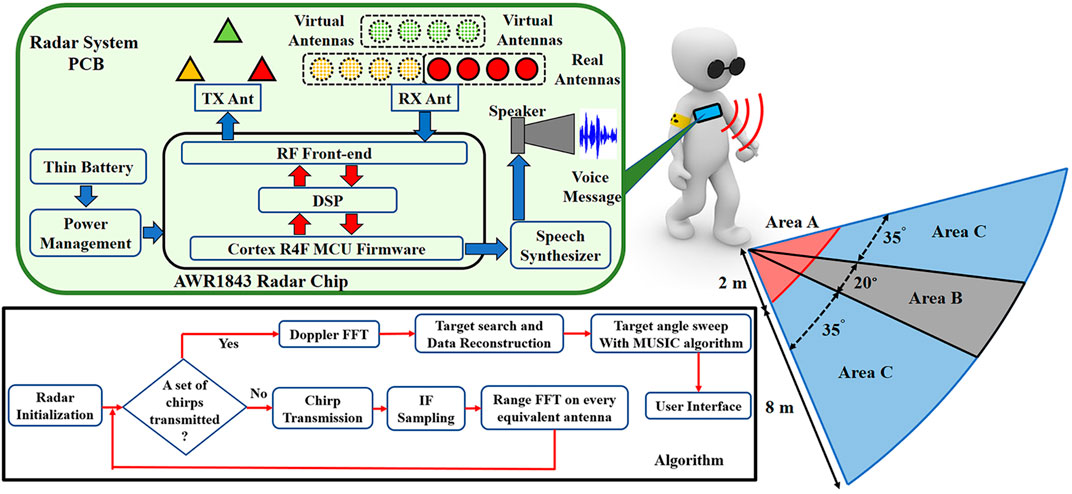
FIGURE 1. Schematic of the complete radar system.
2.1 Fast-Time Signal and Range Sensing
The simplified system block diagram for the range and speed sensing is shown in Figure 2A, where a frequency-sweeping signal (chirp signal) is amplified and transmitted through the power amplifier (PA) and the TX antenna. The transmitted wave is reflected from the moving obstacle at a distance of R(t) and speed of v(t) and is captured by the RX antenna. The propagation delay of the received signal can be detected by multiplying and filtering the received signal with the chirp signal. The IF signal is then sampled by the analog-to-digital converter (ADC) and transformed to the frequency domain by FFT. The sampled signal series from a single chirp is called the fast-time signal, from which the distance information can be derived according to the following FMCW theory.
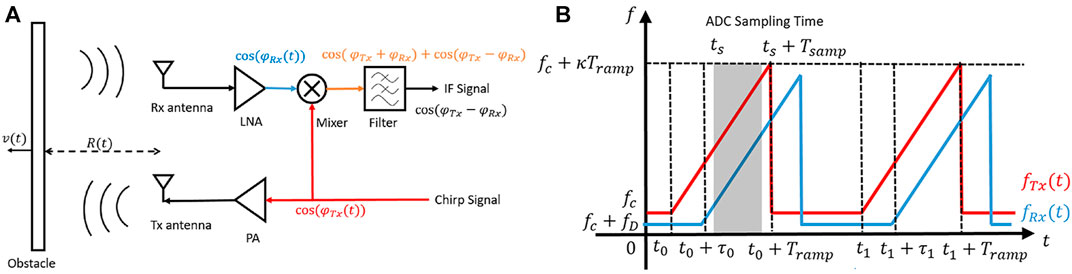
FIGURE 2. (A) Simplified System Diagram for ange Detection; (B) Signal plot for distance measurement.
The frequency-time plot of the transmitted signal and the received signal are shown in Figure 2B. The first chirp signal is transmitted at t0 and the chirp signal has a ramp of κ, lasting for Tramp. The swept frequency range (bandwidth) of the chirp signal is BW = κTramp. After a propagation delay τ0, the signal is received and sampled by the radar chip from ts to ts + Tsamp.
The phase of the transmitted signal φTx(t) during one frequency sweep cycle is the integration of the frequency from the start time t0 to end time t. The phase of the delayed received signal can be represented by
From the above representation of the IF signal, we can see that the distance R(t) of the obstacle is modulated to the frequency fIF of the IF signal. FFT can convert the IF signal into the frequency domain, where the peak power frequency is proportional to the distance and speed of the obstacle. The effect of the velocity and Doppler frequency shift will be compensated in the slow-time process (described in the next section) to reduce the corresponding frequency shift error of the IF signal.
For the performance of the range sensing, we assume that the VCO of the radar scans the transmitted wave frequency linearly from fc to fc + BW during the time span Tramp, and that the ADC samples N points from time ts to ts + Tsamp with the sampling frequency fs. According to FFT theory, the frequency resolution is fS/N. Therefore, the range resolution is expressed as follows (Harvey and Cerna, 1993).
The range resolution formula implies that to get the maximum range precision, the sampling time window should cover as much of the IF signal as possible, and that the limitation of the range resolution of a 2D-FFT FMCW radar is the VCO’s modulation bandwidth BW. For our radar system, the VCO bandwidth of the radar chip AWR1843 is 4 GHz; therefore, the theoretical maximum range precision can be 3.75 mm at full VCO bandwidth operation according to Eq. 4. As for maximum measurement range, the sampling theory shows that the maximum frequency component of the ADC samples is fS/2. Thus, the maximum range can be written as cfS/4κ.
2.2 Slow-Time Signal and Velocity Sensing
To sense the velocity of the target and reduce the distance error of the Doppler frequency shift, we need to do another distance measurement at the time t1. When the transmitted wave catches up with the obstacle, the distance of wave propagation
By presenting the fast-time signal at t1 with the previous fast-time signal at t0, we expand the one-dimensional fast-time signal into the two-dimensional slow-time signal. The fast-time variable t indicates the phase change inside a single IF signal, while the slow-time variable t1-t0 indicates the phase change between the two IF signals.
By performing FFT with the slow-time variable t1-t0, we can get the Doppler frequency distribution 2vfc/c; but the nonlinear term
In solving the above inequalities, we can determine the following range for valid slow-time sampling.
Thus
The discussion shows that the shorter the time the slow-time sampling takes, the less the nonlinearity influences the Doppler frequency. Therefore, it is recommended that the slow-time signal follow the first chirp signal with a minimum time gap to minimize the slow-time sampling of multiple chirps.
If the radar system transmits M chirp signals including the fast-time signal one after another, the resolution of velocity can be calculated as follows.
Therefore, the maximum detectable speed is calculated according to the sampling theory.
2.3 Antenna Array and Angle Sensing
The RX antenna array with a single TX is shown in Figure 3A. Multiple receiving antennas are evenly placed along a straight line with an inter-element distance of d. The angle between the direction of the incident wave and the direction of the normal incidence is θ.
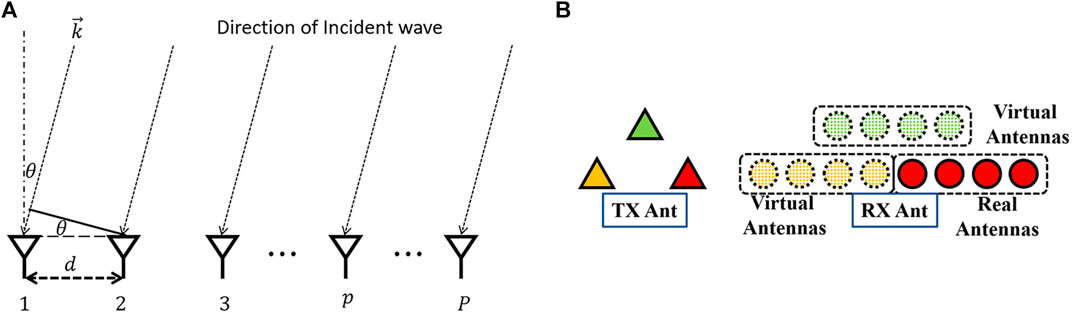
FIGURE 3. (A) Receiving Antenna Array with a single transmitter, (B) MIMO Antenna Array configuration.
The phase delay between two adjacent elements is Δφ = kd sin θ = 2πfd sin θ/c. The phase of the IF signal for each antenna can be written as
Thus, the angle resolution can be derived as follows (Merrill, 2008).
The measurable angle range is
For MIMO radar arrays in Figure 3B, the change of transmitting antenna position (labeled in yellow and green color) will cause a total equal phase delay on all receiving antennas compared with the original transmitting antenna (labeled in red). Therefore, the combinations of the existing receiving array and individual transmitting antenna form groups with an additional phase shift. By interpreting the additional phase shift from transmitters as the phase shift from receiving antennas (circled by dashed lines), we can get a virtual receiving array whose antenna position is the convolution of the receiving antenna and transmitting antenna positions. In this configuration, the radar performs three groups of measurement in each of which the receiving array samples the reflected signal from one unique transmitting element. Then three groups of four received IF signals are organized as one group of 12 received IF signals from the virtual array. In addition, FFT is performed across each channel to extract the angular information. Therefore, eight horizontal antennas and two vertical antennas are equivalently realized by three TX and four RX physical antennas, reducing half of the array size.
3 Antenna Array of the Radar System
To achieve the above-mentioned system functionalities, each antenna element in both TX and RX channels should realize a beamwidth of 60° in the horizontal plane over the desired frequency range of 76–81 GHz. To make sure the entire system can be conformally attached to the human chest, a six-layer semi-flexible PCB process is chosen for the fabrication of both the antenna array and the corresponding radar circuit. The top four metal layers are embedded in the rigid R-5515 substrate which has a relative permittivity of 3.09 and a low loss tangent of 0.006 3 at 79 GHz (R-5375, 2021). Therefore, the antenna array is built up in the rigid R-5515 substrate due to its decent mmWave performance. Three main structures need to be properly designed to ensure that the antenna array performs well. These three structures are the transmission line, the antenna feeding structure, and the radiation element.
The choice of the transmission line topology is critical for designing a high-performance feeding network. The microstrip line is easy to implement, but it can cause severe crosstalk as well as radiation loss. Moreover, it typically has much higher insertion loss in the mmWave frequency band. The co-planar waveguide (CPW) line has better isolation and relatively lower insertion loss. However, both the microstrip line and the CPW line are exposed in the air which can cause considerable interference with the radiating element. The interference in turn affects the antenna’s radiation pattern. Substrate integrated waveguide (SIW) is another choice with decent transmission performance; however, it requires a relatively larger space compared to other transmission line types. Stripline structure has a ground plane on either side of the signal line, so the EM waves are well confined in the substrate, leading to almost zero radiation loss. In addition, the relatively smaller size of the stripline makes it suitable for compact designs. Thus, the stripline is selected for feeding network implementation in this design. In the chosen fabrication process, the dielectric material is R-5515 and the thickness of a single layer is 0.1 mm. In the simulation, a stripline width of 0.25 mm corresponds to 50-Ω characteristic impedance in the desired frequency band of 76–81 GHz.
As shown in Figure 4, the ball grid array (BGA)-packaged AWR1843 radar chip is mounted on the first metal layer (M1), while the stripline is implemented in the third metal layer (M3). Therefore, a vertical RF transition is required to ensure a smooth RF signal transmission between the M1 and M3 layers. In this work, a vertical coaxial-like structure is implemented for the vertical transition. It can be seen from Figure 4 that the chip’s RF output is mounted on one side of the grounded coplanar waveguide (GCPW) line. The RF signal can transmit horizontally through the GCPW to the vertical transition area. The main reason to implement such a horizontal GCPW line between the chip RF output and the vertical transition is that the chip output pad is not suggested to be soldered directly on the top via pad because it can potentially cause fabrication errors, such as pseudo soldering. Furthermore, the GCPW is designed to be short (2 mm) to minimize its radiation loss and the interference with antenna and other circuit parts. Figure 5 shows the vertical transition structure in which a center blind via connecting GCPW line to stripline behaves as the center conductor of the coaxial-like structure and it is surrounded by the grounded via fence to confine the EM waves. Meanwhile, the bottom ground helps to avoid undesired backside radiation leakage. A good vertical transition between the GCPW line and stripline can be achieved by optimizing the diameters of the center via, openings in each metal layer, and the via fence. The optimized results of the complete feeding line including the GCPW (2 mm), vertical transition (0.3 mm), and stripline (5 mm) are shown in Figure 6 where both S11 and S22 are below −12 dB, indicating its good impedance, matching to 50-Ω circuit output. In addition, the complete transmission line demonstrates an insertion loss of around 1 dB over the desired frequency range. Considering the large length of the simulated transmission line and the mmWave frequency range, the obtained loss performance is very decent and suitable for the antenna array’s feeding.
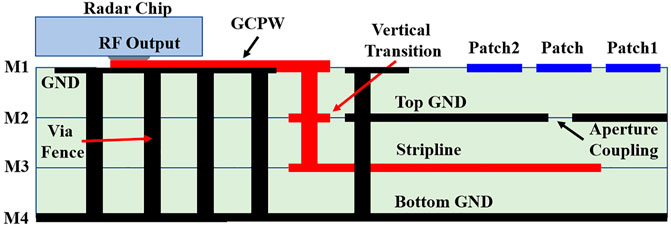
FIGURE 4. Cross-section view of the antenna structure.
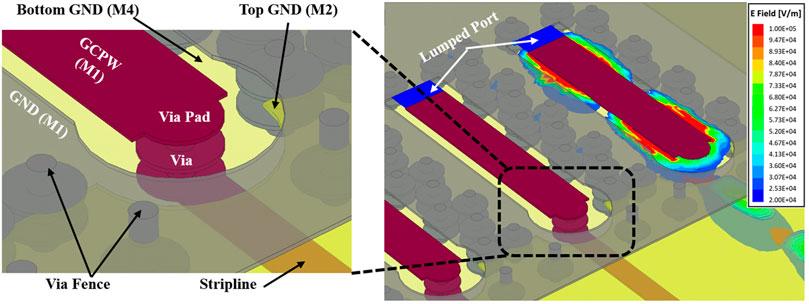
FIGURE 5. HFSS model of the vertical transition in the feeding network.
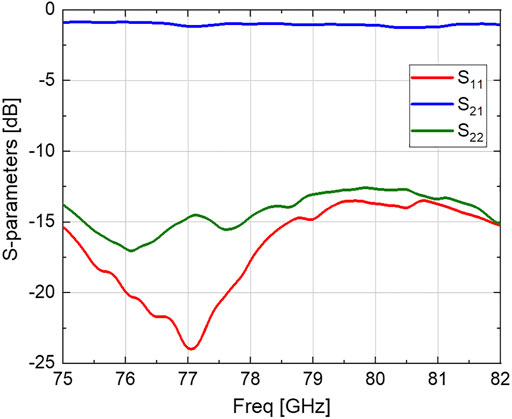
FIGURE 6. Optimized S-parameter simulation results for the feeding line.
In this work, an aperture coupled patch antenna with two parasitic patches is designed, as shown in Figure 7. The driven patch in the center is fed by the stripline through the slot on the top ground. There are two reasons for the selection of an aperture-coupled feeding method. On the one hand, the top ground plane can isolate the long feeding line from the radiating element; the interference, therefore, is minimized. On the other hand, the width, length, and position of the slot can be used to optimize the design, especially the impedance matching (Balanis, 2005). To enhance the beamwidth and the impedance bandwidth of the single antenna element, two identical parasitic patches (Patch 1 and Patch 2) are excited through proximity coupling from the radiating edges of the driven patch in the center. The coupling between patches can be tuned by the gaps between them to control the impedance matching and the radiation pattern of the antenna. Figure 8 shows the antenna simulation results with and without parasitic patches. It can be seen from Figure 8A that the impedance bandwidth increases from 2.8% (2.3 GHz) to 7.3% (5.7 GHz) by the design of parasitic patches. Besides, the inclusion of parasitic patches also improves the antenna element’s half-power beamwidth (HPBW) in H-plane. As shown in Figure 8B, a decent HPBW of 102° is achieved with the inclusion of parasitic patches, as compared to 71° HPBW in the case without parasitic patches. After optimization, the patch antenna dimension is determined to be 1.2 mm × 0.83 mm. The width and length of the feeding slot are 0.3 and 0.63 mm, respectively. The spacing between the two patches is 0.1 mm. The same antenna structure has been applied to all seven channels as shown in the final layout in Figure 7, while all four RX channels and the three TX channels have striplines with the same lengths, respectively. Therefore, the phase change between the antenna element and the radar chip output is the same for all the RX or TX channels which is critical for the subsequent signal processing.
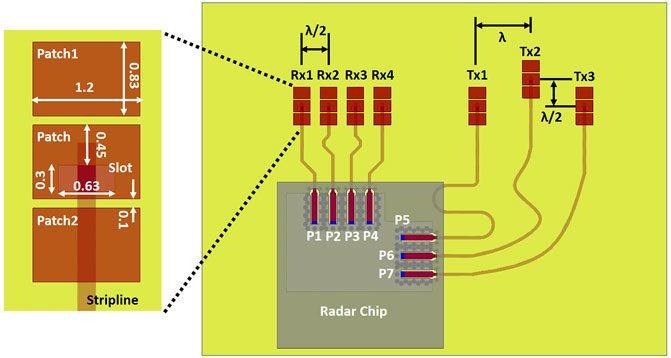
FIGURE 7. HFSS simulation model of the MIMO antenna array.
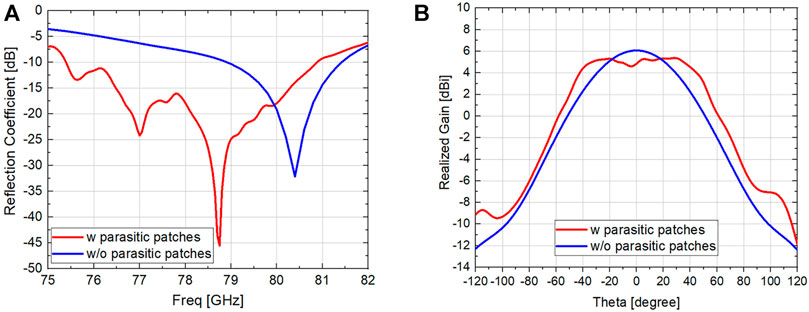
FIGURE 8. Antenna simulation results with and without parasitic patches (A). Reflection coefficients and, (B). H-plane radiation patterns of the antenna element.
As shown in Figure 9A, the reflection coefficients of channel RX4 (S44) and channel TX1 (S55) are smaller than −10 dB over the frequency range of 76–81 GHz, which indicates well-matched impedance in both RX and TX channels in the desired frequency range. Moreover, the S34, S54, and S65 in Figure 9A—representing the mutual coupling levels between different channels—are all below -15 dB and below −20 dB for the most desired frequency range. It can be considered as a low mutual coupling level, which is extremely important for obtaining the accurate range and angle information during the post-processing (Mei and Wu, 2018). Figure 9B demonstrates the radiation performance of a single antenna element and the receiving antenna array. It can be seen that the proposed antenna element design and its corresponding feeding line lead to a realized gain of 5.2 dBi and a 3-dB beamwidth of 102° covering from −49 to 53° in the horizontal plane, which fulfills the demand for 60° beamwidth in the horizontal plane. Additionally, the antenna elements in RX and TX achieve radiation efficiencies of 58.6 and 63.6%, respectively. The minor difference in radiation efficiency is caused by the length difference of the feeding lines in the RX and TX. The feedline length in RX is around 8.8 mm, including GCPW, vertical transition, and stripline, while that value in TX is around 20.7 mm. Although it comes at the cost of slightly higher feeding line insertion losses, the antenna feeding lines are intentionally designed to be long enough to ensure that the antenna elements are far away from the radar circuit for less cross-talk, as well as maintaining the desired array configuration as shown in Figure 7. The RX antenna array plays a significant role in determining the angle of arrival based on the phase difference between received signals in each RX channel. The beam scanning capability of the RX antenna array is also verified and shown in Figure 9B. As depicted, the array shows a lower peak realized gain when it scans to 0° compared to the large scanning angles. The peak gain drops about 1.3 dB at most when the array scans to 0°. This is caused by the small gain drop of around 0.6 dB at theta of 0° in the antenna element radiation pattern. Despite the fact of a 1.3 dB peak gain drop, the RX antenna array presents decent beam scanning performance within the range of +/−40° in the horizontal plane.
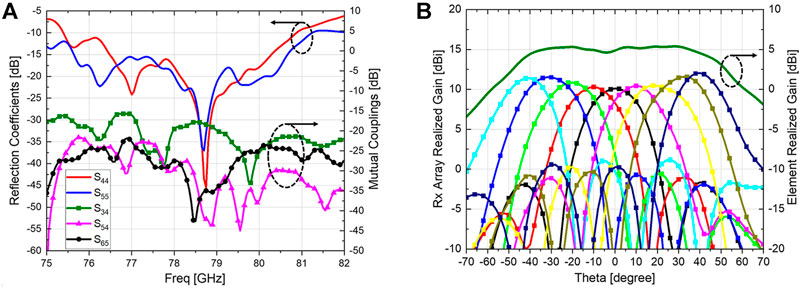
FIGURE 9. MIMO Antenna Array simulation results (A). Reflection coefficients and mutual couplings, (B). Radiation patterns of antenna element and RX antenna array.
4 Fabrication and Measurement
To validate the overall functionality of the proposed wearable radar system, a six-layer semi-flexible PCB process is selected for the fabrication of the entire radar system. Figure 10 shows the conceptual PCB stack-up. In this fabrication process, the top four metal layers are embedded in three rigid R-5515 layers. The low loss characteristic of the R-5515 qualifies it as an excellent substrate for mmWave antenna array realization. The bottom two metal layers are realized on one layer of the flexible Kapton material which is stuck to the rigid substrate through the adhesive layer. By doing so, the area that combines both rigid and flexible substrates stay rigid, while only the area with flexible material presents decent flexibility. Therefore, the overall PCB demonstrates the characteristic of being semi-flexible rigid so that it can be conformally attached to the human body.
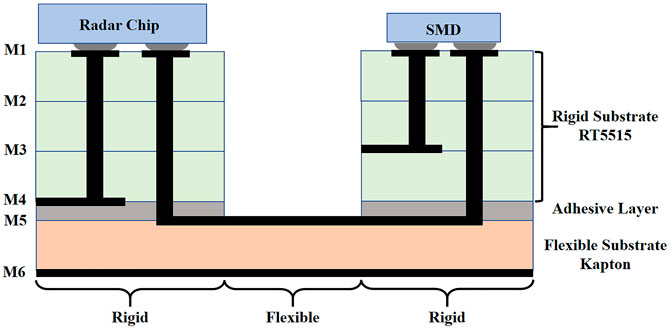
FIGURE 10. Conceptual stack-up of the semi-flexible/rigid PCB.
Figures 11A,B show the front and backside view of the fabricated prototype, respectively. The green area corresponds to the rigid area in Figure 10, and the brown area corresponds to the flexible area in Figure 9. As shown in Figure 11C, the fabricated prototype demonstrates decent flexibility; it can be bent up to 180°. Other than the proposed antenna array design and the algorithms for range, angle, and velocity sensing, the auxiliary circuits are also designed and mounted on the PCB to support the complete system operation as shown in Figures 11A,B. The auxiliary circuit includes the radar core subsystem, power management subsystem, programming flash, speech synthesizer, and user IO. The radar core subsystem is the main module that controls the transmitting/receiving of RF signals and data processing. The proposed algorithm is packaged up and downloaded to radar core through the user IO and programming flash. Furthermore, the user IO can also be used to extract the measured data from the radar core subsystem for results visualization. The measured information—including range, angle, and velocity—is obtained by data processing in the radar core subsystem. Next, the information is translated into voice messages with the help of the speech synthesizer and the speaker. The wearable radar system, including the PCB substrate and all the mounted circuit components, weighs only 18 g, and its dimension is 10 cm × 6 cm × 1.4 cm. The thickness of the bare PCB substrate is only 0.55 mm. The properties of decent flexibility, small dimension, and lightweight make the proposed radar system suitable for being a wearable device.
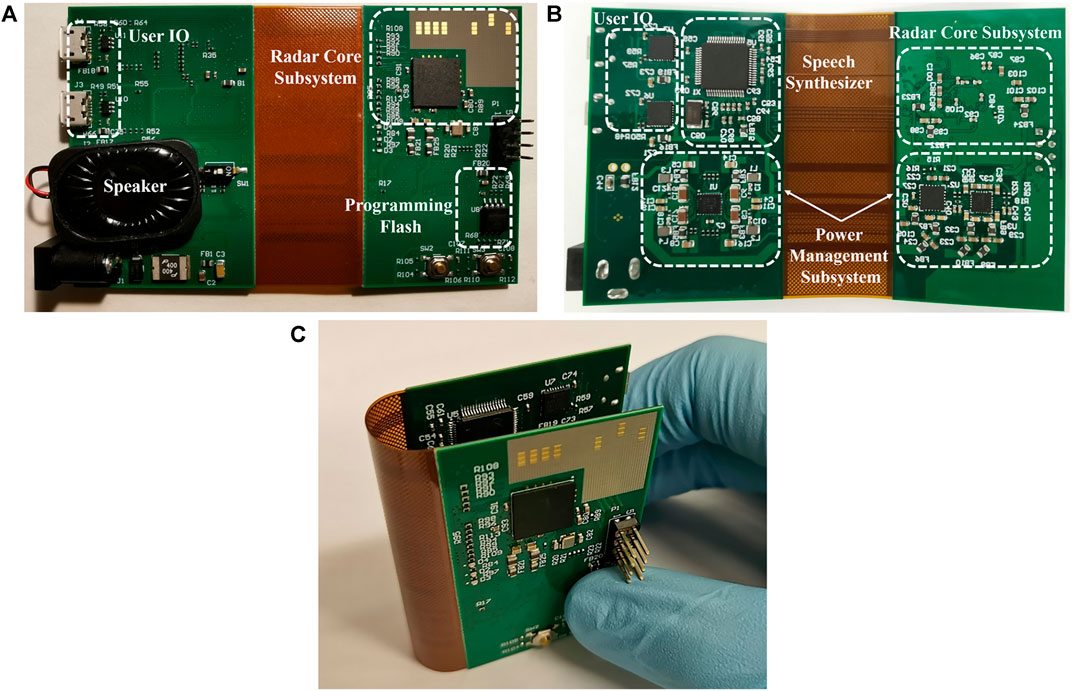
FIGURE 11. Fabricated prototype (A) Front view, (B) Backside view, and (C) Flexibility demonstration.
To verify the functionality of the wearable radar system, the field testing of the fabricated prototype is carried out in an open area as shown in Figure 12. The radar system is attached to a paper box on a tripod to mimic the height of the human chest. In this field testing, the radar system is connected to the PC through the user IO and the cables for the visualization of the measured results. The wearable radar system is tested with the object located at different ranges and angles. Two types of objects are tested. The first one is a person only, while the other object is one person with a rectangular trihedral corner reflector (RTCR). The radar cross-section (RCS) of an adult body at the frequency range of 76–81 GHz is around −2.6 dBsm (Fortuny and Chareau, 2013). The RCS of the rectangular trihedral corner reflector is calculated to be around 32 dBsm at 76–81 GHz.
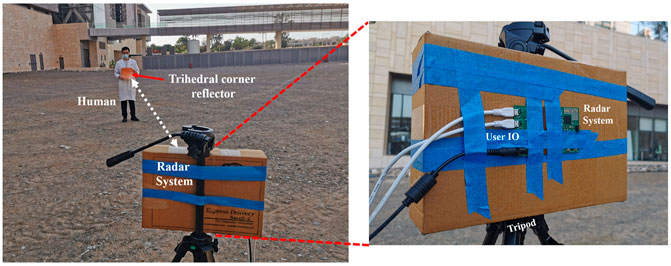
FIGURE 12. Field test setup.
Figure 13A describes the scenario in which one person holding the RTCR stands in front of the radar system at a distance of 9 m. The green curve indicates the internal noise level of the radar system, while the blue curve shows the measured relative power from the environment. It can be seen that there is a measured peak at the range of 9 m, which corresponds to the person with RTCR. This object demonstrates a high signal-to-noise ratio (SNR) of around 23 dB. Other than this peak at 9 m, the measured power presents up to 15 dB larger value at the range of 1–3 m compared to the noise level. This is caused by the ground reflection, which can reduce the SNR of the measured signal in this range. Consequently, it can potentially reduce the detection accuracy of the object in this range. In this scenario, the radar system can detect the person with RTCR at up to 19 m distance. Figure 13B shows a different scenario in which only one person stands in front of the radar system at a distance of 2 m. In this case, the person can be detected at 2 m as shown by the blue curve peak in Figure 13B. The peak presents an SNR of around 30 dB. Its actual SNR, however, is reduced to around 20 dB due to the presence of the ground reflection. In this scenario, the radar system proves able to detect the person at up to 7 m. The detection range is a bit lower than the desired value because the human body has a relatively low RCS value. Furthermore, the fabrication errors can cause variations in the antenna array’s frequency response. The radiated power will be less due to the degradation of the antenna’s reflection coefficients. Nevertheless, the measured detection range is more than sufficient for visually impaired people to avoid collision.
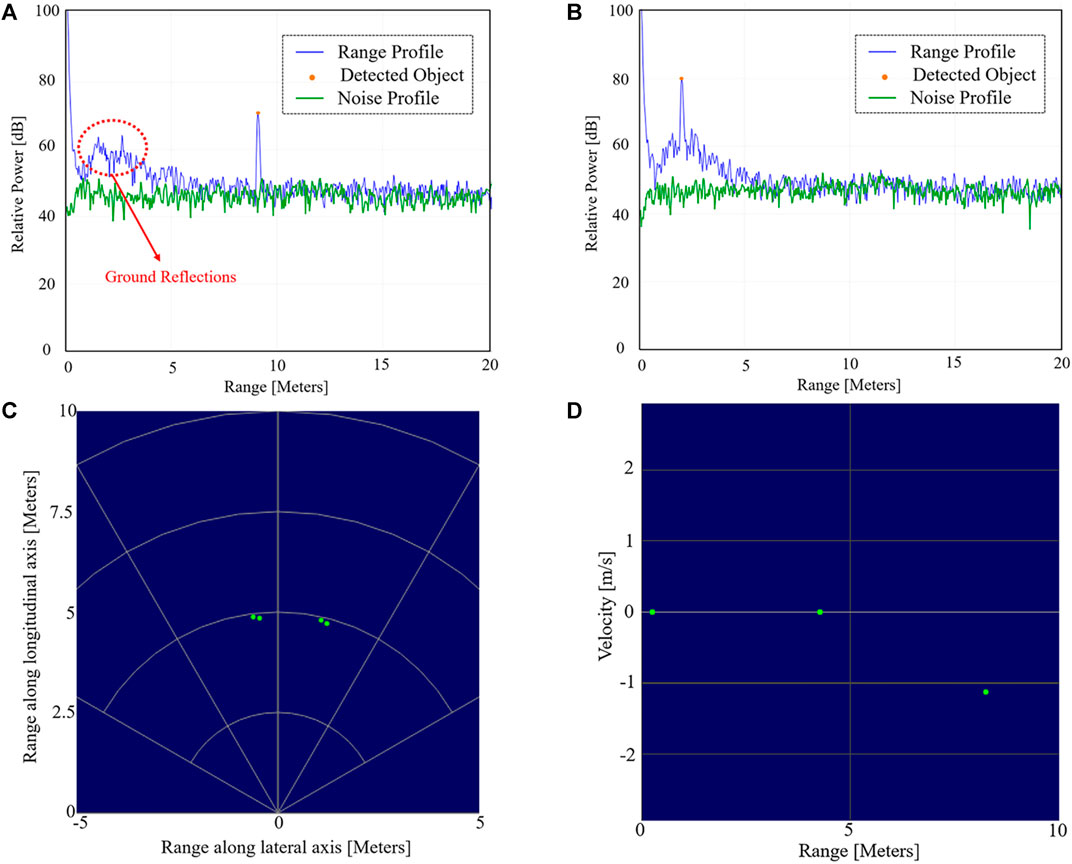
FIGURE 13. Field test results: (A) Range measurement for a person with RTCR, (B) Range measurement for a person, and (C) Angle measurement for a person, (D) Velocity measurement for a walking person.
Figure 13C demonstrates the radar system’s capability of detecting objects at different angles. In this scenario, one person holding the RTCR stands 20° to the right at a distance of 5 m. It can be seen from Figure 13C that there is one object at the position where the person stands. However, in the map, another object appears at 10° to the left at the same distance. The appearance of the extra dot can be caused by the higher level of mutual couplings between different RX channels, which can lead to phase disorder in between each channel. As a result, one copy of the object appears at a different angle but with the same distance. The distance between the TX and RX channels is 1.75 times free-space wavelength at 77 GHz. The mutual couplings mainly come from the surface waves in the antenna substrate as it is operating at high-frequency mmWave. Surface waves suppression structures, such as electromagnetic band-gap (EBG), defected ground structure (DGS), and metallic cavity surrounding the antenna elements can be introduced for surface wave suppression to avoid the mirror object dot in Figure 13C. Overall, the system can detect objects up to +/−32° of the broadside view, which can satisfy the demands of visually impaired users. Figure 13D shows the measured velocity in the scenario where one person is walking towards the radar system. The radar system successfully measures that the person is walking with a speed of 1.1 m/s at the range of 8 m. It can be detected that the person is walking towards the radar system by the negative value of velocity and the decreasing distance. Other than the walking person, there are two other stationary objects at 0.3 and 4.2 m in this scenario that are used as references. This field test successfully validates the wearable radar system’s functionality of measuring object velocity.
Table 1 provides a comparison of various research works targeting aids system design for visually impaired people. The aids system designs have been compared from the perspectives of detection range, angle, velocity, dimension, and flexibility. As can be seen from the table that the ultrasonic- and optic-based systems mainly suffer from a limited detection range. Among the EM radar-based designs, two designs (Jardak et al., 2019; Long et al., 2019) present decent detection ranges. However, the designs do not show the capability of extracting the object’s velocity. In addition, none of the existing works are designed in a flexible way for better wearability. Based on the comparison, the proposed design stands out from all the state-of-art existing aids systems due to its compactness, considerable detection range, angle, velocity, and its good flexibility for a comfortable wearing experience.
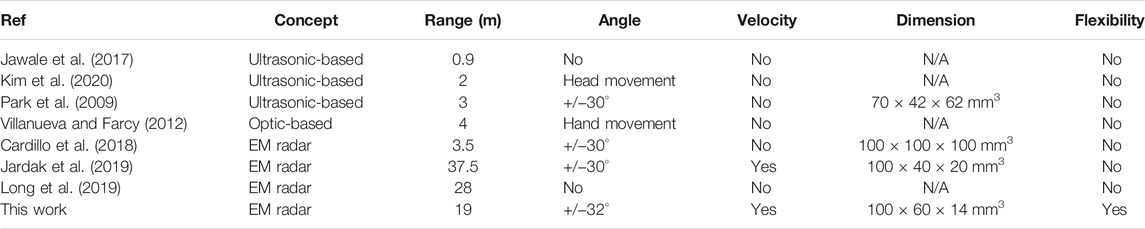
TABLE 1. Comparison of aids system designs for visually impaired people.
5 Conclusion
This paper presents a unique 77 GHz wearable radar system that will help visually impaired people to better perceive the environment and avoid collisions. The proposed radar system is implemented in a six-layer semi-flexible PCB so that it presents decent flexibility and wearability. The radar system is lightweight, compact, and convenient to wear. It can detect human objects and metallic objects in the range of up to 7 and 19 m respectively in a +/−32° broadside area. In addition, the object velocity can also be determined by the radar system. In conclusion, the proposed radar system can fulfill visually impaired people’s demands for collision avoidance in their everyday life and maintain the properties of being lightweight, compact, and wearable at the same time.
Data Availability Statement
The original contributions presented in the study are included in the article, further inquiries can be directed to the corresponding author.
Author Contributions
HZ, YY, and AS contributed to conception and design of the study. HZ was responsible for the design and optimization of the antenna array. YY and HZ performed the circuit design and field tests. JZ and YY contributes to the data processing algrithm. HZ, YY, and AS wrote the manuscript. All authors contributed to manuscript revision, read, and approved the submitted version.
Conflict of Interest
The authors declare that the research was conducted in the absence of any commercial or financial relationships that could be construed as a potential conflict of interest.
Publisher’s Note
All claims expressed in this article are solely those of the authors and do not necessarily represent those of their affiliated organizations, or those of the publisher, the editors and the reviewers. Any product that may be evaluated in this article, or claim that may be made by its manufacturer, is not guaranteed or endorsed by the publisher.
References
Ando, B., Baglio, S., Marletta, V., and Valastro, A. (2015). A Haptic Solution to Assist Visually Impaired in Mobility Tasks. IEEE Trans. Human-Mach. Syst. 45, 641–646. doi:10.1109/THMS.2015.2419256
Cardillo, E., and Caddemi, A. (2019). Insight on Electronic Travel Aids for Visually Impaired People: A Review on the Electromagnetic Technology. Electronics. 8, 1281. doi:10.3390/electronics8111281
Cardillo, E., Di Mattia, V., Manfredi, G., Russo, P., De Leo, A., Caddemi, A., et al. (2018). An Electromagnetic Sensor Prototype to Assist Visually Impaired and Blind People in Autonomous Walking. IEEE Sensors J. 18, 2568–2576. doi:10.1109/JSEN.2018.2795046
Fortuny, G., and Chareau, J.-M. (2013). Radar Cross Section Measurements of Pedestrian Dummies and Humans in the 24/77 GHz Frequency Bands. Luxembourg: Publications office of the European Union. doi:10.2788/80844
Harvey, A. F., and Cerna, M. (1993). The Fundamentals of Fft-Based Signal Analysis and Measurement in Labview and Labwindows. Austin, TX: National Instruments.
Jardak, S., Alouini, M.-S., Kiuru, T., Metso, M., and Ahmed, S. (2019). Compact Mmwave Fmcw Radar: Implementation and Performance Analysis. IEEE Aerosp. Electron. Syst. Mag. 34, 36–44. doi:10.1109/MAES.2019.180130
Jawale, R. V., Kadam, M. V., Gaikawad, R. S., and Kondaka, L. S. (2017). “Ultrasonic Navigation Based Blind Aid for the Visually Impaired,” in 2017 IEEE International Conference on Power, Control, Signals and Instrumentation Engineering (ICPCSI), 923–928. doi:10.1109/ICPCSI.2017.8391846
Kim, J.-H., Park, J.-E., and Lee, J.-M. (2020). 3-d Space Visualization System Using Ultrasonic Sensors as an Assistive Device for the Blind. IEEE J. Transl. Eng. Health Med. 8, 1–5. doi:10.1109/JTEHM.2020.2978842
Kiuru, T., Metso, M., Utriainen, M., Metsävainio, K., Jauhonen, H.-M., Rajala, R., et al. (2018). Assistive Device for Orientation and Mobility of the Visually Impaired Based on Millimeter Wave Radar Technology-Clinical Investigation Results. Cogent Eng. 5, 1450322. doi:10.1080/23311916.2018.1450322
Lakde, C. K., and Prasad, P. S. (2015). “Navigation System for Visually Impaired People,” in 2015 International Conference on Computation of Power, Energy, Information and Communication (ICCPEIC), 0093–0098. doi:10.1109/ICCPEIC.2015.7259447
Liyanage, D. K., and Perera, M. U. S. (2012). “Optical Flow Based Obstacle Avoidance for the Visually Impaired,” in 2012 IEEE Business, Engineering Industrial Applications Colloquium (BEIAC), 284–289. doi:10.1109/BEIAC.2012.6226068
Lloyd, J., Budge, C., La Grow, S., and Stafford, K. (2016). An Investigation of the Complexities of Successful and Unsuccessful Guide Dog Matching and Partnerships. Front. Vet. Sci. 3, 114. doi:10.3389/fvets.2016.00114
Long, N., Wang, K., Cheng, R., Hu, W., and Yang, K. (20192019). Low Power Millimeter Wave Radar System for the Visually Impaired. J. Eng. 2019, 6034–6038. doi:10.1049/joe.2019.0037
Mei, X., and Wu, K.-L. (2018). “How Low Does Mutual Coupling Need to Be for Mimo Antennas,” in 2018 IEEE International Symposium on Antennas and Propagation USNC/URSI National Radio Science Meeting, 1579–1580. doi:10.1109/APUSNCURSINRSM.2018.8608539
Meredov, A., Klionovski, K., and Shamim, A. (2020). Screen-Printed, Flexible, Parasitic Beam-Switching Millimeter-Wave Antenna Array for Wearable Applications. IEEE Open J. Antennas Propag. 1, 2–10. doi:10.1109/OJAP.2019.2955507
Orth, A., Kwiatkowski, P., and Pohl, N. (2020). “A Radar-Based Hand-Held Guidance Aid for the Visually Impaired,” in 2020 German Microwave Conference (GeMiC), 180–183.
Park, S., Kim, L., Ha, S., Cho, H., and Lee, S. Y. (2009). “An Electronic Aid for a Visually Impaired Person Using an Ultrasonic Sensor,” in 2009 Digest of Technical Papers International Conference on Consumer Electronics, 1–2. doi:10.1109/icce.2009.5012244
Pascolini, D., and Mariotti, S. P. (2011). Global Estimates of Visual Impairment: 2010. Br. J. Ophthalmol. 96, 614–618. doi:10.1136/bjophthalmol-2011-300539
R-5375 (2021). Halogen-free Ultra-low Transmission Loss Multi-Layer Circuit Board Materials. Osaka, Japan: Panasonic Corporation.
Villanueva, J., and Farcy, R. (2012). Optical Device Indicating a Safe Free Path to Blind People. IEEE Trans. Instrum. Meas. 61, 170–177. doi:10.1109/TIM.2011.2160910
Keywords: wearable system, FMCW radar, collision avoidance, MIMO antenna array, semi-flexible PCB
Citation: Zhang H, Yang Y, Zhou J and Shamim A (2022) Wearable Radar System Design on Semi-Flexible PCB for Visually Impaired People. Front. Comms. Net 2:768794. doi: 10.3389/frcmn.2021.768794
Received: 01 September 2021; Accepted: 24 November 2021;
Published: 12 January 2022.
Edited by:
Francisco Falcone, Public University of Navarre, SpainReviewed by:
Muhammad Aziz Ul Haq, Reykjavík University, IcelandYusuf Nur Wijayanto, Indonesian Institute of Sciences, Indonesia
Copyright © 2022 Zhang, Yang, Zhou and Shamim. This is an open-access article distributed under the terms of the Creative Commons Attribution License (CC BY). The use, distribution or reproduction in other forums is permitted, provided the original author(s) and the copyright owner(s) are credited and that the original publication in this journal is cited, in accordance with accepted academic practice. No use, distribution or reproduction is permitted which does not comply with these terms.
*Correspondence: Atif Shamim, YXRpZi5zaGFtaW1Aa2F1c3QuZWR1LnNh