 David Owens1
 Shuja Ansari
 Haitham Cruickshank
 Muhammad Ali Imran
- 1Institute for Communication Systems, University of Surrey, Guildford, United Kingdom
- 2James Watt School of Engineering, University of Glasgow, Scotland, United Kingdom
One of the most significant applications of Internet of Things are smart meters with wireless capabilities. Smart gas and electricity meters can capture half-hourly pricing and consumption data and send automated meter readings to your energy provider, in contrast to regular meters that can only register a running total of energy used. However, the legacy regular meters were not installed with wireless connectivity in mind and are usually found in hard-to-reach places for wireless radio coverage. To understand these scenarios, this paper provides signal strength measurements conducted at the Building Research Establishment determining building penetration losses in both 900 and 2,100 MHz band. We then present a building penetration loss model using these measurements that is practical and cost effective when compared to traditional statistical propagation loss models.
1 Introduction
Internet of Things (IoT) networks and devices make it possible to send data wirelessly at a low cost across large distances while consuming incredibly small amount of energy. One of the most common applications for IoT solutions is smart metering and wide coverage for these devices at large distances require practical coverage prediction models.
One of the important steps towards developing a coverage prediction model for smart meter (SM) deployment is understanding the building penetration loss. Measuring the building penetration loss (BPL) of the UK housing stock is a complex task, provided we are to visit people’s homes to carry out these measurements. Fortunately, Building Research Establishment (BRE) at Watford provides a suitable representation of the UK building stock, from Victorian housing to council estates to modern thermally efficient buildings. There are numerous building penetration loss studies carried out over the last 20 years. In this paper, we are interested in understanding the effect of frequency bands (900 and 2100 MHz), impacts of materials, impacts of building geometry, building stock, signal reach inside the building and distance to the measured reference point outside the building.
While there is considerable research in this area, from the extensive review of the literature we found there is no common established method for measuring BPL in the UK housing stock. With all the models present in the literature there is a lot of disagreement over the actual values of BPL based on building type. There are some studies that consider BPL as a function of the building and its material, such as [Rudd et al. (2014)], based at the Building Research establishment in Watford, England. Whilst other studies from OFCOM and COST 231 look at BPL as part of a chain of losses that make up a total path loss model from base station to inside the building. All these papers point to a mean building penetration loss of around 10 dBs reference, (Baig, et al., 2013), Usman and Shami, (2013), Gungor, et al. (2011), Guo et al., 2010), Rihan et al., 2012), Tell et al., 2013), Tell et al., 2012), Zhou and Schneider, (2012), Xiao-jun, 2014). While these works consider the mean loss, there are no practical considerations given to how these would apply to cover a large variation in building stock. Some other related work in this field can be found in (Horikoshi et al., 1986), Saleh, A. A. and Valenzuela, R. (1987), Arnold et al., 1989), Lafortune and Lecours, 1990), Seidel and Rappaport, (1992), (Driessen et al., 1993), Kozono and Watanabe, 1977), Keller, 1962), Blaunstein, and Christodoulou, 2007), Patsiokas et al., (1986), which provide useful background to the research.
Building on the previous fundamental research, this paper delivers a simple statistical building penetration model, that would be a representative of UK building types. These measurements are made in the 900 and 2,100 MHz bands, which are the primary bands for smart meters in the United Kingdom. The study is intended to provide an understanding of building penetration loss in suburban areas, where the housing is close to roads and typical cell coverage ranges from 1 to 2 kms. Hence, the contributions of this paper can be summarised as below:
1) BPL values at the BRE are presented obtained through classical analysis method of mean, standard deviation, min, and max values.
2) A deterministic and semi deterministic BPL model capable of using the coverage measured outside a house is developed that accurately predicts in building coverage with 99% certainty of connection, at a resolution of 10 m.
The rest of the article is structured as followed; Section 2 describes the measurement setup employed at the BRE, Section 3 presents results and analysis of the data collected at the measurement phase, conclusions are drawn in Section 4 and finally future work is discussed in Section 5.
2 Measurements set-up
The measurement set-up for the BRE is outlined in this section. We have a base station within 1 km of the building under measurement with one of the sectors having the main bore in the direction of the site. The measurements are made using a Rohde and Schwarz TSMU (R&S®) with a calibrated antenna. Measurements are made on the roads surrounding the property, to serve as a reference for the measurements made inside the property. The General Building Penetration Loss model is developed based on a series of measurements made at the BRE, in 14 buildings across the site. These buildings range from Victorian Terraced, to Council Estate Housing to modern thermally efficient houses. The external measurements are made on the adjacent roads to simulate the national measurement campaign and are used to provide a reference for the penetration loss calculations. These measurements are of the coverage from the local base station rather than a discrete dedicated transmitting source located outside the target buildings. This method closely mimics the real world and helps in deriving real-world values for BPL.
Moreover, the measurements made inside the property are categorised into 4 separate locations where smart meters are most likely to be located. These locations are defined as; outdoor, indoor first wall, deep indoors, and basement. The measurement methodology is repeated for the 14-representative buildings on site. Working with a group of researchers from the University of Surrey and SiRoDa (an independent specialist measurement company), we completed measurements over a few days. Each day the measurement equipment was checked against the reference datums, to ensure we had a consistent base line. For clarification, the base station height is 30 m, and the representative smart meter measurements are made at 1 m above ground level.
3 Data analysis and findings
Following the measurements, this section outlines the findings and our analysis leading to a realistic BPL model. Figure 1 shows the geographical area under observation at the BRE with the signal level (dBm) measurements at three different frequency bands overlaid. These signal level measurements along with the measurement values provided in Table 1 provide the reference baseline for the in-building measurements and are used to model a practical BPL model.
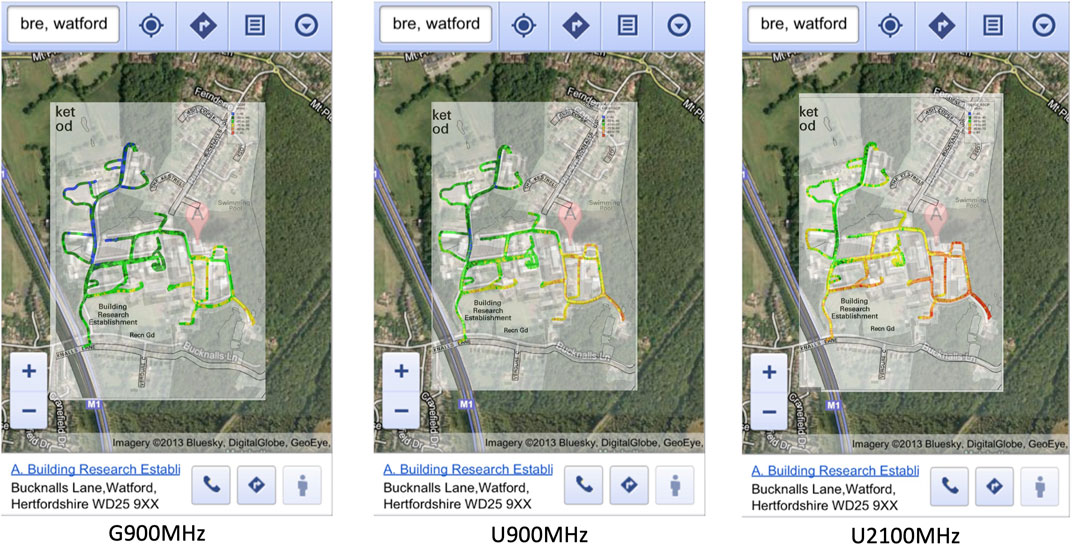
FIGURE 1. Coverage Measurements at BRE on adjacent roads.

TABLE 1. Results from the measurements made outside and inside the building at the BRE at 900 MHz.
Figure 2 shows the statistical distribution of the measurements made at the BRE, in terms of PDF (probability density function) and a CDF (cumulative distribution function). This shows relative signal of the narrow band GSM at 900 MHz and wide band UMTS measurements at 900 and 2100 MHz. As it can be observed from Figure 2, the GSM signal being narrow band goes the farthest as compared to the wide band UMTS (U900) and 2,100 MHz.
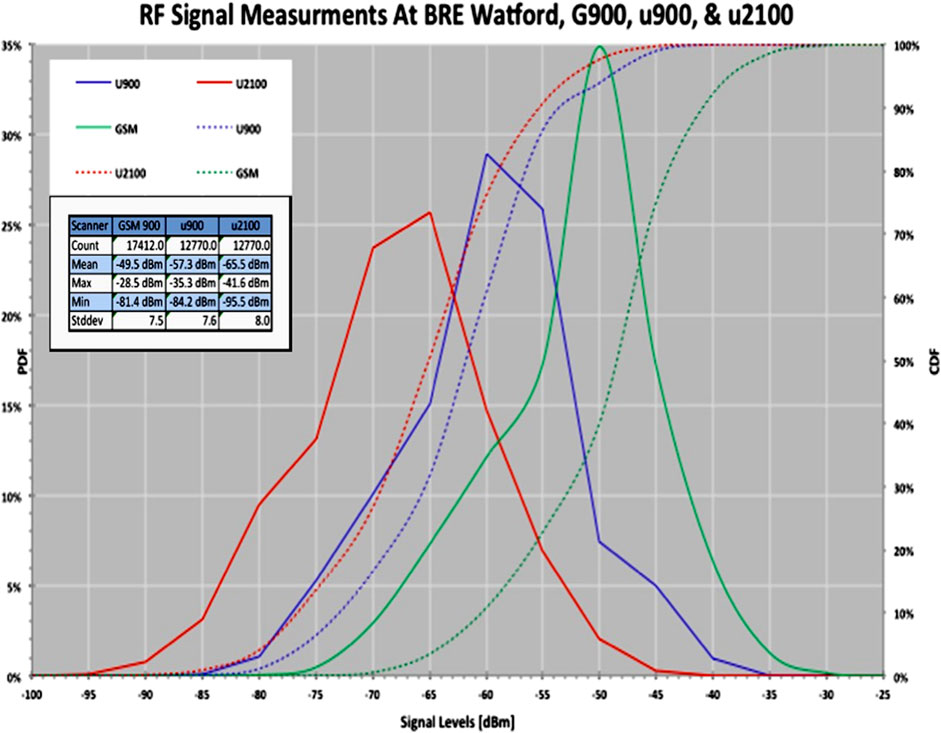
FIGURE 2. Statistical Distribution of the Measurements made at the BRE.
Based on the set of measurements outlined in Table 1, we were able to summarise all results into one simple set of results as shown in Figure 2 providing a more generalised view of BPL. Moreover, based on the measurements made at the BRE, we can determine the values of BPL as shown in the Table 2.
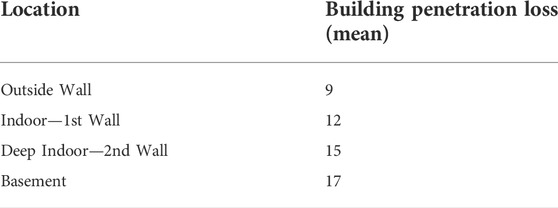
TABLE 2. Mean BPL based on measurements commissioned at BRE.
The Data Communications Company provided a table detailing probable locations of meters within the UK homes as shown in Table 3. Whilst the exact location is desirable, the probable location provided by DCC helps considerably in determining the BPL experienced by smart meters.
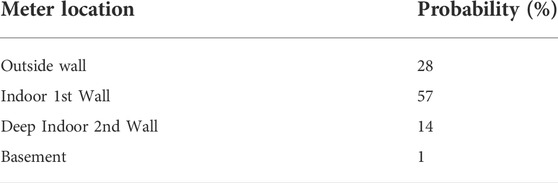
TABLE 3. Likely Meter Locations, as a percentage, within UK homes.
Summarising both the probability of a meter being in that location, with the likely loss experienced going from outside to inside. Adding a relative to the indoor 1st wall case, we can clearly see the delta between locations in Table 4.
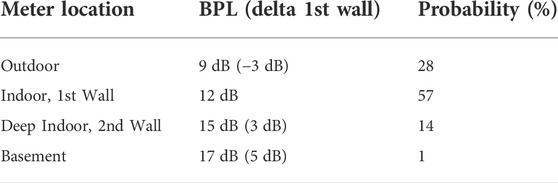
TABLE 4. Summarising both BPL and Probable location.
From Table 4, it is reasonable to assume that 85% of meter locations could be covered with a single threshold, based on the indoor 1st wall location. As both the deep indoor and basement can be mitigated by using an appropriate antenna connected to the receiver. It is now possible to provide a single threshold for smart meter coverage for the install decision as:
Equation above shows how a typical prediction threshold can be derived, using the limit sensitivity, a static fade margin, a building penetration loss, and prediction error margin in this case L90%. We can adapt this calculation for the different locations within the building by lowering the probability of coverage at those locations. Of course, another method would be to use an external higher gain omni directional antenna to achieve this as well. A single coverage threshold for planning purposes simplifies the planning process prior to commissioning, allowing binary decisions on coverage. This enables the service users to know when they go to a customer premise knowing in advance in all cases where the meters will be connected. This model process allows for that level of confidence.
Finally, Table 5 shows the building penetrations loss values chosen and their reliance on previous work. Coverage reliability is calculated by associating the additional dB loss to the statistical reliability of the prediction which has a notional standard deviation of 8 dBs. Using a measurement-based prediction method significantly improves that reliability and is verified by Telefonica’s Smart Meter Implementation Programme (SMIP).

TABLE 5. Final BPL chosen and their reliance on previous work.
4 Conclusion
In this paper we described the methodology and results of a series of measurements we made at the BRE. The main aim of this research is to prove that we can accurately predict in building coverage for the UK building stock, with a 99% certainty, without sacrificing the coverage footprint. We were able to prove that using measurement-based predictions coupled with the improved BPL model was both practical and cost effective when compared to traditional statistical propagation models and possibly incurred contractual penalties.
Using the traditional prediction model and BPL resulted in a significant number of additional sites, and a very high unnecessary additional cost to Telefonica and the UKs Smart Meter Programme. This study improved our understanding of BPL, and how it is impacted by; the environment, carrier frequency, materials, building types and the level of surrounding local coverage.
Finally, this research helped ensure Telefonica met its contractual commitments for the provisioned coverage for the SMIP. This programme has now successfully and efficiently installed over 5 million Smart Meters to date.
5 Future work
Whilst the measurement we made at the BRE are sufficient for our measurements, the statistical modelling for a general model of building penetration still requires further work to establish if this approach will be valid for all environments, types of materials, at variety of distance from the property with variable sample sizes and signal levels from multiple cells. The future research will now focus on verifying the measurement-based predictions with real world measurements of installation success rates, as well as improvements to the building penetration loss models too. This will lead to more precise determination of in-building coverage, which will benefit both operators and arguably more importantly IoT consumers.
The outlook for the UK Smart Meter Implementation Programme remains on track to deliver the benefit promised to the UK population. And we remain positive that it will allow us to make greener choices, managing our homes and energy use more efficiently. It has been a privilege to have contributed to such a major programme in a significant way.
Data availability statement
The raw data supporting the conclusion of this article will be made available by the authors, without reservation, by contacting the authors.
Author contributions
The work was developed in collaboration with all the authors. The work was conceived by DO. The paper was mainly drafted by DO and SA and was reviewed and updated by all co-authors. All authors have read and approved the final paper too.
Funding
This work was provided by both Telefonica and Digital Communication Company. This work is also supported in parts by Engineering and Physical Sciences Research Council (Grant no. EP/X525716/1).
Acknowledgments
The authors would like to thank the following members of the respective teams. Telefonica Smart Radio Team: Will James, Will Sparkes, Rachel Bowey and Jackie Gray. BRE Team: Dr M. Gantley, for access to BRE and his continued support for our research. SiRoDa Team: S. Page, D. Ineson and R. Cole.
Conflict of interest
The authors declare that the research was conducted in the absence of any commercial or financial relationships that could be construed as a potential conflict of interest.
Publisher’s note
All claims expressed in this article are solely those of the authors and do not necessarily represent those of their affiliated organizations, or those of the publisher, the editors and the reviewers. Any product that may be evaluated in this article, or claim that may be made by its manufacturer, is not guaranteed or endorsed by the publisher.
References
Arnold, H. W., Murray, R., and Cox, D. C. (1989). 815 MHz radio attenuation measured within two commercial buildings. IEEE Trans. Antennas Propag. 37 (10), 1335–1339. doi:10.1109/8.43547
Baig, M., Sithamparanathan, K., and Holmes, G. (2013). “Deploying unlicensed wireless technologies for the smart grid: The co-existence issue',” in 2013 7th International Conference on Signal Processing and Communication Systems (ICSPCS). doi:10.1109/ICSPCS.2013.6723955
Blaunstein, N., and Christodoulou, C. G. (2007). Radio propagation and adaptive antennas for wireless communication links: Terrestrial, atmospheric and ionospheric, 193. John Wiley & Sons.
BRE Building research establishment. Available at: https://bregroup.com.
Driessen, P., Gimersky, M., and Rhodes, T. (1993). Ray model of indoor propagation'Wireless personal Communications. New York: Springer, 225–249.
Gungor, V., Sahin, D., Koçak, T., Ergüt, S., Buccella, C., Cecati, C., et al. (2011). “Smart grid technologies: Communication technologies and standards,” in IEEE Transactions on Industrial Informatics, September 2011 (IEEE). doi:10.1109/TII.2011.2166794
Guo, W., Healy, W. M., and Zhou, M. (2010). ZigBee-wireless mesh networks for building automation and control. ChicagoUSA: IEEEIL, 731–736.
Horikoshi, J., Tanaka, K., and Morinaga, T. (1986). 1.2 GHz band wave propagation measurements in concrete building for indoor radio communications. IEEE Trans. Veh. Technol. 35 (4), 146–152. doi:10.1109/t-vt.1986.24084
Keller, J. B. (1962). Geometrical theory of diffraction. J. Opt. Soc. Am. 52 (2), 116–130. doi:10.1364/josa.52.000116
Kozono, S., and Watanabe, K. (1977). Influence of environmental buildings on UHF land mobile radio propagation. IEEE Trans. Commun. 25 (10), 1133–1143. doi:10.1109/tcom.1977.1093736
Lafortune, J.-F., and Lecours, M. (1990). Measurement and modeling of propagation losses in a building at 900 MHz. IEEE Trans. Veh. Technol. 39 (2), 101–108. doi:10.1109/25.54226
Patsiokas, S. J., Johnson, B., and Dailing, J. (1986). “Propagation of radio signals inside buildings at 150, 450 and 850 MHz,” in 36th IEEE Vehicular Technology Conference, Dallas, TX, USA, 20-22 May 1986, 66–71.
R&S® TSMU radio network analyzer. Available at: https://www.rohde-schwarz.com/us/product/tsmu-productstartpage_63493-8484.html.
Rihan, M., El-Khamy, M., and El-Sharkawy, M. (2012). “On ZigBee coexistence in the ISM band: Measurements and simulations,” in International Conference on Wireless Communications in Underground and Confined Areas, Clermont-Ferrand, France, 28-30 August 2012, 1–6.
Rihan, M., El-Khamy, M., and El-Sharkawy, M. (2012). On ZigBee coexistence in the ISM band: Measurements and simulations. New York: IEEE, 1–6.
Rudd, R., Craig, K., Ganley, M., and Hartless, R. (2014). Building materials and propagation. Ofcom: Final Report, 2604.
Saleh, A. A., and Valenzuela, R. (1987). A statistical model for indoor multipath propagation. IEEE J. Sel. Areas Commun. 5 (2), 128–137. doi:10.1109/jsac.1987.1146527
Seidel, S. Y., and Rappaport, T. S. (1992). 914 MHz path loss prediction models for indoor wireless communications in multifloored buildings. IEEE Trans. Antennas Propag. 40 (2), 207–217. doi:10.1109/8.127405
Tell, R. A., Kavet, R., and Mezei, G. (2013). Characterization of radiofrequency field emissions from smart meters. J. Expo. Sci. Environ. Epidemiol. 23 (5), 549–553. doi:10.1038/jes.2012.102
Tell, R., Sias, G., Vazquez, A., Sahl, J., Turman, J., Kavet, R., et al. (2011). Radiofrequency fields associated with the Itron smart meter. Radiat. Prot. Dosim. 151 (1), 17–29. doi:10.1093/rpd/ncr468
Tell, R., Sias, G., Vazquez, A., Sahl, J., Turman, J., Kavet, R., et al. (2012). Radiofrequency fields associated with the Itron smart meter. Radiat. Prot. Dosim. 151 (1), 17–29. doi:10.1093/rpd/ncr468
Usman, A., and Shami, S. H. (2013). Evolution of communication technologies for smart grid applications. Renew. Sustain. Energy Rev. 19, 191. doi:10.1016/j.rser.2012.11.002
Xiao-jun, C. (2014). The study for inverted-F antenna integrated with ZigBee module. School of Electronic and information,Hangzhou Dianzi University, Beijing, China. Technical report.
Keywords: smart meter, internet of things, building penetration loss, propagation loss modeling, 900 MHz, 2100 MHz (3G)
Citation: Owens D, Ansari S, Cruickshank H, Tafazolli R and Imran MA (2022) Building penetration loss measurements and modelling in the 900 and 2100 MHz band for smart meter installation. Front. Comms. Net 3:1011754. doi: 10.3389/frcmn.2022.1011754
Received: 04 August 2022; Accepted: 08 August 2022;
Published: 08 September 2022.
Edited by:
Khaled Rabie, Manchester Metropolitan University, United KingdomReviewed by:
Syed Aziz Shah, Coventry University, United KingdomAkram Alomainy, Queen Mary University of London, United Kingdom
Copyright © 2022 Owens, Ansari, Cruickshank, Tafazolli and Imran. This is an open-access article distributed under the terms of the Creative Commons Attribution License (CC BY). The use, distribution or reproduction in other forums is permitted, provided the original author(s) and the copyright owner(s) are credited and that the original publication in this journal is cited, in accordance with accepted academic practice. No use, distribution or reproduction is permitted which does not comply with these terms.
*Correspondence: Shuja Ansari, c2h1amEuYW5zYXJpQGdsYXNnb3cuYWMudWs=