 Saptorshee Kanto Chakraborty
 Alessio D'Amato
 Massimiliano Mazzanti
- 1Paris School of Economics, Paris, France
- 2Sustainability Environmental Economics and Dynamics Studies SEEDS, Ferrara, Italy
- 3Tor Vergata University of Rome and SEEDS, Rome, Italy
- 4University of Ferrara and SEEDS, Ferrara, Italy
Carbon taxation is a highly debated environmental policy tool and can contribute to tackling climate change. Before the advent of the emission trading system in the European Union, forms of carbon taxation were present in some EU member states; furthermore, after the approval of the well-known EU Green Deal, carbon taxes can gain momentum in addressing emissions from sectors not involved in the EU Emissions Trading System. Due to this historical evolution of environmental policies over the last decades and in the presence of a system that assigns to EU member states, the governance of energy and fiscal issues, heterogeneous carbon/energy policy settings may determine the impact on growth and trade. This article provides food for thought for a policy through an empirical evaluation of the impact on the gross domestic product of trade spillovers related to carbon taxation in the European Union.
1. Introduction
Climate change is among the biggest long-run threats to human existence and can only be tackled by bringing down carbon dioxide (CO2) emissions. The nature of international environmental externalities of such emissions requires the careful design of policy intervention, involving both national authorities and international institutions. A part of the toolbox to address climate impacts rests on providing emitting firms and consumers with the “correct” incentives in terms of the costs and benefits linked to greenhouse gas (GHG) emissions, i.e. the implementation of the so-called polluter pays principle. Along these lines, the recent evolution of climate policy in the European Union has led to the introduction of and several amendments to the so-called Emissions Trading System (EU ETS), i.e., a cap-and-trade scheme aimed at achieving CO2 emissions reduction in a cost-effective way. This has been the subject of substantial literature, including, among others, Hintermann (2010), who suggests that EU ETS prices are increasingly aligned with abatement costs; Ellerman et al. (2015), who highlight the potential reasons why the performance of the EU ETS may have not been realized to its full potential; and, finally Bayer and Aklin (2020), who point out that a significant share of emissions was covered by the EU ETS system during the period between 2008 and 2016, reducing more than 1 billion tons of CO2. Climate targets are a relevant part of the so-called EU Green Deal and involve several levels of intervention, including explicit member states' involvement, such as in the case of the Effort Sharing Regulation dealing with sectors not involved in the EU ETS. However, the EU ETS is an important part of the carbon pricing strategy of the European Union. The relevance of the EU climate policy rests on the unique economic and political integration of the European Union itself, featuring a strong commitment to promoting economic, social, and territorial cohesion by reducing disparities between the levels of development of the various regions' (Art. 174, Maastricht Treaty), as well as its potential role as one of the biggest world-level CO2 emitters and, at the same time, one of the largest economies in the world and the world's largest trader of manufactured goods and services.1 These figures include intra-EU trade, which is a relevant aspect that is addressed in our article.2 Any policy discussion should therefore also account for intra-EU trade-related issues, and this is, in our view, a relevant point, as the centralized EU ETS is coupled with existing national-level companion policies and is, at the same time, part of a wider policy scenario, which is clearly testified, for example, by the development of the EU ETS,3 the EU Fit For 55 package, and the EU Carbon Border Adjustment Mechanism, as part of a full set of integrated policies. The main aim of this paper is therefore to provide an assessment of the potential trade-induced spillovers that may be triggered by asymmetries in domestic climate policies.
The best instrument to trigger climate mitigation efforts is the subject of an extensive literature focused on carbon taxation, as in Nordhaus (2006) and Weisbach and Metcalf (2009); cap-and-trade, as in Stavins (2007) and Keohane (2009), or possible combinations of the two, e.g., Aldy et al. (2010). We focus here on carbon taxation in the European Union. Finland was the first country to introduce a carbon tax in 1990m followed by 15 European countries, and the range of such taxes varies from 1 to over 130. Carbon taxes were introduced in two distinct timelines in Europe, one starting in the early 1990s in the Scandinavian region with the next one following in the mid-2000s in Western European countries like Switzerland, Iceland, Ireland, and Portugal.
Carbon prices arising from carbon taxes and emission trading schemes are, in several cases, very low, far from the carbon prices recommended by the High-level Commission on Carbon Pricing of the World Bank in 2017 (CPLC, 2017); as a result, there is significant space for broadening the tax base and increasing rates (SDSN and IEEP, 2019). Analysis performed by the EEA (2019), among others, suggests that the introduction of a carbon tax is expected to improve fiscal sustainability, due to a lower deficit arising in climate change mitigation scenarios. More important for our purposes, the recent evolution of EU climate policy, most notably the climate neutrality target embedded in the EU Green Deal (COMMISSION, EUROPEAN, 2019) is expected to bring about the need for policies at the EU member state level that may complement the EU ETS and cover, for example, sectors that are outside the EU ETS itself. Also, the proposal of reform related to the Energy Taxation Directive (ETD)4 calls for potential changes in national rates to increase harmonization and make rates' structure compatible with EGD objectives. These ambitious policies are expected to fuel the debate on the relevance of carbon taxation to be introduced at the national level.
As it clearly emerges from Table 1, significant heterogeneity across EU member states exists with reference to carbon taxation in the context of a wider economic heterogeneity in relation to efforts or capabilities in participating in the economic integration process, levels of investments in research and development, human capital, and other key drivers of growth and development (see EEA, 2014, EEA, 2019). The impact of such heterogeneity is the basis of a significant strand of the literature, including considerations on trade integration (e.g., Badinger, 2005; Baldwin, 2006), monetary integration (e.g., De Grauwe, 2006; Gregoriou et al., 2011), capital market integration (Baele et al., 2004), labor market integration (Nowotny et al., 2009), or institutional integration (Mongelli, 2008). A well-established and substantial set of contributions has addressed the effect of EU ETS and carbon taxes on employment, growth, and innovation; seminal contributions in this respect include Barde and Owens (1993), OECD (2001), EEA (2005), Sabel and Zeitlin (2010), Ekins and Speck (2011), and Milne and Andersen (2014). In a recent paper (Metcalf and Stock, 2020), the issue related to the macroeconomic impacts of carbon taxation is specifically addressed, focusing on the European Union, and weak evidence of the negative impact of carbon taxation on employment and gross domestic product (GDP), coherently with most of the previous empirical and modeling exercises, is found.5
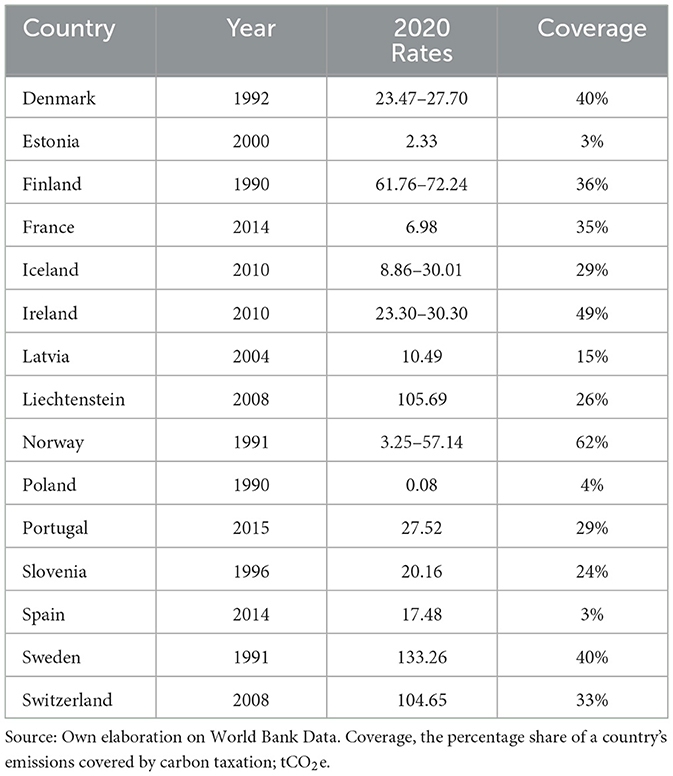
Table 1. EU Carbon Taxes–USD/tCO2e.
The possibility of changes in domestic carbon policies is relevant for several reasons, including the possibility of trade-related spillovers across countries. Existing work addresses the potential policy effects on trade competitiveness in the European Union (Costantini and Mazzanti, 2012). Also, the fiscal consequences of raising public revenue through carbon and/or environmental taxes are addressed (e.g., EEA, 2019), but there is still a lack of literature on trade-related spillovers created due to heterogeneous carbon tax regimes in different EU countries. In such a scenario, attention should be raised to the, in our view under-investigated, trade-related impacts of carbon policy stringency heterogeneity. We do this by adopting a robust approach, involving both parametric and non-parametric analysis. Our work is, in our view, relevant from both a methodological and a policy perspective. In the first respect, there is still a lack of literature on trade-related spillovers created due to heterogeneous carbon tax regimes in different EU countries. Specifically, Metcalf and Stock (2020), the work that is closest to our own, explicitly mention that trade-related impacts are not accounted for. A better understanding of the nature of these spillovers is also the source of our methodological contribution, which allows us to disentangle different relevant dimensions of trade spillovers triggered by carbon taxation.
The remainder of this article is divided as follows: Section 2 highlights our identification strategy, showing the methodology we adopted to take into account cross-country carbon tax-based spillovers and briefly introducing data used in our analysis as well as the estimation strategy. Section 3 provides our findings, and in Section 4, we present our conclusions.
2. Materials and methods
2.1. Identification strategy
We examine the output effects of carbon tax spillovers in EU countries from 1990 to 2017. We base our analysis on traditional macroeconomic literature, (including Auerbach and Gorodnichenko, 2012, 2017; Goujard, 2017). We start with a simple baseline model to assess trading partners' carbon tax policy effect on domestic output. Domestic economic output at time t for the country i is determined by
where Yi,t is the real domestic output of country i and the lagged values of Yi,t−k are used to control for underlying dynamics from domestic outcomes (we use natural logs in this case). Xi,t−m is a row vector of control variables to determine short to medium-term economic outcomes (log of lagged industrial employment rate, percentage of emissions covered by the carbon taxation system, with a lag of one and two years). λi and δt capture unobserved country and time-specific shocks. The vector of coefficients αl capture the effects due to fiscal policies, in our case carbon taxation, from trading partners, allowing for a dynamic response of output in own country. ΔCTSi,t, which is central to our analysis, is clarified in the following subsection.
2.2. Measuring cross-country carbon tax spillover
Given the relevance of intra-EU trade and given that EU countries are integrated both in the context of product and factor markets, the imposition of a carbon tax in one country is expected to lead to effects in other countries through trade. We calculate the carbon tax spillovers ΔCTSi,t from the trading partner countries as a weighted sum of the carbon tax of the trading partner countries:
where CTj,t represents the carbon tax revenue of trading partner j in year t. The term expijs represents manufacturing exports of country i toward country j in the year s; the term expis represents the total manufacturing exports of country i in the year s to the rest of the world. Equation (2) weights the carbon tax in country j by the long-run importance of the same country in the exports of country i. The term inside the parentheses depicts the average share of manufacturing exports of country i toward country j; we average export flows over our time sample to take into consideration the possibility of measurement errors and endogeneity. The structure of long-term trade weights is uncorrelated with changes in industrial structures or relative trade costs. Thus, this approach is capable of identifying fiscal spillover shocks that are solely due to changes in trading partners' carbon tax policies (Nekarda and Ramey, 2011; Goujard, 2017).
By comparison, spillover shocks computed in Equation (2) take an average of carbon taxation using manufacturing exports as weights, so that they are not fully comparable to domestic fiscal shocks. We propose (Auerbach and Gorodnichenko, 2011, 2012) to scale foreign shocks related to carbon taxation to ease the comparison between our estimated spillover effects and the traditional multipliers of domestic fiscal policies, as follows:
where GDPj, b−1 is the value of GDP previous to the base year b; CTj,t is carbon tax revenue expressed in percentage points of GDP. The first term in parentheses is the share of imports of country j coming from country i in base year b.6 The term in square brackets represents the size of the total imports of country j in base year b relative to the government spending of country j in base year b. The term is used to correct the fact that certain parts of government expenditure come from imports. The last term in curly brackets represents the size of the shock related to carbon taxation in country j, calculated using lagged real GDP of the year preceding the base year b. Our empirical analysis is based on data related to real GDP, industrial employment, and exchange rate from Penn World tables (Feenstra et al., 2016); data for carbon tax revenue and emissions covered in each sector are collected from a new data set from World Bank: Carbon Pricing Dashboard.7 Data for emissions were given as a share of global GHG emissions; we converted the data to percentages and deducted them from 1, thus obtaining emissions not covered by the introduced carbon tax. Data for government expenditure is from the Eurostat database.8 Data for import and export are from the WITS database. The measure of fiscal spillovers as in Equation (3) draws from Auerbach and Gorodnichenko (2011, 2012), the spillovers are directly rescaled by domestic GDP; therefore, estimates are comparable to domestic multipliers. But in the literature, there is a lack of theoretical guidance on the exact size of the shocks transmitted abroad. In the context of the European Union, where fiscal policies are decided by national governments, fiscal consolidation packages are primarily designed in order to avoid curtailing the negative effects on the domestic economy. Similarly, the indirect effects of government spending on domestic private spending should be taken into consideration.
As Figure 1 shows, our measure of carbon tax–related spillovers appears quite small up to 2010 and then starts increasing steadily, suggesting the need to further investigate the potential for related cross-country spillover at the EU level. Table A1 in Appendix A2 in the Supplementary material reports the summary statistics.
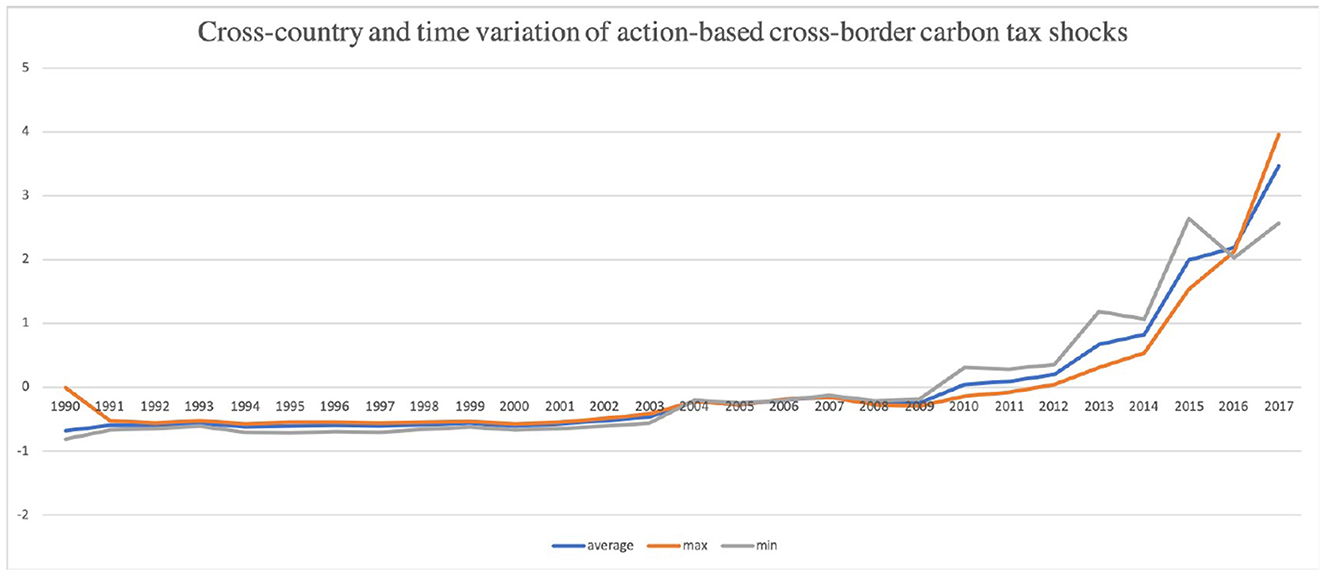
Figure 1. Cross-country and time variation of action-based cross-border carbon tax shocks.
2.3. Estimation strategy
Parametric regression models can be plagued by model misspecification issues (Hsiao, 2007); the view adopted here is that it is more appropriate to use parametric estimation strategies when the functional form of relationships under scrutiny is known. Since we cannot fully rely on this assumption, we chose to complement our parametric analysis, based on the model reported in Equation (1), with a strategy based on local linear dummy variable estimation (LLDVE) method, which was first proposed by Li et al. (2011); and eventually also applied by Silvapulle et al. (2017) and Awaworyi Churchill et al. (2019). However, LLDVE-type models are very sensitive to bandwidth selection: we select the bandwidth by leaving one unit out of least square cross-validation method as suggested by Li and Racine (2009) and Silvapulle et al. (2017).9
3. Results
3.1. Tests
As our study involves trade-based spillovers among EU member states taking into account carbon taxation, it is likely that, due to connectivity among countries, cross-correlations of errors might be an intrinsic phenomenon; ignoring cross-sectional dependence (CSD) of errors can have serious consequences. For this reason, we start by testing for CSD using the test suggested by Bailey et al. (2016). The null hypothesis is that there is cross-sectional independence across countries in the panel. Results are shown in Table A2 in Appendix A2 of the Supplementary material; the test rejects the null hypothesis of cross-sectional independence; at the opposite, from the alpha values we can get the conclusion of a strong degree of CSD.10
We then test for stationarity of our variables using second-generation panel unit root tests, namely, CADF and CIPS (Pesaran, 2007), for which results are provided in Table A3 in Appendix A2 in the Supplementary material.11 These tests assume a multifactor error structure using heterogeneous factor loadings to model various forms of CSD and are thus suited for our data, due to the high CSD discussed above. We further use PANIC and PANICCA tests (Bai and Ng, 2004; Reese and Westerlund, 2016) to investigate more in-depth sources of unit roots among the variables. PANIC decomposes each variable into deterministic, common, and idiosyncratic components so that the origin of the cause of non-stationarity can be traced back, that is, whether it arises from common components or from an idiosyncratic component or both. Bai and Ng (2004) imply the need to specify the number of common factors needed to represent the CSD: we assume one common factor following Westerlund and Urbain (2015), which indicates that a small number of unobserved common factors is sufficient to deal with macroeconomic examples. The test PANICCA is a mix of both approaches by Bai and Ng (2004) and Pesaran (2007), where cross-sectional averages are used in place of principal component estimates—used in Bai and Ng (2004)—to proxy for factors by pooling individual Augmented Dickey Fuller test statistics on de-factored residuals to test for non-stationarity of the idiosyncratic components. Results for PANIC and PANICCA tests12 are shown in Appendix A2, in Table A4, in the Supplementary material.
In the case of the CADF test, the null hypothesis is a “homogeneous non-stationary” series, but we are unable to reject it for our variables (except for GDP and lagged GDP) since the p-value is large enough compared to the CADF critical values. In the case of the CIPS test, for all the variables, except for lagged employment and carbon taxation, it fails to reject the null hypothesis of “homogeneous non-stationary.” The null hypothesis of a unit root in the idiosyncratic components of all panels is tested via the Pa, Pb, and PMSB test statistics suggested by Bai and Ng (2010) and Reese and Westerlund (2016): for all variables, we fail to reject the null hypothesis. The idea of failing to reject the null hypothesis is that we are unable to comment with confidence that idiosyncratic components of the panels are free from unit root processes.
3.2. Estimation results
3.2.1. Parametric results
One of the easiest ways to deal with unit-specific heterogeneity is time-invariant fixed effects, but the basic assumption behind fixed-effects is that the unobserved heterogeneity is constant over time, which is too stringent an assumption in regard to spillover studies. The presence of unobserved heterogeneity and cross-sectional dependence can cause inferential problems in non-stationary panels. We borrow three static and two dynamic estimation techniques of the common correlated effects (from Pesaran, 2006, Eberhardt et al., 2013, and Chudik and Pesaran, 2015).
In Table 2, we show, for both spillover types, the results from three types of static estimators: mean group (MG), common correlated effects mean group (CCEMG), and augmented mean group (AMG).13
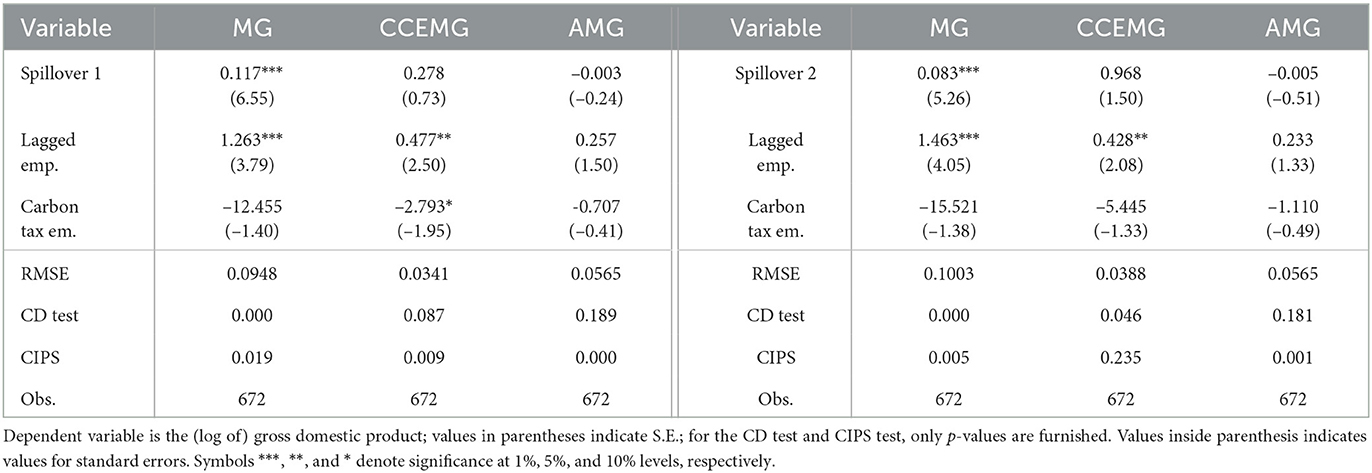
Table 2. Static heterogeneous estimation results.
We also perform a dynamic heterogeneous type analysis, which is presented in Table 3,14 where we used dynamic common correlated effects (DCCE) OLS and DCCE GMM estimators (Chudik and Pesaran, 2015; Neal, 2015; Ditzen, 2018).15
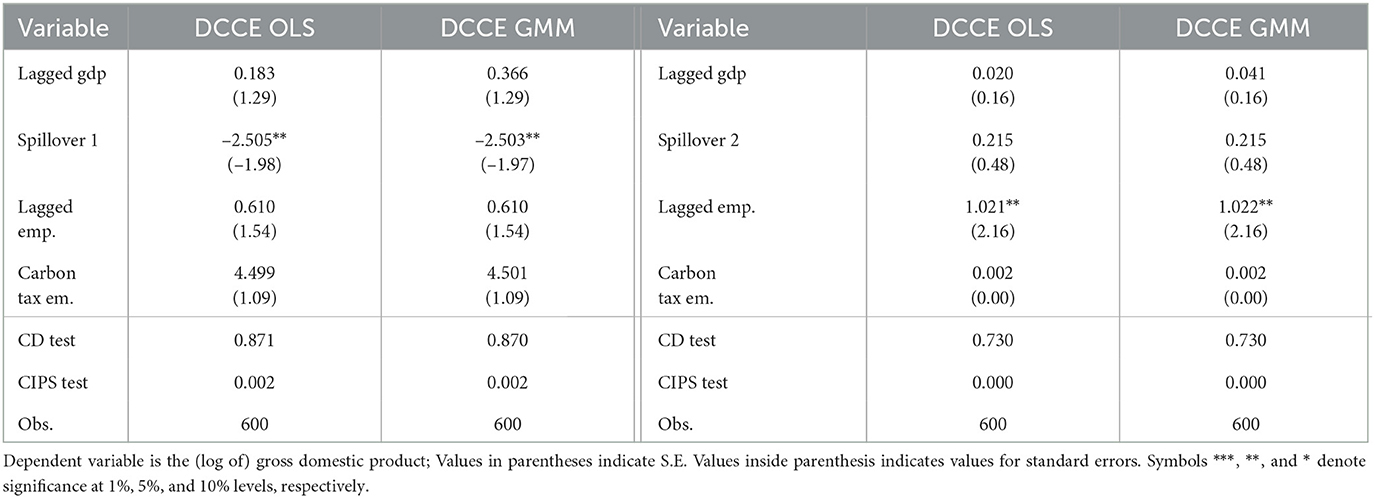
Table 3. Dynamic heterogenous estimation results.
In the case of static estimators (Table 2), Spillover 1 and Spillover 2 appear to be positive and significant for the MG-type estimator, while for the other two types of estimators, both spillovers yield non-significant results.16 For the dynamic-type case, only spillover 1 appears to be significant but features a negative sign (Table 3).
3.2.2. Non-parametric results
We here extend our work to non-parametric analysis, also in relation to the lacking knowledge a priori of the functional form for the relationships under scrutiny (Baltagi et al., 1996).
We employ a bivariate nonparametric analysis to understand the effects of spillovers created due to the imposition of a carbon tax on economic growth inside the EU member states. Figure 2 reports the LLDVE time-varying coefficient estimates in relation to Spillover 1, including as a shaded area the 90% confidence interval. Figure 3 reports the corresponding results for spillover 2.17
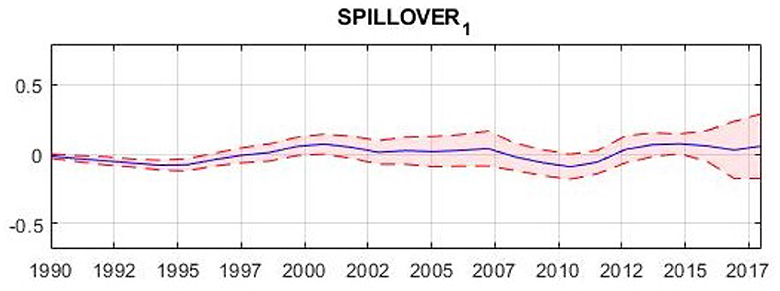
Figure 2. Local linear dummy variable estimation panel estimates—Spillover type 1.
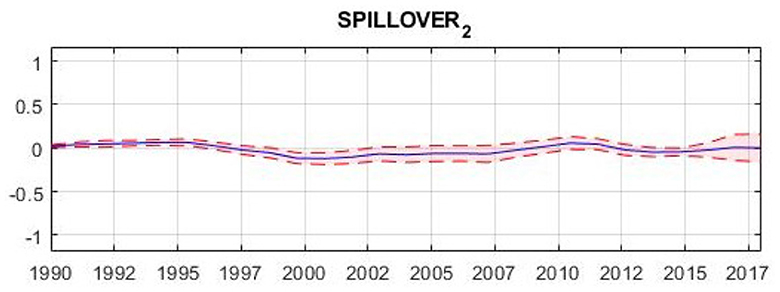
Figure 3. Local linear dummy variable estimation panel estimates—Spillover type 2.
Overall, from our non-parametric analysis, the relationship between our two modeled trade-driven spillovers and GDP shows similar behaviors, with a bit tighter confidence interval in the case of Spillover 2; on the other hand, no clear “structural” relation in the long-term appears to emerge.
4. Conclusion
The analysis in this article allowed us to address a topic that is, in our view, under-investigated, namely, the trade-related transboundary impacts of carbon policy stringency heterogeneity, with a focus on EU member states. This is done by adopting both a parametric and a non-parametric approach for the analysis. The literature already focuses on the role potentially played by carbon taxation both in driving competitiveness and in affecting the fiscal sustainability of countries; these two possible consequences of carbon and environmental taxation imply, in an institutional setting such as that of the European Union featuring policy heterogeneity, potential spillover across countries triggered by trade. Our analysis is purposefully relevant for policymakers in the European Union and in other federal systems. It is indeed so as in practice, notwithstanding the potential necessity to homogenize fiscal mechanisms, real-world situations often witness fiscal heterogeneity, especially in the environmental realm.
The set of parametric specifications regarding static and dynamic models present diversified evidence on the spillover effects, in terms of size, significance, and sign. More specifically, for static-type heterogeneous estimators, Spillover 1 and Spillover 2 appear to be positive and significant for the MG-type estimator, while for the other two types of estimators, both spillovers yield non-significant results. For the dynamic-type case, only Spillover 1 appears to be significant but features a negative sign. Nonetheless, our dynamic analysis suggests that a negative trade-related spillover may arise due to carbon tax heterogeneity, providing a possible rationale for more homogeneity in climate policies. Turning to the case of non-parametric analysis, the relationship between our two modeled trade-driven spillovers and GDP shows similar behaviors, with a bit tighter confidence interval in the case of Spillover 2.
Due to the lacking knowledge a priori of the functional form for the relationships under scrutiny, non-parametric outcomes are preferred in this context. The evidence does not convey a clear “structural” relation in the long term between GDP and carbon tax–related spillovers. This evidence is in line with Metcalf and Stock (2020), who find in a parametric setting without spillovers a zero to modest positive impact on GDP.
Further research can investigate through ex-ante selection the most preferred model, considering parametric/non-parametric, additive/nonadditive forms, and various time-related specifications, from fixed effects to non-parametric individual time trends. In fact, it is relevant to recognize the existence of high uncertainty surrounding the true data-generating process. In general, there is a bias-efficiency trade-off when comparing parsimonious to complex models. Considering more flexible models is appealing but may come at the price of unfeasible or extremely inefficient estimates: trade-offs must be carefully analyzed across the diversified set of available models (Mazzanti and Musolesi, 2020). A better understanding of the nature of the spillovers under scrutiny is also important to disentangle different relevant dimensions of trade spillovers triggered by carbon taxation. Of course, the generality of our results, as well as their external validity, need to be subjected to significant additional research.
Data availability statement
Publicly available datasets were analyzed in this study. This data can be found here: Carbon tax data is from WB Carbon Pricing Dashboard (https://carbonpricingdashboard.worldbank.org), Macroeconomic data is from Penn World Tables (https://www.rug.nl/ggdc/productivity/pwt/?lang=en), data for Government Expenditure is from EUROSTAT (https://ec.europa.eu/eurostat/web/main/data/database), and finally data for trade is from WITS database (https://wits.worldbank.org/).
Author contributions
Conceptualization: AD'A and MM. Formal analysis and writing—original draft: SC. Methodology: SC and MM. Supervision: MM. Visualization and writing—review and editing: AD'A. All authors contributed to the article and approved the submitted version.
Conflict of interest
The authors declare that the research was conducted in the absence of any commercial or financial relationships that could be construed as a potential conflict of interest.
The author MM declared that they were an editorial board member of Frontiers at the time of submission. This had no impact on the peer-review process and the final decision.
Publisher's note
All claims expressed in this article are solely those of the authors and do not necessarily represent those of their affiliated organizations, or those of the publisher, the editors and the reviewers. Any product that may be evaluated in this article, or claim that may be made by its manufacturer, is not guaranteed or endorsed by the publisher.
Supplementary material
The Supplementary Material for this article can be found online at: https://www.frontiersin.org/articles/10.3389/frevc.2023.1197592/full#supplementary-material
Abbreviations
CO2, carbon dioxide; EEA, European economic area; EGD, European green deal; WITS, world integrated trade solution; CADF, cross-section augmented dickey-fuller; CIPS, cross-sectional Im, pesaran and shin; PANIC, panel analysis of nonstationarity in idiosyncratic and common components; PANICCA, panel analysis of nonstationarity in idiosyncratic and common components and cross-section average; RMSE, root mean squared error; LLDVE, local linear dummy variable estimation; CD, cross-sectional dependence; OLS, ordinary least square; GMM, generalized method of moments; SE, standard errors; ADF, augmented dickey-fuller; MG, mean group; CCEMG, common correlated effects mean group; AMG, augmented mean group.
Footnotes
1. ^Available online at: https://ec.europa.eu/trade/policy/eu-position-in-world-trade.
2. ^According to Eurostat “Statistics Explained” on intra-EU trade in goods, in 2019, most member states had a share of intra-EU exports between 50 and 75%.
3. ^See Chakraborty and Mandel (2022a,b) for EU ETS impacts on economy at regional levels of European Union
4. ^See European Commission, Directorate-General for Taxation and Customs Union (2020), and the related consultation process, according to which a significant agreement appears on the need for the ETD to be revised to aid the European Union's transition toward climate neutrality, tackle environmental concerns like air pollution, and better promote energy saving and efficiency but in such away to get amore harmonized application.
5. ^We refer readers to Metcalf and Stock (2020) for details. The macroeconomic implications of carbon taxation in the literature are addressed, among others, in by Timilsina (2022).
6. ^We use 2011 as the base year.
7. ^We convert nominal tax rates to real tax rates by dividing with GDP deflator (data from Penn World Tables).
8. ^Also in this case, we use 2011 as the base year.
9. ^Li and Racine (2009) proposes LLDVE as a superior procedure in terms of the rate of convergence for the coefficient function compared to averaged local linear estimates (ALLE) framework. It is important to note that ALLE and LLDVE both tend to remove fixed effects by deducing a smoothed version of the cross-time average from each panel. See Appendix A1 in the Supplementary material for a detailed explanation of LLDVE method.
10. ^See Ertur and Musolesi (2017), Chakraborty and Mazzanti (2019a,b) for additional details on the methodological aspects.
11. ^The null hypothesis for the second-generation test is that all series are non-stationary; in our case, we fail to reject the null hypothesis depending on the p-values for all variables.
12. ^Both PANIC and PANICCA test the null hypothesis of a unit root in the idiosyncratic components of all panels.
13. ^The left half of the table shows results for Equation (1) using various types of static estimators, including only Spillover 1, while the right half focuses on Spillover 2.
14. ^Also in this case, the table reports, respectively, results including Spillover 1 (left part) and Spillover 2 (right part).
15. ^Advanced panel data techniques are very well adjusted to modeling various sources of heterogeneity. Panel data estimations imply severe restrictions on the CSD across units: a fixed effects model would assume independence across units, and the time-effects term critically restricts the nature of this dependence when using random effects model. Common correlated effects (CCE) estimation technique used by Pesaran (2006) treats factors as nuisance terms and is used to introduce parsimonious means to model CSD, with the aim of removing the effects of such nuisance terms by proxying them using their observable counterparts, namely cross-sectional averages and explanatory variables. The CCE approach has also been extended over time and performs well enough in a dynamic setting. The Dynamic common correlated effects (DCCE; Chudik and Pesaran, 2015) is a dynamic extension of the CCE used by Pesaran (2006) by adding lags of the cross-sectional averages to account for strong CSD. The basic assumption of DCCE and CCE is that the coefficients are randomly distributed around a common mean. The number of lags is restricted to allow for sufficient degrees of freedom, and calculated by lags are added, the motivation being that the number of cross-sectional units and time periods should grow at the same rate, which is necessary for a dynamic setting (Chudik and Pesaran, 2015).
16. ^The difference between the estimators of CCEMG and AMG is clearly explained in Eberhardt and Bond (2009); in our setting, the fact that in the AMG case we obtain somehow contradictory results may be justified by the potential presence of a “common dynamic process.”
17. ^Time-varying responsiveness of GDP to common trend, lagged GDP, lagged employment, and carbon tax are reported in Appendix A2, Figures A1–A4, in the Supplementary material.
References
Aldy, J. E., Krupnick, A. J., Newell, R. G., Parry, I. W. H., and Pizer, W. A. (2010). Designing climate mitigation policy. J. Econ. Liter. 48, 903–934. doi: 10.1257/jel.48.4.903
Auerbach, A., and Gorodnichenko, Y. (2011). Fiscal multipliers in recession and expansion. Technical report, National Bureau of Economic Research, Inc. doi: 10.3386/w17447
Auerbach, A., and Gorodnichenko, Y. (2017). Fiscal stimulus and fiscal sustainability. Technical Report w23789, National Bureau of Economic Research, Cambridge, MA. doi: 10.3386/w23789
Auerbach, A. J., and Gorodnichenko, Y. (2012). Measuring the output responses to fiscal policy. Am. Econ. J. 4, 1–27. doi: 10.1257/pol.4.2.1
Awaworyi Churchill, S., Inekwe, J., Smyth, R., and Zhang, X. (2019). R & D intensity and carbon emissions in the G7: 1870–2014. Energy Econ. 80, 30–37. doi: 10.1016/j.eneco.2018.12.020
Badinger, H. (2005). Growth Effects of Economic Integration: Evidence from the EU Member States. Rev. World Econ. 141, 50–78. doi: 10.1007/s10290-005-0015-y
Baele, L., Ferrando, A., Hördahl, P., Krylova, E., and Monnet, C. (2004). Measuring European financial integration. Oxford Rev. Econ. Policy 20, 509–530. doi: 10.1093/oxrep/grh030
Bai, J., and Ng, S. (2004). A PANIC attack on unit roots and cointegration. Econometrica 72, 1127–1177. doi: 10.1111/j.1468-0262.2004.00528.x
Bai, J., and Ng, S. (2010). Panel unit root tests with cross-section dependence: a further investigation. Econ. Theory 26, 1088–1114. doi: 10.1017/S0266466609990478
Bailey, N., Kapetanios, G., and Pesaran, M. H. (2016). Exponent of cross-sectional dependence: estimation and inference. J. Appl. Econometr. 31, 929–960. doi: 10.1002/jae.2476
Baldwin, R. E. (2006). In or Out: Does it Matter? An Evidence-Based Analysis of the Euro's Trade Effects. London: Centre for Economic Policy Research (CEPR).
Baltagi, B. H., Hidalgo, J., and Li, Q. (1996). A nonparametric test for poolability using panel data. J. Econometr. 75, 345–367. doi: 10.1016/0304-4076(95)01779-8
Barde, J.-P., and Owens, J. (1993). “The greening of taxation,” in Organisation for Economic Cooperation and Development (The OECD Observer) 27.
Bayer, P., and Aklin, M. (2020). The European Union Emissions Trading System reduced CO 2 emissions despite low prices. Proc. Nat. Acad. Sci. 117, 8804–8812. doi: 10.1073/pnas.1918128117
Chakraborty, S. K., and Mandel, A. (2022a). EU regional EKC cluster. SSRN:4246009. doi: 10.2139/ssrn.4246009
Chakraborty, S. K., and Mandel, A. (2022b). Understanding EU regional macroeconomic tipping points using panel threshold technique. Unpublished. doi: 10.2139/ssrn.4246020
Chakraborty, S. K., and Mazzanti, M. (2019a). Energy intensity and green energy innovation: checking heterogeneous country effects in the OECD. Struct. Change Econ. Dyn. 52, 328–343. doi: 10.1016/j.strueco.2019.12.002
Chakraborty, S. K., and Mazzanti, M. (2019b). Modelling the Green Knowledge Production Function with Latent Group Structures for OECD countries. Technical report, SEEDS, Sustainability Environmental Economics and Dynamics Studies.
Chudik, A., and Pesaran, M. H. (2015). Common correlated effects estimation of heterogeneous dynamic panel data models with weakly exogenous regressors. J. Econometr. 188, 393–420. doi: 10.1016/j.jeconom.2015.03.007
Costantini, V., and Mazzanti, M. (2012). On the green and innovative side of trade competitiveness? The impact of environmental policies and innovation on EU exports. Res. Policy 41, 132–153. doi: 10.1016/j.respol.2011.08.004
CPLC. (2017). High-Level Commission on Carbon Prices. Report of the High-Level Commission on Carbon Prices. Washington, DC: World Bank. License: Creative Commons Attribution CC BY 3.0 IGO.
De Grauwe, P. (2006). What Have we Learnt about Monetary Integration since the Maastricht Treaty? JCMS. 44, 711–730. doi: 10.1111/j.1468-5965.2006.00659.x
Ditzen, J. (2018). Estimating dynamic common-correlated effects in stata. Stata J. 18, 585–617. doi: 10.1177/1536867X1801800306
Eberhardt, M., and Bond, S. (2009). Cross-section dependence in nonstationary panel models: a novel estimator. Munich Personal RePEc Archive.
Eberhardt, M., Helmers, C., and Strauss, H. (2013). Do spillovers matter when estimating private returns to R & D? Rev. Econ. Stat. 95, 436–448. doi: 10.1162/REST_a_00272
EEA (2005). Market-based instruments for environmental policy in Europe. Copenhagen: European Environment Agency.
EEA (2019). The sustainability transition in Europe in an age of demographic and technological change: An exploration of implications for fiscal and financial strategies. Technical Report 23/2019.
EEA. (2014). Resource-efficient green economy and EU policies. Number 2014, 2 in EEA report. Publication Office of the European Union, Luxembourg.
Ekins, P., and Speck, S. (2011). Environmental Tax Reform (ETR). London: Oxford University Press. doi: 10.1093/acprof:oso/9780199584505.001.0001
Ellerman, A. D., Valero, V., and Zaklan, A. (2015). An Analysis of Allowance Banking in the EU ETS. SSRN Electronic Journal. doi: 10.2139/ssrn.2631964
Ertur, C., and Musolesi, A. (2017). Weak and strong cross-sectional dependence: a panel data analysis of international technology diffusion. J. Appl. Econometr. 32, 477–503. doi: 10.1002/jae.2538
European Commission Directorate-General for Taxation Customs Union. (2020). Proposal for a Carbon Border Adjustment mechanism (CBAM). Available online at: https://eur-lex.europa.eu/legal-content/EN/ALL/?uri=PI_COM%3AAres%282020%291350037
Feenstra, R. C., Inklaar, R., and Timmer, M. P. (2016). Penn World Table 9.0. Groningen Growth and Development Centre.
Goujard, A. (2017). Cross-Country Spillovers from Fiscal Consolidations: Cross-country spillovers from fiscal consolidations. Fiscal Stud. 38, 219–267. doi: 10.1111/1475-5890.12096
Gregoriou, A., Kontonikas, A., and Montagnoli, A. (2011). Euro area inflation differentials: unit roots and nonlinear adjustment: euro area inflation differentials. JCMS. 49, 525–540. doi: 10.1111/j.1468-5965.2010.02150.x
Hintermann, B. (2010). Allowance price drivers in the first phase of the EU ETS. J. Environ. Econ. Manage. 59, 43–56. doi: 10.1016/j.jeem.2009.07.002
Hsiao, C. (2007). Panel data analysis-advantages and challenges. TEST 16, 1–22. doi: 10.1007/s11749-007-0046-x
Keohane, N. O. (2009). Cap and Trade, Rehabilitated: Using Tradable Permits to Control U.S. Greenhouse Gases. Rev. Environ. Econ. Policy 3, 42–62. doi: 10.1093/reep/ren021
Li, D., Chen, J., and Gao, J. (2011). Non-parametric time-varying coefficient panel data models with fixed effects. Econometr. J. 14, 387–408. doi: 10.1111/j.1368-423X.2011.00350.x
Li, Q., and Racine, J. S. (2009). Nonparametric Econometric Methods. Bingley: Emerald. 1. ed edition. doi: 10.1108/S0731-9053(2009)25
Mazzanti, M., and Musolesi, A. (2020). Modeling green knowledge production and environmental policies with semiparametric panel data regression models. SEEDS Working Papers 1420, SEEDS, Sustainability Environmental Economics and Dynamics Studies.
Metcalf, G. E., and Stock, J. H. (2020). Measuring the Macroeconomic Impact of Carbon Taxes. AEA Papers Proc. 110, 101–106. doi: 10.1257/pandp.20201081
Milne, J. E., and Andersen, M. S. (2014). Handbook of Research on Environmental Taxation. Cheltenham: Edward Elgar Publishing.
Mongelli, F. (2008). European economic and monetary integration, and the optimum currency area theory. Directorate General Economic and Financial Affairs (DG ECFIN), European Commission.
Neal, T. (2015). Estimating heterogeneous coefficients in panel datamodels with endogenous regressors and common. Niversity of New South Wales Working Paper.
Nekarda, C. J., and Ramey, V. A. (2011). Industry evidence on the effects of government spending. Am. Econ. J. 3, 36–59. doi: 10.1257/mac.3.1.36
Nordhaus, W. (2006). The “stern review” on the economics of climate change. Technical Report w12741, National Bureau of Economic Research, Cambridge, MA. doi: 10.3386/w12741
Nowotny, E., Mooslechner, P., Ritzberger-Grünwald, D., and Nationalbank, O. (2009). The integration of European labour markets. Cheltenham, Glos, UK, Northampton, Mass: Edward Elgar. doi: 10.4337/9781849802277
OECD. (2001). Environmentally Related Taxes in OECD Countries: Issues and Strategies Environment. Paris: OECD. doi: 10.1787/9789264193659-en
Pesaran, M. H. (2006). Estimation and inference in large heterogeneous panels with a multifactor error structure. Econometrica 74, 967–1012. doi: 10.1111/j.1468-0262.2006.00692.x
Pesaran, M. H. (2007). A simple panel unit root test in the presence of cross-section dependence. J. Appl. Econometr. 22, 265–312. doi: 10.1002/jae.951
Reese, S., and Westerlund, J. (2016). Panicca: Panic on Cross-Section Averages: PANICCA: PANIC ON CROSS-SECTION AVERAGES. J. Appl. Econometr. 31, 961–981. doi: 10.1002/jae.2487
Sabel C. F. and Zeitlin, J.. (2010). Experimentalist Governance in the European Union: Towards a New Architecture. Oxford: Oxford University Press.
SDSN and IEEP (2019). The 2019 Europe Sustainable Development Report. Sustainable Development Solutions Network and Institute for European Environmental Policy: Technical report.
Silvapulle, P., Smyth, R., Zhang, X., and Fenech, J.-P. (2017). Nonparametric panel data model for crude oil and stock market prices in net oil importing countries. Energy Econ. 67, 255–267. doi: 10.1016/j.eneco.2017.08.017
Stavins, R. (2007). A U.S. Cap-and-Trade System to Address Global Climate Change. Working Paper Series rwp07-052, Harvard University, John F. Kennedy School of Government. doi: 10.2139/ssrn.1026353
Weisbach, D., and Metcalf, G. (2009). The design of a carbon tax. Harv. Environ. Law Revi. 33, 499. doi: 10.2139/ssrn.1327260
Keywords: carbon taxation, spillovers, trade, EU, climate policy
Citation: Chakraborty SK, D'Amato A and Mazzanti M (2023) A note on carbon taxes and trade spillovers within Europe. Front. Environ. Econ. 2:1197592. doi: 10.3389/frevc.2023.1197592
Received: 31 March 2023; Accepted: 28 July 2023;
Published: 21 August 2023.
Edited by:
Michael Getzner, Vienna University of Technology, AustriaReviewed by:
Istemi Berk, Dokuz Eylul University, TürkiyeStephan Sommer, Bochum University of Applied Sciences, Germany
Copyright © 2023 Chakraborty, D'Amato and Mazzanti. This is an open-access article distributed under the terms of the Creative Commons Attribution License (CC BY). The use, distribution or reproduction in other forums is permitted, provided the original author(s) and the copyright owner(s) are credited and that the original publication in this journal is cited, in accordance with accepted academic practice. No use, distribution or reproduction is permitted which does not comply with these terms.
*Correspondence: Saptorshee Kanto Chakraborty, c2FwdG9yc2hlZUBnbWFpbC5jb20=