 William Brakewood
 Kiara Lee
 Lindsay Schneider2
 Anubhav Tripathi
- 1School of Engineering, Brown University, Providence, RI, United States
- 2Center for Biomedical Engineering, School of Engineering, Brown University, Providence, RI, United States
- 3School of Public Health, Brown University, Providence, RI, United States
- 4Spectra Systems Corporation, Providence, RI, United States
Plasma has significant utility as an input for diagnostics and screening for conditions such as viral infections, cancer, and more. However, plasma is difficult to obtain at the point-of-care, as separation from whole blood is typically carried out via centrifugation. We have designed and optimized a low-cost, simple-to-operate microfluidic device which carries out the separation of plasma from whole blood. The device utilizes depth filtration as its separation mechanism and collects plasma via capillary action, allowing for operation without components that drive flow externally. We first optimized device dimensions and operating parameters and demonstrated consistent separation efficiencies for the samples with hematocrits ranging from 25–65%. The impact of input sample hematocrit percentage on flow rate through the device was also examined, with samples with hematocrits greater than 45% decreasing plasma flow rate. Lastly, we evaluated the ability of this device to produce plasma with a high protein concentration and found no significant difference between protein levels in samples from the device compared to samples produced via centrifugation. This system produced plasma with a maximum separation efficiency of 88.5% and achieved a maximum plasma volume of ∼14 μl from a 50 μl whole blood input. The low cost, simplicity of operation, and high plasma quality associated with this device give it many advantages in a point-of-care setting. This device could be integrated into plasma-based diagnostic workflows to increase access to various types of disease testing and monitoring.
1 Introduction
Blood contains a wealth of information regarding the health status of an individual. Thus, blood-based diagnostic tools have become critically important in medicine, with current and potential applications ranging from human immunodeficiency virus (HIV) diagnosis to the detection of traumatic brain injuries (DiFonzo and Bordia, 1998; Mondello et al., 2011). For many blood-based diagnostic tests, plasma is used instead of whole blood to eliminate the impact of red blood cells on the assay. The need for plasma isolation presents a challenge in efforts to develop diagnostics for the point-of-care. The current gold standard for plasma separation is centrifugation, which is typically done with large, complex, and expensive equipment not well suited to point-of-care applications (Mielczarek et al., 2016).
One method for identifying whether a diagnostic method will be useful in point-of-care settings is the ASSURED criteria developed by the World Health Organization, which emphasizes that useful point-of-care diagnostics should be affordable, sensitive, specific, user-friendly, rapid and robust, equipment-free, and delivered (Kettler et al., 2004). There are significant challenges in developing blood plasma separation strategies which meet these criteria due to the limitations inherent to the standard separation approach of centrifugation.
Since centrifugation techniques are incongruous with point-of-care diagnostics, there have been efforts to develop microfluidic devices that can carry out plasma separation at a small-scale. Microfluidic devices are systems which process fluids in channels with dimensions sized in the micron scale (Whitesides, 2006). Microfluidic devices have significant potential for use in point-of-care diagnostics because they allow for diagnostic results to be obtained from small volume inputs, often a few microliters of biological samples. Furthermore, microfluidic devices themselves are physically small objects, with lengths and widths which are often only a few centimeters, making these devices extremely suitable for the distribution and localized use necessary for point-of-care diagnostics (Whitesides, 2006).
To separate plasma, microfluidic devices have taken several approaches, including leveraging the Zweifach-Fung effect through microchannel geometry, which involves chaining together many branching channels of varying sizes, causing branches to have different flow rates when blood is pumped through the device (Yang et al., 2006; Kersaudy-Kerhoas et al., 2010). Cells have greater mass than the molecules contained within plasma, therefore, their greater momentum at constant velocity causes them to disproportionately flow down higher flow rate channels, allowing for separation of plasma from red blood cells when sufficient branching paths are placed in series. A similar effect for plasma separation has also been demonstrated by developing microfluidic devices with perpendicular channels that have different flow rates driven by electric fields (Jiang et al., 2011; Mohammadi et al., 2015). Further devices have been developed which carry out blood plasma separation via small-scale centrifugation (Amasia and Madou, 2010), or by integrating membrane separation into a digital microfluidic (Dixon et al., 2020). These approaches have been shown to be capable of producing high plasma quality, volumetric yield, and throughput. However, one commonality in many of these microfluidics methods is that they require a force actively driving fluid flow in the device, for example, a pressure difference or an electric field. Because of this requirement, these microfluidic devices often require external components like syringe pumps or electrodes which can significantly increase the overall size, cost, and complexity of a diagnostic tool, limiting their potential for point-of-care diagnostics.
Several plasma separation microfluidic devices have been created which avoid the need for external flow driving components through the leveraging of capillary action. Since capillary forces can be generated without external components, a capillary flow-driven microfluidic has the potential to function as a standalone device, with many of these devices being compiled in a review by Wang et al. (2021). One capillary flow-driven microfluidic was previously demonstrated by Maria et al. (2017) which utilized a wettability gradient to separate plasma from whole blood, obtaining 99.9% pure plasma and >20% volume yield from whole blood samples <10 µL in 15 min. However, maintaining the wetting properties of channels within the device requires storage in deionized water under a vacuum, which may impose limitations on the device’s usage in some point of care settings. Devices utilizing dead-end filtration have also been demonstrated by Hauser et al. and Son et al., which both were capable of producing high-quality plasma from small whole blood samples with minimal external components required to drive flow; although the device outlined by Son et al. does require the use of a desiccator to drive flow via degassing prior to use (Son et al., 2014; Hauser et al., 2018). A further capillary flow driven device was outlined by Madadi et al. (2015) which utilized a microfluidic filtration based system to produce very small quantities of highly pure plasma with no external components required to drive flow in this device, and demonstrated this systems potential for certain point of care applications with low volume requirements by validating the system with the detection of thyroid stimulating hormone. Finally, there have been microfluidic devices carrying out blood plasma separation, which are entirely paper based, including the device developed by Songjaroen et al. (2012). While this system is extremely affordable and simple to operate, the plasma produced by the system is confined to the paper of the device, which limits the potential diagnostic applications of the system to those which can currently be carried out on paper. This is a challenge found with lateral flow assays, in which the physical properties must be controlled by physical and chemical modifications to the paper, which may affect the biological molecule or sample of interest (Kasetsirikul et al., 2020). A more thorough list of blood plasma separation microfluidic devices currently existing in the literature can be found in Supplementary Table S1.
In this manuscript, we present a system for the separation of plasma from whole blood which uses a simple microfluidic device. This device consists of a plasma separation depth filter placed over a microchannel cut into a double-sided adhesive. Whole blood is placed onto the filter, and it is pulled from the filter into the microchannel via capillary action where it can be collected via pipette using an outlet well. We first optimized the design of the device in terms of separation efficiency and volume yield, then characterized the capillary flow, and finally compared the concentration of protein in the plasma collected by this device to that of plasma obtained by centrifugation. Our method does not require external flow or complex equipment, nor does it require material surface modifications for optimization that may affect the integrity of the sample. The microfluidic device developed here uses a small whole blood input volume of 50–100 μl and can produce high-quality plasma in under 2 minutes. This device is ideal for point of care settings because it is extremely simple to operate, only requiring a pipette to input and collect samples, and is simply and inexpensively manufactured from a glass sheet, a coverslip, double sided adhesive, and a small filter.
2 Methods and materials
2.1 Microfluidic device components
The microfluidic device developed here has five components: one 4’’x 3’’ glass slide base obtained from Ted Pella Inc. (Redding, CA), a 40 x 22 mm Fisherbrand Premium Cover Glass obtained from Thermo Fisher Scientific (Waltham, MA, United States), two acrylic adhesive patches (ARcare 90445Q, Adhesives Research, Glen Rock, PA, United States) and a separation filter made from CF-D23-X1 Whole Blood Separation Media, Cross Flow, Nominal Hct Range, obtained from I.W. Tremont (Hawthorne, NJ, United States). Manufacturing this device also required the use of a 3 mm diameter and 6 mm diameter Accu-Punch disposable skin biopsy punch obtained from Electron Microscopy Sciences (Hatfield, PA).
2.2 Human whole blood
Human whole blood was obtained from Research Blood Components, LLC (Watertown, MA, United States) and used sodium heparin as an anticoagulant.
2.3 Hematocrit variation
To vary hematocrit in experiments, whole blood was centrifuged at 3400 RPM for 10 min. Plasma was then separated from red blood cells in the centrifuged sample via pipette and transferred to a separate tube. Plasma and red blood cells were then recombined in various volume ratios to create samples at the desired hematocrit.
2.4 Plasma volume yield measures
To establish device volume yield, plasma was collected using a pipette set to 1 µL by aspirating around the collection well fifteen times and placing the collected plasma into a tube. The total volume collected was measured by aspirating the final sample into a 20 µL pipette and slowly dispensing air from the tip until plasma began to exit, with the volume setting on the pipette at this point being recorded as the final volume collected. Plasma volume yield was then calculated by dividing this value by 55% of the input volume, which corresponds to the amount of plasma in whole blood for the 55% hematocrit whole blood samples used in volume collection experiments. A further trial was conducted to determine volume yield with no limit on the number of aspirations, which was used to determine the maximum amount of plasma that could be extracted from this device.
2.5 Plasma quality measures
Plasma quality was measured by comparing the concentration of hemoglobin in plasma samples prepared by this device to the concentration of hemoglobin in both whole blood samples and plasma samples prepared via centrifugation. To obtain hemoglobin measurements, we first diluted samples 1:1 in nuclease-free water and incubated them for 10 min at room temperature to lyse any red blood cells present. Any cell debris in the sample was removed to produce a homogenous solution by centrifuging them at 3,400 RPM for 10 min and collecting the supernatant via pipette. Hemoglobin concentration was then found by measuring the sample’s absorbance at 414 nm via the UV-Vis setting on the NanoDrop™ 1,000 Spectrophotometer from Thermo Fisher Scientific (Waltham, MA, United States). This absorbance value was then converted to a separation value by comparing absorbance values of the device samples to those of lysed whole blood and plasma controls. The absorbance of plasma produced by the device could then be converted to a separation efficiency value according to the following formula:
This formula places the 414 nm absorbance of the whole blood sample at 0% separation efficiency and the 414 nm absorbance of centrifuged plasma at 100% separation efficiency. All NanoDrop™ 1,000 readings were carried out three times per sample and averaged to ensure the stability and accuracy of measurements. If output values within this average were unstable due to being outside the operating range of the NanoDropTM-1,000, then samples were diluted until a stable absorbance value could be found, with the stable average value being multiplied by an appropriate dilution factor.
2.6 Protein quantification
Protein passage through the device filter was measured by comparing the concentration of protein in plasma obtained from this device to that of plasma obtained by centrifugation. To remove any residual impurities which may impact concentration readings, plasma samples produced by the device were centrifuged for 10 min at 3,400 RPM and the absorbance of the supernatant at 280 nm was measured using the NanoDrop™ 1,000 to determine protein concentration. All absorbance readings were taken three times per sample to ensure consistency between readings. This concentration was then compared to the concentration of protein in plasma produced via centrifugation at 3,400 RPM for 10 min.
2.7 Statistical analyses
Statistical analyses were performed in GraphPad Prism 8 (San Diego, CA, United States) or Microsoft Excel (Redmond, WA, United States) with alpha = 0.05. *: p ≤ 0.05; **: p ≤ 0.01; ***: p ≤ 0.001; ****: p ≤ 0.0001. α = 0.05 for all analyses. Statistically significant differences are shown in the figures.
3 Results
3.1 Microfluidic separation device manufacturing
The microfluidic device designed here separates plasma from whole blood and consists of a plasma separation filter placed over a microchannel cut into a double-sided adhesive. To manufacture the plasma separation device a 60 mm x 60 mm patch of double-sided adhesive was first cut. An inlet well, outlet well, and 1 mm x 40 mm rectangular channel connecting both wells were cut into the adhesive using a 3 mm diameter holepunch, 6 mm diameter holepunch, and straight razor, respectively (Figure 1A). The bottom side of the cut adhesive was then attached to a glass slide, forming the microfluidic design. A glass coverslip was placed on top of the adhesive to form the main channel such that it was adjacent to, but not covering, the inlet well. The cover of the top of the adhesive was not immediately attached to the coverslip to ensure proper alignment of the outlet well’s collection area. To form the collection area of the outlet well a second 20 mm x 20 mm adhesive patch was placed over the outlet well such that its edge was in contact with the coverslip. The position of the outlet well was marked on the second adhesive, and a 3 mm hole was placed in the marked position via holepunch. The top cover for the first adhesive was then removed, and the coverslip and second adhesive were attached to the device in the previous configuration to form the main channel and the collection area (Figure 1B). Finally, a 10 mm x 10 mm piece of the filter was placed over the inlet well (Figure 1C).
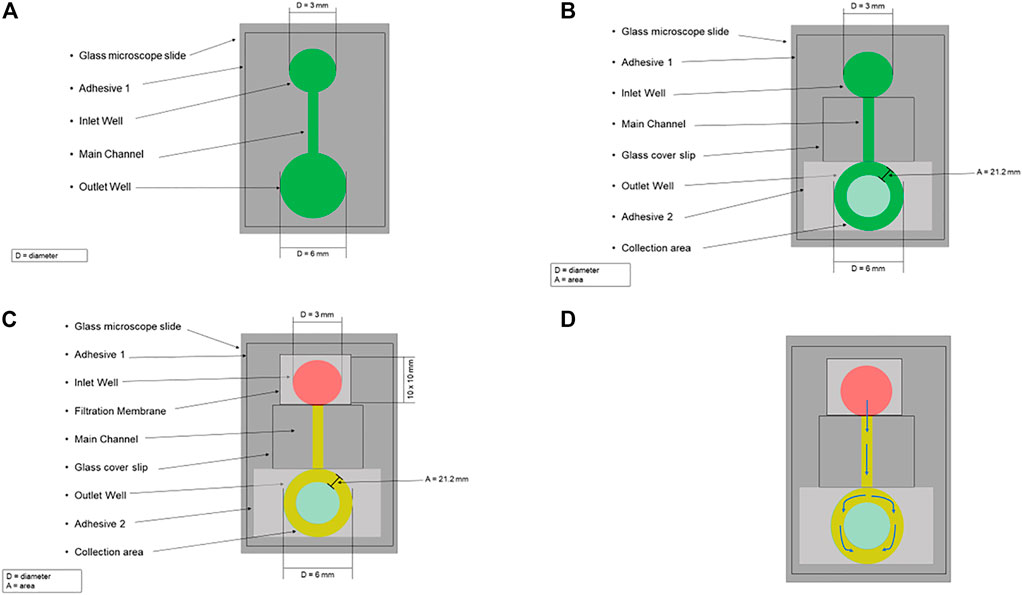
FIGURE 1. Schematic for the microfluidic blood plasma separation system. (A) A 60 mm x 60 mm patch of double-sided adhesive (Adhesive 1) was first cut, and on this adhesive, an Inlet Well, Outlet Well, and 1 mm x 40 mm rectangular channel (Main Channel) connecting both wells were cut into the adhesive using a 3 mm diameter holepunch, 6 mm diameter holepunch, and straight razor, respectively. The bottom side of the cut adhesive was then attached to a glass microscope slide, forming the microfluidic design. (B) A glass coverslip was placed on top of the adhesive to form the main channel such that it was adjacent to, but not covering, the inlet well. To form the collection area of the outlet well a second 20 mm x 20 mm adhesive patch (Adhesive 2) was placed over the outlet well such that its edge was in contact with the coverslip. The position of the outlet well was marked on Adhesive 2, and a 3 mm hole was placed in the marked position via holepunch to form the collection area (area = 21.2 mm). (C) A 10 mm x 10 mm piece of the filtration membrane was placed over the inlet well. Whole blood (red) is pipetted on the top of the filter, trapping the red blood cells. The plasma (yellow) flows through the filter into the main channel. (D) The arrows indicate plasma’s flow path through the microfluidic design.
A schematic for this microfluidic device is shown in Figure 1. Using a pipette, whole blood is placed on the filter and then plasma passes through it. This filter uses an agglutinating chemistry and retention of 4 µm to trap red blood cells which have been bound into masses much larger than the filter retention by this chemistry, while allowing plasma to be filtered out via gravity (Tremont, 2021). After passing through the filter, the plasma is drawn via capillary action from the inlet well, through the main channel, into the ring between the top and bottom outlet well (i.e., the collection area) (Figure 1D). The plasma can then be collected, with the separation time from the input of whole blood to the start of collection being approximately 2 minutes.
3.2 Optimization of outlet well diameter, channel width, and input volume
To determine the optimal design for this device, we focused on three variables: outlet well diameter, channel width, and input volume. First, we varied the diameter of the bottom outlet well by testing 3-mm, 3.5-mm, 4-mm, and 6-mm-diameters to maximize the volume of plasma collected, using 50 µL of whole blood as the input volume (Figure 2A). This experiment deviated from the previously described device manufacturing protocol in that it used a 7.5 mm x 7.5 mm filtration membrane patch. This study was limited to a collection of 1-µL aspirations fifteen times to eliminate the impact of collection time on results, yields were consistently lower than the theoretical maximum this device could achieve. To estimate this maximum, the 6-mm-diameter width study was repeated with no limit on collection time, yielding an average volume of 13.8 µL from a 50 µL whole blood sample containing 27.5 µL of plasma (i.e., the maximum plasma volume yield was 50.3%).
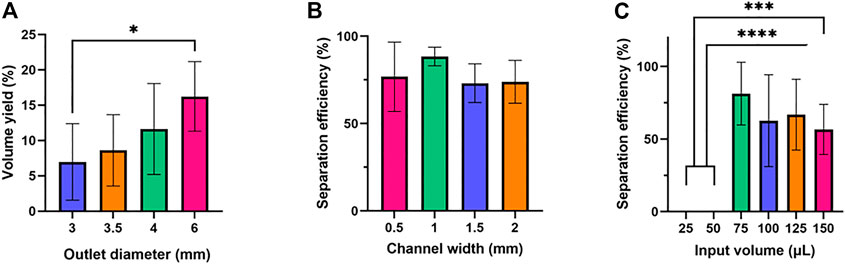
FIGURE 2. Optimization of outlet diameter, channel width, and input volume. Six samples were tested for each condition. One-way ANOVA with Tukey’s multiple comparisons test was performed. (A) Outlet diameter and volume yield. (B) Channel width and separation efficiency. No statistically significant difference was found in the average separation efficiencies of the (C) Input volume and separation efficiency.
Next, the width of the main channel was varied to determine how this impacted the quality of plasma obtained from the device, with channel widths of 0.5 mm, 1 mm, 1.5 mm, and 2 mm being tested (Figure 2B). Finally, the input volume of blood was varied to determine the impact on plasma quality, with 25 μl, 50 μl, 75 μl, 100 μl, 125 μl, and 150 µl inputs being tested (Figure 2C).
It was found that volumetric yield for this device consistently increased as the bottom outlet diameter increased from 3-mm to 6 mm. One possible explanation for this is that increasing bottom outlet diameter led to a greater area in the collection mechanism, increasing the volume of plasma produced by the device. Further, it was found that plasma quality was the highest and least variable at a channel width of 1 mm, with channels narrower and wider than 1 mm producing lower separation efficiency. However, this change in quality was not statistically significant, which suggests that filter performance is not significantly related to the main channel of the device. Finally, it was found that there was a minimum volume of 75 µL needed for a 10 mm x 10 mm filter to be saturated with whole blood and allow for volume to be collected, with no samples being produced for volumes less than that at that filter size. However, as volume increased above 75 µL plasma quality decreased, though not with any statistical significance. This indicates that the filter requires a minimum volume to operate effectively, but that beyond this filter performance is only marginally impacted by input volume variations in the range tested. Based on these results, we determined the optimal device parameters to be the following: the outlet well to have a 6 mm outer diameter, the main channel to be 1 mm wide, and the input volume of whole blood for a 10 mm x 10 mm filter to be 75 µL.
3.3 The impact of hematocrit on separation efficiency
Following the initial experiments optimizing device features, we tested the separation efficiency of this device over a series of input hematocrit values ranging from 25% to 65%. Human blood typically has hematocrit values ranging from 36% to 54% (https://www.ncbi.nlm.nih.gov/books/NBK259/), so a slightly extended range of 25%–65% was selected to determine if samples with abnormally high or low volume percentages of red blood cells might impact device performance (VanDelinder and Groisman, 2006). Although there was some variation in separation efficiency, the results shown in Figure 3A show no statistically significant difference or clear trend in terms of separation efficiency as hematocrit was varied. For 25%, 35%, 45%, 55%, and 65% hematocrit the average separation efficiencies were 73.2%, 88.2%, 69.2%, 75.3%, and 73.3%, respectively.
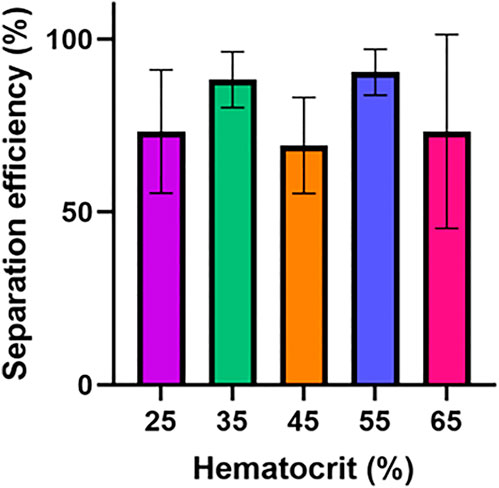
FIGURE 3. Hematocrit impact on device performance. The separation efficiency and flow time for this device was determined over a hematocrit range of 25–65%. Six samples were tested for each condition. One-way ANOVA with Tukey’s multiple comparisons test was performed. No statistically significant difference in separation efficiency was found between any hematocrit values.
3.4 Impact of hematocrit on plasma flow rate and flow time
We sought to study how filtration of plasma from samples of varying hematocrit percentages affect flow rate through the device’s main channel. To investigate this, the impact of varying input hematocrit from 25–65% (Figure 4) on flow rate and flow time in the device was assessed. The flow rate was calculated by measuring the time required to fill the device’s main channel and dividing the volume of the channel by this time. Hematocrit impacts the capillary forces and filter resistance which drive flow in this device due to its impact on the viscosity of fluid passing through the filter and flowing through the main channel. The results of the study are summarized in Figure 4A, which shows that increasing hematocrit led to a significant decrease in flow rate in the device. Flow time in the device increased significantly as hematocrit increased (Figure 4B).
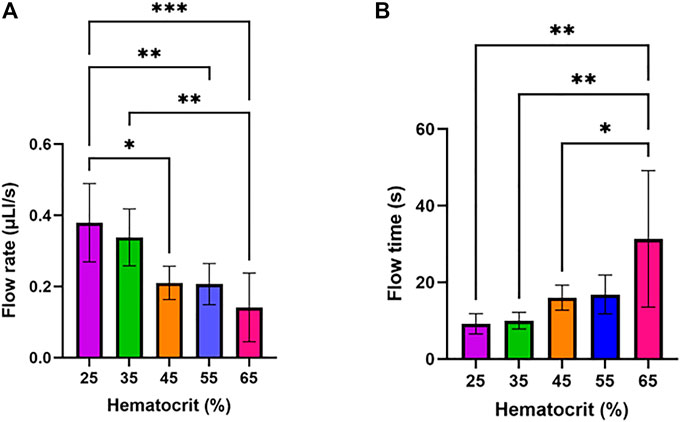
FIGURE 4. Impact of input hematocrit on device flow rate and flow time. One-way ANOVA with Tukey’s multiple comparisons test was performed. Six samples were tested for each condition. (A) Device flow rate assessed at varying hematocrit levels. (B) Flow time assessed at varying hematocrit levels.
It should be noted that the calculation for separation efficiency considered the absorbance of whole blood. As the hematocrit value for whole blood varied in this experiment, this absorbance value also changed. While prior results indicate a consistent separation efficiency over a range of hematocrits, this demonstrates the filter performing consistently and not plasma in the main channel having consistent purity regardless of input hematocrit. The variation of input hematocrit would lead to variation in plasma quality in the channel, with input hematocrit being roughly in proportion to outlet hematocrit.
3.5 Protein concentration in plasma from device
To determine the potential diagnostic value of plasma produced by this device, it was necessary to demonstrate that biomarkers with diagnostic relevance are present in samples from the device at a concentration comparable to other plasma separation strategies. Given the important role of proteins in diagnostics (Anderson and Anderson, 2002), we compared the concentration of protein in plasma obtained from this device to the concentration of protein in plasma produced by centrifugation. No statistically significant difference in protein concentration (Figure 5) was found between these two methods, indicating that this device would be effective at producing plasma samples containing protein-based diagnostic targets.
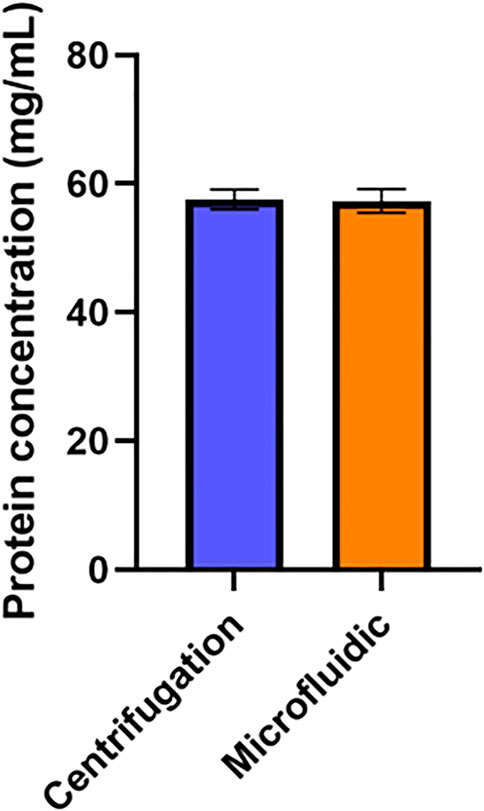
FIGURE 5. Impact of Device on Plasma Protein Concentration. Protein concentration in plasma samples produced via the microfluidic device was compared to the protein concentration of plasma produced via centrifugation. An unpaired t-test was performed. No statistically significant difference was found between the average protein concentration yields (n=6).
4 Discussion
4.1 Collection area development
The collection mechanism of the microfluidic device was developed to create a zone at the end of the capillary channel which is both appropriately sized to generate strong capillary forces driving flow into it, while also being flexible enough to enable liquid to be extracted from it. This is necessary because capillary pressure differences decrease as channel depth increases, thus, there is no pressure difference driving plasma to exit the device when the shallow microchannel is exposed to atmosphere. As such, in the first iteration of our device, plasma did not naturally exit the primary microchannel. To resolve this issue, we designed a device with a ring-shaped collection well which a pipette tip could be inserted into, enabling it to collect plasma. The collection mechanism was designed to partially cover the channel with a soft adhesive rather than a glass coverslip, which creates a zone where capillary pressure differences are maintained during device operation. Because this zone is covered by a more flexible adhesive rather than a glass coverslip, it is possible to collect plasma within it either by fitting a pipette tip under the adhesive, or by peeling back this adhesive to expose the plasma. This device functions optimally when the smaller top outlet well is centered around the larger bottom outlet well, as this placement ensures plasma is evenly distributed around the collection mechanism. As seen by our results, increasing the bottom outlet well diameter increases the area of the collection area, giving it a greater volume capacity, leading to greater volume yields. Additionally, increasing the bottom outlet well diameter mitigates manual error of the placement of the second adhesive, because there is more room to place the top outlet well within a larger bottom outlet well such that the wells are centered. It should be noted that the collection well does serve as a limit on volume collection, so the yields determined here for a 50 µL input volume would likely be somewhat lower when the same sized device is used with larger input volumes.
Our maximum volume yield of 50.3% from a 50 µL whole blood sample is comparable to that achieved by Hauser et al. with a similar device design of 65% volume yield also from a 50 µL sample (Hauser et al., 2018). The device developed by Hauser et al. carried out separation using a depth filter connected to two capillary channels. It should be noted that the calculation for volume yield used by Hauser et al measured the plasma volume collected within the capillary channel, while volume yield in this paper considers plasma volume which could be removed from the device via the collection mechanism. While this distinction is not highly relevant for many point of care applications, as plasma generally can be used directly in the reservoir for a diagnostic system, it does lead to volume yields being lower in the system outlined in this paper than they would be if they were measured via the methods used by Hauser et al. Beyond device design, one potential reason the volume yields differed between the two devices could have been due to the hematocrit of samples used, which was 55% in our sample compared to 41% in Hauser et al. Additionally, Hauser et al. did not describe the separation efficiency of their samples, which not only impacts the volume yield but the sample’s integrity for downstream processing. A study considering separation efficiency for a plasma separation microfluidic was conducted by Tripathi et al. (2016) on a system which carried out plasma separation leveraging the Zweifach-Fung effect, with curved channels being used to generate different flow rates via centrifugal force. This study measured separation efficiency by finding red blood cell densities in both plasma produced by the device and whole blood using a hemocytometer. This study found that separation efficiency varied from nearly 100% to just under 85% depending on inlet hematocrit and flow rate. Therefore, we explored the role of hematocrit, channel width, and input volume on the separation efficiency of plasma using our device.
4.2 Channel width does not affect separation efficiency
It was necessary to assess the quality of plasma isolated using this device, as interference from red blood cells and other molecules can negatively affect analyses which may be relevant downstream of the system such as PCR for determining viral load (Kersaudy-Kerhoas et al., 2010). Plasma quality was not significantly impacted by channel width in experiments. One explanation for this behavior lies in the Young–Laplace equation, which describes the relationship between capillary pressure, the geometry of a microchannel, and the fluid contained within the channel. For a channel with a rectangular cross section, the equation is as follows:
Where P is capillary pressure, h is channel height, w is channel width, γ is the surface tension of the liquid in the channel, and θt, θb, θl, θr are the top, bottom, left, and right contact angles of liquid associated with each channel well. Given a channel width of 1 mm, a channel depth of 81 μm, and a plasma surface tension of .054 N/m (Yadav et al., 2020), this equation can be tested at different possible contact angles. Assuming full wetting of the surface, meaning the contact angle is 0°, a pressure difference of 1,440 Pa would exist across the channel, whereas if the surface is only partially wetted, and contact angle were 30°, the pressure difference would be roughly 1,250 Pa.
Examining this equation, capillary pressure decreases as both the height and width of the channel increases. Since this device contains a channel with a much greater width than height (500–2,000 μm vs. 81 μm), the terms in the Young–Laplace equation which depend on channel width approach zero compared to the terms which depend on channel height. As such, pressure across this channel is not dramatically impacted by varying channel width. Given that this device is composed of a dead-end filter connected to a microchannel with both components exposed to the atmosphere, the difference in capillary pressure in the microchannel should equal the difference in pressure across the membrane. As such, changing channel width does not significantly impact the pressure drop across the filter. Pressure drop across the filter is a factor very likely to be driving imperfect separation in this device, as it can damage the filter, cause hemolysis, and potentially cause red blood cells to deform sufficiently to pass through the filter, so changing channel width should not be expected to impact separation efficiency.
4.3 Input volume has minimum threshold for device functionality
Separation efficiency was consistently zero for input volumes below 75 μl, and nonzero for any input volumes at or above 75 μl. No statistically significant differences were found between the input volumes greater than 75 μl. The separation efficiency values of zero resulted from no volume exiting the membrane filter. It should be noted that the minimum input volume for separation to occur in earlier experiments optimizing the collection mechanism volumetric yield was only 50 μl. This is likely because a 7.5 mm x 7.5 mm patch of filter was used in these experiments rather than the 10 mm x 10 mm filter patch used in all other experiments. This led to the filter area in these experiments being 56.25% of its size in all other experiments, which enabled the filter to function with smaller volume inputs. As such, 50 μl was above the minimum threshold for plasma separation in volume collection experiments.
One possible explanation for the lack of plasma exiting the membrane at low input volumes is that the filter can retain a certain amount of fluid, termed a hold-up volume (Laska et al., 2005). For very low input volumes, the volume of whole blood placed on the filter may be less than the hold-up volume, meaning the entire sample is retained in the filter and never enters the capillary channel. This retention would be a result of capillary forces, as the average pore diameter in this device is 3–5 μm, producing strong capillary forces which must be overcome for plasma to enter the 81 μm x 1,000 μm main channel in the device. With sufficiently high volumes, the pressure from whole blood that has not yet entered the membrane filter can overcome this capillary force and allow for flow through the device to occur. It also should be noted that the minimum input volume for separation to occur in earlier experiments optimizing the collection mechanism volumetric yield was only 50 μl. This is likely because a 7.5 mm x 7.5 mm patch of filter was used in these experiments rather than the 10 mm x 10 mm filter patch used in all other experiments. This led to the filter area in these experiments being 56.25% of its size in all other experiments, which would decrease the hold-up volume of the filter accordingly. As such, 50 μl was above the minimum threshold for plasma separation in those experiments. It should also be noted that the hold-up volume would impact the volume yield of the system, with a lower hold-up volume allowing for higher possible volume yields as less plasma is retained by the filter. Given this, it may be desirable to minimize the hold-up volume, which may be accomplished by lowering filter area or changing filter type to allow for larger pore sizes which retain plasma less strongly.
4.4 Hematocrit against separation efficiency
Hematocrit is the volume of red blood cells compared to the total blood volume and is often expressed in a percentage. The average range for humans is 36–54% (Billett, 1990) in the absence of conditions that affect hematocrit. The hematocrit is a primary determinant of blood viscosity which is essential to human body functions. Hematocrit is not only important for blood flow throughout the human body but also indicates the presence of various pathologies, if higher or lower than average, such as cardiovascular, metabolic, or inflammatory disorders (https://www.ncbi.nlm.nih.gov/pmc/articles/PMC2499821/). Therefore, it is essential to examine the impact of hematocrit on the functionality of the microfluidic device to verify if its utility would be maintained with blood from a variety of pathologies.
Hematocrit did not have a statistically significant impact on separation efficiency. One explanation for this lies in the equation for capillary pressure across a cylindrical capillary. Because the filter in this device can be modeled as many cylindrical capillaries placed in parallel, this equation can be used to estimate pressure across the filter. The equation is as follows (Cai et al., 2021):
Where
Where
Varying hematocrit does lead to variations in liquid surface tension and contact angle, but given that plasma quality was relatively consistent across trials, and the fact that Eq. 2 is not very sensitive to variation in these quantities, this was not a substantial enough change to damage the filter through increased pressure. As such, our device is capable of constant separation efficiencies over the hematocrits tested. Compared to other devices that have examined hematocrit and separation efficiency, our device yielded comparable results. Many other devices tested at hematocrit of ∼45% and found separation efficiencies ranging from 60% to 99% (VanDelinder and Groisman, 2006). Here, we were able to test a range of 25%–65% hematocrit and showed that the separation efficiency was greater than 65% for all hematocrits tested.
4.5 Increasing hematocrit decreases flow rate
While this device was designed for the separation of plasma from whole blood, we also explored the effect of hematocrit on flow rate and flow time to investigate their potential applicability to a hematocrit-based screening device. That is, one could not only separate plasma using our device, but also measure the flow rate and/or flow time of the plasma in the capillary channel of the device to determine if a person’s hematocrit is out of the average range. This approach can be compared to a microfluidic device that has been developed which uses image processing to determine the hematocrit of whole blood samples, with the device being integrated into a smartphone app for easy operation (Jalal et al., 2017). While colorimetric data may be one effective way of determining if a whole blood sample is within typical hematocrit ranges, a potential alternative method may be to measure the flow rate of a sample in a given capillary tube. This approach may have some potential at identifying samples with hematocrit well out of the ordinary range, as we observed that increasing input hematocrit resulted in a statistically significant decrease in device flow rate.
The trend of lower hematocrit inputs leading to greater flow rates can be approximately modeled using a simplified solution to the Navier-Stokes equations for a flat and very wide rectangular microchannel, which is as follows (Olanrewaju et al., 2018):
Where ΔP is the pressure difference in the channel as could be found in Eq. 2, L(t) is the length of the channel containing liquid, h is channel depth, w is channel width, and
Our data indicates that it may be possible to identify abnormal hematocrits using this device design. Several improvements could be made to this device to further enable this potential application. First, while removing the filter from this system would prevent it from being used for its primary purpose of plasma separation, it may allow for more precise identification of hematocrit by removing the impact of the transport through the filter on flow rates in the device. Further, by integrating in a timing mechanism or flow rate sensor into the device, this process of approximating hematocrit could be automated.
4.6 Protein passage in device
There was no statistically significant difference between protein levels in plasma obtained by this device and plasma obtained via centrifugation. This result is expected, as the average diameter of pores in this filter is 3–5 μm while the size of proteins would typically be measured on the nanoscale (Tremont, 2021). As such, while pores in this filter are small enough to block red blood cells, they are orders of magnitude too large to impede the movement of proteins. This experiment supports the notion that this system could be integrated into blood-based point-of-care diagnostic systems, as it indicates that protein biomarkers with diagnostic potential can pass through this device into plasma samples without issue. This pore size should also allow for other biomarkers of interest to be detected in plasma produced by this device, including DNA, RNA, or metabolites.
5 Conclusion
In this work a microfluidic device capable of separating plasma from whole blood utilizing a passive borosilicate glass microfiber filter and capillary collection mechanism was demonstrated, optimized, and tested. The device was shown to be capable of collecting multiple microliter samples of plasma with separation efficiencies of up to 88.5 ± 5.4%, and device features including the collection mechanism, channel width and input volume were optimized for both output volume yield and plasma quality. The device was found to function over input hematocrit values ranging from 25% to 65%. The impact of input hematocrit on flow in the device was assessed, with lower hematocrit samples producing higher flow rates at. The possibility of using capillary flow rate as a proxy for hematocrit in diagnostics was also discussed. Finally, the device was tested to ensure that it produces plasma containing protein biomarkers.
This platform is low cost, can be assembled manually in under 15 min, separates plasma in under 2 min, and can be used either to collect plasma samples with the collection mechanism, or can be easily integrated into existing microfluidic systems that require plasma as an input. However, some potential limitations of this device include that it produces plasma samples with variable red blood cell contamination, and that it requires a minimum sample size on the order of tens of microliters, with both factors limiting the potential diagnostic applications of the system. Future work should examine the elution of molecules such as DNA and RNA to further expand its impact for the point of care. Further testing could also be done to determine if reducing filter size and main channel size could enable this system to function with even smaller input volumes. The simplicity and low operating requirements of this device render it a strong candidate for integrating into point-of-care diagnostic platforms.
Data availability statement
The datasets presented in this study can be found in online repositories. The names of the repository/repositories and accession number(s) can be found below: https://doi.org/10.7910/DVN/GHE3BD.
Author contributions
LS made the initial design of the device, which WB modified. WB and KL conceptualized the experiments. All experiments were performed by WB. The initial draft of the manuscript was written by WB and KL. Subsequent versions of the manuscript were reviewed by KL, WB, NL, LS, and AT.
Funding
This work was in part supported by PerkinElmer’s research grant to Brown University as well as NL’s research funds at Brown University.
Acknowledgments
WB would like to acknowledge the Brown Design Workshop and Julia Henke for support in device fabrication. KL would like to acknowledge the National Science Foundation Graduate Research Fellowship and the GEM Fellowship for graduate student support. We would like that to acknowledge Spectra Systems Corporation for their consult for this project.
Conflict of interest
NL was empolyed by Spectra Systems Corporation.
The remaining authors declare that the research was conducted in the absence of any commercial or financial relationships that could be construed as a potential conflict of interest.
Publisher’s note
All claims expressed in this article are solely those of the authors and do not necessarily represent those of their affiliated organizations, or those of the publisher, the editors and the reviewers. Any product that may be evaluated in this article, or claim that may be made by its manufacturer, is not guaranteed or endorsed by the publisher.
Supplementary material
The Supplementary Material for this article can be found online at: https://www.frontiersin.org/articles/10.3389/frlct.2022.1051552/full#supplementary-material
References
Amasia, M., and Madou, M. (2010). Large-volume centrifugal microfluidic device for blood plasma separation. Bioanalysis 2 (10), 1701–1710. doi:10.4155/BIO.10.140
Anderson, N. L., and Anderson, N. G. (2002). The human plasma proteome. Mol. Cell. Proteomics 1 (11), 845–867. doi:10.1074/mcp.R200007-MCP200
Billett, H. H. (1990). “Hemoglobin and hematocrit”, in Clinical methods: The history, physical, and laboratory examinations. 3rd Edn. Editors Walker, H. K., Hall, W. D., and Hurst, J. W. (Boston: Butterworths), Chap. 151
Cai, J., Jin, T., Kou, J., Zou, S., Xiao, J., and Meng, Q. (2021). Lucas − washburn equation-based modeling of capillary-driven flow in porous systems. doi:10.1021/acs.langmuir.0c03134
DiFonzo, N., and Bordia, P. (1998). HIV testing technologies after two decades of evolution. J. Allergy Clin. Immunol. 130 (2), 556. [Online]. Available:. doi:10.1016/j.jaci.2012.05.050
Dixon, C., Lamanna, J., and Wheeler, A. R. (2020). Direct loading of blood for plasma separation and diagnostic assays on a digital microfluidic device. Lab. Chip 20 (10), 1845–1855. doi:10.1039/d0lc00302f
Hauser, J., Lenk, G., Hansson, J., Beck, O., Stemme, G., and Roxhed, N. (2018). High-yield passive plasma filtration from human finger Prick blood. Anal. Chem. 90 (22), 13393–13399. doi:10.1021/acs.analchem.8b03175
Jalal, U. M., Kim, S. C., and Shim, J. S. (2017). Histogram analysis for smartphone-based rapid hematocrit determination. Biomed. Opt. Express 8 (7), 3317. doi:10.1364/boe.8.003317
Jiang, H., Weng, X., Chon, C. H., Wu, X., and Li, D. (2011). A microfluidic chip for blood plasma separation using electro-osmotic flow control. J. Micromechanics Microengineering 21 (8), 085019. doi:10.1088/0960-1317/21/8/085019
Kasetsirikul, S., Shiddiky, M. J. A., and Nguyen, N. T. (2020). Challenges and perspectives in the development of paper-based lateral flow assays. Microfluid. Nanofluidics 24 (2), 17–18. doi:10.1007/s10404-020-2321-z
Kersaudy-Kerhoas, M., Dhariwal, R., Desmulliez, M. P. Y., and Jouvet, L. (2010). Hydrodynamic blood plasma separation in microfluidic channels. Microfluid. Nanofluidics 8 (1), 105–114. doi:10.1007/s10404-009-0450-5
Kettler, H., White, K., and Hawkes, S. (2004). Mapping the landscape of diagnostics for sexually transmitted infections: Key findings and recommandations. Geneva, Switzerland: Unicef/Undp/World Bank/Who, 1–44. [Online]. Available at: http://www.who.int/tdr/publications/tdr-research-publications/mapping-landscape-sti/en/index.html.
Laska, M. E., Brooks, R. P., Gayton, M., and Pujar, N. S. (2005). Robust scale-up of dead end filtration: Impact of filter fouling mechanisms and flow distribution. Biotechnol. Bioeng. 92 (3), 308–320. doi:10.1002/BIT.20587
Madadi, H., Casals-Terré, J., and Mohammadi, M. (2015). Self-driven filter-based blood plasma separator microfluidic chip for point-of-care testing. Biofabrication 7 (2), 025007. doi:10.1088/1758-5090/7/2/025007
Maria, M. S., Rakesh, P. E., Chandra, T. S., and Sen, A. K. (2017). Capillary flow-driven microfluidic device with wettability gradient and sedimentation effects for blood plasma separation. Sci. Rep. 7, 43457–43512. doi:10.1038/srep43457
Mielczarek, W. S., Obaje, E. A., Bachmann, T. T., and Kersaudy-Kerhoas, M. (2016). Microfluidic blood plasma separation for medical diagnostics: Is it worth it? Lab. Chip 16 (18), 3441–3448. doi:10.1039/c6lc00833j
Mohammadi, M., Madadi, H., Casals-Terré, J., and Sellarès, J. (2015). Hydrodynamic and direct-current insulator-based dielectrophoresis (H-DC-iDEP) microfluidic blood plasma separation. Anal. Bioanal. Chem. 407 (16), 4733–4744. doi:10.1007/s00216-015-8678-2
Mondello, S., Muller, U., Jeromin, A., Streeter, J., Hayes, R. L., and Wang, K. K. (2011). Blood-based diagnostics of traumatic brain injuries. Expert Rev. Mol. Diagnostics 11 (1), 65–78. doi:10.1586/erm.10.104
Nader, E., Skinner, S., Romana, M., Fort, R., Lemonne, N., Guillot, N., et al. (2019). Blood rheology: Key parameters, impact on blood flow, role in sickle cell disease and effects of exercise. Front. Physiol. 10, 1329–1414. doi:10.3389/fphys.2019.01329
Olanrewaju, A., Beaugrand, M., Yafia, M., and Juncker, D. (2018). Capillary microfluidics in microchannels: From microfluidic networks to capillaric circuits. Lab. Chip 18 (16), 2323–2347. doi:10.1039/C8LC00458G
Son, J. H., Lee, S. H., Hong, S., Park, S. M., Lee, J., Dickey, A. M., et al. (2014). Hemolysis-free blood plasma separation. Lab. Chip 14 (13), 2287–2292. doi:10.1039/C4LC00149D
Songjaroen, T., Dungchai, W., Chailapakul, O., Henry, C. S., and Laiwattanapaisal, W. (2012). Blood separation on microfluidic paper-based analytical devices. Lab. Chip 12 (18), 3392–3398. doi:10.1039/c2lc21299d
Tremont, I. W. (2021). Grade LF-D-23 (r), Grade-CF-D-23(r) coated whole blood separation media. Available at: https://iwtremont.com/cmsAdmin/uploads/diagnostics-grade-d-23-coated-ver0715.pdf.
Tripathi, S., Kumar, Y. V. B., Agrawal, A., Prabhakar, A., and Joshi, S. S. (2016). Microdevice for plasma separation from whole human blood using bio-physical and geometrical effects. Sci. Rep. 6, 26749–26815. doi:10.1038/srep26749
VanDelinder, V., and Groisman, A. (2006). Separation of plasma from whole human blood in a continuous cross-flow in a molded microfluidic device. Anal. Chem. 78 (11), 3765–3771. doi:10.1021/ac060042r
Wang, Y., Nunna, B. B., Talukder, N., Etienne, E. E., and Lee, E. S. (2021). Blood plasma self-separation technologies during the self-driven flow in microfluidic platforms. Bioengineering 8, 94. doi:10.3390/bioengineering8070094
Whitesides, G. M. (2006). The origins and the future of microfluidics. Nature 442 (7101), 368–373. doi:10.1038/nature05058
Yadav, S. S., Sikarwar, B. S., Ranjan, P., Janardhanan, R., and Goyal, A. (2020). Surface tension measurement of normal human blood samples by pendant drop method. J. Med. Eng. Technol. 44 (5), 227–236. doi:10.1080/03091902.2020.1770348
Yang, S., Ündar, A., and Zahn, J. D. (2006). A microfluidic device for continuous, real time blood plasma separation. Lab. Chip 6 (7), 871–880. doi:10.1039/b516401j
Keywords: point of care, microfluidic, capillary flow, blood plasma separation, diagnostic
Citation: Brakewood W, Lee K, Schneider L, Lawandy N and Tripathi A (2022) A capillary flow-driven microfluidic device for point-of-care blood plasma separation. Front. Lab. Chip. Technol. 1:1051552. doi: 10.3389/frlct.2022.1051552
Received: 22 September 2022; Accepted: 14 November 2022;
Published: 29 November 2022.
Edited by:
Zulfiqur Ali, Teesside University, United KingdomReviewed by:
Jasmina Casals-Terré, Universitat Politecnica de Catalunya, SpainTugba Ozer, Yıldız Technical University, Turkey
Copyright © 2022 Brakewood, Lee, Schneider, Lawandy and Tripathi. This is an open-access article distributed under the terms of the Creative Commons Attribution License (CC BY). The use, distribution or reproduction in other forums is permitted, provided the original author(s) and the copyright owner(s) are credited and that the original publication in this journal is cited, in accordance with accepted academic practice. No use, distribution or reproduction is permitted which does not comply with these terms.
*Correspondence: Anubhav Tripathi, YW51Ymhhdl90cmlwYXRoaUBicm93bi5lZHU=
†These authors have contributed equally to this work