 Zaida Chinchilla-Rodríguez
 Kevin Ocaña-Rosa
 Benjamín Vargas-Quesada
- 1Instituto de Políticas y Bienes Públicos (IPP), Consejo Superior de Investigaciones Científicas (CSIC), Madrid, Spain
- 2SCImago Research Group, Madrid, Spain
- 3Departmento de Información y Comunicación, Universidad de Granada, Granada, Spain
This paper presents a comparative benchmarking of scientometric indicators to characterize the patterns of publication and research performance at the country level, in a specific field (nanoscience and nanotechnology) during the period 2003–2013. The aim was to assess how decisive collaboration may be in attaining a sound level of scientific performance, and how important leadership is for publication. To this end, we used a new methodological approach that contributes to the debate about scientific autonomy or dependency of countries in their scientific performance, and which may serve as an aid in decision-making with regard to research management. The results reveal that in terms of output, USA and China are the main producers; and due to the huge increase in their publications, Iran, India, and Australia can be considered emerging countries. The results highlight USA, Ireland, and Singapore as the countries with the highest levels of normalized citation impact, scientific excellence, and good management of leadership, all of which suggest strong scientific development and scientific autonomy. Also worth mentioning is the high visibility and scientific consolidation of China and Australia, despite the meager growth of their output. Moreover, the performance results indicate that in most cases the countries whose pattern of publication is more international tend to have greater visibility. Yet, a high degree of leadership does not always translate as a high performance level; the contrary is often true. Due to the limitations of the sample and characteristics of the field, we propose that future studies evaluate the generation of new knowledge in this field and refine the approach presented here, so as to better measure scientific performance.
Introduction
Scholarly metrics provide well-defined methods to approach scientific communication, assuming that actors, events, and contexts involved in this activity are all entities that can be quantified (Borgman and Furner, 2002). Scholarly communication is crucial for scientists and other stakeholders not only to keep updated but also to be aware of how research funding-related decisions are related with the array of objective measures of scholarly performance. The relevance of research is a key concern when scientific research policies are defined, anywhere in the world. Thus, policy-makers, decision-makers, and the general public can benefit from scholarly metrics (Chinchilla-Rodríguez et al., 2015).
Over the last three decades, nanoscience and nanotechnology (NST) has become a scientific field of great relevance. Its economic and social ramifications have meant advances in sectors such as industry, health, the environment, and national security (Huang et al., 2011). Since Feynman’s rousing speech in 1960, this scientific field has attracted the attention of policy-makers worldwide, and several countries have included NST research programs in their agendas (Feynman, 1960; Shapira and Wang, 2010).
International investment in this field has grown exponentially since 1990 (Hullmann, 2006, 2007). Jia (2005) summarizes historic trends, and the status of global governmental support for nanotechnologies worldwide, emphasizing that despite the fact that governments have historically funded R&D when technology holds potential to greatly impact the national economy, such advancement cannot be achieved by a single institution or corporation, or even by a single country. Collaboration between government-funded researchers and private industries is critical for technology transfer and the commercialization of nanotechnology. Such networking and partnering is now facilitated and encouraged by government-funded programs in order to leverage public investment. Indeed, a massive expansion of funding began in the early 2000s, with the USA at the forefront of investment after the formation of the federally coordinated National Nanotechnology Initiative (NNI). Thereafter, major nanotechnology R&D programs were initiated throughout the world, including China, the European Union, and its member states, Japan and Korea (Shapira and Wang, 2010). In 2011, the USA showed the largest number of nanotechnology-active firms, followed by Germany and France. The USA also has the strongest focus on nanotechnology R&D, in this case followed by Mexico and the Russian Federation (3.5%). The share of nanotechnology with respect to total expenditures on R&D (by the government and the higher education sector) is highest in the Russian Federation, followed by Korea and Portugal. These data are partly reflected in government and higher education expenditures on nanotechnology R&D, where the Russian Federation takes first place, Japan and Korea being second and third (OECD, 2013). Recently, more than 1.5 billion was allocated from the USA 2016 Federal Budget to the NNI (Initiative National Nanotechnology, 2016). In Europe, the Research and Innovation Program “Horizon 2020” introduces incentives to promote participation and therefore improve the commercialization of these new technologies (European Commission, 2016), presenting a set of calls for projects in Nanotechnology, Advanced Materials, Biotechnology, and Advanced Manufacturing and Processing – with a budget above 516 million Euros.
This implies both challenges and opportunities for other countries at medium levels of development, which need to harness their capabilities to benefit from commercial opportunities through targeted investments and strategic collaborations (Kay and Shapira, 2009). The emerging countries come to challenge the traditional hegemony of the developed countries, actively gaining a geopolitical advantage in some specific fields (Salter, 2009). Meanwhile, scientific community is becoming increasingly interconnected, with cross-territorial regional ties emerging as physical distance gradually ceases to be an impediment (Hoekman et al., 2010). Although the traditional superpowers – USA, Western Europe, and Japan – still lead the field, there are some new players and leaders on the global scientific stage (The Royal Society, 2011).
Thus, the rapid growth of R&D investment in NST has led to many discoveries and the consequent growth of publications and patents entailing advancements in knowledge or industrial applications. Facing pressures to increase funding levels, the countries involved also need to assess the outcomes of research efforts. Scientific benchmarking is held to be a useful aid in decision-making about research performance and has therefore become the focus of numerous attempts to study NST through bibliometrics.
Related Works
From the scientometric standpoint, a number of studies and approaches have explored this field, marked by a multidisciplinary character (Schummer, 2004; Kostoff et al., 2006; Bassecoulard et al., 2007; Leydesdorff and Zhou, 2007; Muñoz-Ecija et al., 2011). Research hotspots are the analysis of subfields such as nanoparticle generation (Barcikowski et al., 2009), nanoenergy (Menéndez-Manjón et al., 2011), carbon nanotubes and grapheme (Etxebarria et al., 2012), and ZnO nanostructures (Ávila-Robinson and Miyazaki, 2013).
Another research line focuses on the evolution of output and the citation impact in this field. Braun et al. (1997) were pioneers in analyzing the rapid rise of NST publications since 1990 as a field. One year later, using a different methodology for data retrieval, Meyer and Persson (1998) confirmed this growth by looking at the distribution of output by main countries which, not surprisingly, were USA, Japan, and Germany, and the relatively strong position of China was pointed out. Looking at the coauthorship patterns, they found that some countries tend to have bilateral relations while others collaborate with a much larger array of nations, raising the question of whether it is science quality or science policy that is creating the links. By analyzing the number of patents they identify USA as the leading country in this matter, far ahead of second-place Japan. The comparison of publication and patenting activities revealed differences in the application of science among countries. Smaller countries, industrialized or newly industrializing, did exceptionally well; accordingly, a comparison of countries’ scientific bases and endowments with high-technology enterprises would prove relevant.
In 2000, European Commission selected NST as one of the key areas to be analyzed in order to explore networks of excellence. In 2003, researchers from the Center for Science and Technology Studies (CWTS) and the Fraunhofer Institute for Systems and Innovation Research published a first report describing methodological and practical problems, and it addresses the feasibility of mapping the centers of research excellence in NST using bibliometrics (Noyons et al., 2003).
In the same year, Glänzel et al. (2003) selected the 45 most active countries in the period 1992–2001 for the analysis of national publication activity and citation impact two interesting remarks were brought out, one being that the citation impact somewhat decreases over the period of study. Nevertheless, the NST literature still represents, on average, the high-end of journal publications as measured through citation impact. The second was that not only highly developed countries and institutions dominate the area. NST appears as an emerging area where links of international collaboration are increasing. The authors pointed out that when one considers international collaboration, the economic and/or political dependence of a country or geopolitical region largely depends on special equipment and conditions for cooperation, apart from the individual motivations of scientists themselves. On the other hand, copublications might simply be seen as mandatory exercises within the framework of bilateral agreements between institutions, science administrations, or governments. But in any case, collaboration enhances the citation of papers.
More recently, there has been a huge expansion of bibliometric studies examining NST. We briefly review the following selection in order to position our conceptual and methodological approach and compare results.
At a regional level, Kay and Shapira (2009) assess the evolution of NST in a region such as Latin America that shares various cultural, industrial, and economic characteristics, although the four countries studied are all middle-income economies (World Bank definition) with active research systems that receive low-to-moderate levels of R&D investment. Their thorough analysis involved study of the output, policy programs, collaboration strategies, and institutions. The results show that Brazil is clearly the leader in nanotechnology research, followed by Argentina and Chile. Moreover, this paper highlights the different strategies of collaboration of these countries, showing that Brazil has a more national orientation, and Uruguay’s strategy is based on regional collaborations, while Argentina and Chile display both national and international patterns of collaboration.
The activity of ASEAN countries and ASEAN-EU copublication patterns in seven FP7 thematic areas was studied by Hassan et al. (2012). Comparing relative strengths of the countries within ASEAN in Nanotechnology, Singapore shows high publication and citation counts which are far ahead of the second largest publishing country, Thailand, in the same time span, followed by Malaysia and Vietnam. The authors affirm that NST may be one thematic realm of collaboration for EU and ASEAN. However, if EU looks for a broader base area, then Nanotechnology is not a suitable thematic area, as Singapore alone concentrates the research strength of ASEAN in this area. Singapore’s importance in scientific cooperation is quite evident in the copublication figures.
Chen et al. (2013) analyze the bilateral collaboration between a rising scientific polar force, such as China, with a traditional superpower, such as Europe. They summarize a series of driving forces explaining the rise of science collaboration over decades in the field of NST. An improved geopolitical relationship and increasing trade linkage between the two regions is said to have paved the way for scientific collaborations. With continuing improvement of China’s scientific capability and growth, both in terms of R&D input and research staff, a scientific cooperation mechanism has developed at the EU level and the member state level.
To further understand how government research funding and scientific networks influence research publications in NST, a cross-country comparison between Canada and the USA was carried out (Tahmooresnejad et al., 2015). To explore the impact of funding on scientific papers and to reflect how NST research grants influence researchers’ productivity, the authors used econometric methods. To analyze the effects that collaboration networks have on research productivity, measuring the position of research within scientific copublication networks they used using bibliometric methods. In this way, the quantity and quality of research output was appraised, and the results among nanotechnology scientists could be analyzed. Research funding was found to yield a significantly positive linear impact in Canada and a positive non-linear impact in the USA in terms of the number of papers; and in terms of the number of citations, there was a positive impact only in the USA. The main findings also show that both research grants and the position of researchers in copublication networks play an important role in the quantity and quality of papers published by nanotechnology scientists.
At the country level, NST studies have been appraised in South Africa (Pouris, 2007), Brazil (Kay and Shapira, 2011), China (Guan and Ma, 2007; Tang and Shapira, 2011a), Venezuela (López Cadenas et al., 2011), Russia (Terekhov, 2012), Pakistan (Bajwa and Yaldram, 2012), and Australia (Gorjiara and Baldock, 2014). All these works aimed to assess the impact of NST research and the evolution of national policies by analyzing volume, citation analysis, and patterns of collaboration. Methodologically, they illustrate the difficulty in delineating an emerging scientific and technological field, such as nanoscience and technology, and in addressing it through bibliometric research. In view of the conceptual and methodological framework of our study, we underline the following considerations.
Collaboration is an added value for increasing citation and productivity (Glänzel, 2001; Gazni and Didegah, 2011; Gazni et al., 2012) or to enhance the scientific and technological capacity of countries, according to Wagner et al. (2001). Yet, the effects of collaboration do not always translate into benefits at the same magnitude (Chinchilla-Rodríguez et al., 2010; Persson, 2010). There are different potential strategies for research collaboration affected by certain factors that characterize dynamic scientific research in networks of knowledge creation (Wagner and Leydesdorff, 2005).
A second key notion is that of academic dependence in collaboration, understood as an unequal structure of output and transfer of knowledge on the part of industrialized countries as opposed to peripheral ones (Beigel and Hanan, 2014). While international collaboration is replacing other models as the preferred method of building scientific capacity in developing countries, this capacity is not well distributed among developing countries, which hampers the sustainable growth of their development (Ely and Scoones, 2009). This relationship, referred to as “North-South” or “donor-host,” comes to question the relevance of international collaboration when approaching the needs for developing countries. In some cases, the topics of joint research reflect the interests of the advanced country, so that developing countries choose research problems that hold more appeal for their international partners than real value for their own country (Wagner et al., 2001). But, a country may also reduce its import of foreign knowledge and increase the local production of concepts or methods, even raising their influence in domestic science and policy circles, thus amplifying the probability of leading research projects those fields of some specialization.
The third notion deserving special mention is leadership related to the collaborative partnership and the position of scientists/institutions/countries in scientific networks as determinant for the quantity and quality of papers (Ni et al., 2011; Tahmooresnejad et al., 2015). We use the term “leadership” as defined by the Committee of Medical Journal Editors (International Committee of Medical Journal Editors, 2012). Accordingly, the corresponding author is responsible for the submission and control of a manuscript until its publication, and for the implication of all authors involved in multi-authored work. Since most papers come from teams of scientists participating in domestic or international projects, we hold that the “corresponding author” may be considered as a leader of the paper, along with the institution of affiliation. In international collaboration, the presence of a few leaders can affect the success of the relationship because they can play key roles in recruiting the necessary resources and expertise to launch and sustain projects. For this reason, metrics should be collected regularly by all parties to ensure objective evaluation and to seek partners in a bidirectional path to fortify the scientific and technological capacity of the countries involved.
With all these pertinent studies in mind, this paper explores the capacity in the generation of scientific knowledge in NST and its visibility at the global level. The main contribution lies in the novelty of the methodological bibliometric approach, namely, a decomposition of the leadership indicator, and its combination with the results of performance indicators in two different categories: non-collaborative papers (representing the percentage of published papers made without collaboration for a single institution) and internationally coauthored papers (representing the percentage of leading papers made in collaboration with different countries). We compare the normalized citation of all output against the leading output, as well as its scientific excellence. Our goal was to determine to what extent the main producers of scientific output depend on collaboration to heighten research performance in terms of citation. To the best of our knowledge, this is the first study adopting this approach at the country level within the field of NST.
Objectives and Research Questions
The aim was to characterize the volume, impact, internationalization, scientific capacity, and excellence level of the main producers of knowledge in NST and to evaluate the scientific levels of autonomy or dependency in impact and excellence, based on the internationalization and leadership. Along the way, we respond to the following questions:
1. Which countries have a greater knowledge output in NST? What evolutionary patterns of publication are seen for each one of these countries?
2. Do the levels of scientific performance of a country match its high(er) global output?
3. What levels of scientific autonomy and dependency are found when looking at international collaboration for the period 2003–2013?
The approach taken here, with its emphasis on the autonomy and dependency of countries in their performance, will contribute to constructive debate about how best to assess size and performance in future studies.
Materials and Methods
The data set was obtained from SCImago Journal and Country Rank (SJR) (SCimago, 2007) and SCImago Institutions Rankings (SIR) (SCImago, 2013), based on the Scopus database. The field of NST was recently created in both portals. The methodology used to retrieve documents from this field combined proper terms with a combination of queries from different authors, specialized journals, and new terms pertaining to the field as described by Muñoz-Ecija et al. (2011). There were 33 countries that had published more than 1000 documents over the period 2003–2013. These countries accumulated more than 95% of documents worldwide, and geographically represent all the different regions, except for Africa. According to the World Bank definition of economic development,1 27 are high-income countries, China, Iran, Brazil, Mexico, and Turkey are upper middle income, and India is classified as lower middle income.
Most indicators are expressed in relative values to facilitate the benchmarking process and help rate the countries under study (De Bellis, 2009; Vinkler, 2010). The indicators are as follows:
• Output: percentage of documents published by each country.
• Growth rate: percentage difference between the annual outputs of a country with respect to the previous year(s).
• Activity index: this indicator reflects the degree of specialization of each country, and it is standardized in order to facilitate comparison among the countries. The values are in the range [−1; 1], in which the value “0” represents the world average specialization in the field (Glänzel, 2000). Collaboration types (percentages): (a) no collaboration: papers published by one single institution regardless of the number of authors who signed the manuscript; (b) international collaboration: coauthored papers with foreign institutions; and (c) international collaboration with leadership: internationally coauthored papers where an institution of the given country has the role of “Corresponding author.” Papers including both national and international collaboration are considered in the “international” type. Intra-country collaboration which involves more than one institution within one country is not analyzed in this study.
• Leadership types: percentage of all documents published by a country in which the “Corresponding author” is affiliated to a national institution of the given country. This indicator is directly related to the previous one (collaboration types) and analyzes no collaboration as the set of leading documents by a single institution in a country, and internationally coauthored papers as the set of documents leading by one country in international collaboration.
• Normalized citation impact (NI): the relative number of citations received by each country, compared with the world average of citations received by a paper of the same document type, year, and category. This calculation is applied through “Item oriented field normalized citation score average” developed by Karolinska Institutet of Sweden (Rehn and Kronman, 2008). The values represent the relationship between the average scientific impact of a country and the worldwide average on the whole, with a score of 1. Therefore, an normalized impact of 0.7 means that the country is cited 30% less than the world average; and an impact of 1.2 means it is cited 20% more than the world average (Rehn and Kronman, 2008; González-Pereira et al., 2010).
• Normalized citation impact with leadership (NIL): this indicator limits its analysis to the output in which at least one author or institution of the given country has the role of “Corresponding author.”
• Benefit rate of collaboration in normalized citation impact (BRCNI): the percentage difference between the Normalized Citation Impact of all output (NI) and the NIL. This indicator acts as a proxy to determine the profit/benefit earned by each country in their NI when collaboration is not led by the given country. When the value is very low (<25%) or even negative, it means that the country does not derive much benefit from the collaborations that it does not lead; in other words, it signals scientifically well-developed countries whose NI of total output adequately reflects their scientific performance. If the difference between is very high (above 40%), we are dealing with scientifically developing countries that depend to a certain extent on collaborations with other countries in order to improve their normalized citation impact rates (Moya-Anegón et al., 2013). The threshold can vary from one domain to another, but the rule of thumb is the lesser the benefit rate, the better developed and more autonomous the institution.
• Excellence rate (% Exc.): percentage of scientific output that is included within the set of the top 10% most cited papers in that category (Tijssen et al., 2002; Tijssen and van Leeuwen, 2006; Bornmann et al., 2011, 2012). It is a measure of the high quality of output in a specific scientific field. The percentages of these indicators can be compared with the “world expected” value established for the top 10%.
• Excellence with leadership (% EwL): percentage of documents of excellence from the country considered as main contributor.
• Benefit rate of collaboration in scientific excellence (BRCE): this new indicator is the percentage differential between excellence per se and excellence with leadership. This differential reflects the benefits of the total excellence papers in comparison with leading papers.
Results
The results have been divided into three sections. The first presents the evolution and trends of output and the specialization rate. In the second section, the leadership and international collaboration are analyzed, and the third offers an analysis of performance.
Main Scientific Producers in Nanoscience and Nanotechnology Field
During the studied period, 176,158 documents were published, which stands as nearly a threefold growth of NST world share output, from 0.37% in 2003 to 1.07% in 2013 of all publication considered in all fields. The main growth spurt is between 2007 and 2013, when its world share output practically doubled (Table 1).
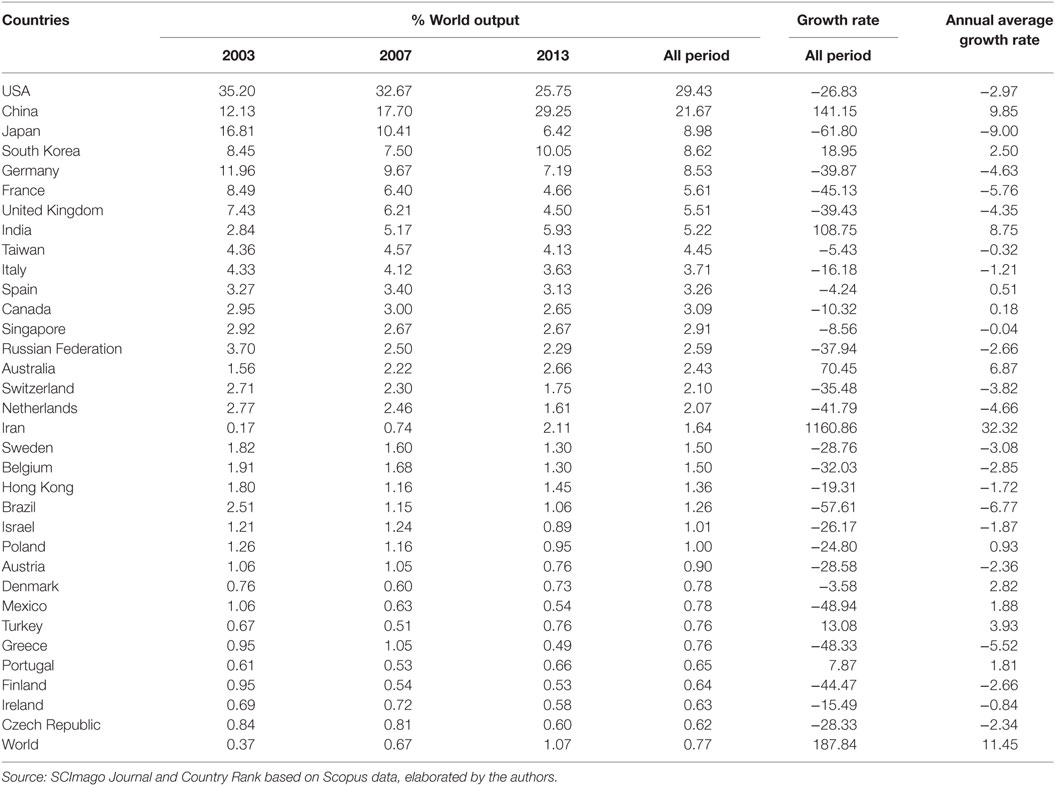
Table 1. Percentage of worldwide output, growth rate, and annual average growth rate in NST field by country.
The 33 countries analyzed were split into three groups: major producers are those whose share of worldwide output is higher than 15%, while medium producers range between 15 and 4%, and small producers publish a share of output lower than 4%. The share of output of a country is not linked with the growth trends over the studied period, which is instead reflected by their mean annual and total average growth rate (Table 1).
China and the USA are the major producers, respectively, contributing 29.43 and 21.67% of the total world output in N&N, although the trends observed are substantially different (Table 1). China became the country with the most NST papers in 2013 (29.25%), increasing more than 141%, with an annual growth rate of 9.85% that is only surpassed by Iran. This has been registered in previous studies reflecting the growth capacity of the country (Guan and Ma, 2007; Chen et al., 2013; Gorjiara and Baldock, 2014). Meanwhile, the USA decreased its share of output, from 35.2% in 2003 to 25.75% in 2013. There was not actually a decrease in the number of published documents, but the growth of the USA in NST was not as great as in the emerging countries, as has been seen for other scientific areas (Leydesdorff and Wagner, 2009). Despite this slight loss of protagonism, the USA must still be considered the main producer of knowledge with its 29.43% of worldwide output in NN, far above the medium and small producers.
The group of medium producers takes in three European countries (United Kingdom, France, and Germany) and four Asian ones (Japan, South Korea, India, and Taiwan), witnessing various trends. The European countries show a significant drop in their share of output. This comparative stagnation makes countries, such as South Korea and India, eventually surpass Europe’s share of output. India ranks fourth in worldwide publications in 2013 (10.05%), and South Korea is in the eighth position (5.93%). The fact that India doubles its publications, with an annual increase of as much as 8.75%, is probably due to the great number of institutions generating new knowledge (Karpagam et al., 2011). South Korea also shows outstanding growth (18.95% increase in worldwide output) in contrast to the downward evolution of Japan which went from being the third main producer (8.98%) to the fifth producer in 2013, with 6.42% of the global NST research, its share of output decreasing by 10.41%.
The group of small producers comprises 24 countries from Europe, the Middle East, the Pacific region, and South America. These countries reflect diverse trends in the evolution of their output, mainly in terms of size. Iran, Australia, and Turkey managed to increase their shares significantly (1160.8, 70.45, and 13.08%, respectively). However, the most striking case is that of Iran, growing well above the world share of research output, evidencing the improvement in the general research panorama of the country (He et al., 2005). By contrast, “emerging” Brazil shows a considerable drop in its share of output, from 2.51% in 2003 to 1.06% in 2013. As pointed out by Kay and Shapira (2011), Brazil, Mexico, and other Latin American countries have not fully integrated the new nanotechnologies in their processes of development. A lack of defining research targets for the development of this scientific field and a publication pattern heavily based on non-commercial purposes might explain this decrease (Kay and Shapira, 2009).
Activity Index
Analysis of this indicator reflects a greater specialization in NST research among the Asian countries (Figure 1). Singapore, South Korea, Taiwan, Hong Kong, Japan, China, and India published over the “world standard,” especially the first two, which suggests that NST research is a priority for these countries. It could be that national policy has led to a significant increase in output of their total research, but further analysis is needed to explore this possibility. European countries, such as Germany, Switzerland, Ireland, and France, also show specialization rates just above the “world standard.” By contrast, Mexico, Brazil, Poland, and United Kingdom reflect research models less focused on NST research. During the period studied, Brazil, Mexico, Japan, and Greece comparatively decreased their activity index. Meanwhile, Iran, Australia, and India were the ones that most increased their scientific specialization. The growth of output from these countries underlines NST research as a relevant proportion of their total research.
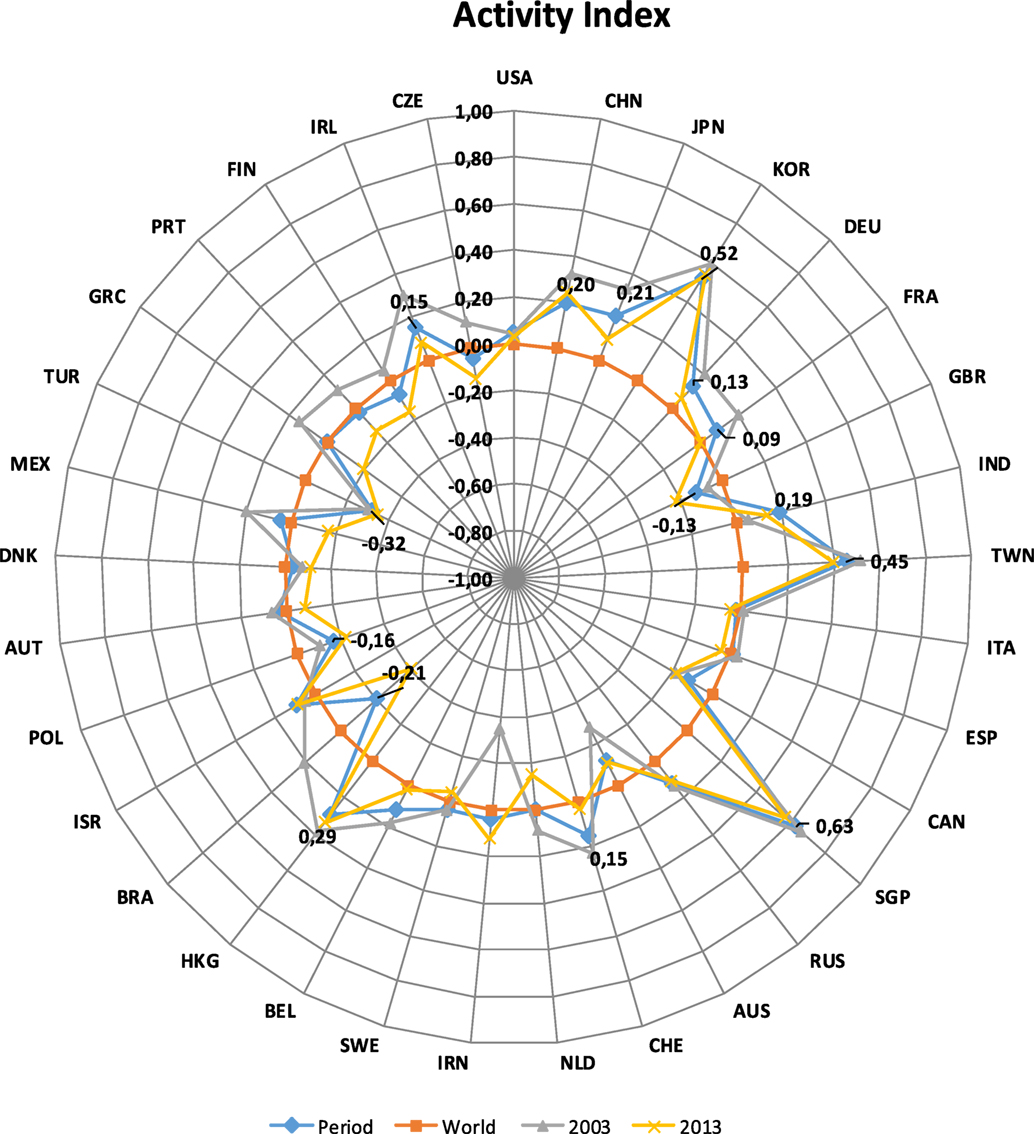
Figure 1. Activity index in NST. Years 2003, 2013, and whole period. Source: SCImago Journal and Country Rank based on Scopus data, elaborated by the authors.
International Collaboration and Leadership
At the country level, in leading papers (% leadership), there are two different subgroups. The first is made up of those papers published by a single institution without the participation of any other institution (either domestic or international) and labeled as non-collaborative papers (% leadership non-collaboration); the second group is labeled as leading internationally coauthored papers (% leadership international collaboration). According to the ICMEJ, leadership means responsibility and acknowledgment of the author/institution responsible for the publication of the research, leadership also means merit when it entails international collaboration. Thus, leadership and collaboration (% international collaboration) patterns help to characterize how research is carried out, taking into account scientific capacities in linkage networks and to what extent countries play different roles in the management of their own capacities to generate knowledge and to attract international partners (Figure 2).
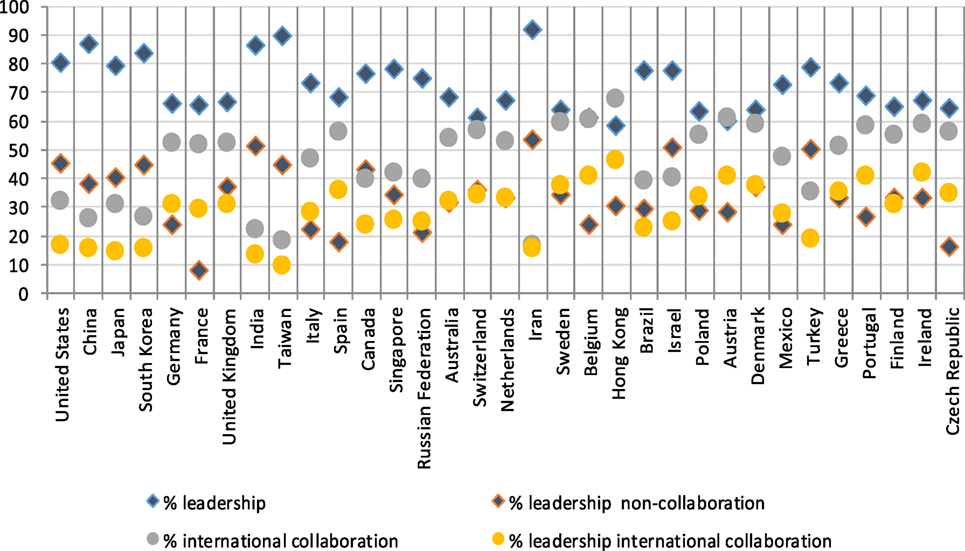
Figure 2. Percentages of international collaboration, total leadership, non-collaboration leadership, and international collaboration leadership, 2003–2013. Source: SCImago Journal and Country Rank based on Scopus data, elaborated by the authors.
Most countries that present a high share of total leadership also have low shares of international collaboration documents. Hong Kong (68.03%), Austria (61.71%), Switzerland (61.21%), and Belgium (60.84%) publish internationally above 60%, yet have the lowest leadership rates in all output (58.83, 60.51, and 61.22%, respectively), and accumulate international leading papers higher than 40% (46.44, 40.97, and 41.07%, respectively) representing a stronger role than non-collaborative ones (30.77, 24.24, and 28.54%, respectively). The high internationalization for Hong Kong has been documented previously, attributed to its collaborations with Chinese institutions (Tang and Shapira, 2011a).
In terms of international collaboration, only 18 of the 33 countries show shares above 50%. Many are European Union countries (the exception being Italy, at 47.09%). This could signal the introduction of policies for promoting collaboration among EU countries and countries beyond, requiring the participation of at least three members in publicly funded research projects (Wagner et al., 2015).
In general, the countries that published more than 45% of output in international collaboration are also the countries whose leadership in international collaboration is above or equal to their non-collaborative leadership, in this case the only exception being the United Kingdom. The pattern of leadership of these countries is oriented toward leading collaborative efforts, making this type of papers the most substantial part of their publications. In the case of France, the Czech Republic, and Spain, it is also seen that the share of leading international papers is well above the non-collaborative leading papers (respectively, 8.39, 16.63, and 17.95%). Australia, Switzerland, and the Netherlands, having practically equal international and non-collaborative leadership shares, can be viewed as examples of a good balance between both kinds of leading publications.
To the contrary, there are 15 countries whose total leadership shares are above 70%, with international collaboration shares below 50%. This group embraces the largest producers (USA and China), the Asian producers (South Korea, Japan, India, and Taiwan), and, among the small ones, Iran, Turkey, Singapore, Israel, Brazil, Canada, the Russia Federation, and Italy. Iran (91.99%) and Taiwan (90.01%) showed the largest shares of leading documents, mainly non-collaborative papers, along with the lowest shares of international collaboration, respectively, 17.02 and 18.8%. The leadership with international collaboration in this group was very low (below 20%) in comparison with their leadership without collaboration, most values above 40%, and China slightly behind at 38.55%.
The USA, China, South Korea, and Japan prove similar in their leadership shares around 80%, international collaboration rates around 30%, and in over half their international collaboration they took on the role of research guarantor. In view of the volume of output of these countries, collaboration in leading papers is decisive frothier indexes of both international collaboration and non-collaborative papers. This information, in line with previous studies regarding NST in China and USA (Chen et al., 2013), also comes to confirm results about China, South Korea, and Japan as having little connection with other countries despite their recent growth in NST publications (Huang et al., 2011). On the other hand, Israel and Canada exhibit primarily national-oriented leadership patterns, having non-collaborative leadership shares of 50.97 and 43.13%, respectively, and leadership in collaboration shares below 30% (25.43% for Israel and 23.91% for Canada).
Analysis of the Normalized Citation Impact of All and Leading Outputs
Figure 3 shows countries broken down by their values of normalized citation impact, and colored by groups according its normalized citation impact. The first group is of countries with a normalized citation impact higher than 1.20, the second group ranges between 1.20 and 1, the third group lies just below the world average (1–0.80), and the fourth and final group has an impact lower than 0.80.
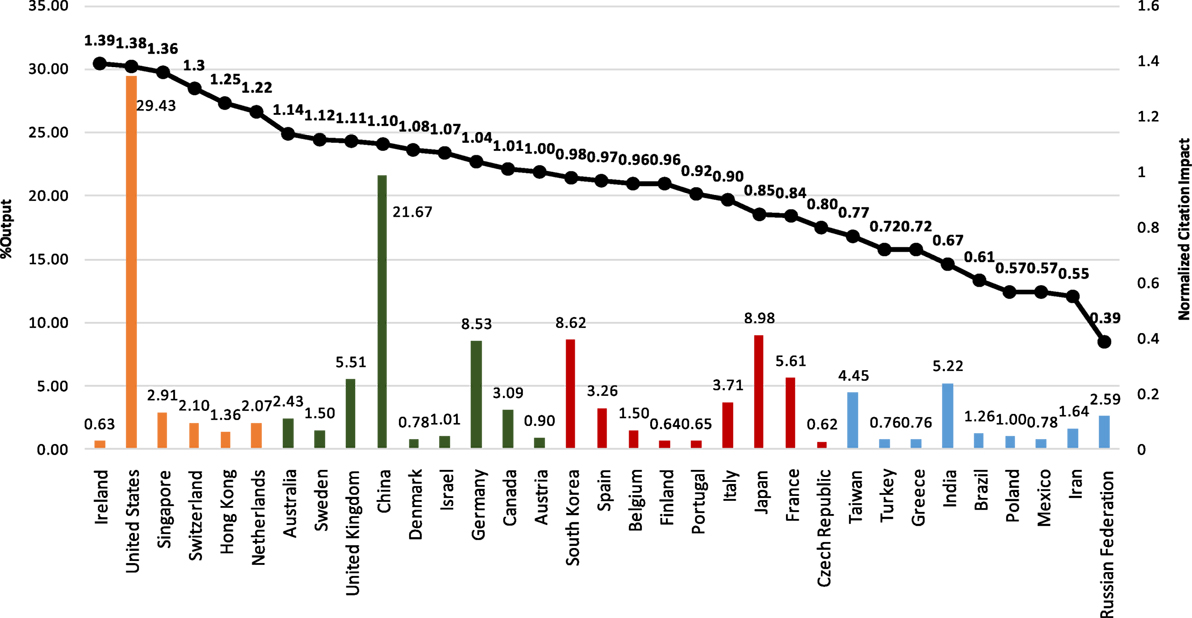
Figure 3. Share of output and normalized citation impact by countries. Source: SCImago Journal and Country Rank based on Scopus data, elaborated by the authors.
The first group is headed by Ireland, with citations 39% above the world average. Despite being a low producer, Ireland attains high visibility; hence, its research is held in high esteem worldwide. USA publications are cited 38% above the world average – followed by Singapore, Switzerland, Hong Kong, and the Netherlands – and the USA is the main producer with the highest visibility in N&N, as has been reported previously (Glänzel et al., 2003; Youtie et al., 2008).
The second group includes Australia, Sweden, United Kingdom, China, Denmark, Israel, Germany, Canada, and Austria, which receive more citations than the world average. Interestingly, China, the second main producer, obtains citations above the world average (1.10), indicating that its publication performance is virtually not affected by its fast growth spurt during the period of study.
Quite a different scenario is that of Poland, Mexico, Iran, and the Russian Federation. They lag far behind the world average of citations, particularly Iran (45% below the world average). The characteristic patterns of publication of Iran, featuring the highest leadership share, the lowest international collaboration, and the highest non-collaborative papers, may reduce its international visibility. Russian research is 61% below the world average for impact in the period 2003–2013, in consonance with the trend reported by Terekhov (2012), Russia then ranked as the 43rd country in the world in terms of citation per paper (for the period 1990–2010).
Normalized Citation Impact with Leadership
This indicator accounts for leadership outputs, showing no clear differences in the relevance of leadership of the countries regarding their leading impact (Figure 4). Ireland and USA had the highest impact in their leading output, both reaching 1.43, while Russia is still the country with the lowest NIL. China, Denmark, South Korea, and Australia, in addition to a commendable growth of output, maintain a high degree of visibility. To the contrary, Iran, Turkey, and India present values below the world average, both in total N%N output and in leading production.
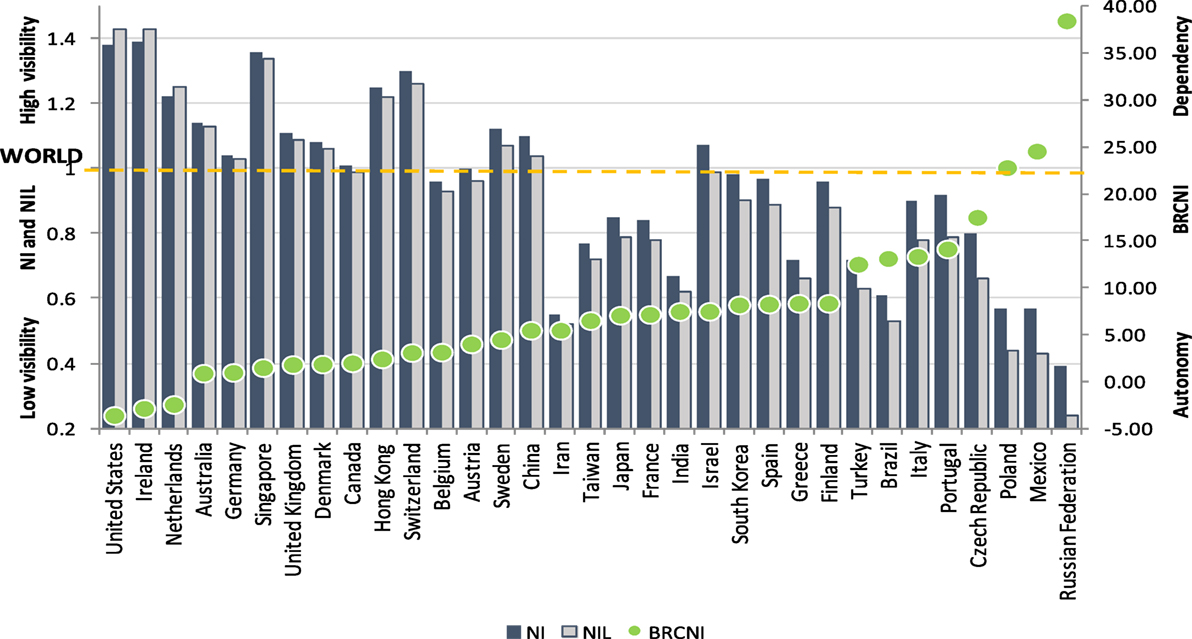
Figure 4. Normalized citation impact in total output, normalized citation impact in leading output, and benefit rate of collaboration in normalized citation. Source: SCImago Journal and Country Rank based on Scopus data, elaborated by the authors.
Benefit Rate of Collaboration in Normalized Citation Impact
The so-called BRCNI is a performance indicator based on the differential between the citation impacts of total output and leading output. It allows one to calibrate the scientific capacities of countries in terms of leadership and visibility (Moya-Anegón et al., 2013). This study arrived at percentages ranging between −3.62 and 38.46%. The lowest values signal a better performance, as long as the condition of being near or above the world average of citations is also achieved. Such a status is representative of scientifically well developed and more independent countries. The highest values point to countries whose dependency upon collaboration is linked to a gain in visibility.
The USA (−3.62%), Ireland (−2.88%), and the Netherlands (−2.46%) are the only countries clearly manifesting a negative benefit rate of collaboration in their impact (Figure 4). Here, international collaboration can have a lower impact than domestic papers or non-collaborative papers as pointed out in the previous studies (Glänzel et al., 2003). These findings accentuate the importance of leadership: when these actors adopted the role of research guarantor publications, they began to show better citation impacts, both internationally and in non-collaborative papers. Countries with global and leading impacts include Australia, Germany, Singapore, United Kingdom, Denmark, Canada, Hong Kong, and Switzerland, all exhibiting great autonomy in leadership, with benefit rates under 3%.
Unusual cases are those of China and Iran. They have a common benefit rate and the same level of autonomy. Both countries increased their publication very substantially and were leaders in a similar percentage of international collaborative efforts, but they manifest with two key differences in their overall publication patterns. Iran’s output is concentrated in non-collaborative papers (54%), and its total international collaboration is very scanty (17%). But in contrast with China’s high visibility, Iran does not reach the world average for citations. Granted, the future may paint a different story for Iran’s visibility. Bearing in mind that the country is in a phase of consolidation and expansion, possibly evolving into one of the most important Gulf States, aspects of internationalization can be expected to continue now that the international boycotts have been canceled (Moed, 2016). Meanwhile, China has recently become a major-league player in terms of international coauthorship relations (Leydesdorff et al., 2013) by establishing strong links of collaboration with N&N-developed countries such as USA, Germany, or Singapore. This is also true in Australia (Tang and Shapira, 2011b; Chen et al., 2013; Gorjiara and Baldock, 2014). In short, there are numerous factors of a geographic, political, social, or historical nature that bear relation with scientific production, and with the recent development of N&N, that must be studied to better understand opportunities and performances.
Israel, South Korea, Spain, and Finland, despite coming close to the world mean for leadership impact, can boast total impact figures around the world average due to the visibility of their non-leadership collaborations. These countries are not mostly dependent on non-leading players to improve the citation impact of their total output. But when compared with countries sharing similar publication patterns, their benefit of collaboration appears considerably high, suggesting that they could, in fact, remain scientifically and successfully semiautonomous.
The highest rates of benefit from collaborations as seen in normalized citation impact pertain to Russia (38.46%), Mexico (24.56%), and Poland (22.81%), followed by the Czech Republic. Accordingly, these countries derived greater benefits from the impact of their non-leading publications. Notwithstanding, the normalized citation impact figures are far below the world average and serve to confirm that collaboration is the best means of improving a low impact. These countries would therefore be good examples of scientifically dependent countries, needing collaboration to improve their normalized citation impact significantly.
Analysis of Excellence and of Excellence with Leadership Indicators
These two indicators serve to underline high quality performance in terms of output. Figure 5 shows the indicator of excellence for all papers and the excellence of leading papers, both located at 10% bounds the world mean. The only countries surpassing the standard for both indicators are USA and Singapore: the USA registered 15.62% of its total output in the top 10% most highly cited in N&N, with 13.16% of leading excellence outputs; and Singapore reached a total excellence of 15.52 and 12.48% in leading excellence output. Only 14 countries reach the world excellence rate (right lower quadrant), including, for instance, Canada. These countries are able to generate high quality knowledge and moreover attract the attention of the international scientific community.
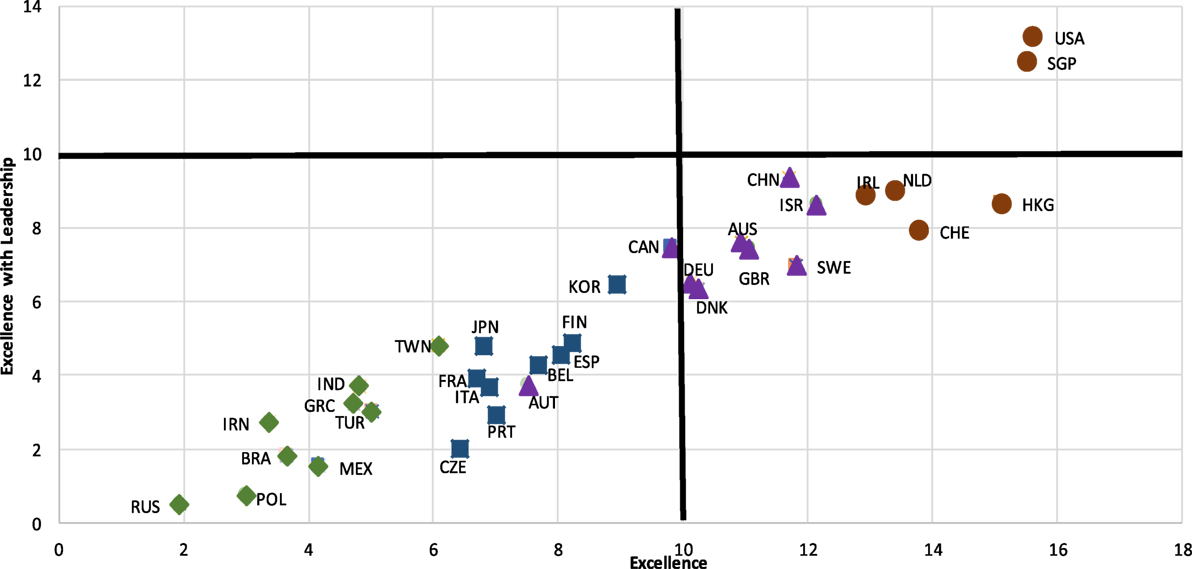
Figure 5. Percentage of excellence and excellence with leadership, by country. Source: SCImago Journal and Country Rank based on Scopus data, elaborated by the authors.
Some similarities among the countries showing the highest values in normalized citation impact (in both total and leading papers, Figure 4) and those registering the highest total and lead excellence outputs deserve mention here. They appear as the most visible countries in the field, aside from those with patterns toward leading international collaboration (above 30%) and percentages of leadership below 70%. Nevertheless, the indicator of excellence with leadership is much more demanding than the normalized citation impact. Few countries are able to publish leading papers that are also highly cited. Clearly, there are difficulties in reaching levels of excellence levels despite having outstanding output and sound publication patterns. There is much to be gained, presumably, by a high quantity of citations received, converting high quality papers into internationally acknowledged ones.
Benefit Rate of Collaboration in Scientific Excellence
Figure 6 gives the differential percentages between the total and the leadership excellence rates. Benefit rates are seen to range from 15.75 to 75.33%. The lowest values denote a better performance, as long as the condition of being near or above the world average of excellence is achieved. This is a trait responding to the more independent and scientifically developed countries. The highest values designate countries whose dependency upon collaboration is very high, ranking toward the top at global level.
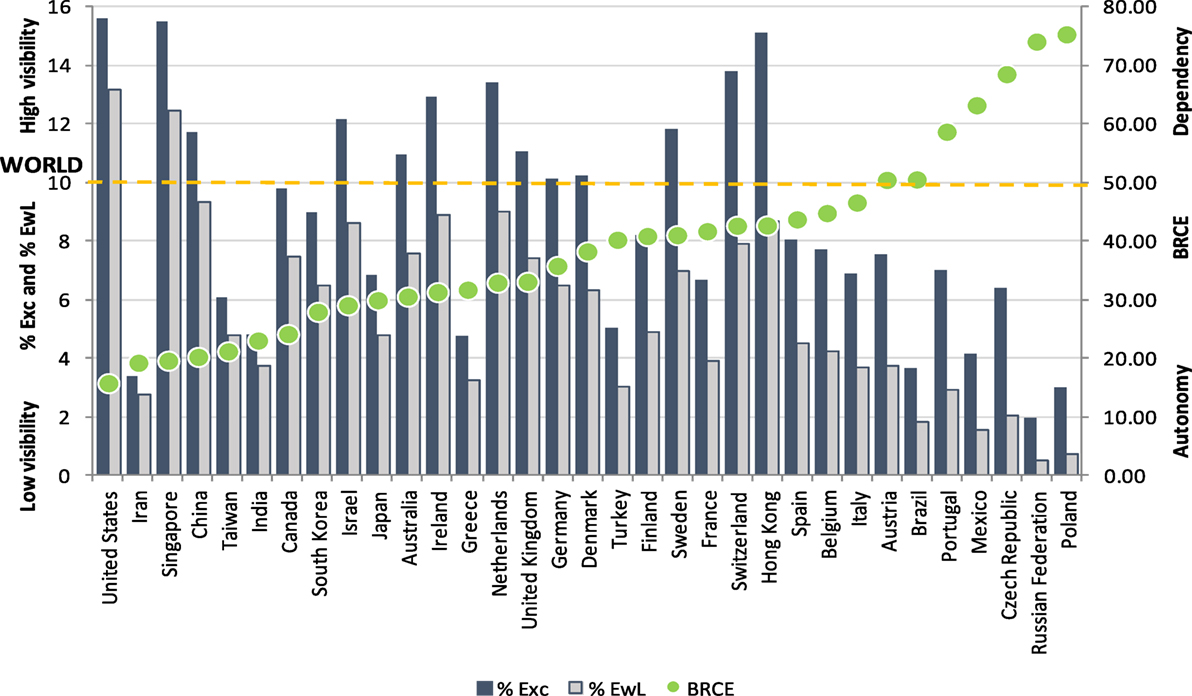
Figure 6. Percentage of excellence in total output and leading output, and benefit rate for collaboration in scientific excellence. Source: SCImago Journal and Country Rank based on Scopus data, elaborated by the authors.
In view of Figure 6, the benefit rate of collaborations for reaching excellence presents different scenarios. The first one characterizes the 14 countries that are most cited in the world in the realm of NST (Sweden is included, very close to the standard) among total output. Within this set, the most independent and scientifically advanced countries are USA and China. These outstanding producers are followed by Singapore, Israel, and Ireland. Then, countries such as the Netherlands, United Kingdom, Germany, Denmark, Switzerland, Hong Kong, Canada, and Sweden are found to depend to a certain extent on their collaborators to reach a good level of excellence (regardless of a sufficient leadership capacity, reaching the mean for normalized citation impact). In other words, even countries demonstrating a high potential for sound performances would need to collaborate with partners if they wish to generate results contributing to knowledge advancement.
The second scenario is perhaps characteristic of emerging countries such as Iran, Taiwan, and India, where the benefit rates prove lesser than the percentage of excellent publications (total and leading). This is indicative of potential and autonomy for creating high quality research, but a need to consolidate work efforts. Most of the international coauthored papers under this grouping are led by the emerging countries themselves, and the benefit from non-leading papers is consequently low.
Finally, a third NST scenario is perceived through the examples of Poland, the Russian Federation, the Czech Republic, Mexico, Portugal, Austria, and (to some extent) Italy. They derive vast benefits from collaboration, generating papers that are situated within the 10% most cited in the field.
Conclusion
This paper has evaluated and updated information about research in the field of NST over the period 2003–2013, with a focus on the top producers of knowledge. Global NST research amounted to more than 1% worldwide in 2013. Although this figure is still small, it evidences substantial growth throughout the period, as reported by previous studies (Glänzel et al., 2003; Gorjiara and Baldock, 2014).
The USA and China are the main producers. The decrease in relative importance (worldwide share) of USA and some European producers – France, Germany, and United Kingdom – does not mean a decline in their absolute rates of publication, which keep growing. Yet, the emergence of countries, such as China, Iran, India, and Australia, implies a bigger share of the total output, and therefore a higher level of representation of these countries at the expense of the previous protagonists.
The specialization index shows Asian countries to have a higher concentration of NST research output than the rest of the studied countries, a possible indication that NST research has become established as a scientific priority in this geographical area.
Curiously, some countries that present high percentages for total leadership also have low percentages of internationally coauthored papers. Such is the case of Iran, India, and Taiwan, mainly oriented to publish non-collaborative papers, denoting a degree of scientific isolation or a strategy based on national priorities and targets (Kay and Shapira, 2009). In the particular case of Iran, the international boycott and certain political tensions would certainly play a role. Therefore, other factors that reflect the geographical, political, social, and historical situation or relations have to be considered to better understand the dynamics of scholarly communication. In contrast, Hong Kong and Austria are the countries with the highest international collaboration and the lowest leadership.
The decomposition of leadership reveals that the European countries, Australia, and Hong Kong develop patterns of publication that are internationally oriented, toward the generation of leading collaborations. USA, Singapore, and Ireland were found to be the most autonomous and scientifically developed countries, with sound levels in research performance by virtue of their own capacities, hence leaders in the NST field. In contrast, the Russian Federation, Poland, and Mexico are mostly dependent on external partners to obtain visibility. Once again, Iran deserves further analysis because of its autonomy in generating new knowledge, but very scarce visibility.
The levels of international collaboration are significantly related to the scientific performance of the countries studied, excepting the USA and China, with well-consolidated scientific systems. Our findings furthermore reveal that the shares of non-collaborative papers are a relevant factor for the scientific autonomy or dependency of a country’s impact. In turn, the activity index does not faithfully reflect the performance of the countries. Countries such as Singapore and China, with a high level of specialization in N&N, obtained considerably high visibility and scientific autonomy. However, countries such as Taiwan, India, France, or South Korea, also showing specialization rates above the world average, were found to have comparatively low levels of visibility for their output.
These results highlight the importance of collaboration for the scientific development of a country, and how different growth trends in output can affect its impact. It would appear that countries having a model of scientific growth based on the generation of non-collaborative papers or very small shares of international collaboration may exceptionally increase their output, but at the expense of the visibility of their papers. At any rate, this sort of evolution requires further study, to explore the context of a particular country’s research in N&N.
Methodologically speaking, this paper provides a partly novel approach to assess research performance, taking into account features such as the patterns of leadership and collaboration of countries, to better gage the scientific capacity of the main producers of knowledge. The performance and relevance of research are a growing concern when scientific research policies are designed, worldwide. In this sample context, the underlying patterns of publication and collaboration, as well as the impact and excellence of output in terms of leadership, may be seen as valuable aspects of scientific development that can help orient agendas for science, technology, and innovation, while fomenting competition. Such findings suggest that in the realm of science, the competitive spirit is fully compatible with collaborative efforts. They also shed light on growing interest in certain topics far beyond domestic borders.
Limitations and Future Research
This new methodology can be extrapolated to different fields of study. The metrics provided here are not the only indicators that might account for analyzing research performance. It follows that any measure used to gage impact will also reflect social factors beyond the conventions or patterns of behavior of scientific output (Bornmann and Daniel, 2008). As strongly advocated in the Leiden manifesto, scholarly metrics should play the supporting role to qualitative and in-depth analyses of scholarly content and activities (Hicks et al., 2015). There are many ways to expand upon this analysis in order to enrich and complement the findings exposed here.
Because the aim of this study was not to analyze detailed forecasts of R&D investment in NST, the Section “Introduction” does not present a complete overview, but a series of figures considered sufficient to identify the importance of the field in policy initiatives at global level. This prospect should be more deeply explored in combination with other indicators in future studies.
This study assumes that the Scopus database gathers most publications in NST worldwide. This is partially true, though not all outputs are covered, and only part of the total R&D in the field is harvested. The database is active and in constant expansion, so updated analysis should be undertaken to monitor development in this field. Still, Scopus allows for analyses that are valid and comparable within the realm of the database worldwide. Indeed, it would be interesting to compare Scopus contents with those of other databases such as the Web of Science, exploring similarities and differences in trends surrounding scientific size and performance, or other aspects of technological output.
Additionally, due to the interdisciplinary character of field, the assessment of the research requires benchmarking with different disciplines. Nevertheless, the findings obtained in this study may serve as a reference for further comparisons involving specific disciplines within NST.
The composite analysis of normalized citation impact, scientific excellence, different kinds of leadership, and collaborations would provide much more accurate information if policies implemented inside and among countries were well known. This would enable us to detect what kind of collaboration (national, regional, or international) provides greater benefits in performance indicators, by analyzing the dynamics and composition of collaboration networks.
Intra-country collaboration which involves more than one institution within one country is not analyzed in this study. Due to the fact that contacts established through domestic collaboration schemes can serve as stepping stones for broader future collaborations, the analysis of intra-country collaboration deserves further analysis; it will be the focus of a future study. Such an approach applied at the institutional level could provide a better picture of the research in any field, the level of granularity shedding light on domestic leadership, as well as non-collaborative and international leadership. The key question is how collaboration and the management of leadership can influence the performance of different institutions (Chinchilla-Rodríguez et al., 2016). A related point is how useful the research guarantor/leadership approach is for assessing technological impact. Previous studies have applied such analysis for the main producers in NST (Braun et al., 1997; Glänzel et al., 2003; Hullmann and Meyer, 2003), but the novel inclusion of different types of leadership will provide a more thorough view of the evolution of NST research and how this emerging scientific area is actually developing.
Author Contributions
ZC-R: conceived of the study, participated in its design and coordination, and drafted the manuscript. KO-R: gathered data from source, carried out the analysis of data, and helped to draft the manuscript. BV-Q: helped draft the manuscript. All authors read and approved the final manuscript.
Conflict of Interest Statement
The authors declare that the research was conducted in the absence of any commercial or financial relationships that could be construed as a potential conflict of interest.
Acknowledgments
Financial support from the Spanish National Plan for Scientific and Technical Research and Innovation is acknowledged (Research project CSO2014-57770-R). The authors wish to thank the reviewers who have contributed significantly to improve the content of the paper and Jean Sanders for translating/editing the manuscript.
Funding
Projects I + D + I, State Programme of Research, Development and Innovation oriented to the Challenges of the Society: NANOMETRICS (Ref. CSO2014-57770-R) supported by Ministerio de Economía y Competitividad of Spain.
Footnote
References
Ávila-Robinson, A., and Miyazaki, K. (2013). Evolutionary paths of change of emerging Nan technological innovation systems: the case of ZnO nanostructures. Scientometrics 95, 829–849. doi:10.1007/s11192-012-0939-7
Bajwa, R. S., and Yaldram, K. (2012). Research output in nanoscience and nanotechnology: Pakistan scenario. J. Nanopart. Res. 14, 721. doi:10.1007/s11051-012-0721-z
Barcikowski, S., Devesa, F., and Moldenhauer, K. (2009). Impact and structure of literature on nanoparticle generation by laser ablation in liquids. J. Nanopart. Res. 11, 1883–1893. doi:10.1007/s11051-009-9765-0
Bassecoulard, E., Lelu, A., and Zitt, M. (2007). Mapping nanosciences by citation flows: a preliminary analysis. Scientometrics 70, 859–880. doi:10.1007/s11192-007-0315-1
Beigel, F., and Hanan, S. (Cooeds). (2014). “Dependencia académica y profesionalización en el sur,” in Perspectivas desde la periferia, 1 Edn (Mendoza, Rio de Janeiro: EDIUNC, SEPHIS).
Borgman, C. L., and Furner, J. (2002). Scholarly communication and bibliometrics. Annu. Rev. Inform. Sci. Technol. 36, 3–72. doi:10.1002/aris.1440360102
Bornmann, L., Daniel, H. D. (2008). What do citation counts measure? A review of studies on citing behavior. J. Doc. 64, 45–80. doi:10.1108/00220410810844150
Bornmann, L., Leydesdorff, L., Walch-Solimena, C., and Ettl, C. (2011). Mapping excellence in the geography of science: an approach based on Scopus data. J. Inform. 5, 537–546. doi:10.1016/j.joi.2011.05.005
Bornmann, L., Moya-Anegón, F., and Leydesdorff, L. (2012). The new excellence indicator in the world report of the SCImago Institutions Rankings 2011. J. Inform. 6, 333–335. doi:10.1016/j.joi.2011.11.006
Braun, T., Schubert, A., and Zsindely, S. (1997). Nanoscience and nanotechnology on the balance. Scientometrics 38, 321–325. doi:10.1007/BF02457417
Chen, Y., Assimakopoulos, D., Xie, H., and Chi, R. (2013). Evolution of regional scientific collaboration networks: China-Europe Emerging Collaborations on nano-science. Int. J. Technol. Manag. 63, 185–211. doi:10.1504/IJTM.2013.056898
Chinchilla-Rodríguez, Z., Miguel, S., and Moya-Anegón, F. (2015). What factors are affecting the visibility of Argentinean publications in human and social sciences in Scopus? Some evidences beyond the geographic realm of the research. Scientometrics 102, 789–810. doi:10.1007/s11192-014-1414-4
Chinchilla-Rodríguez, Z., Vargas-Quesada, B., Hassan-Montero, Y., González-Molina, A., and Moya-Anegón, F. (2010). New approach to the visualization of international scientific collaboration. Inform. Visual. 9, 277–287. doi:10.1057/ivs.2009.31
Chinchilla-Rodríguez, Z., Zacca-González, G., Vargas-Quesada, B., and Moya-Anegón, F. (2016). Benchmarking scientific performance by decomposing leadership of Cuban and Latin American Institutions in Public Health. Scientometrics 106, 1239–1264. doi:10.1007/s11192-015-1831-z
De Bellis, N. (2009). Bibliometrics and Citation Analysis: From the Science Citation Index to Cybermetrics. Maryland, MD: Scarecrow Press.
Ely, A. V., and Scoones, I. (2009). The Global Redistribution of Innovation: Lessons from China and India, STEPS Working Paper 22. Brighton: STEPS Centre.
Etxebarria, G., Gomez-Uranga, M., and Barrutia, J. (2012). Tendencies in scientific output on carbon nanotubes and graphene in global centers of excellence for nanotechnology. Scientometrics 91, 253–268. doi:10.1007/s11192-012-0617-9
European Commission. (2016). Nanotechnologies, Advanced Materials, Advanced Manufacturing and Processing, and Biotechnology, Horizon 2020. Available at: http://ec.europa.eu/programmes/horizon2020/en/h2020-section/nanotechnologies-advanced-materials-advanced-manufacturing-and-processing-and
Feynman, R. P. (1960). There’s plenty of room at the bottom. Resonance 16, 890–905. doi:10.1007/s12045-011-0109-x
Gazni, A., and Didegah, F. (2011). Investigating different types of research collaboration and citation impact: a case study of Harvard University’s publications. Scientometrics 87, 251–265. doi:10.1007/s11192-011-0343-8
Gazni, A., Sugimoto, C. R., and Didegah, F. (2012). Mapping world scientific collaboration: authors, institutions and countries. J. Am. Soc. Inf. Sci. Technol. 63, 323–335. doi:10.1002/asi.21688
Glänzel, W. (2000). Science in Scandinavia: a bibliometric approach. Scientometrics 49, 357–367. doi:10.1023/A:1010559323943
Glänzel, W. (2001). National characteristics in international scientific co-authorship. Scientometrics 51, 69–115. doi:10.1023/A:1010512628145
Glänzel, W., Meyer, M., Plessis, M. D., Thijs, B., Magerman, T., Schlemmer, B., et al. (2003). Domain Study ‘Nanotechnology: Analysis of an Emerging Domain’. Leuven: Steunpunt O&O Statistieken.
González-Pereira, B., Guerrero-Bote, V. P., and Moya-Anegón, F. (2010). A new approach to the metric of journals’ Scientific Prestige: the SJR indicator. J. Inform. 4, 379–391. doi:10.1016/j.joi.2010.03.002
Gorjiara, T., and Baldock, C. (2014). Nanoscience and nanotechnology research publications: a comparison between Australia and the rest of the world. Scientometrics 100, 121–148. doi:10.1007/s11192-014-1287-6
Guan, J., and Ma, N. (2007). China’s emerging presence in nanoscience and nanotechnology: a comparative bibliometric study of several nanoscience ‘giants’. Res. Policy 36, 880–886. doi:10.1016/j.respol.2007.02.004
Hassan, S., Haddawy, P., Kuinkel, P., Degelsegger, A., and Blasy, C. (2012). A bibliometric study of research activity in ASEAN related to the EU in FP7 priority areas. Scientometrics 91, 1035–1051. doi:10.1007/s11192-012-0665-1
He, T., Zhang, J., and Teng, L. (2005). Basic research in biochemistry and molecular biology in China: A bibliometric analysis. Scientometrics 62, 249–259. doi:10.1007/s11192-005-0018-4
Hicks, D., Wouters, P., Waltman, L., Rijcke, S. D., and Rafols, I. (2015). Bibliometrics: the Leiden Manifesto for research metrics. Nature 520, 429–431. doi:10.1038/520429a
Hoekman, J., Frenken, K., and Tijssen, R. J. W. (2010). Research collaboration at a distance: changing spatial patterns of scientific collaboration within Europe. Res. Policy 39, 662–673. doi:10.1016/j.respol.2010.01.012
Huang, C., Notten, A., and Rasters, N. (2011). Nanoscience and technology publications and patents: a review of social science studies and research strategies. J. Tech. Tran. 36, 145–172. doi:10.1007/s10961-009-9149-8
Hullmann, A. (2006). The Economic Development of Nanotechnology – An Indicators Based Analysis. EU Report, Brussels: European Commission.
Hullmann, A. (2007). Measuring and assessing the development of nanotechnology. Scientometrics 70, 739–758. doi:10.1007/s11192-007-0310-6
Hullmann, A., and Meyer, M. (2003). Publications and patents in nanotechnology. Scientometrics 58, 507–527. doi:10.1023/B:SCIE.0000006877.45467.a7
Initiative National Nanotechnology. (2016). Nano.gov. Available at: http://www.nano.gov/about-nni/what/funding
International Committee of Medical Journal Editors. (2012). Uniform Requirements for Manuscripts Submitted to Biomedical Journals. Available at: http://www.icmje.org/urm_main.html
Jia, L. (2005). Global governmental investment in nanotechnologies. Curr. Nanosci. 1, 263–266. doi:10.2174/157341305774642957
Karpagam, R., Gopalakrishnan, S., Natarajan, M., and Babu, B. R. (2011). Mapping of nanoscience and nanotechnology research in India: a scientometric analysis, 1990-2009. Scientometrics 89, 501–522. doi:10.1007/s11192-011-0477-8
Kay, L., and Shapira, P. (2009). Developing nanotechnology in Latin America. J. Nanopart. Res. 11, 259–278. doi:10.1007/s11051-008-9503-z
Kay, L., and Shapira, P. (2011). “The potential of nanotechnology for equitable economic development: the case of Brazil,” in Nanotechnology and the Challenges of Equity, Equality and Development (Netherlands: Springer), 309–329.
Kostoff, R. N., Murday, J. S., Lau, C. G. Y., and Tolles, W. M. (2006). The seminal literature of nanotechnology research. J. Nanopart. Res. 8, 193–213. doi:10.1007/s11051-005-9034-9
Leydesdorff, L., and Wagner, C. S. (2009). Is the United States losing ground in science? A global perspective on the world science system. Scientometrics 78, 23–36. doi:10.1007/s11192-008-1830-4
Leydesdorff, L., Wagner, C. S., Park, H. W., and Adams, J. (2013). International collaboration in science: the global map and the network. El profesional de la información 22, 87–94. doi:10.3145/epi.2013.ene.12
Leydesdorff, L., and Zhou, P. (2007). Nanotechnology as a field of science: its delineation in terms of journals and patents. Scientometrics 70, 693–713. doi:10.1007/s11192-007-0308-0
López Cadenas, M. S., Hasmy, A., and Vessuri, H. (2011). Nanoscience and nanotechnology in Venezuela. J. Nanopart. Res. 13, 3101–3106. doi:10.1007/s11051-011-0434-8
Menéndez-Manjón, A., Moldenhauer, K., Wagener, P., and Barcikowski, S. (2011). Nano-energy research trends: bibliometrical analysis of nanotechnology research in the energy sector. J. Nanopart. Res. 13, 3911–3922. doi:10.1007/s11051-011-0344-9
Meyer, M., and Persson, O. (1998). Nanotechnology-interdisciplinarity, patterns of collaboration and differences in application. Scientometrics 42, 195–205. doi:10.1007/BF02458355
Moed, H. F. (2016). Iran’s Scientific Dominance and the Emergence of South-East Asian Countries in the Arab Gulf Region. Available at: http://arxiv.org/abs/1602.04701
Moya-Anegón, F., Guerrero-Bote, V. P., Bornmann, L., and Moed, H. F. (2013). The research guarantors of scientific papers and the output counting: a promising new approach. Scientometrics 97, 421–434. doi:10.1007/s11192-013-1046-0
Muñoz-Ecija, T., Vargas-Quesada, B., Chinchilla-Rodríguez, Z., and Gómez-Núñez, A. J. G. (2011). “Nanoscience and nanotechnology in Scopus: journal identification and visualization,” in Proceedings of ISSI 2013 – 14th International Society of Scientometrics and Informetrics Conference (Vienna), Vol. 2, 2061–2063.
Ni, C., Sugimoto, C., and Jiang, J. (2011). “Degree, closeness, and betweenness: application of group centrality measurements to explore macro-disciplinary evolution diachronically,” in Proceedings of ISSI 2011 (Durban, South Africa).
Noyons, E. C. M., Buter, R. K., Van Raan, A. F. J., Schmoch, U., Heinze, T., Hinze, S., et al. (2003). Mapping Excellence in Science and Technology across Europe: Nanoscience and Nanotechnology. Report of project EC-PPN CT-2002-2001 to the European Commission. Available at: https://cordis.europa.eu/pub/indicators/docs/mapex_nano.pdf.
OECD. (2013). OECD Science, Technology and Industry Scoreboard 2013: Innovation for Growth. Paris: OECD Publishing.
Persson, O. (2010). Are the highly cited papers more international? Scientometrics 83, 397–401. doi:10.1007/s11192-009-0007-0
Pouris, A. (2007). Nanoscale research in South Africa: a mapping exercise based on Scientometrics. Scientometrics 70, 541–553. doi:10.1007/s11192-007-0301-7
Rehn, C., and Kronman, U. (2008). Bibliometric Handbook for Karolinska Institutet. Huddinge: Karolinska Institutet.
Salter, B. (2009). State strategies and the geopolitics of the global knowledge economy: China, India and the case of regenerative medicine. Geopolitics 14, 47–78. doi:10.1080/14650040802578666
Schummer, J. (2004). Multidisciplinarity, interdisciplinarity, and patterns of research collaboration in nanoscience and nanotechnology. Scientometrics 59, 425–465. doi:10.1023/B:SCIE.0000018542.71314.38
SCimago. (2007). SCImago Journal & Country Rank. Available at: http://www.scimagojr.com
SCImago. (2013). SCImago Institutions Rankings. Available at: http://www.scimagoir.com
Shapira, P., and Wang, J. (2010). “Follow the money.” What was the impact of the nanotechnology funding boom of the past ten years? Nature 468, 627–628. doi:10.1038/468627a
Tahmooresnejad, L., Beaudry, C., and Schiffauerova, A. (2015). The role of public funding in nanotechnology scientific production: where Canada stands in comparison to the United States. Scientometrics 102, 753–787. doi:10.1007/s11192-014-1432-2
Tang, L., and Shapira, P. (2011a). Regional development and interregional collaboration in the growth of nanotechnology research in China. Scientometrics 86, 299–315. doi:10.1007/s11192-010-0274-9
Tang, L., and Shapira, P. (2011b). China-US scientific collaboration in nanotechnology: patterns and dynamics. Scientometrics 88, 1–16. doi:10.1007/s11192-011-0376-z
Terekhov, A. I. (2012). Evaluating the performance of Russia in the research in nanotechnology. J. Nanopart. Res. 14, 1250–1255. doi:10.1007/s11051-012-1250-5
The Royal Society. (2011). Knowledge, Networks and Nations: Global Scientific Collaborations in the 21st Century, Royal Society Policy Document 03/2011 DES 2096. London: The Royal Society.
Tijssen, R. J. W., and van Leeuwen, T. (2006). “Centres of research excellence and science indicators. Can ‘excellence’ be captured in numbers,” in Ninth International Conference on Science and Technology Indicators, ed. W. Glänzel (Leuven: Katholieke Universiteit Leuven), 146–147.
Tijssen, R. J. W., Visser, M. S., and van Leeuwen, T. N. (2002). Benchmarking international scientific excellence: are highly cited research papers an appropriate frame of reference? Scientometrics 54, 381–397. doi:10.1023/A:1016082432660
Vinkler, P. (2010). Indicators are the essence of Scientometrics and Bibliometrics. Scientometrics 85, 861–866. doi:10.1007/s11192-010-0159-y
Wagner, C. S., Brahmakulam, I., Jackson, B., Wong, A., and Yoda, T. (2001). Science and Technology Collaboration: Building Capacities in Developing Countries. Santa Monica, CA: RAND.
Wagner, C. S., and Leydesdorff, L. (2005). Network structure, self-organization, and the growth of international collaboration in science. Res. Policy 34, 1608–1618. doi:10.1016/j.respol.2005.08.002
Wagner, C. S., Park, H. W., and Leydesdorff, L. (2015). The continuing growth of global cooperation networks in research: a conundrum for national governments. PLoS ONE 10:e0131816. doi:10.1371/journal.pone.0131816
Keywords: scholarly metrics, research assessment, leadership, scientific collaboration, nanoscience and nanotechnology, normalized citation impact, scientific excellence, scientometrics
Citation: Chinchilla-Rodríguez Z, Ocaña-Rosa K and Vargas-Quesada B (2016) How to Combine Research Guarantor and Collaboration Patterns to Measure Scientific Performance of Countries in Scientific Fields: Nanoscience and Nanotechnology as a Case Study. Front. Res. Metr. Anal. 1:2. doi: 10.3389/frma.2016.00002
Received: 23 February 2016; Accepted: 07 July 2016;
Published: 29 July 2016
Edited by:
Ping Zhou, Zhejiang University, ChinaReviewed by:
Saeed-Ul Hassan, Information Technology University, PakistanLi Tang, Fudan University, China
Copyright: © 2016 Chinchilla-Rodríguez, Ocaña-Rosa and Vargas-Quesada. This is an open-access article distributed under the terms of the Creative Commons Attribution License (CC BY). The use, distribution or reproduction in other forums is permitted, provided the original author(s) or licensor are credited and that the original publication in this journal is cited, in accordance with accepted academic practice. No use, distribution or reproduction is permitted which does not comply with these terms.
*Correspondence: Zaida Chinchilla-Rodríguez, emFpZGEuY2hpbmNoaWxsYUBjc2ljLmVz