 Stephan Stahlschmidt
 Sybille Hinze
- German Centre for Higher Education Research and Science Studies, Berlin, Germany
National bibliometric performance is commonly measured via relative impact indicators which appraise absolute national values through a global environment. Consequently the resulting impact values mirror changes in the national performance as well as in its embedding. In order to assess the importance of the environment in this ratio, we analyse the increase in Chinese publications as an example for a structural change altering the publication universe. Via a counterfactual comparison we observe how Chinese publications differ in their citation-based relevance attribution by benefiting especially Asian countries, while scientifically leading countries in the West gain less than postulated by the former status quo. Due to the substantial quantity of Chinese publications this differentiation in relevance attribution imposes globally noticeable effects on national impact statistics. We argue that such structural changes in the environment have to be taken into account for an unbiased measurement of national bibliometric performance.
China as a Non-Marginal Influence on Bibliometric Indicators
Since 2006 China counts as the second biggest single “producer” of publications trailing only the USA and increasingly competes for the space in Web of Science indexed journals. This growth and subsequent influence of Chinese publications is too extensive to be considered marginal, but affects the whole database. Furthermore its is stimulated by economic growth and political factors (Zhou and Leydesdorff, 2016) rendering it an external influence on the science system. Consequently the question arises, how this unprecedented growth of contributions from a single country with its specific bibliometric characteristics affects the whole bibliometric measurement process.
The leverage of Chinese publications on non-Chinese ones is facilitated by the relative nature of the commonly applied impact indicators. The mean normalized citation score (Waltman et al., 2011) or the share of highly cited papers (Waltman and Schreiber, 2013) are relative indicators relating absolute values of a particular country to the whole publication universe. Consequently they mirror changes on both sides, the national one expressed in the numerator, as well as changes in the global environment summed up in the denominator. However common understanding relates any observed changes in the impact value to the country, the numerator, and not to its environment, the denominator.
We argue that the changes to the global environment need to be taken into account in the discussion more extensively and thus analyse the Chinese publication increase as an example of the dynamics governing the evolution of the database. Effects on national impact indicators and the underlying mechanism are empirically analyzed and related back to the Chinese publication increase. It is shown how the denominator influences the observed values.
While former work on the rise of Chinese publications is often concerned with describing the impact of the Chinese appearance at the forefront of scientific publications, e.g., country shares of publications and citations (Leydesdorff and Wagner, 2009; Bornmann and Leydesdorff, 2013; Côté et al., 2016) or relating these bibliometric measures with socio-economic data (May, 1997), we are more interested in the measurement issues that arise implied by the growth of Chinese publications. Consequently we will contrast the just described state of the universe of scientific publications with a counterfactual bibliometric universe without China. We analyse how developed countries would have performed under supposedly stable conditions and compare this counterfactual outcome with the actual one to deduce the effect Chinese publications exhibit on other countries.
This research comprises several implications for policy setting agents. We like to answer, to what extent the observed increase in bibliometric impact measures in the developed world might ultimately be assigned to country specific science programmes and policies and to what extent the improvement denotes an artificial measurement artifact caused by a dynamic environment and, respectively, the way the indicators are constructed which are used to reflect a country's scientific performance.
The upper panels in Figure 11 illustrate the growth of national scientific contributions in the Web of Science over the last 20 years. While the USA and the combined EU15 countries clearly dominate in this measure of productivity, China has observed a tremendous growth in its publication output. While still going along with its BRICS companions in 1995, it surpassed them in the year 2000 and all other countries apart from the USA 6 years later in 2006. Since then its growth has not slowed down, but constantly exceeds all other BRICS and OECD countries.
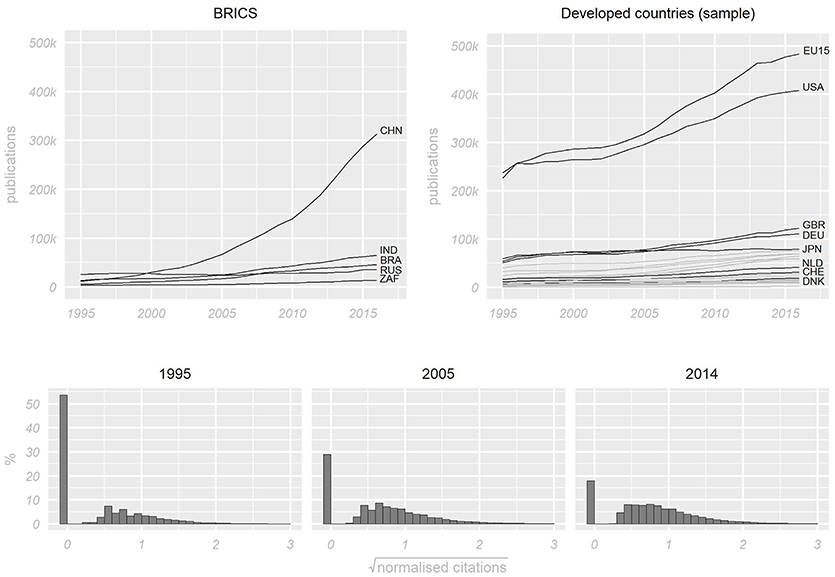
Figure 1. (Upper left panel) Growth of national publications among BRICS countries; (Upper right panel) national publication growth of a sample of OECD countries; (Lower panel) yearly histograms of the normalized citations for Chinese publications (Data is truncated in the upper tail).
However the observed exponential growth of Chinese publications might affect bibliometric impact measures only if its citation characteristics differs from the worldwide citation distribution. If not, the Chinese publications only add further publications to the corpus of scientific publications allowing for more precision in the measurement process.
Figure 1 depicts in the lower panel the citation distribution of Chinese publications, i.e., the year and subject field specific normalized citations of every Chinese article or review appearing in a Web of Science indexed journal based on a 3-year citation window. According to this illustration China has come a long way starting with median of 0 in 1995 to surpassing 0.5 in 2014. At the same time the 10% best Chinese publications achieved a normalized citation value of at least 1.5 in 1995, respectively, 2.4 in 2014.
But Chinese publications do not only differ on the cited side from global averages, but also on the citing side. Chinese publications include up to 50% longer reference lists which subsequently result in changes to the globally applied discipline specific citation statistics. More importantly its citations focus especially on Asian countries, and thus, resulting in higher impact values. Scientifically leading countries benefit and lose at the same time from the changing citation-based relevance attribution: They do obtain higher impact values but less so than postulated by their former standing. Consequently we argue that due to their size and bibliometric characteristics Chinese publications wield a non-marginal influence on the publication universe and alter the reference points of any national impact evaluation. Hence the observed changes in national impact values over time might not only describe the nationl performance alone, but also structural changes in the environment applied to measure the national performance.
The next section will explain the applied methodology of constructing a counterfactual bibliometric world without Chinese publications. Afterwards we will contrast this counterfactual setting with the actual one to observe and explain the effects Chinese publications exhibit. In the subsequent discussion we present a notional outlook and comment on the wider implications. Conclusions are drawn in the last section.
A Counterfactual Bibliometric World Without China
Our analysis is based on the Web of Science Core Collection (SCIE, SSCI, AHCI) raw data2. Only publications of the document types articles and reviews are considered, as these constitute the primary communication device for new findings in most disciplines.
The coverage of the citing side, presenting the reception of the aforementioned articles and reviews, poses no such restriction on the document type and includes furthermore also the Conference Proceedings Citation Indices (CPCI-S and CPCI-SSH). Self-citations are understood to largely represent an essential part of scientific communication and are consequently included in the analysis. Citations to or from non-source items out of the scope of the Web of Science core collection are omitted.
In order to cover the apparent start of the rise of Chinese publications in the late 1990s we commence our analysis in 1995 and extend it to the most recent data. Allowing for a 3-year citation window we report on impact indicators for publications up to 2014 thus incorporating citations from up to 2016. These citations are normalized by publication year and discipline of the cited publication. For the latter we employ the 252 Web of Science Subject Categories.
Apart from citation links the Web of Science also includes author affiliation data. The country level affiliation information has been used to identify Chinese publications in the Web of Science publication universe. While authorship of scientific papers, and especially the individual contributions of the listed authors to a paper, are widely discussed in the literature (Biagioli and Galison, 2003), we build our analysis upon the classical assumption, that any listed author has contributed an essential part to the paper. Applying this reasoning to the definition of Chinese publications, we assign any publication to the set of Chinese publications if at least one listed author is affiliated with a Chinese institution. While the contributions of all other co-authors without a Chinese affiliation is thererby striped of their institutional origins, the potential meassurement error introduced by this approach might substantially be lowered by noting that many of these co-authors without a Chinese affiliation are actually of Chinese lineage (Wang et al., 2013) and consequently also embody the rising influence of China throughout the global science system. While this all-embracing strategy might be questioned and alternative delinations like requiring only Chinese affiliations or at least a Chinese affiliation for the first or corresponding author seem to be cogitable, we would like to argue that for our purpose these solutions would result instead in partial analyses without any clear path to generalization.
Based upon our definition of Chinese papers we quantify the effect of this ever increasing stock of Chinese publications on the bibliometric universe by inferring what would have happened without these Chinese publications. Consequently a counterfactual bibliometric world without Chinese publications is constructed and applied as a placeholder for a stable bibliometric environment unaffected by the rise of Chinese publications. Contrasting this counterfactual with the actual bibliometric universe allows for an assessment of the effect Chinese publications exhibit on the bibliometric universe.
This approach borrows from the treatment effect literature in Economics (Rubin, 1974; Imbens and Wooldridge, 2009), which itself builds upon John Stuart Mill's method of differences (Mill, 1843). Based upon observational data, treatment effects models infer if and how a treatment, an exogenous stimulus, causally affects a target audience. Ideally these models compare the same observational units with and without the stimulus on some outcome variable and declare any difference in the output to denote a causal effect of the treatment. Obviously any unit can either be exposed or not be exposed to the treatment and a direct comparison on the same unit is infeasible (Holland, 1986). Consequently treatment effects models apply carefully constructed substitute comparisons exploiting the untreated units of the population. However, as the Chinese publications affect the whole Web of Science publications universe and every country enlisted, no unaffected units are available, but have to be constructed artificially.
In doing so, we exclude the aforementioned set of Chinese publications from the cited and citing side of the Web of Science publication universe and recount the citations from source items to the remaining non-Chinese publications. Afterwards these counts are applied to recompute the Web of Science Subject Categories based expected counts (Waltman et al., 2011) and 90% quantile thresholds (Waltman and Schreiber, 2013). In the resulting counterfactual bibliometric setting we subsequently compare each non-Chinese publication to these counterfactual statistics to obtain national impact indicators.
Finally these averaged values are contrasted with the actual national values for country i via
where Impact denotes either the national Mean Normalized Citation Score (MNCS) or the national share of the 10% most cited publications [PP(top10)]. As the two bibliometric worlds differ only in the Chinese publications ΔImpact(i) quantifies how national bibliometric impact indicators are affected by Chinese publications.
This comparison between the actual and counterfactual impact indicators is facilitated by the particular nature of the indicators, as they evaluate publications by comparing the respective citation counts with citations in a pre-determined environment. Consequently the resulting absolute decline in publications and citations imposed by the exclusion of Chinese publication might potentially affect both the publication specific count of obtained citations and the discipline specific citation statistics like expected citations or the PP(top10) thresholds. However, these level shifts do not inhibit the aforementioned comparison if we assume that the actual and counterfactual worlds truthfully describe the complete national publication output in the respective settings. Consequently any difference between the actual and counterfactual national impact indicators results solely from the change in the environment driven by Chinese publications.
This reasoning highlights a fundamental condition of our approach, namely such counterfactual analysis seems only feasible on a macro level. The increasing share of Chinese publications in the publication universe and the therein stated set of knowledge renders the identification of counterfactual actions by individual scientists infeasible and consequently the counterfactual state of single publications cannot be deduced. However, the not unusual case of parallel discoveries of important findings probably result in a comparable albeit potentially smaller knowledge set in the counterfactual world. Furthermore national contributions to this knowledge set seem to be underpinned by robust steady trends. Hence, we assume that national impact indicators in the counterfactual world do depict a realistic picture on a macro scale. Still the constructed counterfactual bibliometric world does not constitute a perfectly known alternative setting but rather expresses a Gedankenexperiement—a thought experiment—which helps to understand the mechanism driving the evolution of the database and the resulting consequences for national impact indicators.
Comparing the Counterfactual With the Actual Bibliometric World
Having processed the counterfactual bibliometric world we may apply Equation (1) to observe the effect on a national level. The upper left panel in Figure 2 exhibits the evolution of national MNCS for selected OECD countries3 in the upper left panel in Figure 2. In general the MNCS is steadily improving for nearly all listed countries with the notable exceptions of the USA and Japan. Three small European countries lead and are trailed by Great Britain as the first of a group of larger countries including Germany and France. The included Asian countries perform less well on this measure, while the big Oceanian countries line up with their European counterparts.
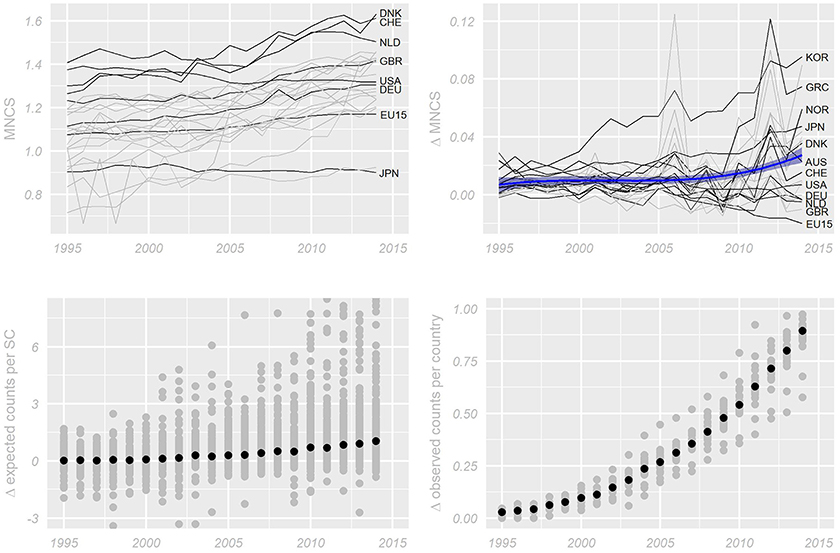
Figure 2. (Upper left panel) Actual national MNCS values; (Upper right panel) changes in MNCS; (Lower left panel) differences in expected counts; (Lower right panel) differences in observed citations.
The top right panel in Figure 2 shows the effect China exhibits on these national MNCS as it illustrates the resulting differences ΔMNCS(i) of Equation (1). Every line represents a single country i, while the blue line represents an average of these national values accompanied by a confidence interval. As most values and especially the average values are positive we conclude that the MNCS values of the listed countries benefit from the Chinese publications. That is independent of their own performance these countries obtain larger MNCS values due to the inclusion of Chinese publications in the publication universe. This effect, albeit rather small in the beginning, increases over time and affects the individual countries to a varying degree. Indeed the yearly variance of ΔMNCS(i) over i increases as time proceeds.
While the observed effect is enlightening in itself, we are especially interested in understanding how this effect accrues in the first place. The model alone does not reveal, how the final effects arise, due to its rather flexible approach with a minimum of imposed parametric modeling structure. The comparison of the actual and counterfactual bibliometric world mirrors a black box method and the underlying mechanism has to be revealed via suitable descriptive statistics.
Therefore we compare the expected and obtained citations between the actual and counterfactual setting as these values drive the MNCS of country i with publications j ∈ {1, …, J} via
for each year. An increase in obtained citations and an decrease in expected citation will independently result in a rise of the national MNCS. Obviously Chinese publications might affect both citations counts, as they might cite publications of other countries whereby increasing the citation count of non-Chinese publications. Furthermore any citation in the closed world of the Web of Science publication universe, and independently of its national origin, affects the overall citation count expressed in the yearly, Subject Categories-specific expected citation counts.
The lower left panel of Figure 2 compares the expected counts EC between the actual and counterfactual bibliometric world. Every gray dot denotes a difference ΔEC(h) in the h ∈ {1, …, 252} Subject Categories:
The black dot marks the mean difference among all Subject Categories. While in the beginning of the observation period no effect seems recognizable, this changes in later years as the ΔEC gradually increase in size and finally nearly all differences are positive. Hence the exclusion of Chinese publications lowers the overall expected counts or, the other way round, the inclusion of Chinese publications increases the overall standard of expected citations.
Having observed an increase in national MNCS and expected citation counts due to the Chinese publications, Equation (2) postulates also an increase in obtained citations. Indeed this increase in obtained citations must surpass the increase in expected counts for Equation (2) to hold. Accordingly the lower right panel in Figure 2 presents the average publication-level differences in obtained citations OC for every publication j of country i:
While the additional obtained citations in the beginning seem negligible, ΔOC(i) clearly growths over time for all countries to increasingly different degrees.
While this observation of increasing obtained citations validates Equation (2), these changes only represent empirical symptoms of the underlying mechanisms. In order to analyse these underlying implications of the increase in Chinese publications we start with a highly stylized bibliometric toy model. In detail we omit for a moment any citations across time or disciplines and any influence non-source items might have. In such a perfectly encapsulated setting citations are distributed as a zero-sum game from reference lists and the expected citation count equals the average reference list length. Consequently any expansion in terms of additional publications might only increase (decrease) the expected citation counts if the these additional publications include more (less) than usual references. Furthermore if citations were to be split up in fractions, a country with a longer than usual reference lists could enter neutrally in the database without distorting it. Therefore every country would need to be compensated the exact amount of citations necessary to keep the same MNCS value, although the expected citation counts rise due to the longer reference list. The remaining citations from the additional reference lists would be allocated to the newly entering country itself and would perfectly match the new expected counts leaving that country with a MNCS value of 1. This mechanism mirrors the (neo-)classical economic theory, that printing money does not affect the economy, but only leads to uniform price increases.
In order to illustrate this point we depict the counterfactual reference list lengths and counterfactual expected citation counts for all Web of Science Subject Categoris in the year 2014 in the upper left panel of Figure 3. As indicated by the toy model a profound positive relation might be indentified in which longer reference lists are accompanied by higher expected citation counts. However this influence of the reference list length on the expected citation count is obscured by the frequent citation links across time and the less frequent citation links across disciplines. Furthermore the aforementioned enlarged base of citing publications interferes in the direct relation between reference list lengths and expected citation counts. Summing up Chinese publications may only affect expected citation counts if they differ in reference list length, citation links over time, citation links across disciplines or non-source items.
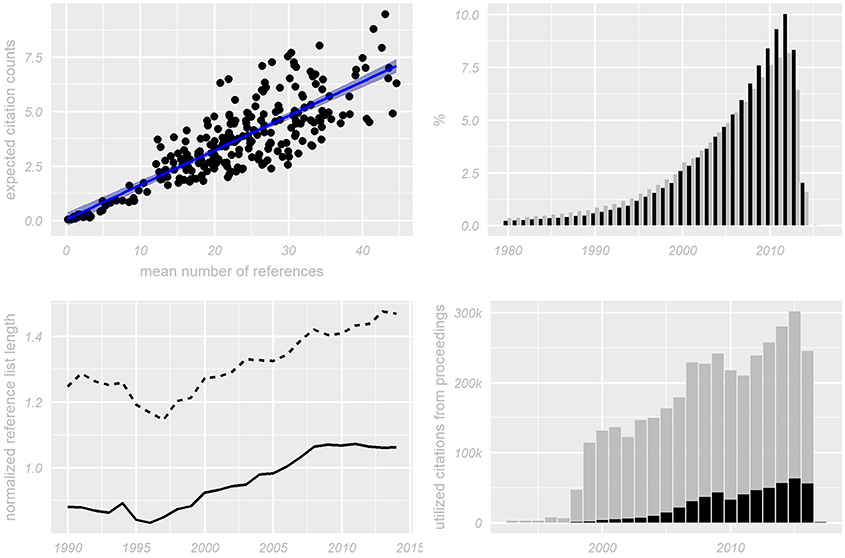
Figure 3. (Upper left panel) Scatterplot of Subject Categories concerning their average reference list length and expected citation counts in 2014; (Lower left panel) normalized length of Chinese reference lists (solid line) and normalized length of Chinese reference lists utilized in citation window (dashed line); (Upper right panel) distribution of cited article over time from citing articles from 2014; (Lower right panel) stacked yearly count of utilized citations from non-standard document types. Besides upper left panel Chinese values are depicted in black, while gray values denote the sample-based, non-Chinese equivalents.
The solid lines in the lower left panel of Figure 3 depicts the average of normalized reference list lengths of Chinese publications for the last 25 years. We normalize Chinese reference lists on their worldwide non-Chinese counterparts as countries differ in their disciplinary focus (European Commission, 1997) while concurrently disciplines can be distiniguished by their reference behavior foiling a comparison on absolute values. According to the graph Chinese reference lists have been shorter than the global average in the beginning of the observation period. A substantial growth started in the end of the 1990s which apparently stopped again 10 years later. Still ever since 2006 the average normalized Chinese reference list has exceeded the world average. Hence the observed increase in expected citation counts is at least since 2006 influenced by the Chinese reference lists.
However the observed increase in expected citation counts begins much earlier and must therefore partly be explained by the other interfering factors. As an increase in expected citation counts can be observed uniformly across all Subject Categories, Chinese publication seem unlikely to differ strongly in their use of citations across disciplines. Contrary citations crossing time periods are common and the varying time focus of Chinese and non-Chinese publications can exemplarily be observed for citing publications from 2014 in the top right panel of Figure 3. Chinese publications focus much stronger on more recent publications, as their share of references to publications from 2007 to 2014 surpasses the non-Chinese shares and trails them for all preceding years.
At the same time the applied 3-year citation window curtails the count of relevant citations to publications not older than 2 years and consequently favors the Chinese focus on more recent literature. Accordingly the dashed line in the lower left panel in Figure 3 depicts the same comparison of reference list length as before but restricts the count to cited publication within the 3-year citation window. Comparing the two lines it can be observed that Chinese reference lists exceed the non-Chinese ones in terms of citations utilized via the citation window for the whole observation period. Most recently Chinese publications include nearly 50% more utilized citations and raise the global expected citation counts accordingly.
A further, more technical explanation of the increase in expected citation counts stems from our particular definition of the citing side. While our analysis restricts the cited side to articles and reviews the citing side includes also other document types including proceedings papers. The lower right panel in Figure 3 depicts the number of additional Chinese citations utilized in our citation counts stemming from this extended definition of the citing side. While comparably small in size a substantial growth in these citations can be identified. Hence the expected citation counts rise as the set of citations from these non-standard document types also includes a growing share of Chinese items.
In general any country will benefit from Chinese publications if the additional citations received will outweigh the rise in the expected counts driven by the longer reference lists. In that case the increasing number of Chinese papers do not enter neutrally into the database by adopting the common standards of citation-based relevance attribution, but emphasize their own diverging perspective on relevance, which favors certain countries. Two factors might influence to what extend other countries will receive additional citations from Chinese publications. First an outward looking China, which cites foreign papers relatively more often than national publications. In this case Chinese publications do not only have to keep up with the expected counts set by other countries but also suffers from the self-imposed increase in those standards. Second a deviant allocation of citations among countries, where certain countries obtain relatively more citations from Chinese publications than postulated by the former global practise on citation-based relevance attribution.
Figure 4 depicts the distribution of shares of references to Chinese publications by Chinese publications, i.e., the distribution of national self-citations on the level of publications. Interestingly the distribution includes several peaks at 100, 66, 50, and 33%, which are vanishing as times goes by and cause the upper tail of the distribution to shrink. The lower tail of the distribution does not feature any level shift, but stays constant. Comparing the distribution of 1995 and 2014 the lower 10, 25, and 50% quantile remain at the same low level of 7, 13, and 24% of national self citations, while the 75 and 90% quantile diminish substantially by up to 20 percentage points to 40%, respectively, 55%. Consequently other nations receive a large share of Chinese citations driving their count of obtained citations.
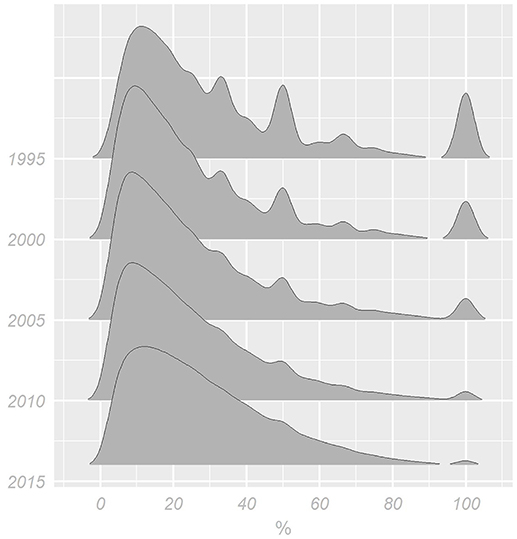
Figure 4. Share of Chinese national self-citations.
Next we analyse how those outward citations from Chinese publications are distributed among countries. If Chinese publications were to adopt the common citation practise, we would expect a positive relation between a country's global scientific impact without China and the additional citations received from Chinese publications. To illustrate this point Figure 5 graphically relates for the years 2006, 2010, and 2014 the counterfactual MNCS (x-axis) with (1) the individually received additional citations from Chinese publications, i.e., the average number of additional citations per paper once it is cited (y-axis), (2) the share of national publications being cited by Chinese publications (point size) and (3) the national share of papers co-authored with China (point color). Jointly these measures describe the scale and intensity of Chinese citations received by other countries
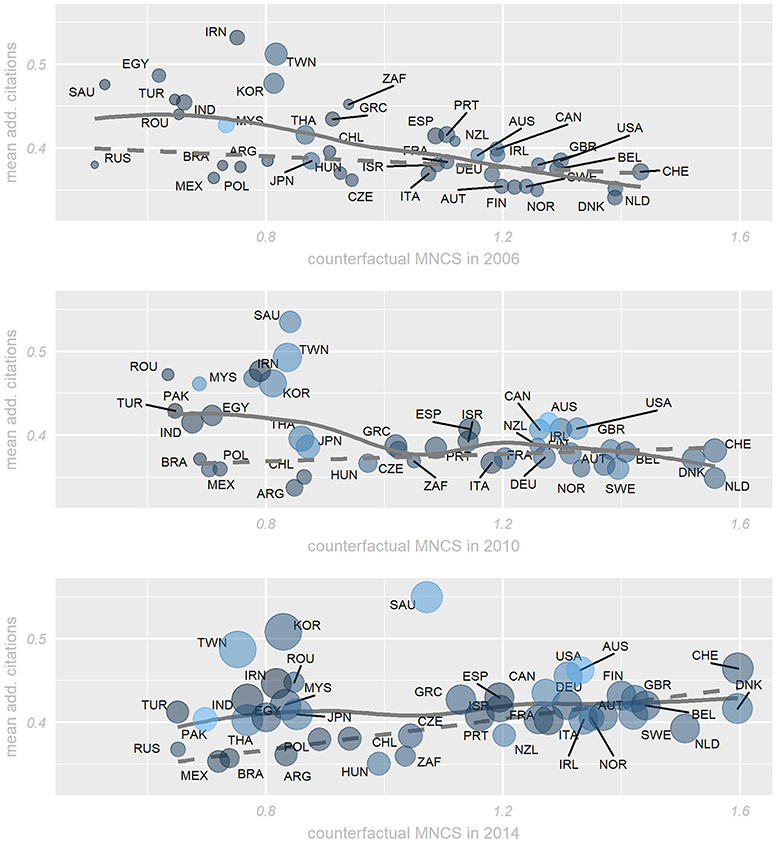
Figure 5. National difference between counterfactual national impact and average, normalized, additional citations from China in 2006, 2010, and 2014 with linear correlation line for non-Asian countries and non-linear relation for all countries receiving more than 1,500 citations. Point size indicates the share of national publications becoming cited by China, while a more pale color illustrates a higher national share of co-authored papers with China. Singapore is not shown.
Comparing the three graphs we note at first the growth in point size between 2006 and 2014, i.e., the increase in the national share of papers being cited by Chinese publications. This observation, caused by the rising number of Chinese publications in Figure 1, explains the increasing effect size and increasing variance in ΔMNCS in Figure 2. For 2006 (upper panel) we observe a negative relation between the counterfactual scientific impact and additional citations from Chinese publications (non-linear blue line with Spearman correlation of −0.6). This contradiction to the reasoning above is especially driven by Asian countries, but even without them a negative relation persists (linear dashed black line with Spearman correaltion of −0.4). Consequently in 2006 scientifically leading countries benefit in absolute and relative terms less from additional citations than Asian countries.
In 2010 this negative relation is reversed to a positive one for Non-Asian countries, while in 2014 we also observe an overall positive relation (Spearman correlation: 0.2) between the counterfactual scientific impact and the additional citations from Chinese publications. In absolute terms scientifically leading countries, as indicated by their MNCS, find themselfs on average on a par with Asian countries concerning additional citations, while non-leading, non-Asian countries lag both groups causing the expected positive relation. Furthermore, and contrary to the observation of no effect in 2006, in 2014 we also observe a substantial positive realtion (Spearman correlation: 0.6) between the additional citations per paper and the share of cited papers. i.e., countries benefiting from additional citations for every cited paper also gain via a higher share of their papers beeing cited by Chinese publications.
In general terms citations from Chinese publication seemed to contradict the MNCS-based scientific impact ranking of countries in 2006, but have nowadays slowly adapted to the globally established common standard. Still a persisting and pronounced focus on Asian countries by Chinese publications enhances national impact statistics in Asia disproportionately to the measured impact without those citations and shifts the globally measured scientific relevance toward the East. Scientifically leading Western countries are consequently at the same time beneficiaries and loser of this changed focus. They are on average positively affected in terms of ΔMNCS, but they only nowadays receive comparable amounts of additional citations from Chinese publications as several Asian countries. Although, according to their counterfactual scientific impact their share of the additional citations from Chinese papers should surpass the Asian counterparts.
But apart from this macro observation, also single countries differ steadily from their peers explaing the variation observed in ΔMNCS and ΔHC in Figures 2, 7. Graphically this might be observed via the country specific residuals from the average trend lines. For example the recent rise of Korea and Taiwan might partially be explained by the beneficial citations from Chinese publications, while among the scientifically leading countries a focus by Chinese publication on North America and some more peripheric countries also causes structural differentiation among this group of countries.
Finally we examine how the increase in expected and obtained citations vary, as according to Equation (2) the MNCS and the expected citation count might only jointly rise, if the growth in obtained citations exceeds the growth in expected citations. Hence for any country with a positive ΔMNCS the ratio of counterfactual obtained citations to actual obtained citations must be smaller than the same ratio for expected citation counts, as the increase in additional citations from Chinese publications must surpass the general increase in expected citation counts.
Such a ratio of ratios may also be derived from comparing the normalized citations NCi = OCi/ECi in both settings for some non–Chinese publication i:
However a direct comparison of ΔMNCS and Equation (3) is complicated by the fact, that the former compares the actual with the counterfactual observation in the end at a macro level, while the later conducts this comparison already in the beginning at the micro level of single publications.
While Equation (3) might be larger than one for some publications, it needs to be smaller for an essential share of the national publications if the corresponding ΔMNCS is to be positive. Figure 6 depicts the country average of this publication level ratio of ratios for the aforementioned set of developed OECD countries as gray points, while the black point depicts the average over these countries. It might be noted that the ratio is on average indeed smaller than one for all aforementioned developed countries in the observation period. Consequently the number of additional citations received by these countries exceeds in general the rise in expected citation counts and their observed positive ΔMNCS rests upon this mechanism.
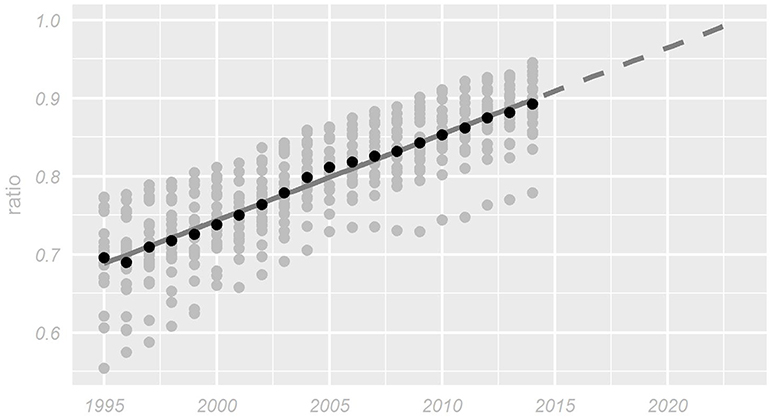
Figure 6. Ratio of counterfactual and factual MNCS per country (gray points), annual mean ratio (black point) and linear extrapolation.
Outlook and Implications
Having observed the underlying mechanism, we may also ask, what will happen if the primary conditions change. The developed countries will observe a negative ΔMNCS if the formerly mentioned factors currently driving the increase in MNCS turn around. Any country not receiving citations from Chinese publications will decrease in their measured performance due to the increase in the expected counts. Furthermore a rising share of Chinese national self citations, currently unobserved in Figure 4, or an improved reception of Chinese publication by third countries, as indirectly, but increasingly observed in the lower panel of Figure 1, will leave an insufficient number of citations for other countries to compensate for the increase in expected citations. Consequently everyone's but China's MNCS will decrease although the respective publication output might stay constant but is unfavorably valued due to the changing environment of these publications.
In this respect Figure 6 not only shows the more pronounced difference in observed citations than in expected citations between the actual and counterfactual setting, but also highlights how this gap reduces over time letting the ratio converge to 1. A simple linear time series model of the average values seem to describe a not unreasonable fit and might be employed to tentatively extrapolate from the observation period. Other things being equal, this admittedly crude outlook predicts the turning point of the currently still positive effect of Chinese publications on developed countries' MNCS to occur in the not so far future.
This reasoning is also maintained by looking at the effect Chinese publications carry on the PP(top10) indicator. While the left panel in Figure 7 illustrates the share of highly cited publications of the aforementioned OECD countries and does not deviate strongly from its MNCS-based equivalent, the right panel describes, likewise to the upper right panel in Figure 2, the additional share received by these countries via the inclusion of Chinese publications. Although we will not describe the underlying mechanism in detail, relying not only on absolute citations, but also the skewness of their distribution, it might be observed that the average effect curve is of parabolic shape with a maximum around 2005. Consequently the mean effect of Chinese publications on the PP(top10) values of developed countries is already declining and the confidence interval of the average effect in 2014 touches the zero line of no effect. In this regard we would expect developed countries to observe in the future at first a decline in PP(top10) shares followed by a subsequent drop in MNCS values.
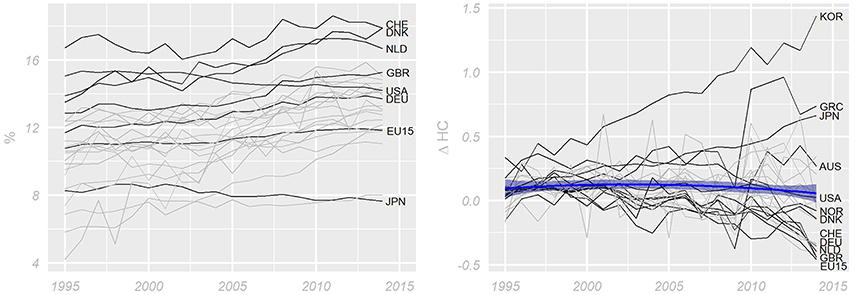
Figure 7. (Left panel) National shares of highly cited publications; (Right panel) according changes due to the increase in Chinese publications.
However, up to which point we might actually observe this uniform decline among developed countries is not only driven by the increasing variance of ΔMNCS and ΔPP(top10), but also by other interfering factors. The evolution of the Web of Science publication universe is affected by several internal and external influences of which the Chinese publication increase only denotes one, albeit at least for the time being most identifiable, effect. Other substantive changes like the increasing number of multi-author publications (Glänzel, 2001), the inclusion of new journals into the database (Basu, 2010; Schneider et al., 2017) or the more recent open science movement (Nielsen, 2012) all influence the setting in which a national publication output is bibliometrically evaluated.
Consequently national bibliometric impact measures like the MNCS and the PP(top10) indicators not only mirror the national performance on its own, but also profound changes in the global environment. While every publication on its own might be understood as a change in the environment, most of these influences are too small to actually alter the course of the database. Some of these influences on the environment, however, are pronounced enough to affect the reference points of bibliometric evaluations and influence impact indicators. Especially as the non-marginal and still increasing number of Chinese publications do not enter neutrally into the publication corpus adopting the common citation practises, but differ in length of reference list and especially in their country focus of outward citations, we currently observe a global reshuffle of impact attribution. Scientific relevance and the subsequent impact as measured via citations are not objectively defined via an intrinsic value of each paper, but result from a diverse multitude of micro/author level citation decisions, which are aggregated to impact statistics. Globally measured relevance assignments result from an indirect negotiation process between individually more or less diverging perspectives on relevance as stated in the reference lists. Every publication getting indexd in a bibliometric corpus defines to some degree the overall relevance, as every single reference is accepted as an equal and valid indication of relevance. Consequently as the share of Chinese publications increases and has already reached a globally perceivable level, while at the same time their inherent view on what is to be cited and henceforth relevant differs from the global practice, this combination becomes a powerful prerogative of global relevance attribution, where a potentially stable output on papers mets a modified demand function resulting in worldwide changes to national impact measures. Due to its reach such changes imposed by Chinese publications might be understood as structural and, as shown, not every country will benefit, if at all, to the same extent.
The tracking of national impact indicators on a macro level is also applied to detect changes in the impact caused by varying national funding schemes and has recently gained considerable attention (Schneider et al., 2016) and discussion (van den Besselaar et al., 2017). In light of the observed results of the Chinese publication increase and the enlisted set of further potentially structural changes in the database affecting countries to varying degrees, we like to note that the attribution of changes in the corresponding time series to national funding modifications seems to denote an especially daunting task. The upper right panel in Figure 2, as well the right panel of Figure 7 show the ΔMNCS, respectively, the ΔHC for the in the literature analyzed countries Australia and Norway. As detailed in Figure 5 both are clearly, if differently affected by the Chinese publication increase. Consequently it is far from obvious how an analyst might distinguish the effect caused by Chinese publications from a potentially concurrent effect driven by a modified funding scheme by analysing the time series alone. Resorting to a relative comparison of time series of several countries might also not help, as countries are not uniformly affected by the Chinese publication increase. Consequently most deliberately causal analyses apply comparisons between affected and unaffected entitites in order to gauge the effect (Butler, 2003). However, the Chinese publication increase does not affect all entities alike and consequently constitutes a confounding mechanism for any such comparison. Controlling this nuisance denotes a potential remedy, but its implementation in a research design might prove especially challenging, if feasible at all.
Conclusions
We have shown how the growth of Chinese publications alters the database and carries a non-marginal effect on other nations. Publications of these countries observe changes in the respective count of obtained citations and are confronted by higher expected citations counts due to the particular bibliometric characteristics of Chinese publications, namely longer reference lists and a non-confirmative perspective of whom to cite. Chinese publications differ in their citation-based relevance attribution and due to their quantity affect global impact statistics derived from citations. This reshuffle of relevance and consequently impact benefits at present especially Asian countries, while scientifically leading countries currently also gain, but less that postulated by the status quo. Indeed several scientifically leading countries are already or are prone to become negatively affected.
However, the reasons beyond statistics for this diverging perspective on relevance exhibited by Chinese publications is still to be investigated. To this end Figure 5 also exemplary highlights for every country the share of papers co-authored with a Chinese affiliation. While no effect might be identified in 2006, we observe a noteworthy Spearman correlation of 0.29 in 2014 between the mean additional citation from Chinese publications and the share of collaboration with Chinese affiliation(s), which becomes a substantial Spearman correlation of 0.41 once we exclude Asian countries. However, the share of national publications becoming cited by a Chinese publications is not affected by the share of collaborations with Chinese affiliation(s). Hence, the exact nature of the effect national collaborations with Chinese affiliation(s) imposes on national impact statistics remains unresolved. Furthermore other explanatory factors for the diverging relevance focus of Chinese publications like disciplinary country profiles needs to be investigated in detail to obtain a better understanding of the effects desribed so far.
Still the existence of this currently positive effect on many countries, its described origin, quantified consequences for bibliometric evaluation and list of further likewise interferences demonstrate that the publication universe finds itself in a constant state of flux. Consequently any relative measure of national impact resting upon this unsteady base informs on changes on both sides, the national as well as the global performance.
This ascertainment entails important consequences for the interpretation of national impact values, as the direct link between the national performance and the impact value is partially impaired by structural changes in the environment. Controlling these confounding mechanisms seems essential to an unbiased measurement of national bibliometric performance.
Author Contributions
SH and SS contributed conception and design of the study. SS performed the statistical analysis. SS wrote the first draft of the manuscript. All authors contributed to manuscript revision, read and approved the submitted version.
Funding
This work was supported by German Federal Ministry of Education and Research (Grant 01PQ13001 and 01PQ17001).
Conflict of Interest Statement
The authors declare that the research was conducted in the absence of any commercial or financial relationships that could be construed as a potential conflict of interest.
Footnotes
1. ^Interactive versions of several graphs can be found at http://bit.ly/2r8fV6j
2. ^Data is provided by the German Competence Centre for Bibiliometrics (http://bibliometrie.info/).
3. ^Countries shown in graph: Australia, Austria, Belgium, Canada, Denmark, Finland, France, Germany, Great Britain, Greece, Ireland, Israel, Italy, Japan, Luxemburg, Netherlands, Norway, New Zealand, Portugal, South Korea, Spain, Sweden, Switzerland, United States of America.
References
Basu, A. (2010). Does a Country's Scientific “Productivity” depend critically on the number of country journals indexed? Scientometrics 82, 507–516. doi: 10.1007/s11192-010-0186-8
Biagioli, M., and Galison, P. (eds.). (2003). Scientific Authorship: Credit and Intellectual Property in Science. New York, NY: Routledge.
Bornmann L., and Leydesdorff, L. (2013). Macro-indicators of citation impacts of six prolific countries: InCites data and the statistical significance of trends. PLoS ONE 8:e56768. doi: 10.1371/journal.pone.0056768
Butler, L. (2003). Explaining Australia's increased share of ISI publications – the effects of a funding formula based on publication counts. Res. Policy 32, 143–155. doi: 10.1016/S0048-7333(02)00007-0
Côté, G., Roberge, G., and Archambault, E. (2016). Bibliometrics and Patent Indicators for the Science and Engineering Indicators 2016. Available online at: http://www.science-metrix.com/sites/default/files/science-metrix/publications/science-metrix_comparison_of_2016_bibliometric_indicators_to_2014_indicators.pdf (accessed March 30, 2016).
European Commission (1997). Second European Report on S&T Indicators (REIST-2), EUR 17639. Luxembourg: European Commission.
Glänzel, W. (2001). Coauthorship patterns and trends in the sciences (1980–1998): a bibliometric study with implications for database indexing and search strategies. Library Trends 50, 461–473.
Holland, P. W. (1986). Statistics and causal inference. J. Am. Stat. Assoc. 81, 946–960. doi: 10.1080/01621459.1986.10478354
Imbens, G., and Wooldridge, J. (2009). Recent developments in the econometrics of program evaluation. J. Econ. Literat. 47, 5–86. doi: 10.1257/jel.47.1.5
Leydesdorff, L., and Wagner, C. (2009). Is the United States losing ground in science? A global perspective on the world science system. Scientometrics 78, 23–26. doi: 10.1007/s11192-008-1830-4
May, R. M. (1997). The scientific wealth of nations. Science 275, 793–796. doi: 10.1126/science.275.5301.793
Mill, J. S. (1843). System of Logic, Ratiocinative and Inductive, Being a Connected View of the Principles of Evidence, and the Methods of Scientific Investigation. London: John W. Parker.
Nielsen, M. (2012). Reinventing Discovery: The New Era of Networked Science. Princeton, NJ: Princeton University Press.
Rubin, D. B. (1974). Estimating causal effects of treatments in randomized and nonrandomized studies. J. Educ. Psychol. 66, 688–701. doi: 10.1037/h0037350
Schneider, J. W., Aagaard, K., and Bloch, C. W. (2016). What happens when national research funding is linked to differentiated publication counts? A comparison of the Australian and Norwegian publication-based funding models. Res. Evaluat. 25, 244–256. doi: 10.1093/reseval/rvv036
Schneider, J. W., Aagaard, K., Visser, M., and van Leeuwen, T. (2017). “Examining potential database effects in longitudinal country impact analyses using fixed journal sets,” in Proceedings of the 22nd International Conference on Science, Technology and Innovation Indicators. Paris: ESIEE Paris.
van den Besselaar, P., Heyman, U., and Sandström, U. (2017). Perverse effects of output-based research funding? Butler's Australian case revisited. J. Infometr. 11, 905–918. doi: 10.1016/j.joi.2017.05.016
Waltman, L., and Schreiber, M. (2013). On the calculation of percentile-based bibliometric indicators. J. Amer. Soc. Inform. Sci. Technol. 64, 372–379. doi: 10.1002/asi.22775
Waltman, L., van Eck, N. J., van Leeuwen, T. N., Visser, M. N., and van Raan, A. (2011). Towards a new crown indicator: some theoretical considerations. J. Informetr. 5, 37–47. doi: 10.1016/j.joi.2010.08.001
Wang, X., Xu, S., Wang, Z., Peng, L., and Wang, C. (2013). International scientific collaboration of China: collaborating countries, institutions and individuals. Scientometrics 95, 885–894. doi: 10.1007/s11192-012-0877-4
Keywords: national bibliometric evaluation, China, dynamic publication universe, counterfactual analysis, bibliometric impact
Citation: Stahlschmidt S and Hinze S (2018) The Dynamically Changing Publication Universe as a Reference Point in National Impact Evaluation: A Counterfactual Case Study on the Chinese Publication Growth. Front. Res. Metr. Anal. 3:30. doi: 10.3389/frma.2018.00030
Received: 26 January 2018; Accepted: 27 August 2018;
Published: 09 October 2018.
Edited by:
Thed Van Leeuwen, Leiden University, NetherlandsReviewed by:
Aparna Basu, South Asian University, IndiaNicolás Robinson-Garcia, Universitat Politècnica de València, Spain
Copyright © 2018 Stahlschmidt and Hinze. This is an open-access article distributed under the terms of the Creative Commons Attribution License (CC BY). The use, distribution or reproduction in other forums is permitted, provided the original author(s) and the copyright owner(s) are credited and that the original publication in this journal is cited, in accordance with accepted academic practice. No use, distribution or reproduction is permitted which does not comply with these terms.
*Correspondence: Stephan Stahlschmidt, c3RhaGxzY2htaWR0QGR6aHcuZXU=