 Joseph Mariani
 Gil Francopoulo
 Patrick Paroubek
- 1LIMSI-CNRS, Université Paris-Saclay, Orsay, France
- 2Tagmatica, Paris, France
This paper introduces the NLP4NLP corpus, which contains articles published in 34 major conferences and journals in the field of speech and natural language processing over a period of 50 years (1965–2015), comprising 65,000 documents, gathering 50,000 authors, including 325,000 references and representing ~270 million words. Most of these publications are in English, some are in French, German, or Russian. Some are open access, others have been provided by the publishers. In order to constitute and analyze this corpus several tools have been used or developed. Many of them use Natural Language Processing methods that have been published in the corpus, hence its name. The paper presents the corpus and some findings regarding its content (evolution over time of the number of articles and authors, collaborations between authors, citations between papers and authors), in the context of a global or comparative analysis between sources. Numerous manual corrections were necessary, which demonstrated the importance of establishing standards for uniquely identifying authors, articles, or publications.
This work is composed of two parts, of which this is part I. Please read also part II (Mariani et al., 2018).
Introduction
Preliminary Remarks
The aim of this study was to investigate a specific research area, namely Natural Language Processing (NLP), through the related scientific publications, with a large amount of data and a set of tools, and to report various findings resulting from those investigations. The study was initiated by an invitation of the Interspeech 2013 conference organizers to look back at the conference content on the occasion of its twenty-fifth anniversary. It was then followed by similar invitations at other conferences, by adding new types of analyses and finally by extending the data to many conferences and journals over a long time period. We would like to provide elements that may help answering questions such as: What are the most innovative conferences and journals? What are the most pioneering and influential ones? How large is their scope? How are structured the corresponding communities? What is the effect of the language of a publication? Which paradigms appeared and disappeared over time? Were there any epistemological ruptures? Is there a way to identify weak signals of an emerging research trend? Can we guess what will come next? What were the merits of authors in terms of paper production and citation, collaboration activities and innovation? What is the use of Language Resources in research? Do authors plagiarize each other? Do they publish similar papers in the same or in different conferences and journals? The results of this study are presented in two companion papers. The present one introduces the corpus with various analyses: evolution over time of the number of papers and authors, including their distribution by gender, as well as collaboration among authors and citation patterns among authors and papers. In the second paper (Mariani et al., 2018), we will consider the evolution of research topics over time and identify the authors who introduced and mainly contributed to key innovative topics, the use of Language Resources over time and the reuse of papers and plagiarism within and across publications. We provide both global figures corresponding to the whole data and comparisons of the various conferences and journals among those various dimensions. The study uses Natural Language Processing methods that have been published in the corpus considered in the study, hence the name of the corpus. In addition to providing a revealing characterization of the speech and language processing community, the study also demonstrates the need for establishing a framework for unique identification of authors, papers and sources in order to facilitate this type of analysis, which presently requires a heavy manual checking.
Text Analytics of Scientific Papers
The application of text analytics to bodies of scientific papers has become an active area of research in recent years (see for example Li et al., 2006; Tang et al., 2008; Dunne et al., 2012; Osborne et al., 2013; Ding et al., 2014; Gollapalli and Li, 2015; Jha et al., 2016). For example, the Stanford Large Network Dataset Collection (SNAP)1 is a recently launched effort to study research networks by providing social networks and collaboration and citation graphs for conferences in Astrophysics, High Energy Physics, General Relativity and Condensed Matter. Studies of research publication data mine conference and workshop proceedings to determine trends in publications within a given area or field on various aspects, such as various kinds of collaboration networks, authors and papers citation graphs, author/topic pairings, topic shifts over time, authors and participants demographics, with the goal of better understanding research trends, collaborations, participation and publication data, etc. In the field of Speech and Natural Language Processing (SNLP), several studies of this type have recently been conducted, including the following:
• ACL Anthology2 (Bird et al., 2008) analysis (Radev et al., 2013), presented in several papers at the Association for Computational Linguistics (ACL) workshop entitled “Rediscovering 50 Years of Discoveries in Natural Language Processing” on the occasion of ACL's fiftieth anniversary in 20123. The workshop included the contributions of 23 authors through 13 papers (Banchs, 2012).
• Analysis of 25 years of research contained in the International Speech Communication Association (ISCA) Archive4 (assembled by Wolfgang Hess) published in proceedings of various conferences in the ISCA series [e.g., European Conference on Speech Technology (ECST), Eurospeech, International Conference on Spoken Language Processing (ICSLP), Interspeech] between 1987 and 2012 (Mariani et al., 2013).
• Analysis of the proceedings of the TALN conference organized yearly by the French ATALA (Association pour le Traitement Automatique des Langues) (Boudin, 2013)5.
• Results from the Saffron6 project, which performs automatic analysis of proceedings in the areas of Natural Language Processing [LREC, the ACL Anthology (ACL Annual Conferences, COLING, EACL, HLT, ANLP)], Information Retrieval [CLEF (Cross Language Evaluation Forum)], and the Semantic Web (Semantic Web Dog Food) and publishes its results as linked data (Bordea et al., 2014).
• Analysis of 15 years of research contained in the Language Resources and Evaluation Conference (LREC) proceedings between 1998 and 2012 (Mariani et al., 2014a) then 15 + 2 years, adding LREC 2014 (Mariani et al., 2016).
• Analysis of 20 years of research in Language Technology as published in the Language and Technology Conference (L&TC) from 1995 to 2015 (Mariani et al., 2015).
Studies of this kind can reveal patterns and shifts that may otherwise go unnoticed, and which can ultimately affect perceptions and practices in a given field. For example, an analysis conducted on publications from the IEEE ICASSP conference series between 1976 and 1990 (Mariani, 1990) showed that the percentage of papers on speech decreased over time, from about 50% in 1976 to 30% in 1990. Further analysis showed that the US produced most of the papers on speech (> 50%) within the conference, including on those years when the ICASSP conference took place outside the US; however at these conferences, the total participation increased, including a virtually undiminished level of US participation together with a dramatic increase in the number of European and Asian participants. As a result of this analysis, the speech community decided to begin organizing fully international conferences specifically devoted to spoken language processing, namely Eurospeech in Europe, starting in 1989 (Mariani, 2013), and ICSLP in Asia, starting in 1990 (Fujisaki, 2013).
The NLP4NLP Speech and Natural Language Processing Analysis
In order to conduct this study, we produced a corpus containing research papers on spoken and written language processing, called the NLP4NLP corpus, a name chosen to reflect the fact that the study uses NLP methods that are presented in papers contained in the corpus content itself (Francopoulo et al., 2015a,b). The NLP4NLP corpus contains papers from thirty-four conferences and journals on natural language processing (NLP) and spoken language processing (SLP) published over 50 years (1965–2015) (Table 1), thereby providing a good picture of research within the international SNLP community. However, we should stress the fact that many papers, including important papers, related to this field may have been published in other publications than those. We included material from conferences and journals only, as workshops may have widely varying ways of reviewing papers. For the conferences, we will call venue the event constituted by holding the conference. Conferences may have different frequencies. They may have annual venues, appear every 2 years on even years (this is the case usually for COLING, EACL, JEP, LREC) or on odd years (IJCNLP, L&TC, RANLP). They may also be organized jointly in the same year. For the journals, we will call issue a set of papers corresponding to a volume or to a year.
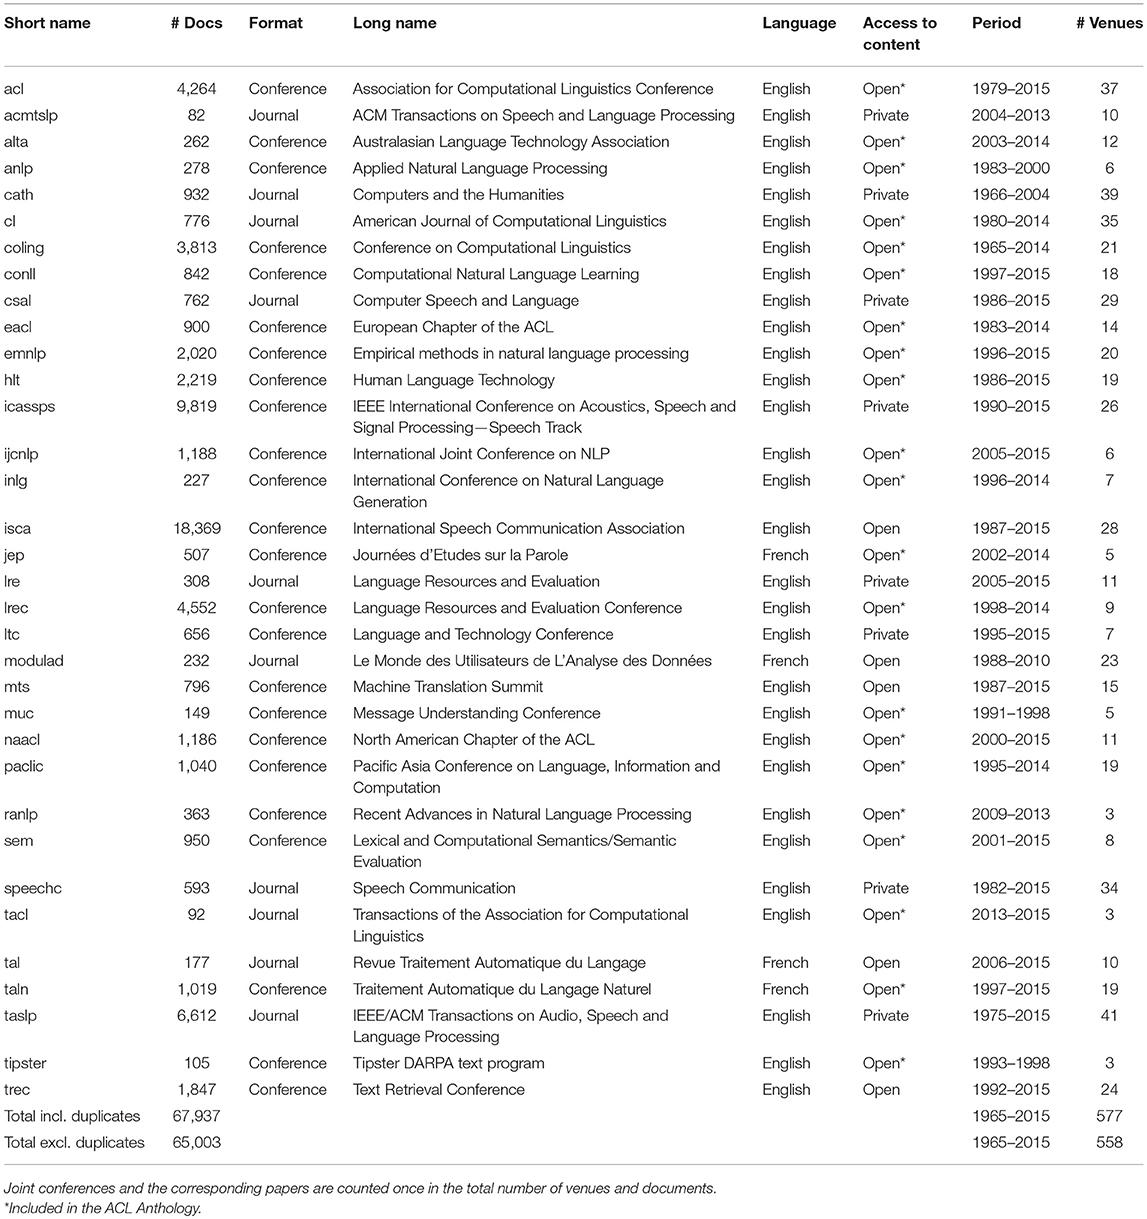
Table 1. The NLP4NLP Corpus of Conferences (24) and Journals (10).
In the present paper, we used the entire corpus to study collaboration among authors and citations of authors and papers in general, but also within each source, and from and to each source, as it gives an analysis on how the community related to each source considers and is being considered by its general scientific environment. A study of reuse and plagiarism within each source but also across sources has also been conducted and is presented in a companion paper.
In order to study the possible differences across different communities, we considered 3 different research areas, Speech, NLP, and Information Retrieval (IR), and we attached the sources to each of those areas (Table 2), given that some sources (LREC, LRE, L&TC, MTS) may be attached to several research domains. We see that the number of documents related to Speech is larger than the one related to NLP, and much larger than the one related to IR. We only considered the papers related to Speech processing (named ICASSPS) in the IEEE ICASSP conference, which also includes a large number of papers on Acoustics and Signal Processing in general.
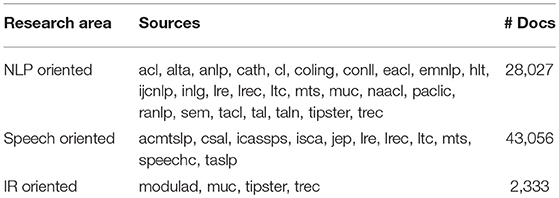
Table 2. Sources attached to each of the three research areas.
The number of venues, for the conferences, or issues, for the journals, may strongly vary (Figure 1), from 41 venues for the IEEE/ACM Transactions on Audio, Speech, and Language Processing, which changed its name over the years (initially Transactions on Acoustics, Speech and Signal Processing from 1974 to 1990, then Signal Processing until 1993, then Speech and Audio processing until 2006, then Audio, Speech, and Language Processing before merging in 2013 with the ACM Transactions on Speech and Language Processing) to 3 venues for Tipster, RANLP or the recently created Transactions of the ACL (TACL). The time span is also different, from 50 years for COLING to 3 years for the Transactions of the ACL (Figure 2).
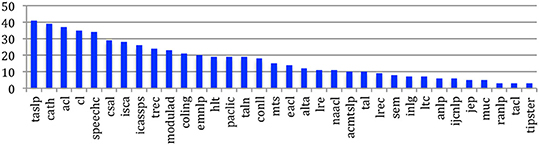
Figure 1. Number of venues or issues for each source.
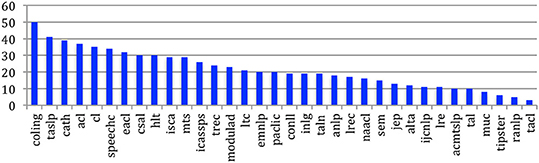
Figure 2. Time span for each source (years).
The number of papers across sources may therefore also strongly vary, from 18,369 for the ISCA conference series to 82 in the case of the ACM Transactions on Speech and Language Processing (ACMTLSP) (Figure 3).
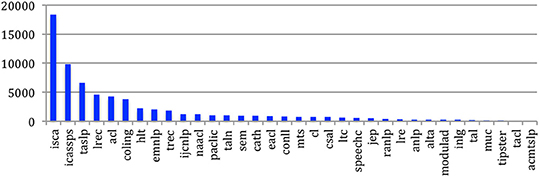
Figure 3. Number of documents for each source.
Global Analysis of the Conferences and Journals
As a convention, we refer to each conference or journal as a source and the conference or journal publication as a document. A paper or article corresponds to a document that may have been published in one or several conference series when presented at a joint conference. We refer to individual authors and mention their authorships, contributions, or signatures to a publication where they act as contributors. The same author may sign several papers at a given conference, as a single author or together with one or several co-authors.
Number of Sources Over the Years
As it appears in Table A1, the number of sources, including conferences and journals, globally increased over the year but seems now to be stabilizing at 34 (Figure 4).
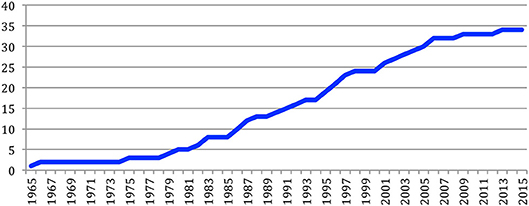
Figure 4. Cumulated number of different sources (conferences and journals) over the years.
However some conferences are biennial and other only occur from time to time. Some conferences as well as some journals also stopped. Therefore, the number of sources may fluctuate over the years (Figure 5), even if the total number globally increases. We took into account the sources we have access to. For example, ACL was founded in 1963 and the first ACL conference took place in 1965. However, we only had access to the content of the ACL conference, through the ACL Anthology, starting in 1979. The number of sources decreases on the last year that we take into account (2015), as some biennial conferences didn't take place on that year (e.g., Coling, LREC, EACL) and because some of the data was only available later in 2016.
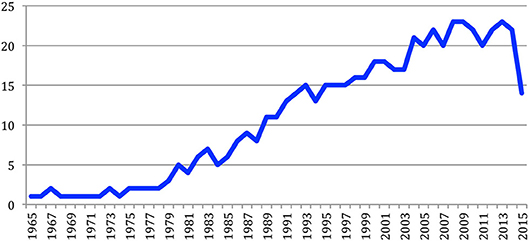
Figure 5. Number of sources (conferences and journals) considered each year.
Journals
The following journals have been considered: Computer and the Humanities (since 1966), IEEE Transactions on Acoustics, Speech and Signal Processing and the following titles (since 1975), Computational Linguistics (since 1980), Speech Communication (since 1982), Computer Speech and Language (since 1986), Modulad (since 1988), the ACM Transactions on Speech and Language Processing (since 2004), Language Resources and Evaluation and TAL (since 2006) and the Transactions of the ACL (since 2013). Most of those publications are in English, except TAL and Modulad that are mainly in French.
Conferences
The following conferences have been considered: Coling (since 1965), Conference of the ACL (since 1979), ANLP and EACL (since 1983), HLT (since 1986), the “ISCA” conference series (ECST, Eurospeech, Interspeech, ICSLP) and the MT Summit (since 1987), the part devoted to speech and language processing in the IEEE ICASSP conferences (since 1990), MUC (since 1991), TREC (since 1992), and TIPSTER (since 1993), L&TC and PACLIC (since 1995), EMNLP and INLG (since 1996), CONLL and TALN (since 1997), LREC (since 1998), NAACL and Semeval (since 2001), JEP (since 2002), ALTA (since 2003), IJCNLP (since 2005) and RANLP (since 2009). Most of those conferences are in English, except JEP and TALN that are mainly in French.
Documents
Over the years, 67,937 documents have been published in the 34 sources. However, this number comprises papers that were published at joint conferences. The total number of different papers thus reduces to 65,003 (Table 1), with a steady increase over time from 24 papers in 1965 to 3,314 in 2015 (Figure 6). The number of documents fluctuates over the years, mainly due to the biennial frequency of some conferences. The largest number of papers has been published in 2014 (3,817 papers).
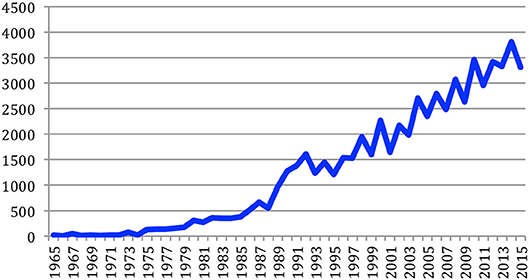
Figure 6. Number of papers each year.
The total number of papers itself still increases steadily at a high rate, reaching 65,003 different documents as of 2015 (Figure 7).
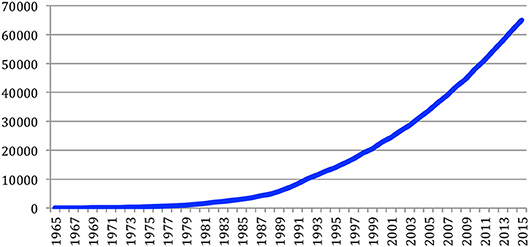
Figure 7. Cumulated number of papers over the years.
Data and Tools
Origin of Data
Most of the proceedings are freely available online on the ACL Anthology website, others are freely available in the ISCA Archive. The corresponding websites include metadata (list of authors and sessions, content of the sessions and, for each article, title, authors, affiliations, abstract, and bibliographic references) as well as the full content of the articles. IEEE ICASSP and TASLP have been obtained through the IEEE, and LRE through Springer, while their website also includes metadata (for each article, title, authors, affiliations, abstract, and bibliographic references). For this study, we only considered the papers written in English and French, but it should be stressed that the papers may contain examples in many different languages.
Extraction and Quality of Data
Most of the documents are available in PDF. Those that are only available as scanned images had to be transferred in a PDF format. In order to do so, a preprocessing was applied in a first step, to extract the textual content by means of PDFBox (Litchfield, 2005) and when the document consisted in a sequence of images, the Optical Character Recognizer (OCR) system Tesseract-OCR7 was called to produce a textual content.
A benchmark to estimate the error rate of the extracted content was established based on a simple heuristics, which is that “rubbish” character strings are not entries in lexicons. This estimation is computed as the number of unknown words divided by the number of words. The number of errors was computed from the result of the morphological module of TagParser (Francopoulo, 2008), a deep industrial parser based on a broad English lexicon and Global Atlas (a knowledge base containing more than one million words from 18 Wikipedias) (Francopoulo et al., 2013). Variations in performance quality measures were used to control the parameterization of the content preprocessing tools.
Following this content extraction, another step in our preprocessing was dedicated to split the content into abstract, body and references sections. Initially, we attempted to use ParsCit (Councill et al., 2008), which had been used to extract citations from the ACL Anthology; however, it was not suited for Slavic, German, extended Latin, and phonetic alphabets included in our data, and retraining the program would have required too much time. We therefore created a small set of rules in Java to extract the abstract and body of the papers and compute their quality, which yielded a 2.5% higher performance than ParsCit.
The result of the preprocessing is summarized in Table A2, and it can be noticed that the corpus contains close to 270 million words. We see that the overall quality improved over time. We extracted from those papers the sections related to the abstract and to the references, which didn't exist or could not be extracted in some cases.
Manual Checking and Correction
The study of authors is problematic due to variations of the same name (family name and given name, initials, middle initials, ordering, married name, etc.). It therefore required a tedious semi-automatic cleaning process (Mariani et al., 2014b). On the first survey we conducted on the ISCA archive, about two thirds of the raw family names or given names had to be corrected or harmonized: starting from an initial list of 51,145 authors' names, it resulted in a list of 16,540 different authors. Given the tedious nature of this manual checking process, a cost-benefit perspective suggests that we focus on the data that have the greatest influence on survey goals. Normalizing the names of authors who published only one or two papers over 50 years has only a small effect compared with the required effort. This is especially important given that more than half of the authors (26,870 upon 48,894) published only one paper. In contrast, resolving the different names of an active author is important, because otherwise this person will not appear with the correct ranking. Figure 8 provides an example of this cleaning process, which focuses on the most prolific authors according to the number of papers they published, as merging variant wordings may drastically change their ranking (see the case of Victor Zue/Victor W. Zue, with 53 papers in total). This suggests a need to determine ways to uniquely identify researchers, which has been proposed (Joerg et al., 2012), and may also be solved through organisms, such as ORCID8.
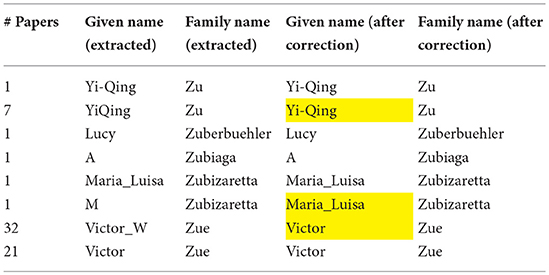
Figure 8. Example of cleaning authors' given names and family names. Values colored in yellow indicate manual corrections.
The same process was applied to the analysis of the authors cited in papers. The problem is even more difficult, as the data is extracted from the paper content and may therefore contain segmentation errors. Also the number of cited papers' authors is much larger than the number of papers' authors. We first automatically cleaned the data by using the results of the former process on the authors' names, before conducting a manual cleaning. Here also the focus is put on the most cited authors. In the example of Figure 9, the number of citations appears in the first column. Merging variant wordings may drastically change the ranking (from 300 to 412 citations for T.F. Quatieri, for example).
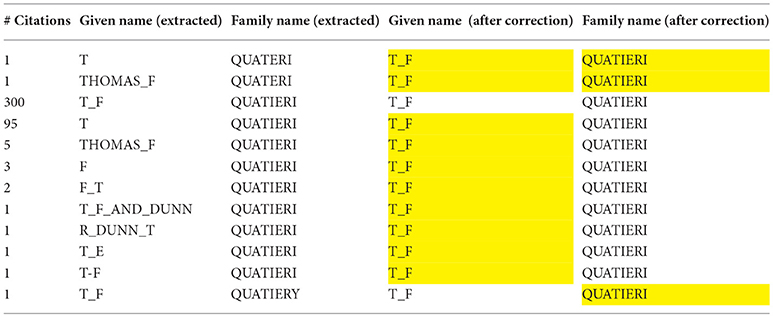
Figure 9. Example of cleaning cited authors' given names and family names: the case of T.F. Quatieri.
Similarly, we also had to clean the sources of the citations, which may belong to several categories: conferences and workshops, journals or books. The cleaning was first conducted on a single year. The resulting filter was then used for all the years, and the full data received a final review. Here also, the focus is put on the most cited sources, as merging variant wordings change their ranking, and only the most cited sources were considered (more than five citations). Figure 10 provides an example for IEEE-ICASSP, where the number of mentions appears on the first column.
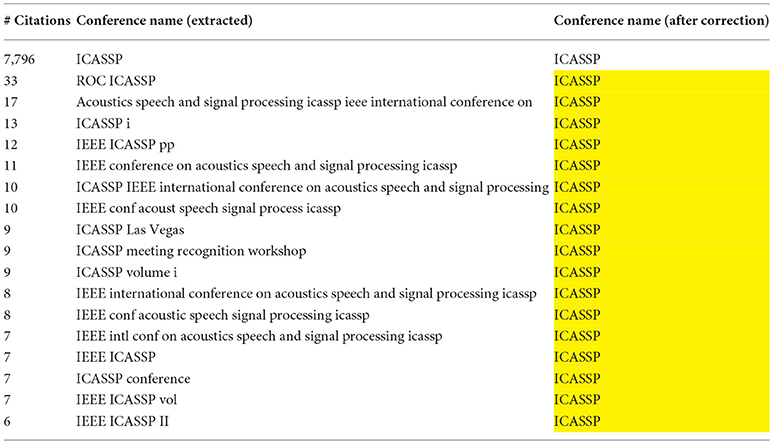
Figure 10. Example of cleaning cited conferences: the case of IEEE ICASSP.
The analysis of the acknowledgments of the Funding bodies in the papers also necessitated a manual cleaning. The nationality of each funding agency was introduced, and the spelling variants were harmonized in order to estimate the agencies and countries that are the most active in funding research on SNLP. Figure 11 provides an example for the French National Research Agency (ANR), including cases where several Funding Agencies are mentioned. The nationality of the Funding Agency is also included.
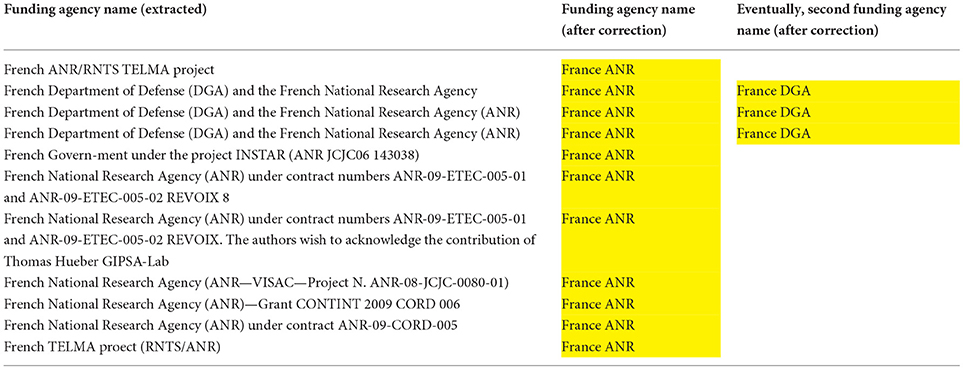
Figure 11. Example of cleaning cited Funding Agencies: the case of the French ANR.
Tools
After this preprocessing phase, the metadata and contents are ready to be processed by higher level tools based on the R statistical suite (The R Journal, 2012), iGraph (Csárdi and Nepusz, 2006), the search engine swish-e9, RankChart, Tulip (Auber et al., 2012) and a series of Java programs that we wrote (Francopoulo et al., 2015a,b, 2016).
Overall Analysis
Papers and Authors
The number of authors varies across the sources, from 16,540 different authors who published in the ISCA conference series to 156 different authors at Tipster (Figure 12).
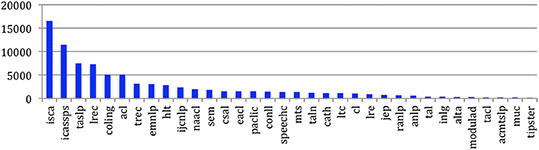
Figure 12. Number of different authors having published at each source.
The number of documents per venue or per issue may also vary across the sources (Figure 13). The ISCA conferences are the conferences that publish the largest number of papers in a single event (656 papers on average), followed by LREC (506), ICASSP-Speech (378), IJCNLP (198) and Coling (182). The ACM Transactions on Speech and Language Processing only had 8 papers on average at each issue.
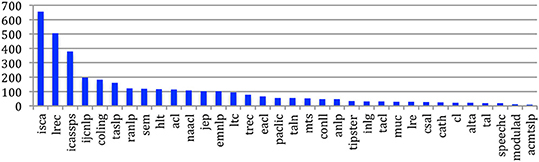
Figure 13. Average number of documents at each venue (conferences) or issue (journals).
Accordingly, the number of authorships also rose steadily, from 32 in 1965 to 11,457 in 2015 (Figure 14).
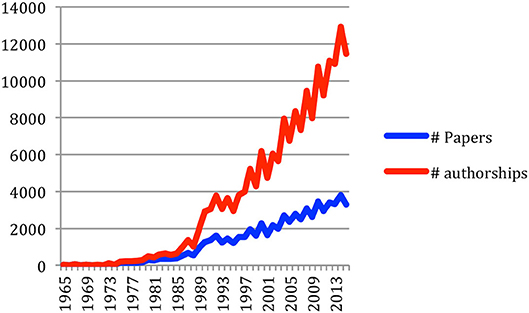
Figure 14. Number of papers and authorships over time.
Co-authorship
The number of co-authors per paper is most often two to three (Figure 15). The largest number of co-authors for a paper is 44, in a paper published by the META-NET10 EC project partners at LREC 2014. The average number of co-authors per paper increased over time, from 1.33 in 1965 up to 3.45 in 2015 (i.e., two more authors on average) (Figure 16). It is interesting to notice that the number of papers with a single author was 75% in 1965 and decreased to 5% in 2015. This clearly demonstrates the change in the way research is being conducted, going progressively from individual research investigations to large projects conducted within teams or in collaboration within consortia, often in international projects and programs.
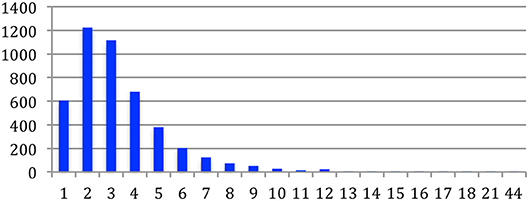
Figure 15. Number of papers according to the number of co-authors.
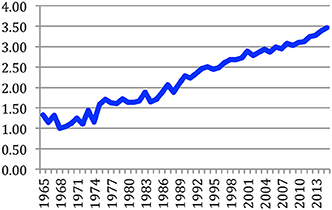
Figure 16. Average number of authors per paper.
The average number of co-authors per paper also varies across the sources (Figure 17). TREC, MUC, Semeval and the LREC conference, as well as the LRE Journal, show the largest number of co-authors per paper, while journals, such as Computer and the Humanities, Modulad and Computational Linguistics and conferences, such as PACLIC, EACL, and ALTA show the smallest number of co-authorship on average.
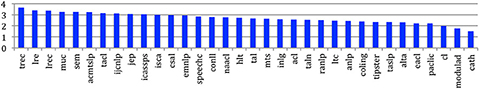
Figure 17. Average number of authors per paper across the sources.
Authors' Renewal and Redundancy
We studied the number of repeated authors at successive conferences (Table A3). For each conference, we identified the authors who did not publish at the previous conference (new authors). We also studied those who had not published at any previous conference (completely new authors).
The ratio of the total number of papers (65,003) to the overall number of different authors (48,894) represents the global productivity of the community: each author published on average 1.33 papers over 50 years. The ratio of the total number of authorships (184,050) to the overall number of different authors (48,894) represents the individual productivity of each author: each author contributed on average in 3.76 papers over 50 years.
If we consider the situation across the sources (Figure 18), we see that ISCA and ICASSPS authors are very productive, with an average of more than 2.5 papers per author, while the productivity in journals is naturally much lower (about one paper per author on average).
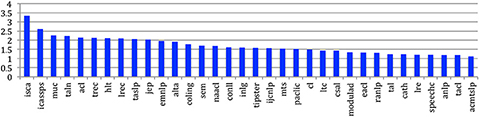
Figure 18. Average number of papers published by each different author across the sources.
The ratio of the number of different authors to the number of authorships at each conference reflects the variety of authors. This ratio would be 100% if each author's name appears on a single paper. We define author redundancy as 100%-author variety. It appears that this redundancy increased over time and has now stabilized at about 40% (Figure 19).
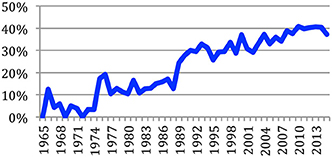
Figure 19. Author redundancy over time.
If we consider this measure across the sources (Figure 20), we see that this redundancy is of course very large in journals while it is very low in the ISCA conference series, where the number of authors is even larger than the number of papers.
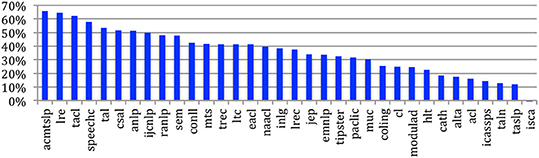
Figure 20. Author redundancy across the sources.
We then studied the authors' renewal. It clearly showed (Figure 21) that the number of different authors globally increased over time. The number of new authors from one conference to the next similarly increased over time. The same trend applies to the number of completely new authors, which still increased in 2015 with 3,033 new authors who never published at any of the NLP4NLP conferences and journals before!
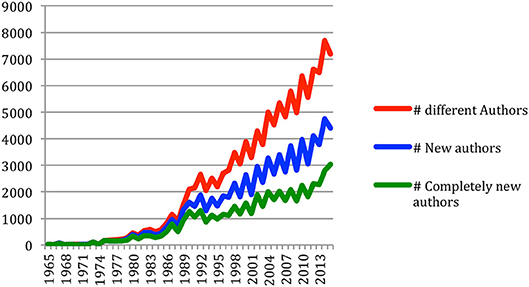
Figure 21. Number of different authors, new authors and completely new authors over time.
This same trend applies to percentages of different authors from 1 year to the next (Figure 22), which decreased from 100% in 1966 to 61% in 2015, while the number of completely new authors decreased from 100% in 1966 to about 42% in 2015. This suggests a stabilization of the research community over time, but it also still reflects the existence of “new blood” in the field.
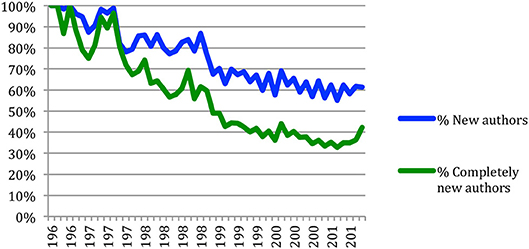
Figure 22. Percentage of new authors and completely new authors over time.
If we consider the percentage of completely new authors at the last venue of conferences or the last issue of journals (Figure 23), we see that this percentage ranges from 40 to 80%, and even to 96% in the case of the ACM Transactions on Speech and Language Processing. The large conferences show the lowest percentages (from 41% for ISCA to 52% for ACL, 56% for COLING and LREC and 61% for IEEE ICASSPS).
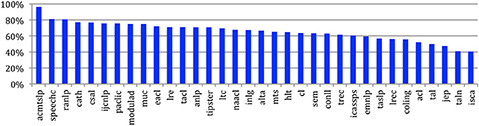
Figure 23. Percentage of completely new authors in the last venue/issue across the sources.
Authors' Gender
An author gender study was performed with the help of a lexicon of 27,509 given names with gender information (66% male, 31% female, 3% epicene11). As noted above, variations due to different cultural habits for naming people (single vs. multiple given names, family vs. clan names, inclusion of honorific particles, ordering of the components etc.) (Fu et al., 2010), and changes in editorial practices and sharing of the same name by large groups of individuals contribute to make identification by name a real issue (Vogel and Jurafsky, 2012). In some cases, we only had an initial for the first name, which made gender guessing impossible unless the same person appears with his/her first name in full in another publication. Although the result of the automatic processing was hand-checked by an expert of the domain for the most frequent names, the results presented here should therefore be considered with caution, allowing for an error margin.
The analysis over the 34 sources shows that 49% of the authors are male, while 14% of the authors are female and 37% are of unknown gender, either because their given name is epicene, or because we only have the initials of the given name. If we assume that the authors of unknown gender have the same gender distribution as the ones that are categorized, male authors account for 77% and female authors for 23%. If we now consider the authorships, which take into account the authors' productivity, we see that 61% of the signatures are male, while 13% are female and 26% are of unknown gender (Figure 24). If we assume that the authors of unknown gender have the same gender distribution as the ones that are categorized, male authors account for 82% and female authors for 18% of the published papers (Figure 25).
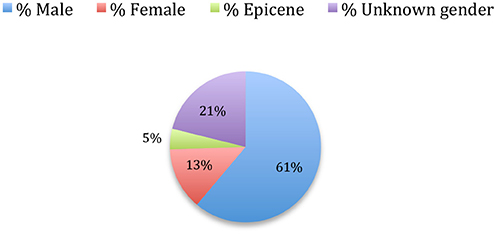
Figure 24. Authorships' gender.
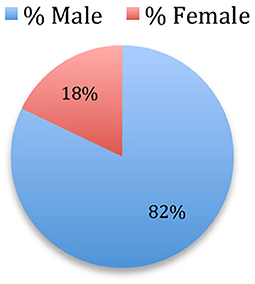
Figure 25. Extrapolated authorships' gender.
If we consider the situation across the various sources (Figure 26), we see that the IEEE Transactions on Speech and Language Processing and ICASSPS have the largest participation of male authors (respectively 90 and 88%), while the French conferences and journals, together with LRE and LREC have the smallest (from 63 to 70%).
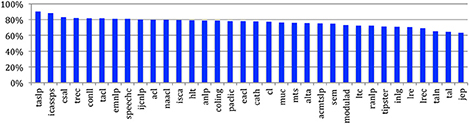
Figure 26. Percentage of male authors across the sources.
The analysis of the authors' gender over time (Figure 27) shows that the ratio of female authorship slowly increased over time from 10% to about 20%.
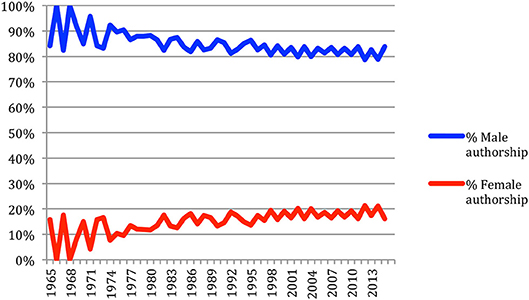
Figure 27. Gender of the authors' contributions over time.
Authors' Production and Co-production
The most productive author published 358 papers, while 26,870 authors (about 55% of the 48,894 authors) published only one paper (Figure 28). Table 3 gives the list of the 10 most productive authors, accompanied by the number of papers they published as a single author. Table 4 gives the number of authors who published papers as single authors. 42,471 authors (87% of the authors) never published a paper as single author12.
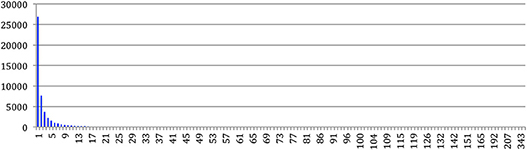
Figure 28. Number of papers per number of authors.
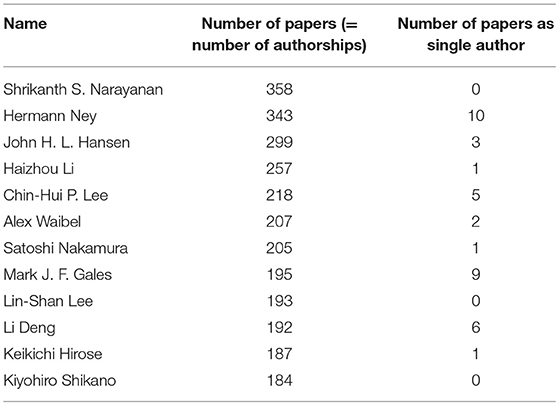
Table 3. Ten most productive authors, including the number of papers published as single author.
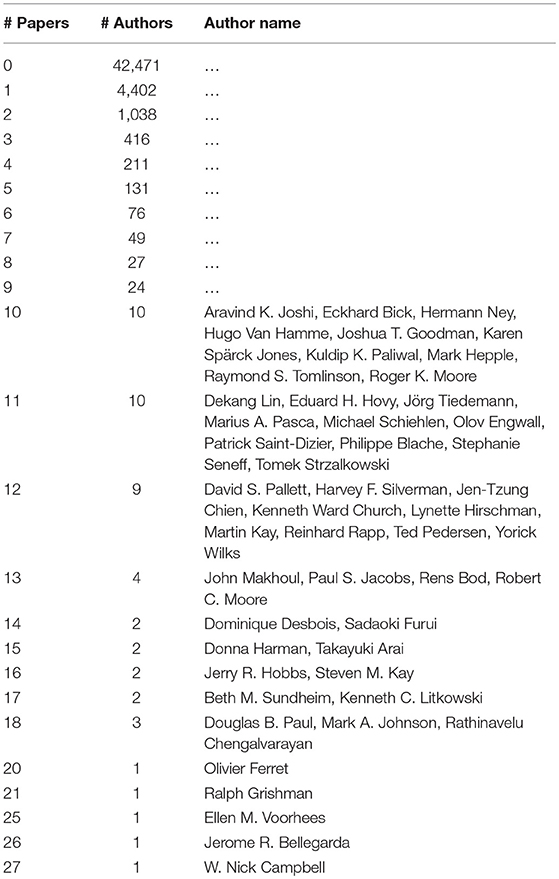
Table 4. Number of single author papers.
Collaborations
Authors' Collaborations
The most collaborating author published with 299 different co-authors, while 2,401 authors always published alone (Figure 29). On average, an author collaborated with 6.6 other authors. 108 authors published with 100 or more different co-authors (Table 5).
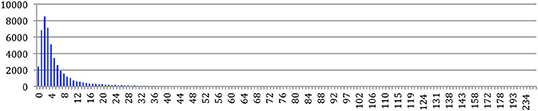
Figure 29. Number of authors as a function of the number of different co-authors.
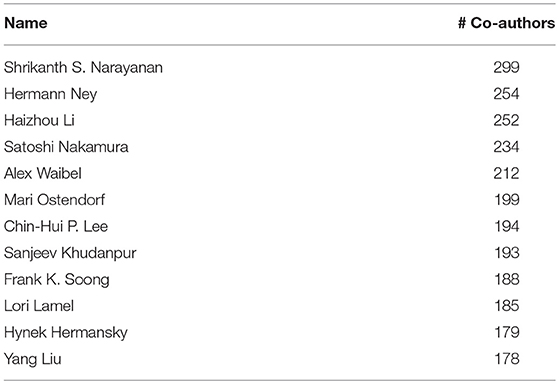
Table 5. The 12 authors with the largest number of co-authors.
We may also consider the number of collaborations, possibly with the same co-authors. Table 6 gives the list of the 12 authors who have the largest number of collaborations.
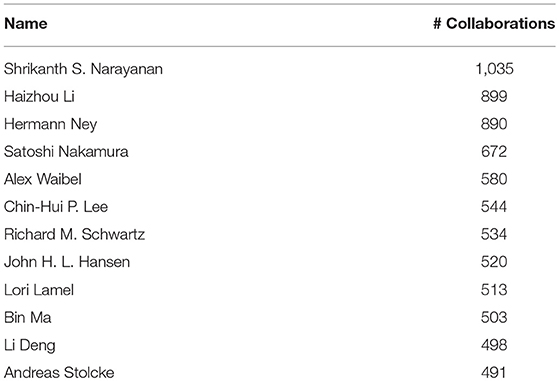
Table 6. The 12 authors with the largest number of collaborations.
Collaboration Graph
A collaboration graph13 (CollG) is a model of a social network where the nodes (or vertices) represent participants of that network (usually individual people) and where two distinct participants are joined by an edge whenever there is a collaborative relationship between them. As opposed to a citation graph, a CollG is undirected. It contains no loop-edge (an author does not collaborate with himself/herself) and no multiple edges (there is a single edge between two authors, whatever the number of papers they published together).
As it appears in Figure 30, the CollG nodes need not be fully connected, i.e., people who never co-authored a joint paper are represented by isolated nodes (E). Those who are connected constitute a connected component (this is the case for A, B, C, D). When a connected component gathers a majority of the nodes, it may be called a giant component. Cliques are fully connected components where all authors published with one another. The collaboration distance is the geodesic distance, or path-length, between two nodes in a CollG, which is equal to the smallest number of edges in an edge-path, or collaboration path, connecting them. The diameter of the CollG is the longest collaboration path in that graph. If no path connecting two nodes in a CollG exists, the collaboration distance between them is considered to be infinite. The degree of a node (number of edges attached to the node) reflects the number of co-authors associated with each author, as an absolute measure of his/her collaboration activity. The clustering coefficient of a node is a measure of the degree to which its neighboring nodes tend to cluster together: i.e., how close they are to form a clique. The density of a graph is the fraction of all possible edges that actually exists in the CollG, thus providing a measure of the density of collaboration: if all authors have published at least one paper with all the other authors, the density of collaboration of the graph would be equal to 1.
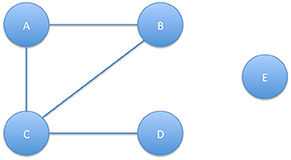
Figure 30. Collaboration graph.
The NLP4NLP CollG contains 48,894 nodes corresponding to the 48,894 different authors. There are 162,497 edges. The global diameter is 17. Five pairs have this distance. The sources with the largest diameter are Computer Speech and Language and the IEEE Transactions on Audio, Speech and Language Processing (24), which reflects the cohesion of the related communities (Figure 31).
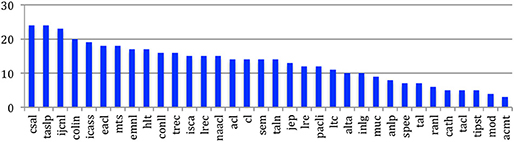
Figure 31. Diameter of the CollG for the 34 sources.
The mean degree (average number of co-authors for each author) is 6.6. It goes from over 6 for LREC, ISCA and TREC to close to 1 for Computer and the Humanities, given that this journal starts being considered very early in the 60s, a period when authors did not collaborate as much as today (Figure 32). The max degree (corresponding to the author who collaborated with the largest number of different co-authors) is 299 (as already mentioned in Table 5).
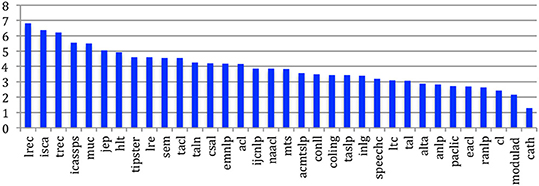
Figure 32. Mean degree of the CollG for the 34 sources.
The density of the complete CollG is 0.0001. If we consider the difference across the sources, we see that this density goes from 0.03 for Tipster and 0.025 for MUC, which corresponds to evaluation campaigns where there is a strong collaboration among all the authors, to 0.0004 (almost 100 times less) for the ISCA conference series (Figure 33).
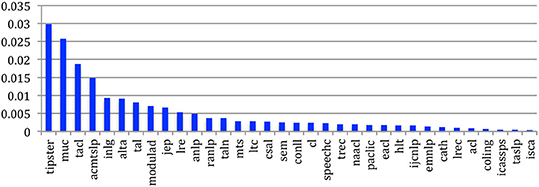
Figure 33. Density of the CollG for the 34 sources.
The average clustering coefficient is 0.6. It goes from more than 0.7 for conferences related to evaluation campaigns (TREC, MUC and Semeval), where the collaboration is strong, to < 0.3 for Computer and the Humanities (Figure 34).
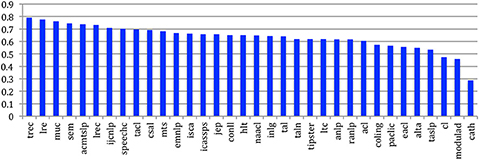
Figure 34. Average clustering coefficient of the CollG for the 34 sources.
Connected Components
As shown in Table 7, the CollG contains 4,585 connected components. The largest one groups 39,744 authors, which means that 81% of the 48,894 authors are connected through a collaboration path. The authors of the largest connected component published 58,208 papers (89% of the total number of papers), and the average path length is 5.5. The second connected component groups 29 authors, who published together but never with any of the 39,744 previous ones. The remaining connected components contain far fewer authors, each of whom has never published with any of the authors of the largest connected component; these components tend to represent small communities often related to the study of a specific topic or a specific language. As already mentioned, 5% of the authors (2,401) have never published jointly with any other author. As it turned out, in our corpus the largest clique could be identified by simply looking at the paper with the largest number of co-authors [44 co-authors in the LREC 2014 paper related to the Multilingual Europe Technology Alliance Network (META-NET)].
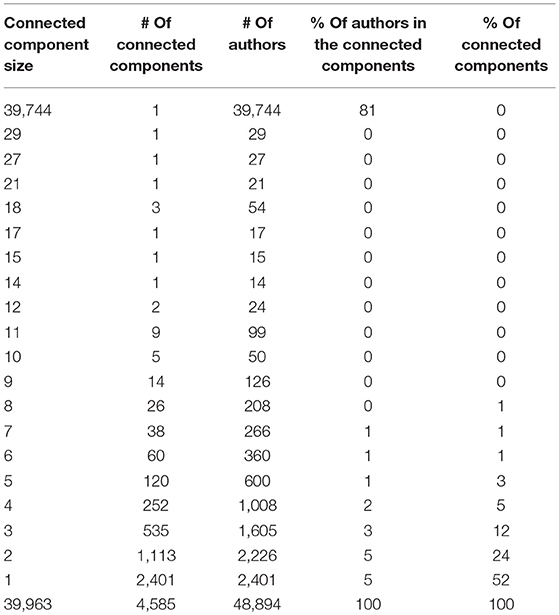
Table 7. Connected components in the collaboration graph.
Figure 35 gives the percentages of authors in the largest Connected Component for the 34 sources. We see that some conferences, either international (ISCA, LREC, ICASSPS, EMNLP, HLT) or national (jep, taln), are more focused than others where the collaboration is sparser. For twelve sources, the largest Connected Component gathers more than 50% of the nodes and may therefore be considered as a Giant Component.
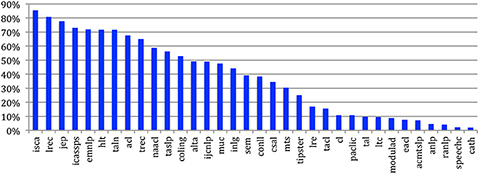
Figure 35. Percentage of authors in the largest connected component of the CollG for the 34 sources.
Measures of Centrality
We explored the role of each author in the CollG in order to assess his/her centrality. In graph theory, there exist several types of centrality measures (Freeman, 1978). The Closeness distance has been introduced in Human Sciences to measure the efficiency of a Communication Network (Bavelas, 1948, 1950). It is based on the shortest geodesic distance between two authors regardless of the number of collaborations between the two authors. The Closeness centrality is computed as the average closeness distance of an author with all other authors belonging to the same connected component. More precisely, we use the harmonic centrality which is a refinement introduced recently by Rochat (2009) of the original formula to take into account the whole graph in one step instead of each connected component separately. The degree centrality is simply the number of different co-authors of each author, i.e., the number of edges attached to the corresponding node. The betweenness centrality is based on the number of paths crossing a node and reflects the importance of an author as a bridge across different sets of authors (or sub-communities).
Looking at Table 8, we see that some authors who appear in the Top 10 according to the Closeness Centrality also appear in the other two types of centrality, eventually with a different ranking, while others do not.
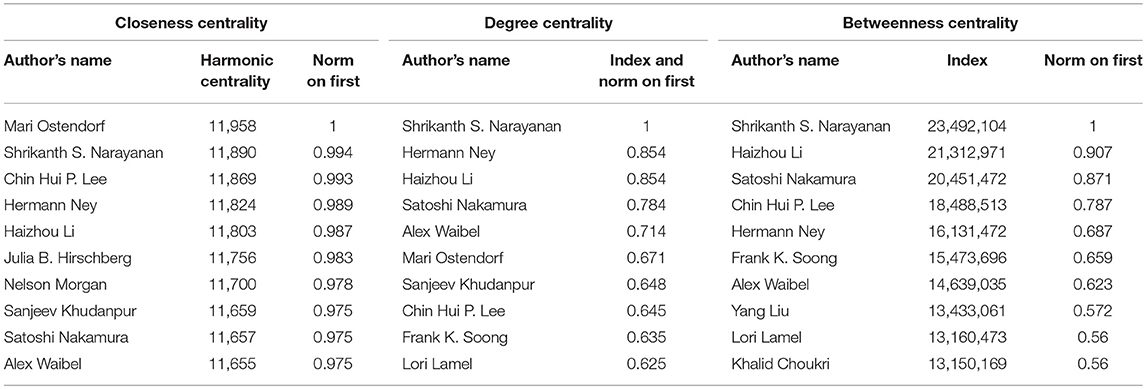
Table 8. Computation and comparison of the closeness centrality, degree centrality and betweenness centrality for the 10 most central authors.
Citations
Papers' Citations
We studied citations in papers that are accessible in digital form. 58,204 papers contain a list of references, and the number of missing references decreases over time as the quality of the source data increases (see Table A2).
If we consider the average number of references in papers, we see that it increased over time from close to 0 in 1965 to 8.5 in 2015 (Figure 36). Even if we only consider here the NLP4NLP data, its seems that it is a general trend that goes together with the citing habits and the increase of the number of published papers in the literature.
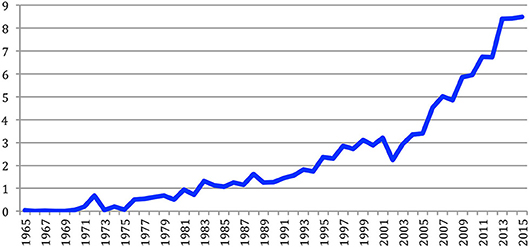
Figure 36. Average number of references per paper over the years.
If we now consider the average number of citations per NLP4NLP paper over the years (Figure 37), the trend is less clear. Obviously the most recent papers are less cited than the older ones, with an average number of more than seven citations for the papers of the most cited year (2003) and 0.4 citations on average for the papers published in 2015, given that they have only been cited by the papers published on the same year, but the eldest papers before 1974 are also cited less than once on average.
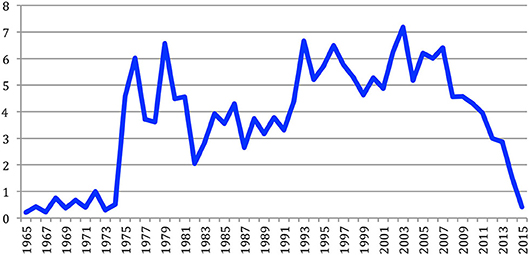
Figure 37. Average number of citations per paper over the years.
The comparative study of the number of references and of the number of citations over the years for the 34 sources is difficult to handle. If we limit this study to the eight most important conferences (ACL, COLING, EACL, EMNLP, ICASSP, ISCA, LREC, NAACL), we see that the number of references strongly increased over time in the ISCA conference series (Figure 38). This is directly in agreement with the ISCA Board policy which decided in 2005 to enlarge the number of pages in the yearly conference papers from 6 to 7, with the rule that the allowed extra page should only consist of references, in order to encourage authors to better cite the work of the other authors. The saw tooth aspect of LREC, EACL, and NAACL is due to the fact that those conferences are biennial.
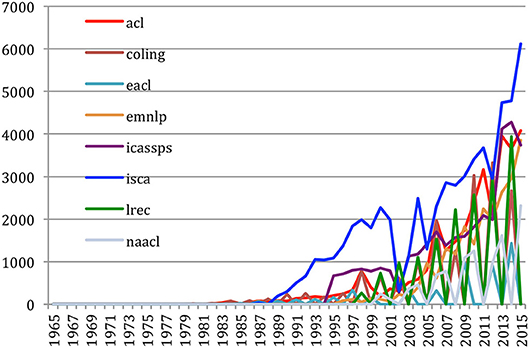
Figure 38. Number of references in papers over the years for the eight most important conferences.
Similarly, it is difficult to analyze the variation of cited papers over time (Figure 39). Here also the saw tooth aspect of LREC, EACL, and NAACL is due to the fact that those conferences are biennial.
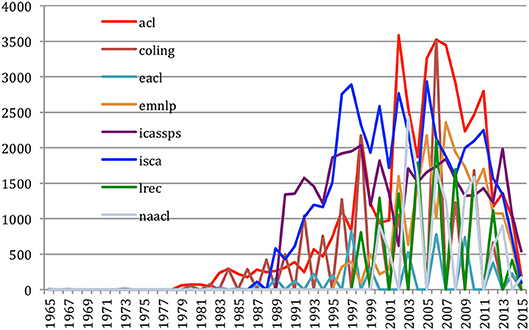
Figure 39. Number of papers being cited over the years for the eight most important conferences.
In order to solve this problem mostly due to the conference frequency, we may integrate the number of papers being cited up to the given year. In this case, we see (Figure 40) that the number of ISCA papers being cited grows at a high rate over time. The same appears for ACL with some delay, which is now caught up. ICASSPS comes in the third position. We then find a group of two with COLING and EMNLP, followed by LREC and NAACL. Then comes EACL.
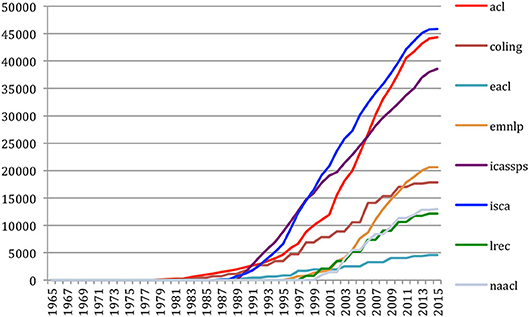
Figure 40. Number of papers that have been cited over the years for the eight most important conferences.
Finally, we studied the same in terms of percentage over time for each of the 8 conferences (Figure 41). We find the same group of 3 (ISCA, ACL, and ICASSPS) at the first rank in 2015 with 12–15% of the citations. COLING, which was alone in 1965 is now at 6% close to EMNLP (7%), while LREC and NAACL represent 4% each and EACL 1% of the citations.
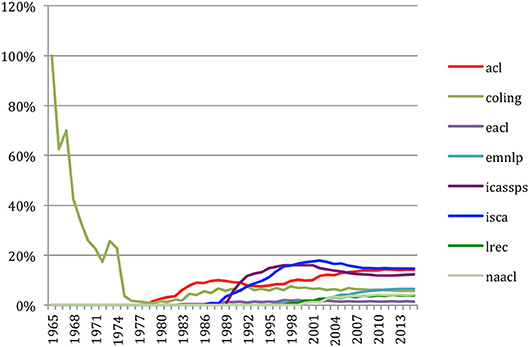
Figure 41. Percentage of the papers that have been cited over the years for the eight most important conferences.
Citation Graph
Unlike the CollG, a citation graph (CitG) is directed. In an authors citation graph (ACG), nodes (or vertices) represent individual authors (Figure 42A). We may consider the citing authors graph (CgAG), in which a citing author is linked to all the authors of the papers that he/she cites by an edge directed toward those authors, and the cited authors graph (CdAG), where each cited author is linked to the authors who cite him/her by an edge directed toward this author. These graphs may have loop-edges, as an author may cite and be cited by him/herself, but they have no multiple edges: there is only one edge between two authors, whatever the number of times an author cites or is being cited by another author.
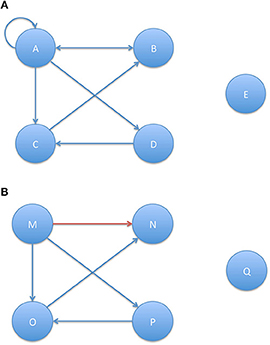
Figure 42. (A) Authors' citation graph. (B) Papers' citation graph.
In a papers citation graph (PCG), nodes represent individual papers (Figure 42B). Here also, we may consider the citing papers graph (CgPG), in which a paper is linked to all the papers it cites by an edge directed toward those papers, and the cited papers graph (CdPG), where each paper is linked to all the papers that cite it by an edge directed toward those papers. These graphs contain no loop-edge, as a paper does not cite itself, and no multiple edges: there is only one edge between two papers, whatever the number of times a paper cite or is being cited by another paper. Bi-directional arrows are common in ACGs (as Author A may cite Author B while Author B cites Author A), but uncommon in PCGs (if Paper M cites Paper N, it is very unlikely that Paper N will cite Paper M, as papers typically reference papers that have been already published. It may however happen in case of simultaneous publications).
The citation graphs need not be connected, as an author may not cite any author and may not be cited by any author, not even him/herself (E), or a paper may not cite any paper and may not be cited by any other paper (Q); in these cases, corresponding authors or papers appear as isolated nodes in the citation graphs. The nodes that are connected through a directed path (as it is the case for A, B, C, D in Figure 42A where Author A cites Authors B, C, and D, and himself/herself, Author B cites Author A, Author C cites Author B and Author D cites Author C), constitute a strongly connected component. If the nodes are connected in both directions, they constitute a symmetric strongly connected component (Figure 43).
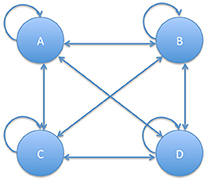
Figure 43. Authors' citation graph symmetric connected component.
The citation distance between two nodes is the smallest number of directed edges in an edge-path connecting them. The diameter of a citation graph is the longest path in the graph, which is identical in both the citing and cited graphs. If no path connecting two nodes in a citation graph exists, the citation distance between them is said to be infinite. In a citing graph, the degree of a node (the number of directed edges issued from that node) reflects the absolute number of authors (or papers) cited by each author (or paper). In a cited graph, the degree of a node reflects the absolute number of authors (or papers) citing each author (or paper). As in the CollG, the clustering coefficient of a node is a measure of the degree to which its neighbors tend to cluster together. The density of a citation graph, which is the fraction of possible edges that exist in the graph, provides a measure of the density of citation: if all authors (or papers) cite at least once each other author (or paper), the density of citation of the graph would be equal to 1.
We studied the four Citing and Cited/Authors and Papers Graphs for each of the 34 sources, either internally or in the context of the NLP4NLP corpus, which also includes the individual source and represents the general Speech and Natural Language Processing scientific community (SNLP).
We thus studied:
• the citation in the source papers of papers of the same source (Internal Papers Citations: the citations within the source) (Figure 44A),
• the citation in the source papers of NLP4NLP papers, including those from the same source (Outgoing Global Papers Citations: how the source cites its scientific environment, which also includes the source) (Figure 44B),
• the citation in NLP4NLP papers of the source papers (Ingoing Global Papers Citations: how the source is being cited by its scientific environment, which also includes the source) (Figure 44C).
Similarly, we also studied:
• the citation by the source authors of the source authors (Internal Authors Citations),
• the citation by the source authors of SNLP authors (Outgoing Global Authors Citations),
• the citation by SNLP authors of the source authors (Ingoing Global Authors Citations).
where the “source authors” means the authors for the papers they have published in the source, while they may also have published elsewhere.
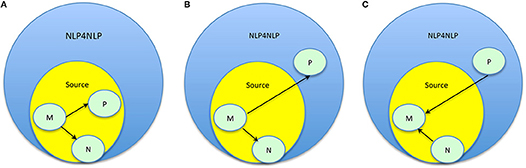
Figure 44. (A) Example of internal citing papers graph: source paper M cites source papers N and P. (B) Example of outgoing global citing papers graph: Source paper M cites NLP4NLP papers N and P. (C) Example of ingoing global citing papers graph: NLP4NLP papers N and P cite source paper M.
We give some elements of comparison across sources, keeping in mind that the time scales are different, as well as the frequency and number of venues for conferences (9 venues over 17 years for LREC, to be compared with 28 venues over 27 years for ISCA or 36 venues over 35 years for ACL, for example), or the number of publications for journals.
We considered the 67,937 papers we have in NLP4NLP, which include 324,422 references (Table A2).
Authors' Citations
Internal authors' citations
We first consider internal authors citations: the citation by authors, in the source papers, of authors for their source papers.
If we consider for the 34 sources the average number of authors (mean degree) from the source being cited by the authors of papers of the same source (Figure 45) in the CgAG, we see that some communities, such as ACL and EMNLP are used to cite each other. Let's mention that the Mean Degree of the internal Citing Authors Graph (CgAG) is equal to the Mean Degree of the internal Cited Authors Graph (CdAG).
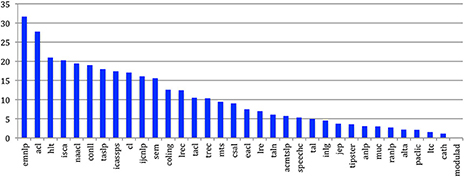
Figure 45. Mean degree of authors citing and being cited within their community for the 34 sources.
The density reaches 0.008 for MUC, 0.006 for Tipster and 0.005 for Semeval, which correspond to evaluation campaigns where there are many cross-citations among all the authors (Figure 46).
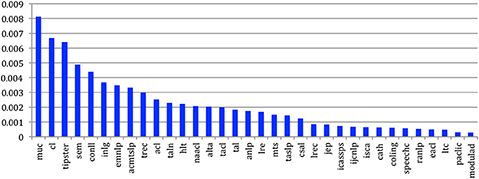
Figure 46. Density of the internal authors citation graph.
For ten sources, the largest Strongly Connected Component gathers more than 50% of the nodes and may be considered as Giant Components. The Computational Linguistics journal has the largest Strongly Connected Component, which contains 72% of the authors. It is followed by several ACL related sources (EMNLP, CONLL, HLT, NAACL, ACL, TACL) that illustrates the way authors highly cite each other in this community (Figure 47).
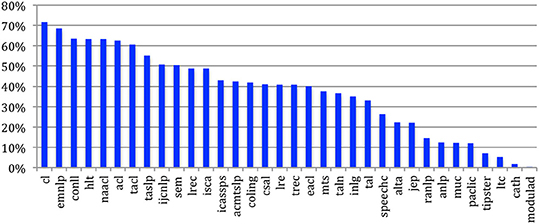
Figure 47. Percentage of authors in the largest strongly connected component.
We compared LREC, ACL, and ISCA (Table 9). The largest strongly connected component for LREC has 3,581 nodes among the 7,282 LREC authors (49% of the authors). This is comparable to ISCA (49%), but less than ACL (63%) and illustrates a less focused network of citations than ACL.
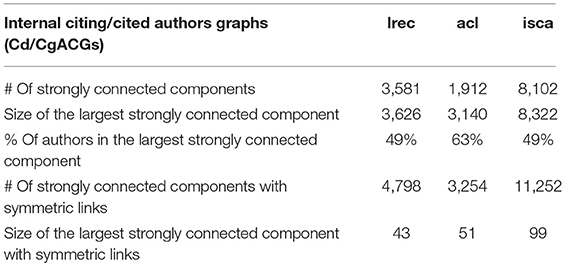
Table 9. Comparison of LREC, ACL, and ISCA internal Cg/CdAG strongly connected components, without or with symmetric links.
In LREC, the number of strongly connected components with symmetric links is 4,798 (Table 9). The largest strongly connected component with symmetric links includes 43 authors who all cite each other and correspond to partners in the French Quaero project. It attains 99 authors in ISCA (Figure 48).
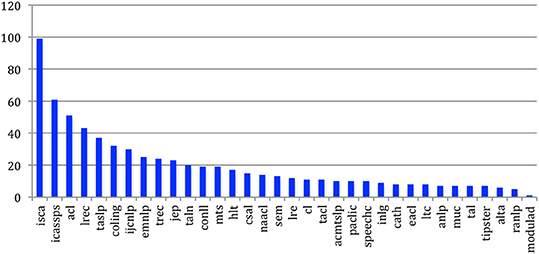
Figure 48. Number of authors in the largest strongly connected component with symmetric links.
Global authors' citations
We now consider global authors citations: the citation by authors, in papers published in each source, of SNLP authors.
If we now consider the general habit of citing other authors (Figure 49), we also see that the NLP community (TACL, EMNLP, ACL, CL, CONLL, IJCNLP) has in general a larger habit of citation than the Speech one (TASLP, ISCA, CSAL, ICASSPS).
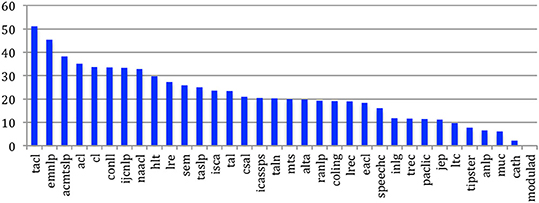
Figure 49. Mean degree of authors citing authors in general for the 34 sources.
If we now consider the authors being cited in each of the 34 sources (Figure 50) through the CdAG, we see that authors who publish in Computational Linguistics are the most cited. It is followed by HLT and ACL, then EMNLP and NAACL. Speech conferences and journals show lower scores. This is in agreement also with the citation habits of the corresponding communities. Authors are obviously less cited for the papers they publish in languages other than English (e.g., JEP and Modulad).
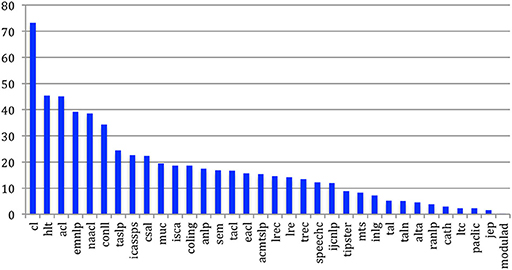
Figure 50. Mean degree of authors being cited for the 34 sources.
Most cited authors
Table 10 gives the list of the 20 most cited authors, with the number of references for each author, and the number of papers written by the author. We see that this ratio may largely vary, some people having few papers but a large audience for this limited set of papers. We also provide the ratio of self-citation (citation of the author in a paper written by the author).
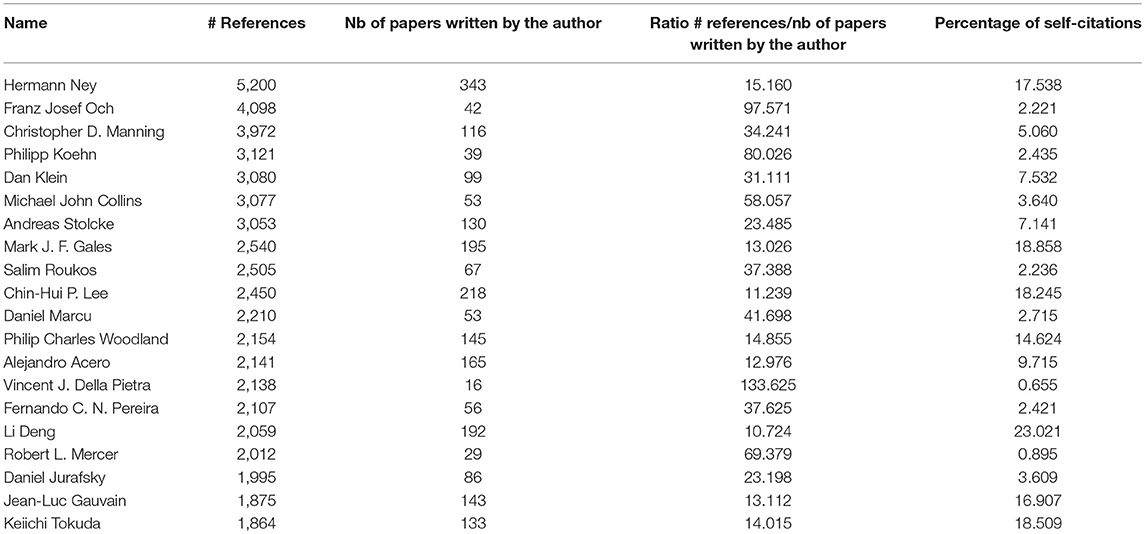
Table 10. Twenty most cited authors.
We provide in Table 11 the number of citations, either by themselves (self) or by others (extra), for the most productive authors already mentioned in Table 3. We notice that the most productive authors rather sign as last author.
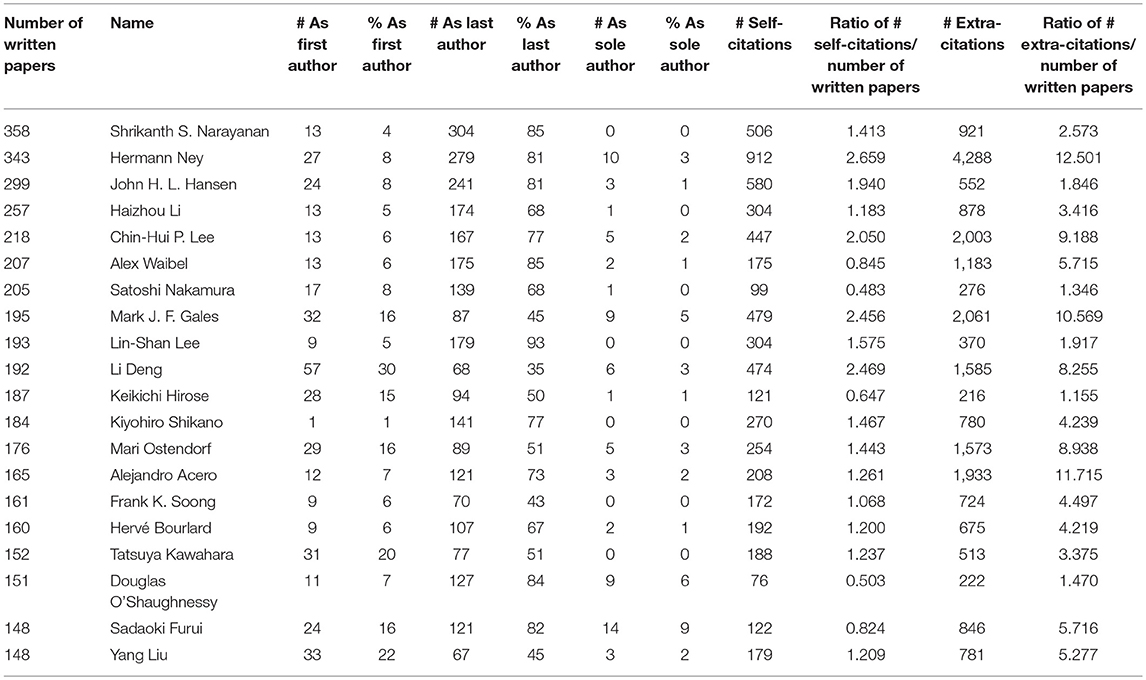
Table 11. Number of citations for the 20 most productive authors.
Authors' h-index
We finally computed the h-index for each author. Table 12 provides the list of the 20 authors with the largest h-index. We see that Christopher Manning has the largest h-index: he published 32 papers which were cited at least 32 times.
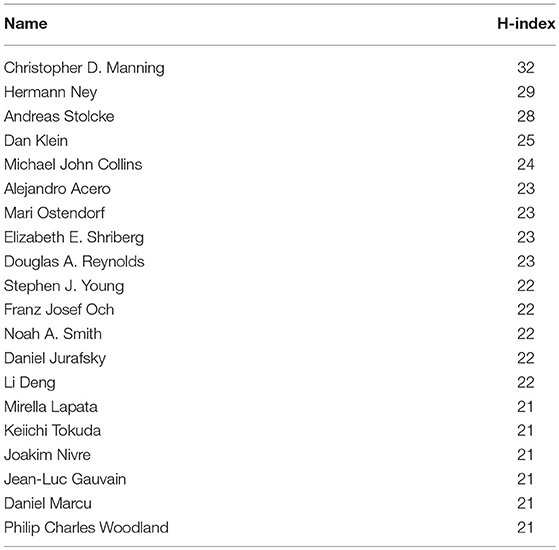
Table 12. List of the 20 authors with the largest h-index.
Papers Citations
Internal papers citations
Here also, we first consider internal papers citations: the citation in a source paper of papers published in the same source.
If we first consider the average number of papers being cited by papers of the same source for the 34 sources (Figure 51), we see that some communities, such as ACL and EMNLP, and the papers published in journals, such as TASLP or Computational Linguistics are used to cite each other, with an average of two papers from the same source or more being cited in each paper. Let's mention that, just as for authors, the Mean Degree of the internal Citing Papers Graph is equal to the Mean Degree of the internal Cited Papers Graph.
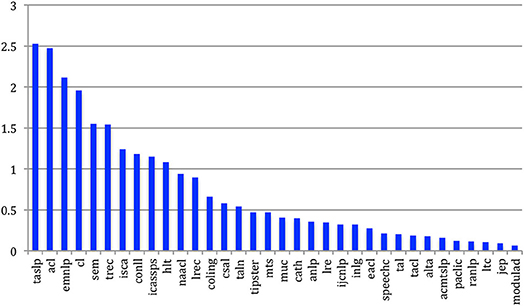
Figure 51. Mean degree of citing and cited papers within the same source for the 34 sources.
If we compare LREC, ACL and ISCA, we see that an LREC paper is internally cited less than once on average (0.9) in LREC papers, which is less than ACL (2.5) but comparable to ISCA (1.2).
The density reaches 0.00045 for Tipster, 0.00025 for MUC and 0.0015 for Semeval, which correspond to evaluation campaigns where there are many cross-citations among all the papers (Figure 52).
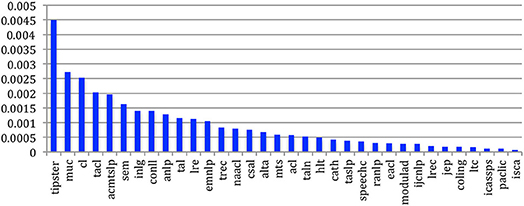
Figure 52. Density of the internal papers citation graph.
Global papers citations
We now consider global papers citations: citation in papers published in each source of NLP4NLP papers in general.
If we now consider the general habit of citing other papers (Figure 53), we also see, just as when we considered the authors, that the NLP community (TACL, EMNLP, CL, CONLL, IJCNLP, NAACL, ACL) has in general a bigger habit of citation than the Speech one (CSAL, Speech Communication, TASLP, ICASSPS, ISCA). The average number of references in TACL papers is especially impressive (more than 18).
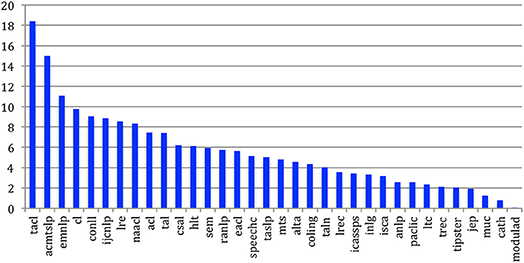
Figure 53. Mean degree of papers citing papers in general for the 34 sources.
If we consider the papers being cited from each of the 34 sources (Figure 54), we see that papers published in Computational Linguistics are by far the most cited (more than 20 times on average). It is followed by NAACL, ACL and EMNLP, then HLT and CONLL, and is in agreement with the citing habits in those sources. Speech journals (CSAL, TASLP, Speech Communication) and especially speech conferences show lower scores. Papers are obviously less cited if they are published in languages other than English (e.g., TAL, TALN, JEP, Modulad).
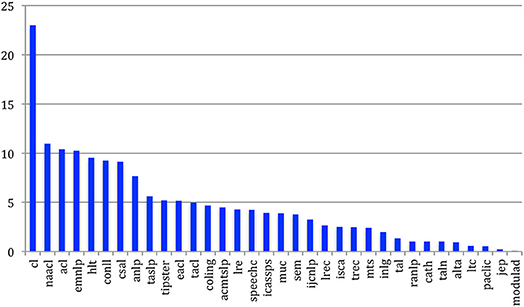
Figure 54. Mean degree of papers being cited for the 34 sources.
If we compare LREC, ACL, and ISCA, we see that an LREC paper is cited 2.7 times on average, which is comparable to ISCA (2.5) but much less than ACL (10.4).
Most cited papers
Table 13 gives the list of the 20 most cited papers. We see that the most cited papers are related to an evaluation metrics (Bleu), a Language Resource (Penn Treebank), a tool (Moses, SRILM) or a survey (Statistical alignment, Statistical translation). The largest number of papers comes from the Computational Linguistics journal (6), the ACL conference (4), and the IEEE Transactions on Acoustics, Speech and Language (3).
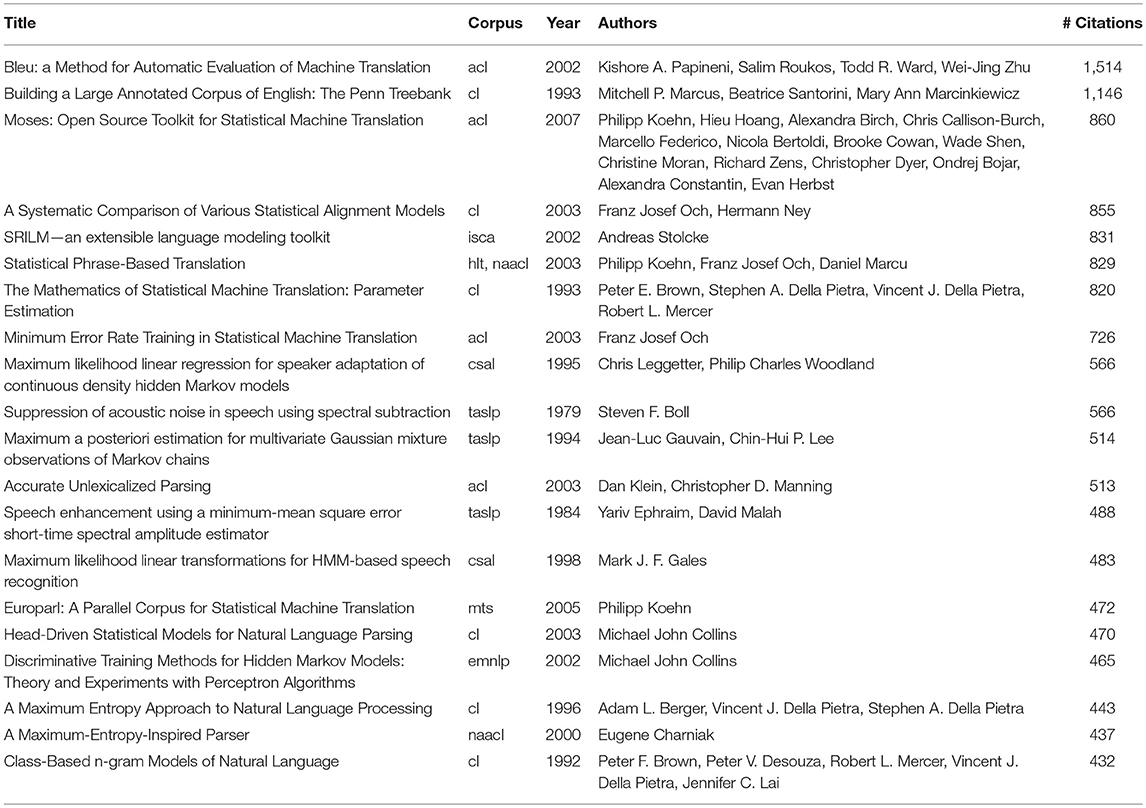
Table 13. Twenty most cited papers.
Among the 48,894 authors, 20,387 (42%) are never cited, and even 21,670 (44%) if we exclude self-citations (Table 14). However, after checking Google Scholar, it appears that many of those never cited authors come from neighboring research domains (machine learning, medical engineering, phonetics, general linguistics), where they may be largely cited. Among the 65,003 papers, 28,283 (44%) are never cited, and even 35,229 (54%) if we exclude self-citations.
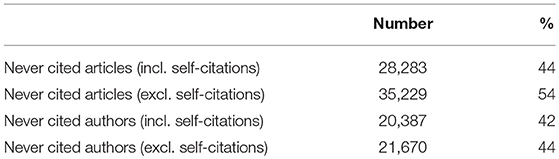
Table 14. Absence of citations of authors and papers within NLP4NLP.
Sources' h-index
Figure 55 gives the internal (papers being cited by papers of the same source) h-index for the 34 sources. The largest h-index is obtained by the IEEE TASLP, where 36 papers are cited in other IEEE TASLP papers 36 times or more. It is followed by ACL (34), ISCA (32), ICASSPS (27), EMNLP (22), and LREC (16).
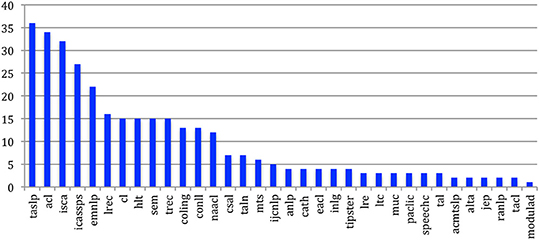
Figure 55. Internal h-index of the 34 sources.
If we now consider the general h-index (Figure 56) for the 34 sources, we see that the largest h-index is obtained by ACL, where 75 papers are cited 75 times or more in the NLP4NLP papers. It is followed by TASLP (66), Computational Linguistics (58), HLT (56), EMNLP (55), ICASSPS (54), and ISCA (51).
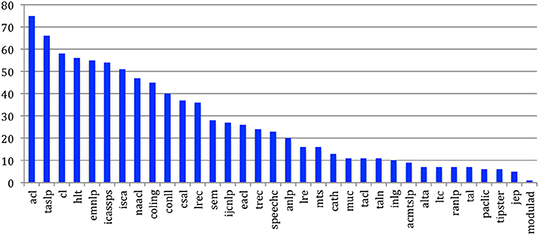
Figure 56. General h-index of the 34 sources.
We also compared here LREC to ACL and ISCA. The internal h-index of LREC is 16: i.e., 16 papers published at LREC are cited 16 times or more in LREC papers (to be compared with 34 for ACL and 32 for ISCA). The h-index of LREC according to the NLP4NLP set of 34 conferences and journals is 36: i.e., 36 papers published at LREC are cited 36 times or more in NLP4NLP papers (75 for ACL and 51 for ISCA). However, it should be stressed once again that both ACL and ISCA conferences are annual and cover a much longer time period than LREC.
As of March 2016, Google Scholar14 (Table 15) places ACL first in the ranking of computational linguistics conferences and journals with an h-index of 65 within the last 5 years (therefore on the same citation time period) and an h5-median mean of 99, followed by EMNLP (56), NAACL (48), LREC (38), COLING (38), CSAL (32), Computational Linguistics (31), CONLL (24), LRE (23), Semeval (23), EACL (21), and IJCNLP (20). In the Signal Processing category, we find IEEE ICASSP (54), IEEE TASLP (51), Interspeech (39), CSAL (32), and Speech Communication (32). Let's stress the point that this ranking covers the last 5 years and therefore reflects the recent trends compared with our own results, which concern a smaller number of sources and a closer scope but a larger time period. Therefore, the ranking may be different. For example, the new ISCA policy of opening the ISCA Archive to all, not only to members, has significantly increased the number of references to ISCA-Interspeech papers. Here also, LREC gets a lower h-index than ACL, but is similar to ISCA-Interspeech. It shows that the h-index reflects both the quality of a conference or journal, but also the number of papers that are published, which may therefore cite and be cited by other papers of the same conference or journal and also by other ones. The biennial conferences are under-scored with the h5-index as it takes into account either the two or the three previous conferences depending on the year, both in terms of possibly citing and cited papers. The h-index is a different measure of the quality of a conference or journal than the rejection rate, and in our opinion less biased, as it appears as an a-posteriori, not a-priori, quality evaluation. Interestingly, even if all submitted papers were accepted, it would not change the h-index, which only considers the most cited papers.
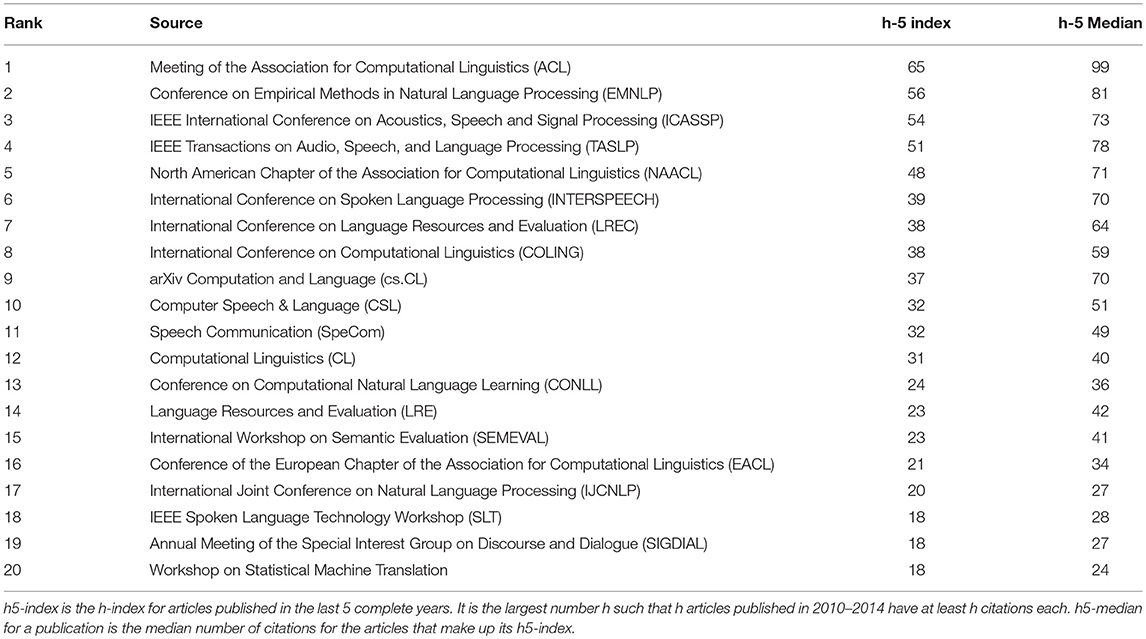
Table 15. Ranking of 20 top sources according to Google Scholar h5-index over the 5 last years (2011–2015).
Conclusions
The production of the NLP4NLP corpus showed the importance of having an open access to data. In this analysis, we benefited from the fact that most of the source data are freely available on-line. Dealing with proprietary data needed a larger effort in communicating with the data owners, and raises the problems of distributing the data, replicating the results and updating the corpus.
The eldest data was not available in a text format and therefore had to be scanned, which introduced some errors. Additionally, we struggled with the lack of a consistent and uniform identification of entities (authors names, gender, affiliations, paper language, conference, and journal titles, funding agencies, etc.), which required a tedious manual correction process only made possible because we knew the main components of the field. In those conditions, it would have been impossible to conduct a comparable analysis on another research field unknown to us, with the same level of reliability. We already faced that problem when considering neighboring domains. Establishing standards for such domain-independent identification will demand an international effort in order to ensure that the identifiers are unique, which appears as a challenge for the scientific community.
Perspectives
We plan to produce an RDF version of the corpus and make the results available over the web as Linked Open Data. We would like to improve automatic information (names, references, terms) extraction by taking into account the context, in order to make the distinction between real and false occurrences of the information. It would avoid the tedious manual checking that we presently conduct and would improve the overall process.
In the next paper (Mariani et al., 2018), we will present an analysis of the evolution of the research topics, with the identification of the authors who introduced them and of the publication where they were first presented, and the detection of epistemological ruptures. Linking the metadata, the paper content and the references allowed us to propose a measure of innovation for the research topics, the authors and the publications. In addition, it allowed us to study the use of language resources, in the framework of the paradigm shift between knowledge-based approaches and content-based approaches, and the reuse of articles and plagiarism between sources over time.
Author Contributions
All authors listed have made a substantial, direct and intellectual contribution to the work, and approved it for publication. JM launched the initiative following an invitation to give a keynote talk at Interspeech 2013 to celebrate the 25th anniversary of this major conference in spoken language processing and coordinated the following related and extended works from 2013 to 2018. GF produced the NLP4NLP corpus and developed all the tools that were used for analyzing the corpus. PP participated in the research group and provided advices on the use of NLP tools.
Conflict of Interest Statement
The authors declare that the research was conducted in the absence of any commercial or financial relationships that could be construed as a potential conflict of interest.
Acknowledgments
The authors wish to thank the ACL colleagues, Ken Church, Sanjeev Khudanpur, Amjbad Abu Jbara, Dragomir Radev and Simone Teufel, who helped them in the starting phase, Isabel Trancoso, who gave her ISCA Archive analysis on the use of assessment and corpora, Wolfgang Hess, who produced and provided a 14 GBytes ISCA Archive, Emmanuelle Foxonet who provided a list of authors given names with genre, Florian Boudin, who made available the TALN Anthology, Helen van der Stelt, and Jolanda Voogd (Springer) who provided the LRE data and Douglas O'Shaughnessy, Denise Hurley, Rebecca Wollman, and Casey Schwartz (IEEE) who provided the IEEE ICASSP and TASLP data, Nancy Ide and Christopher Cieri who largely improved the readability of parts of this paper. They also thank Khalid Choukri, Alexandre Sicard, and Nicoletta Calzolari, who provided information about the past LREC conferences, Victoria Arranz, Ioanna Giannopoulou, Johann Gorlier, Jérémy Leixa, Valérie Mapelli, and Hélène Mazo, who helped in recovering the metadata for LREC 1998, and all the editors, organizers, reviewers, and authors over those 50 years without whom this analysis could not have been conducted!.
Apologies
This survey has been made on textual data, which cover a 50-years period, including scanned content. The analysis uses tools that automatically process the content of the scientific papers and may make errors. Therefore, the results should be regarded as reflecting a large margin of error. The authors wish to apologize for any errors the reader may detect, and they will gladly rectify any such errors in future releases of the survey results.
Relationship With Other Papers and Reuse of Previous Material
The present paper is accompanied by a second paper “Mariani, Joseph, Paroubek, Patrick, Francopoulo, Gil and Vernier, Frédéric (2018). The NLP4NLP Corpus (II): 50 Years of Research in Speech and Language Processing,” in the same special issue of Frontiers in Research Metrics and Analytics on “Mining Scientific Papers: NLP-enhanced Bibliometrics” edited by Iana Atanassova, Marc Bertin and Philipp Mayr, which describes various analysis which were conducted on this corpus. A summary of the joint two papers has been presented as a keynote talk at the Oriental-Cocosda conference in Seoul (“Joseph Mariani, Gil Francopoulo, Patrick Paroubek, Frédéric Vernier, Rediscovering 50 Years of Discoveries in Speech and Language Processing: A Survey. Oriental Cocosda conference, Seoul, 1–3 November 2017”) (Mariani et al., 2017).
This paper assembles the content of several former papers, which described various facets of the NLP4NLP corpus (http://www.nlp4nlp.org).
This corpus was first introduced in 2015 in two different conferences: “Francopoulo, Gil, Mariani, Joseph and Paroubek, Patrick (2015a). NLP4NLP: The Cobbler's Children Won't Go Unshod, 4th International Workshop on Mining Scientific Publications (WOSP2015), Joint Conference on Digital Libraries 2015 (JCDL 2015), Knoxville (USA), June 24, 2015.” and “Francopoulo, Gil, Mariani, Joseph and Paroubek, Patrick (2015b). NLP4NLP: Applying NLP to written and spoken scientific NLP corpora, Workshop on Mining Scientific Papers: Computational Linguistics and Bibliometrics, 15th International Society of Scientometrics and Informetrics Conference (ISSI 2015), Istanbul (Turkey), June 29, 2015.”
Material from previously published sources, listed below, is re-used within permission, implicit or explicit open-license rights, as follows:
(1) “Mariani, Joseph, Paroubek, Patrick, Francopoulo, Gil and Hamon, Olivier (2014). Rediscovering 15 Years of Discoveries in Language Resources and Evaluation: The LREC Anthology Analysis, LREC 2014, 26–31 May 2014, Reykjavik, Iceland”, published within the Proceedings of LREC Conference 2014, http://www.lrec-conf.org/proceedings/lrec2014/index.html.
This paper analyzes the Language Resources and Evaluation Conference (LREC), which is one of the 34 publications contained in NLP4NLP, over 15 years (1998–2014).
The reused material concerns Tables A1, A2, 3, 4, Figures 9–11, section Global Analysis of the Conferences and Journals (mainly sub section Manual Checking and Correction).
(2) “Mariani, Joseph, Paroubek, Patrick, Francopoulo, Gil and Hamon, Olivier (2016). Rediscovering 15 + 2 Years of Discoveries in Language Resources and Evaluation, Language Resources and Evaluation Journal, 2016, pp. 1–56, ISSN: 1574-0218, doi: 10.1007/s10579-016-9352-9.”
This paper has been selected among the LREC 2014 papers to be published in a special issue of the Language Resources and Evaluation Journal. It is an extended version of the previous paper, in the following dimensions: extension of the LREC content with the LREC 2014 conference itself (hence the change in the title of the paper: “15 + 2 Years” instead of “15 Years”), and comparison with two other conferences among those contained in NLP4NLP (namely ACL and Interspeech).
The reused material concerns section Introduction (mainly sub section Preliminary Remarks), section Global Analysis of the Conferences and Journals (mainly sub sections Origin of Data, Extraction and Quality of Data), section Conclusions, section Perspectives and subsection Citation Graph.
Footnotes
1. ^http://snap.stanford.edu/data/
2. ^https://aclanthology.coli.uni-saarland.de/
3. ^Results of these analyses together with corresponding data and tools are available on-line at the University of Michigan http://clair.eecs.umich.edu/aan/index.php
4. ^http://www.isca-speech.org/iscaweb/index.php/archive/online-archive
5. ^Available online at: http://talnarchives.atala.org/TALN/TALN-2013/taln-2013-court-001.pdf
6. ^http://saffron.insight-centre.org/
7. ^https://code.google.com/p/tesseract-ocr/
8. ^Open Researcher and Contributor ID.
9. ^http://www.searchtools.com/tools/swish.html
10. ^Multilingual Europe Technology Alliance Network.
11. ^“Epicene” means that the given name is gender ambiguous.
12. ^Keynote papers are not always taken into account if they were not included in the conference programs or proceedings.
13. ^http://en.wikipedia.org/wiki/Collaboration_graph
14. ^http://scholar.google.com/citations?view_op=top_venues&hl=en&vq=eng_computationallinguistics
References
Auber, D., Archambault, D., Bourqui, R., Lambert, A., Mathiaut, M., Mary, P., et al. (2012). The Tulip 3 Framework: A Scalable Software Library for Information Visualization Applications Based on Relational Data. Research Report, RR-7860. Available online at: http://hal.archives-ouvertes.fr/hal-00659880
Banchs, R. E. (2012). Proceedings of the ACL-2012 Special Workshop on Rediscovering 50 Years of Discoveries Association for Computational Linguistics 2012 Jeju, Korea. Available online at: https://aclanthology.coli.uni-saarland.de/papers/W12-3200/w12-3200
Bavelas, A. (1950). Communication patterns in task oriented groups. J. Acoust. Soc. Am. 22, 271–282.
Bird, S., Dale, R., Dorr, B. J., Gibson, B., Joseph, M. T., Kan, M.-Y., et al. (2008). “The ACL Anthology Reference Corpus: A Reference Dataset for Bibliographic Research in Computational Linguistics,” in Proceedings of LREC 2008 (Marrakesh), May 2008.
Bordea, G., Buitelaar, P., and Coughlan, B. (2014). “Hot topics and schisms in NLP: community and trend analysis with saffron on ACL and LREC proceedings,” in Proceedings of LREC 2014 (Reykjavik), May 2014.
Boudin, F. (2013). “TALN archives: une archive numérique francophone des articles de recherche en traitement automatique de la langue,” in TALN-RÉCITAL 2013 (Les Sables d'Olonne).
Councill, I. G., Giles, C., and Kan, M.-Y. (2008). “ParsCit: an open-source CRF reference string parsing package,” in Proceedings of LREC 2008 (Marrakesh).
Csárdi, G., and Nepusz, T. (2006). The igraph software package for complex network research. InterJournal 2006. Complex Syst. 1695, 1–9. Available online at: http://igraph.org
Ding, Y., Rousseau, R., and Wolfram, D. (eds.). (2014). Measuring Scholarly Impact. Springer. doi: 10.1007/978-3-319-10377-8
Dunne, C., Shneiderman, B., Gove, R., Klavans, J., and Dorr, B. (2012). Rapid understanding of scientific paper collections: integrating statistics, text analytics, and visualization. J. Am. Soc. Inf. Sci. Technol. 63, 2351–2369. doi: 10.1002/asi.22652
Francopoulo, G. (2008). “TagParser: well on the way to ISO-TC37 conformance,” in ICGL (International Conference on Global Interoperability for Language Resources) (Hong Kong).
Francopoulo, G., Marcoul, F., Causse, D., and Piparo, G. (2013). “Global atlas: proper nouns, from wikipedia to LMF,” in LMF-Lexical Markup Framework, ed G. Francopoulo (ISTE/Wiley), 227–241.
Francopoulo, G., Mariani, J., and Paroubek, P. (2015a). “NLP4NLP: the cobbler's children won't go unshod,” in 4th International Workshop on Mining Scientific Publications (WOSP2015), Joint Conference on Digital Libraries 2015 (JCDL 2015) (Knoxville).
Francopoulo, G., Mariani, J., and Paroubek, P. (2015b). “NLP4NLP: applying NLP to written and spoken scientific NLP corpora,” in Workshop on Mining Scientific Papers: Computational Linguistics and Bibliometrics, 15th International Society of Scientometrics and Informetrics Conference (ISSI 2015) (Istanbul).
Francopoulo, G., Mariani, J., and Paroubek, P. (2016). “Text mining for notability computation,” in Cross-Platform Text Mining and Natural Language Processing Interoperability Workshop, LREC 2016, Tenth International Conference on Language Resources and Evaluation (PortoroŽ).
Freeman, L. C. (1978). Centrality in social networks, conceptual clarifications. Soc. Netw. 1, 215–239. doi: 10.1016/0378-8733(78)90021-7
Fu, Y., Xu, F., and Uszkoreit, H. (2010). “Determining the origin and structure of person names,” in Proceedings of LREC 2010 (Valletta).
Fujisaki, H. (2013). History of ICSP and PC-ICSLP, ISCA Web site – About ISCA – History. Available online at: http://www.isca-speech.org/iscaweb/index.php/about-isca/history
Gollapalli, S. D., and Li, X.-L. (2015). “EMNLP versus ACL: analyzing NLP research over time,” in EMNLP 2015 (Lisbon), (September 17–21, 2015).
Jha, R., Jbara, A.-A., Qazvinian, V., and Radev, D. R. (2016). NLP-driven citation analysis for scientometrics. Nat. Lang. Eng. 23, 93–130. doi: 10.1017/S1351324915000443
Joerg, B., Höllrigl, T., and Sicilia, M.-A. (2012). “Entities and identities in research information systems,” in 11th International Conference on Current Research Information Systems (CRIS2012): “e-Infrastructures for Research and Innovation: Linking Information Systems to Improve Scientific Knowledge Production” (Prague).
Li, H., Councill, I. G., Lee, W. C., and Giles, C. (2006). “CiteSeerx: an architecture and web service design for an academic document search engine,” in Proceedings of the 15th Int. Conference on the World Wide Web (Edinburgh). (May 23–26, 2006).
Litchfield, B. (2005). Making PDFs Portable: Integrating PDF and Java Technology, March 24, 2005. Java Developers Journal. Available online at: http://java.sys-con.com/node/48543 (PDFBox is available at: http://pdfbox.apache.org/).
Mariani, J. (1990). La Conférence IEEE-ICASSP de 1976 à 1990: 15 ans de recherches en Traitement Automatique de la Parole, Notes et Documents LIMSI 90-8.
Mariani, J. (2013). The ESCA Enterprise, ISCA Web site – About ISCA – History. Available online at: http://www.isca-speech.org/iscaweb/index.php/about-isca/history
Mariani, J., Cieri, C., Francopoulo, G., Paroubek, P., and Delaborde, M. (2014b). “Facing the identification problem in language-related scientific data analysis,” in Proceedings of LREC 2014 (Reykjavik).
Mariani, J., Francopoulo, G., Paroubek, P., and Vernier, F. (2017). “Rediscovering 50 years of discoveries in speech and language processing: a survey,” in Oriental Cocosda Conference (Seoul: IEEE XPlore).
Mariani, J., Francopoulo, G., Paroubek, P., and Vetulani, Z. (2015). “Rediscovering 10 to 20 years of discoveries in language & technology,” in Proceedings of L&TC 2015 (Poznan).
Mariani, J., Francopoulo, G., Paroubek, P., and Vernier, F. (2018). The NLP4NLP Corpus (II): 50 Years of Research in Speech and Language Processing. Front. Res. Metr. Anal. 3:37. doi: 10.3389/frma.2018.00037
Mariani, J., Paroubek, P., Francopoulo, G., and Delaborde, M. (2013). “Rediscovering 25 years of discoveries in spoken language processing: a preliminary ISCA archive analysis,” in Proceedings of Interspeech 2013 (Lyon).
Mariani, J., Paroubek, P., Francopoulo, G., and Hamon, O. (2014a). “Rediscovering 15 years of discoveries in language resources and evaluation: the LREC anthology analysis,” in Proceedings of LREC 2014 (Reykjavik).
Mariani, J., Paroubek, P., Francopoulo, G., and Hamon, O. (2016). Rediscovering 15 + 2 years of discoveries in language resources and evaluation. Lang. Resour. Eval. J. 50, 1–56. doi: 10.1007/s10579-016-9352-9
Osborne, F., Motta, E., and Mulholland, P. (2013). “Exploring scholarly data with rexplore,” in International Semantic Web Conference (Sydney, NSW).
Radev, D. R., Muthukrishnan, P., Qazvinian, V., and Abu-Jbara, A. (2013). The ACL anthology network corpus. Lang. Resour. Eval. 47, 919–944. doi: 10.1007/s10579-012-9211-2
Rochat, Y. (2009). “Closeness centrality extended to unconnected graphs: the harmonic centrality index,” in Applications of Social Network Analysis (ASNA) (Zurich).
Tang, J., Zhang, J., Yao, L., Li, J., Zhang, L., and Su, Z. (2008). “ArnetMiner: extraction and mining of academic social networks,” in Proceeding of the 14th Int. Conference on Knowledge Discovery and Data Mining (Las Vegas, NV) (August 24-27, 2008).
The R Journal (2012). Available online at: http://journal.r-project.org/
Vogel, A., and Jurafsky, D. (2012). “He said, she said: gender in the ACL anthology,” in Proceedings of the ACL-2012 Special Workshop on Rediscovering 50 Years of Discoveries (ACL'12) (Stroudsburg, PA: Association for Computational Linguistics), 33–41.
Appendix
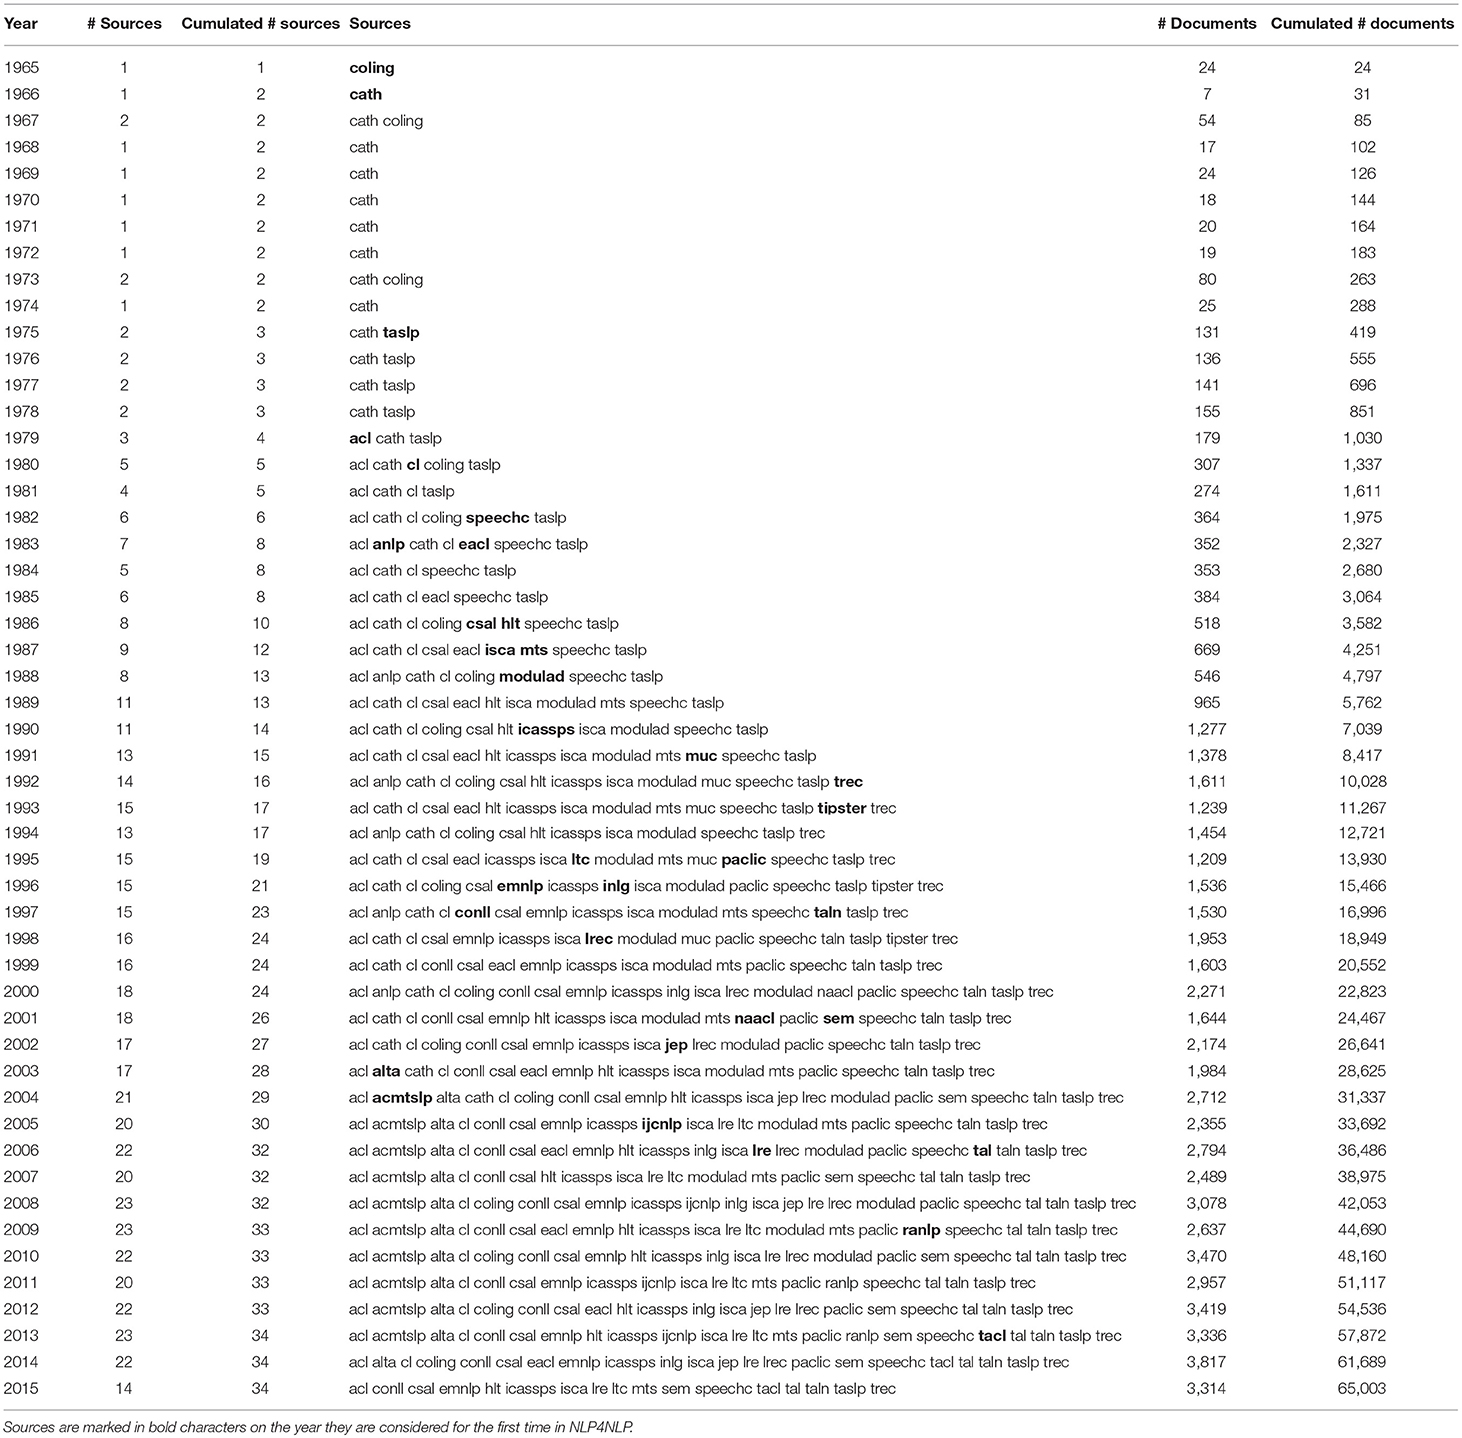
Table A1. List of sources with number of papers.
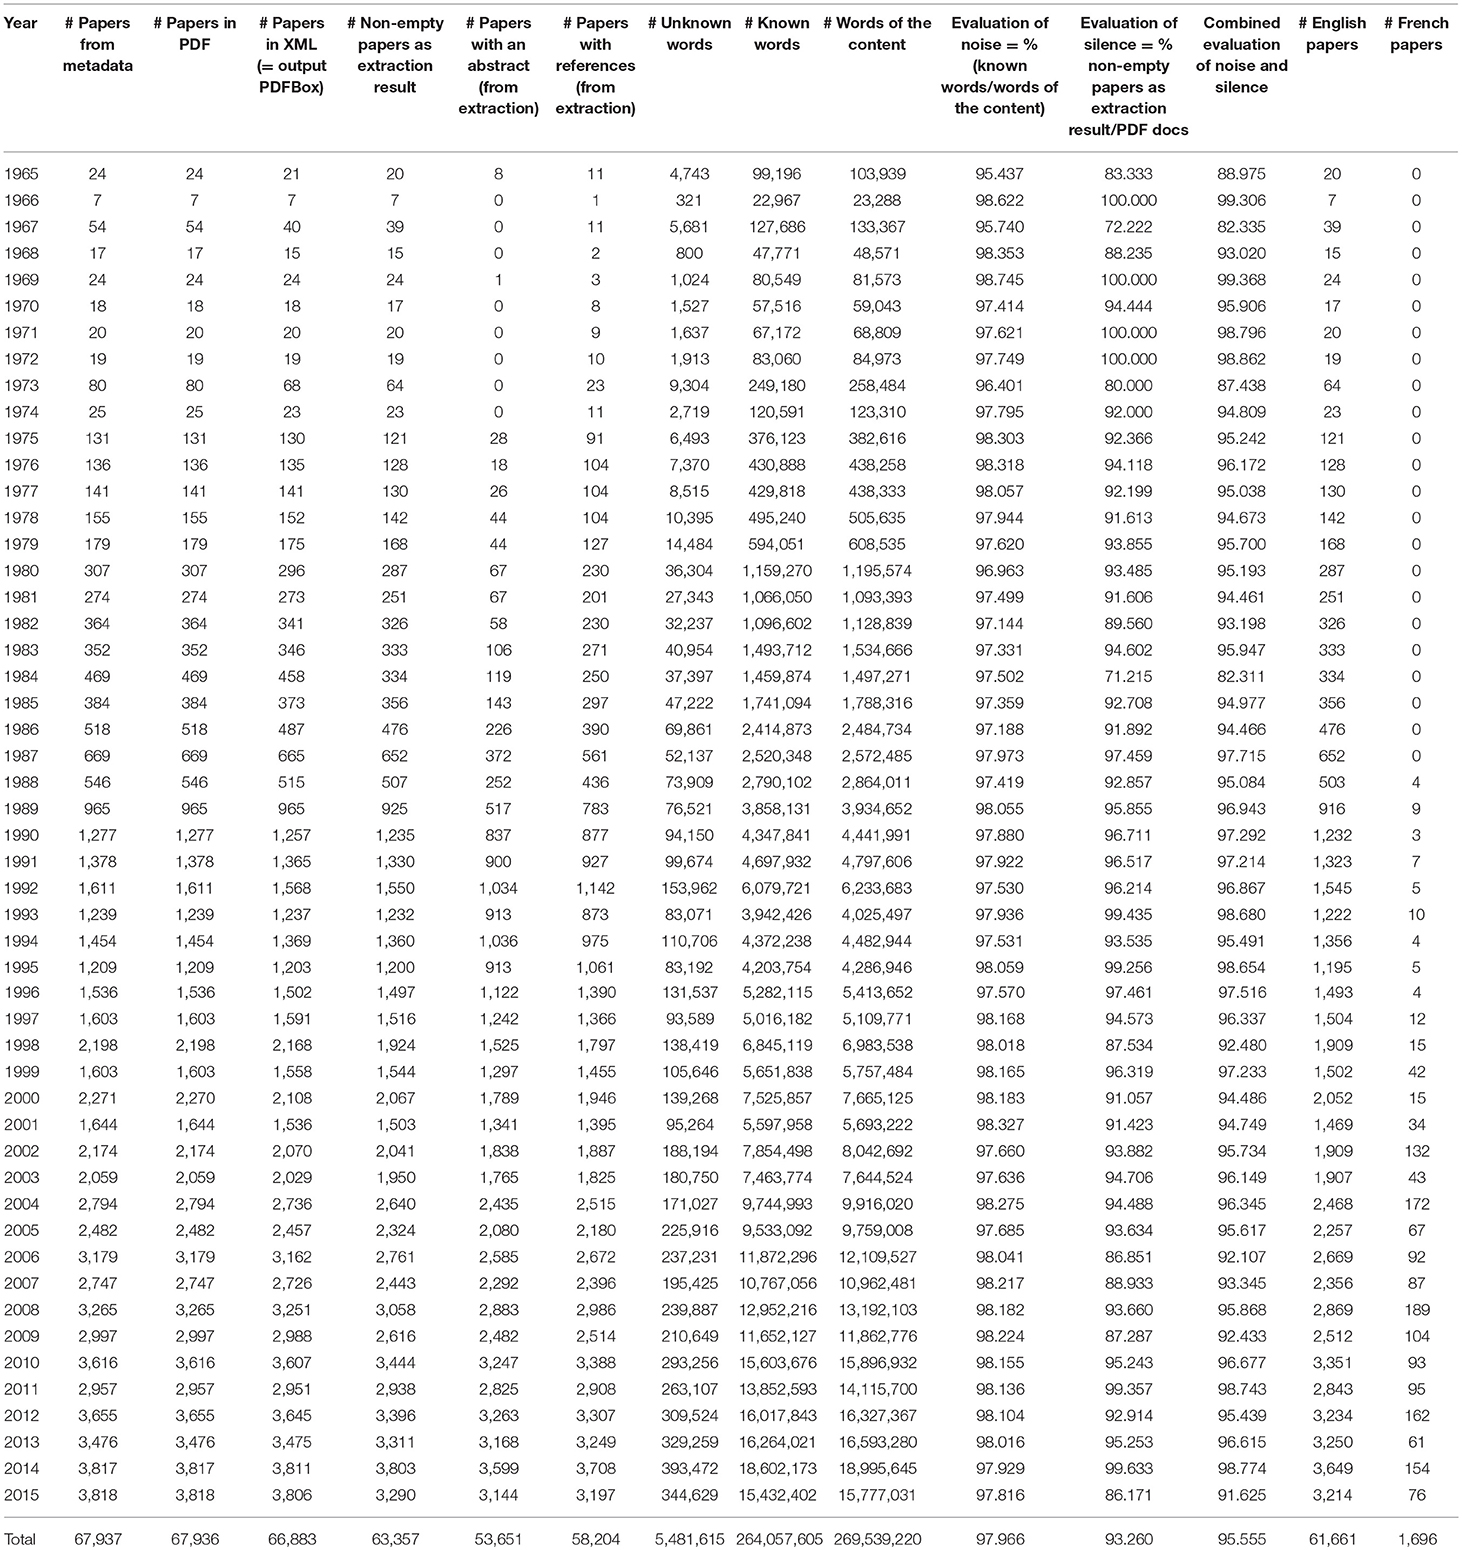
Table A2. Quantity and quality of data.
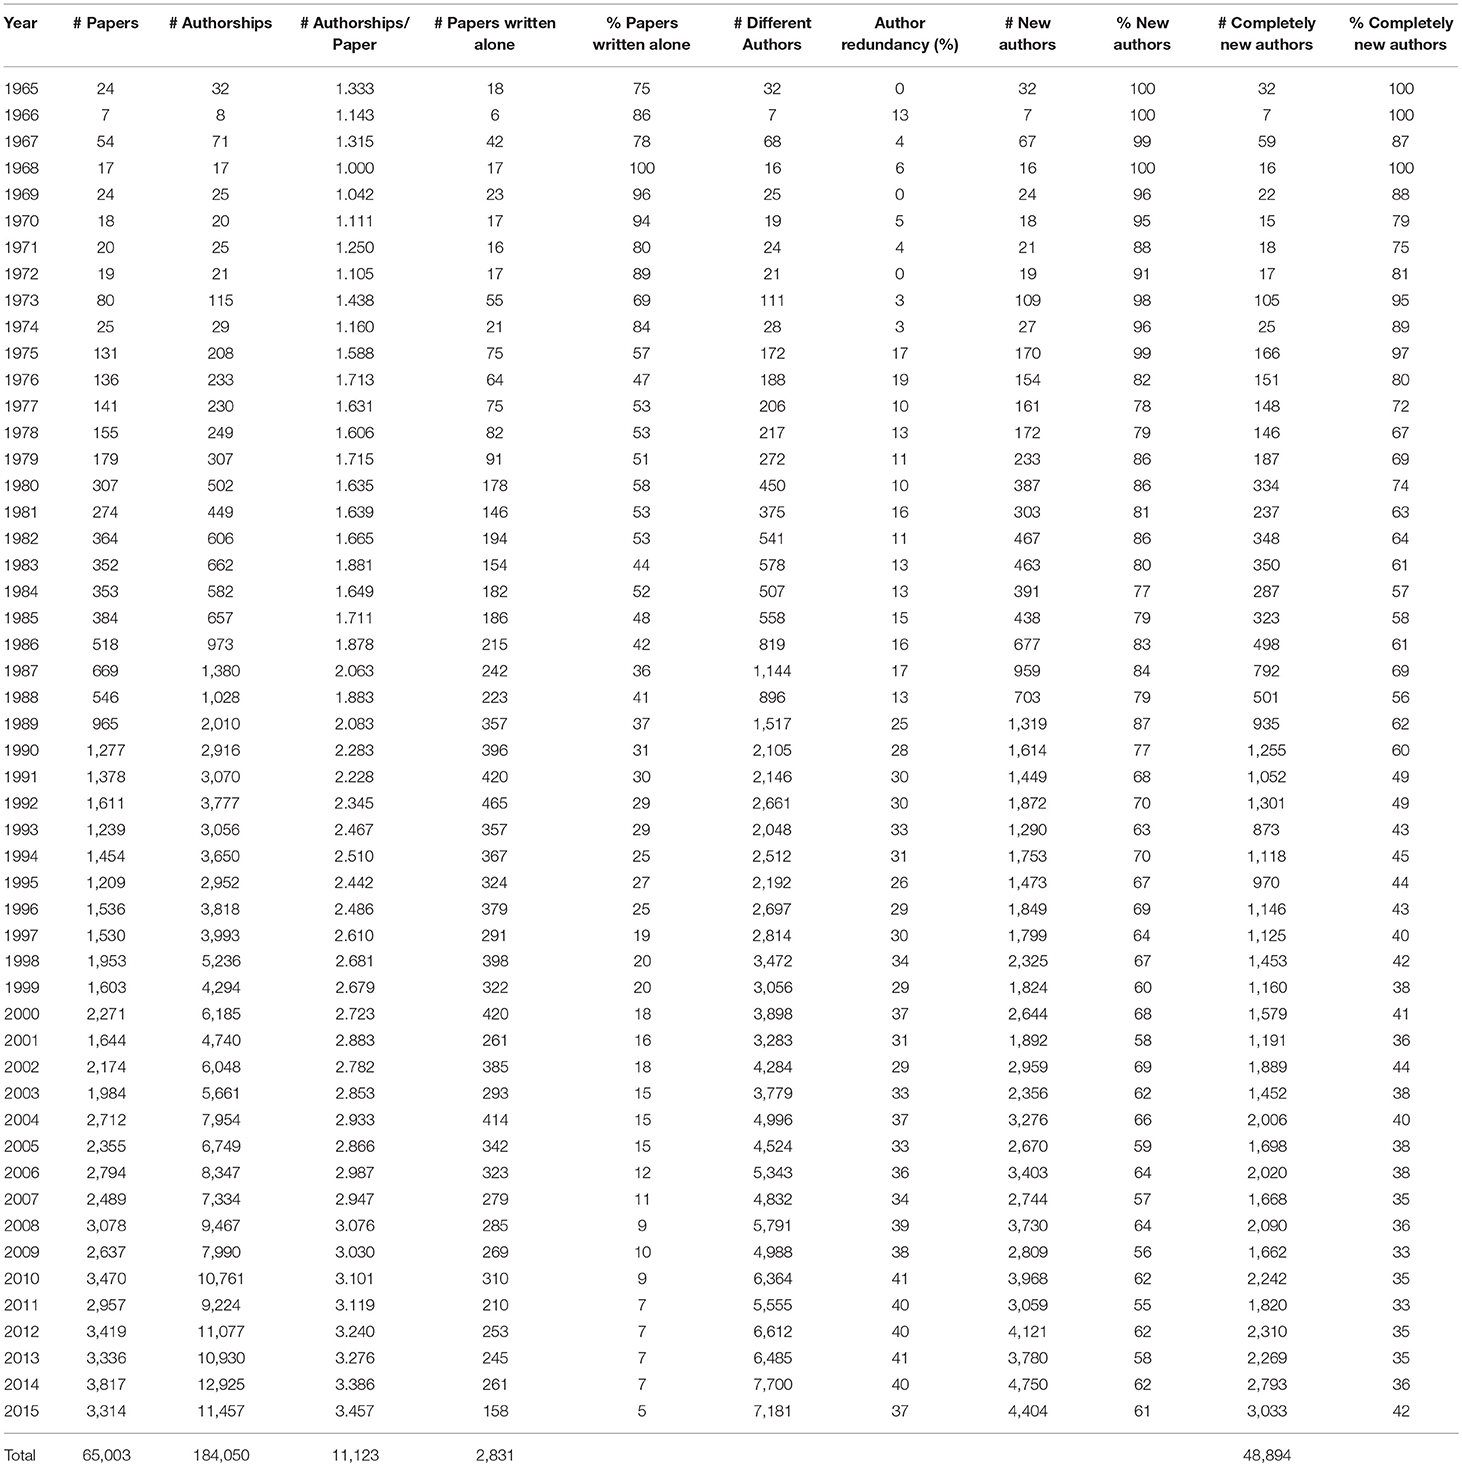
Table A3. Authors' renewal and redundancy.
Keywords: speech processing, natural language processing, text analytics, bibliometrics, scientometrics, informetrics
Citation: Mariani J, Francopoulo G and Paroubek P (2019) The NLP4NLP Corpus (I): 50 Years of Publication, Collaboration and Citation in Speech and Language Processing. Front. Res. Metr. Anal. 3:36. doi: 10.3389/frma.2018.00036
Received: 30 January 2018; Accepted: 07 December 2018;
Published: 07 February 2019.
Edited by:
Iana Atanassova, Université Bourgogne Franche-Comté, FranceReviewed by:
Gérald Kembellec, Conservatoire National des Arts et Métiers (CNAM), FranceDesfriches Doria Orelie, Université de Lyon, France
Copyright © 2019 Mariani, Francopoulo and Paroubek. This is an open-access article distributed under the terms of the Creative Commons Attribution License (CC BY). The use, distribution or reproduction in other forums is permitted, provided the original author(s) and the copyright owner(s) are credited and that the original publication in this journal is cited, in accordance with accepted academic practice. No use, distribution or reproduction is permitted which does not comply with these terms.
*Correspondence: Joseph Mariani, am9zZXBoLm1hcmlhbmlAbGltc2kuZnI=