 Joseph Mariani
 Gil Francopoulo
 Patrick Paroubek
 Frédéric Vernier1
- 1LIMSI-CNRS, Université Paris-Saclay, Orsay, France
- 2Tagmatica, Paris, France
The NLP4NLP corpus contains articles published in 34 major conferences and journals in the field of speech and natural language processing over a period of 50 years (1965–2015), comprising 65,000 documents, gathering 50,000 authors, including 325,000 references and representing ~270 million words. This paper presents an analysis of this corpus regarding the evolution of the research topics, with the identification of the authors who introduced them and of the publication where they were first presented, and the detection of epistemological ruptures. Linking the metadata, the paper content and the references allowed us to propose a measure of innovation for the research topics, the authors and the publications. In addition, it allowed us to study the use of language resources, in the framework of the paradigm shift between knowledge-based approaches and content-based approaches, and the reuse of articles and plagiarism between sources over time. Numerous manual corrections were necessary, which demonstrated the importance of establishing standards for uniquely identifying authors, articles, resources or publications.
This work is composed of two parts, of which this is part II. Please read also part I (Mariani et al., 2018b).
Introduction
Preliminary Remarks
The aim of this study was to investigate a specific research area, namely Natural Language Processing (NLP), through the related scientific publications, with a large amount of data and a set of tools, and to report various findings resulting from those investigations. The study was initiated by an invitation of the Interspeech 2013 conference organizers to look back at the conference content on the occasion of its 25th anniversary. It was then followed by similar invitations at other conferences, by adding new types of analyses and finally by extending the data to many conferences and journals over a long time period. We would like to provide elements that may help answering questions such as: What are the most innovative conferences and journals? What are the most pioneering and influential ones? How large is their scope? How are structured the corresponding communities? What is the effect of the language of a publication? Which paradigms appeared and disappeared over time? Were there any epistemological ruptures? Is there a way to identify weak signals of an emerging research trend? Can we guess what will come next? What were the merits of authors in terms of paper production and citation, collaboration activities and innovation? What is the use of Language Resources in research? Do authors plagiarize each other? Do they publish similar papers in the same or in different conferences and journals? The results of this study are presented in two companion papers. The former one (Mariani et al., 2018b) introduces the corpus with various analyses: evolution over time of the number of papers and authors, including their distribution by gender, as well as collaboration among authors and citation patterns among authors and papers. In the present paper, we will consider the evolution of research topics over time and identify the authors who introduced and mainly contributed to key innovative topics, the use of Language Resources over time and the reuse of papers and plagiarism within and across publications. We provide both global figures corresponding to the whole data and comparisons of the various conferences and journals among those various dimensions. The study uses NLP methods that have been published in the corpus considered in the study, hence the name of the corpus. In addition to providing a revealing characterization of the speech and language processing community, the study also demonstrates the need for establishing a framework for unique identification of authors, papers and sources in order to facilitate this type of analysis, which presently requires a heavy manual checking.
The NLP4NLP Corpus
In the previous paper (Mariani et al., 2018b), we introduced the NLP4NLP corpus. This corpus contains articles published in 34 major conferences and journals in the field of speech and natural language processing over a period of 50 years (1965–2015), comprising 65,000 documents, gathering 50,000 authors, including 325,000 references and representing ~270 million words. Most of these publications are in English, some are in French, German or Russian. Some are open access, others have been provided by the publishers.
This paper establishes the link between the different types of information that were introduced in the previous paper and that are contained in NLP4NLP. It presents an analysis of the evolution of the research topics with the identification of the authors who introduced them and of the publication where they were first presented and the detection of epistemological ruptures. Linking the metadata, the paper content and the references allowed us to propose a measure of innovation for the research topics, the authors and the publications. In addition, it allowed us to study the use of language resources, in the framework of the paradigm shift between knowledge-based approaches and content-based approaches, and the reuse of articles and plagiarism between sources over time. Numerous manual corrections were necessary, which demonstrated the importance of establishing standards for uniquely identifying authors, articles, resources or publications.
Analysis of the NLP4NLP Corpus
Topics
Archive Analysis
Modeling the topics of a research field is a challenge in NLP (see e.g., Hall et al., 2008; Paul and Girju, 2009). Here, our objectives were two-fold: (i) to compute the most frequent terms used in the domain, (ii) to study their variation over time. Like the study of citations, our initial input is the textual content of the papers available in a digital format or that had been scanned. Over these 50 years, the archives contain a grand total of 269,539,220 words, mostly in English.
Because our aim is to study the terms of the NLP domain, it was necessary to avoid noise from phrases that are used in other senses in the English language. We therefore adopted a contrastive approach, using the same strategy implemented in TermoStat (Drouin, 2004). For this purpose, as a first step, we processed a vast number of English texts that were not research papers in order to compute a statistical language profile. To accomplish this, we applied a deep syntactic parser called TagParser1 to produce the noun phrases in each text. For each sentence, we kept only the noun phrases with a regular noun as a head, thus excluding the situations where a pronoun, date, or number is the head. We retained the various combinations of sequence of adjectives, prepositions and nouns excluding initial determiners using unigrams, bigrams and trigrams sequences and stored the resulting statistical language model. This process was applied on a corpus containing the British National Corpus (aka BNC)2, the Open American National Corpus (aka OANC3) (Ide et al., 2010), the Suzanne corpus release-54, the English EuroParl archives (Koehn, 2005) (years 1999 until 2009)5, plus a small collection of newspapers in the domain of sports, politics and economy, comprising a total of 200 M words. It should be noted that, in selecting this corpus, we took care to avoid any texts dealing with NLP.
Terms Frequency and Presence
In a second step, we parsed the NLP4NLP corpus with the same filters and used our language model to distinguish SNLP-specific terms from common ones. We worked from the hypothesis that when a sequence of words is inside the NLP4NLP corpus and not inside the general language profile, the term is specific to the field of SNLP. The 67,937 documents reduce to 61,661 documents when considering only the papers written in English. They include 3,314,671 different terms (unigrams, bigrams and trigrams) and 23,802,889 term occurrences, provided that this number counts all the occurrences of all the sizes and does not restrict to the longest terms, thus counting a great number of overlapping situations between fragments of texts.
The 500 most frequent terms in the field of SNLP were computed over the period of 50 years, according to the following strategy. First, the most frequent terms were computed in a raw manner, and secondly the synonyms sets (aka synsets) for all most 200 frequent terms of each year (which are frequently the same from 1 year to another) were manually declared in the lexicon of TagParser. Around the term synset, we gathered the variation in upper/lower case, singular/plural number, US/UK difference, abbreviation/expanded form and absence/presence of a semantically neutral adjective, like “artificial” in “artificial neural network.” Thirdly, the most frequent terms were recomputed with the amended lexicon. We will call “existence”6 the fact that a term exists in a document and “presence” the percentage of documents where the term exists. We computed in that way the occurrences, frequencies, existences and presences of the terms globally and over time (1965–2015), and the average number of occurrences of the terms in the documents where they exist (Table 1).
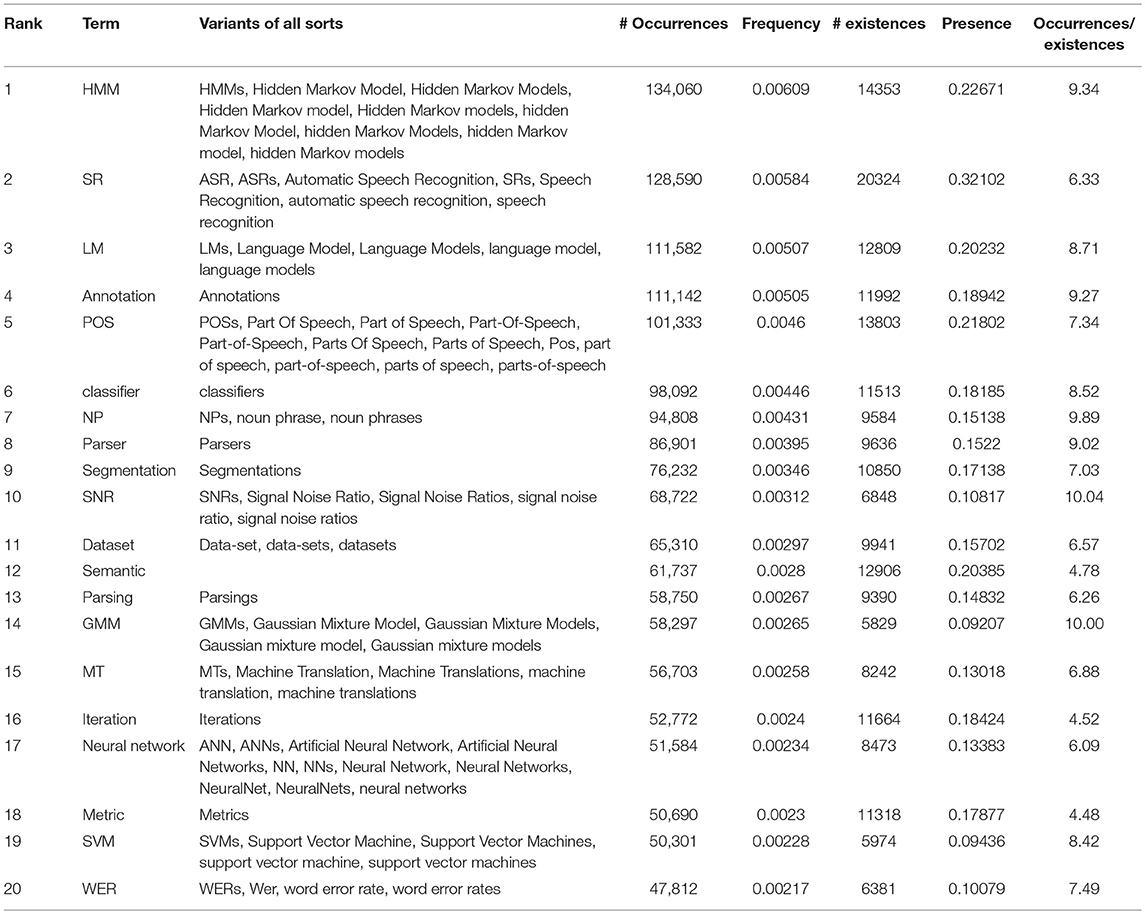
Table 1. Twenty most frequent terms overall, with number of occurrences and existences, frequency and presence.
The ranking of the terms slightly differs whether we consider the frequency or the presence. The most frequent term overall is “HMM” (Hidden Markov Models), while the most present term is “Speech Recognition,” which is present in 32% of the papers.
The average number of occurrences of the terms in the documents where they exist varies a lot (from 10 for “Signal/Noise ratio” or “Gaussian Mixture Models” to 4.5 for “metric”).
Change in Topics
We studied the evolution over the years among the 200 yearly most popular terms (mixing unigrams, bigrams, and trigrams) representing the corresponding topics of interest, according to their ranking, based on their frequency or presence. We developed for this a visualization tool7 that allows to play with various parameters related to data selection [use of frequency or presence, type of ranking (raw or proportional to frequency or to presence), use and importance of smoothing, covered time period, number of topics per year (from 10 to 200)] and data visualization (size and colors of the boxes and links, selection of topics, etc.) (Perin et al., 2016) (Figure 1). The raw figure is poorly readable, but focusing on specific terms depicts clear trends as it appears in Figures 2–6.
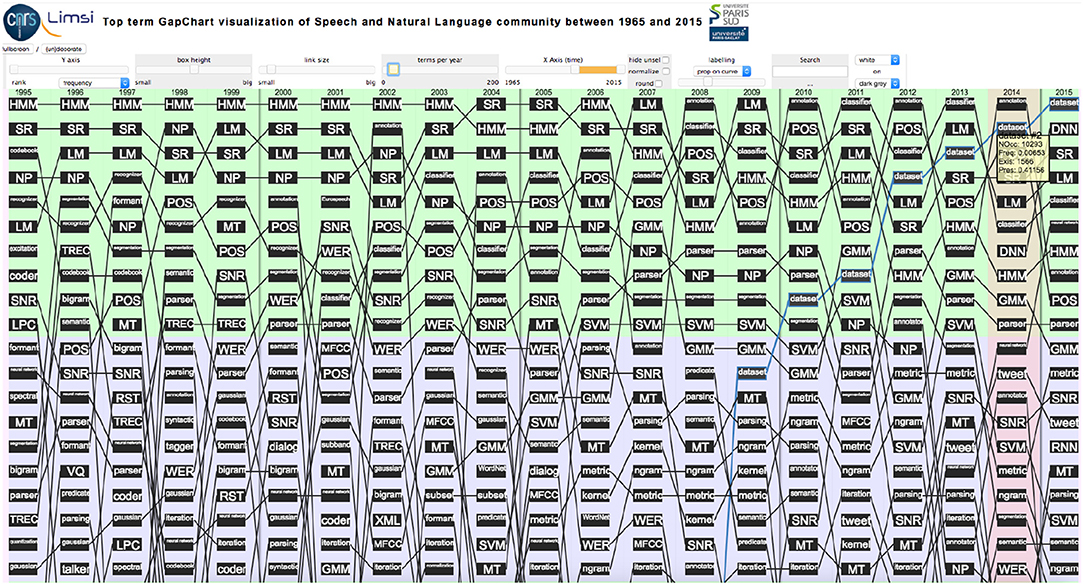
Figure 1. Evolution of the top 20 terms over 20 years (1996–2015) according to their frequency (raw ranking without smoothing. The yellow box indicates the number of Occurrences, Frequency, Number of Existences and Presence of the term “Dataset” ranked 2nd in 2014).
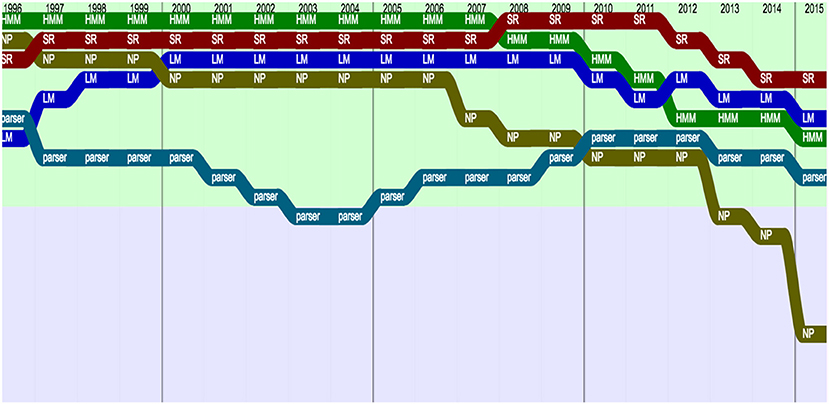
Figure 2. Topics remaining popular (raw ranking, according to Frequency with smoothing).
We see that some terms remained popular, such as “HMM,” “Speech recognition,” “Language Model,” “Noun Phrase” or “Parser,” which stayed in the top 20 terms over 20 years from 1996 to 2015 (Figure 2).
We also studied several terms that became more popular over time, such as “Annotation” and “Wordnet,” which gained a lot of popularity in 1998 when the first LREC was organized, “Gaussian Mixture Models (GMM)” and “Support Vector Machines (SVM),” “Wikipedia,” and, recently, “Dataset,” “Deep Neural Networks (DNN)” blooming in the top 40 terms in 2013 and “Tweet” blooming in the top 20 in 2011 (Figure 3).
Figure 3. Topics becoming popular (raw ranking, according to Frequency with smoothing).
Among terms losing popularity, we may find “Codebook,” “Covariance,” and “Linear Prediction Coding (LPC),” which disappeared from the top 50 terms in 2005 (Figure 4).
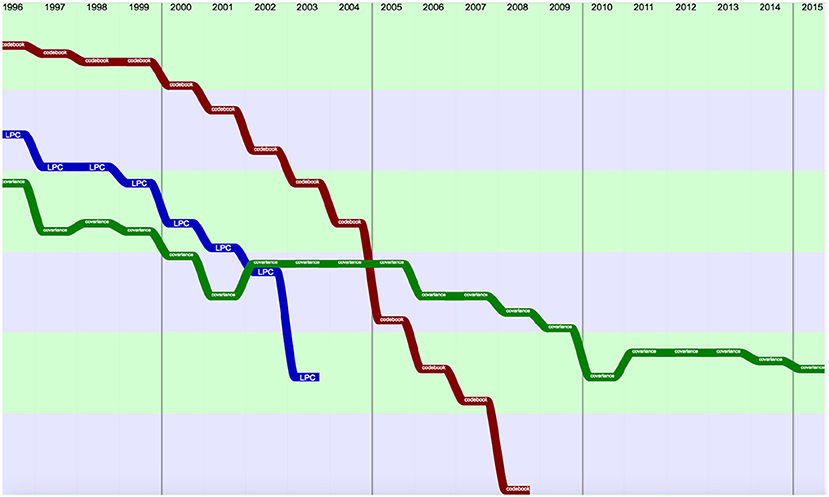
Figure 4. Topics losing popularity (raw ranking, according to Frequency with smoothing).
We also studied the changes in the use of some related terms, such as “bigram” and “trigram” that were clearly replaced by “Ngram” (Figure 5).
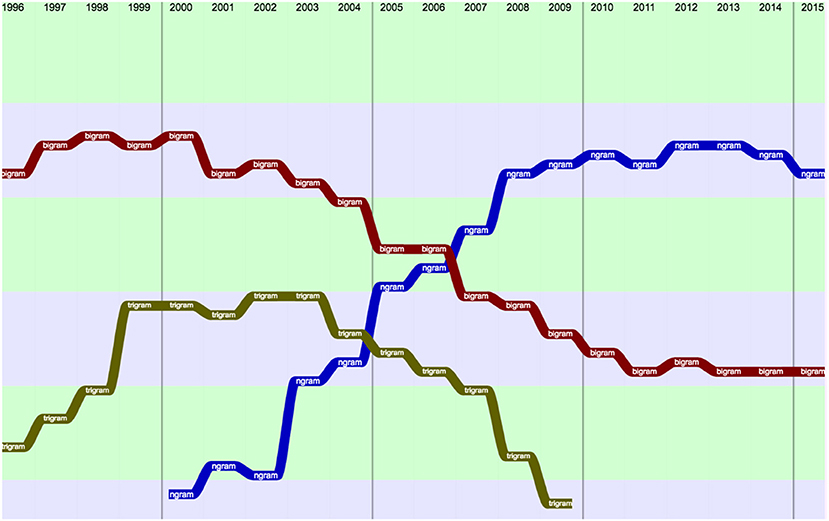
Figure 5. Comparison of bigram, trigram, and Ngram over 20 years (raw ranking, according to Frequency with smoothing).
We compared the evolution of HMM and Neural Networks over 20 years, in terms of presence (% of papers containing the term) (Figure 6). We see a spectacular return of interest for “Neural Networks” starting in 2012.
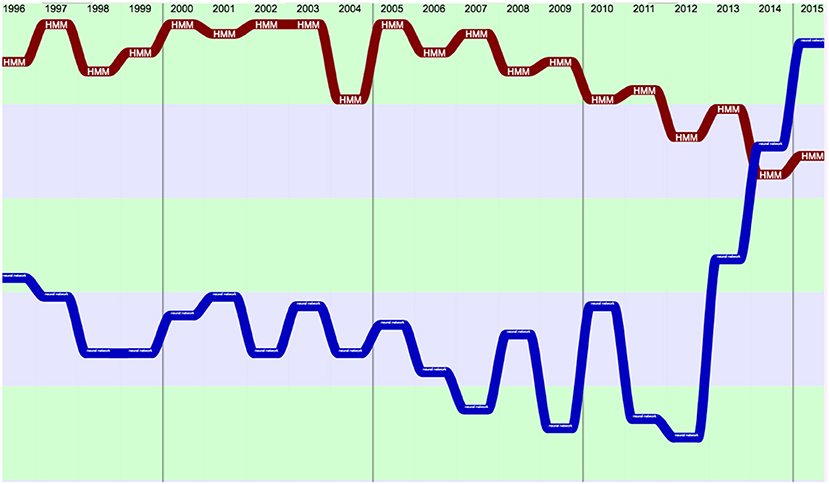
Figure 6. Comparison of HMM and neural networks over 20 years (raw ranking, according to presence).
Tag Clouds for Frequent Terms
The aim of Tag Clouds is to provide a global estimation of the main terms used in over the years as well as an indication of the stability of the terms over the years. For this purpose, we use TagCrowd8 to generate Tag Clouds and we only considered the papers' abstracts.
Figure 7 shows the tag clouds in 10 years intervals from 1965 to 2015. Globally, it appears that the most frequent terms changed over the years. In 1965, only COLING is considered. Most of the terms concerned computation. In 1975, only Computer and the Humanities and the IEEE Transactions on Acoustics, Speech and Signal Processing are considered. The Tag Cloud still shows a large presence of generic terms, but also of terms attached to audio processing. In 1985, the number of sources is larger and more diversified. The interest for parsing is clear. HMM, and especially discrete models, appear neatly in 1995 together with speech recognition and quantization, while in NLP, TEI (Text Encoding Initiative), SGML (Standard Generalized Markup Language), and MT are mentioned. The year 2005 shows the growing interest for Language Resources (Annotation) and for evaluation (metric, WER), while MT is increasing and GMM stands next to HMM. 2015 is the year of neural networks [DNN (Deep Neural Networks), RNN (Recurrent Neural Networks)] together with data (Dataset). Speech Recognition (SR) stayed popular since 1995, while Parsing comes back to the forefront.
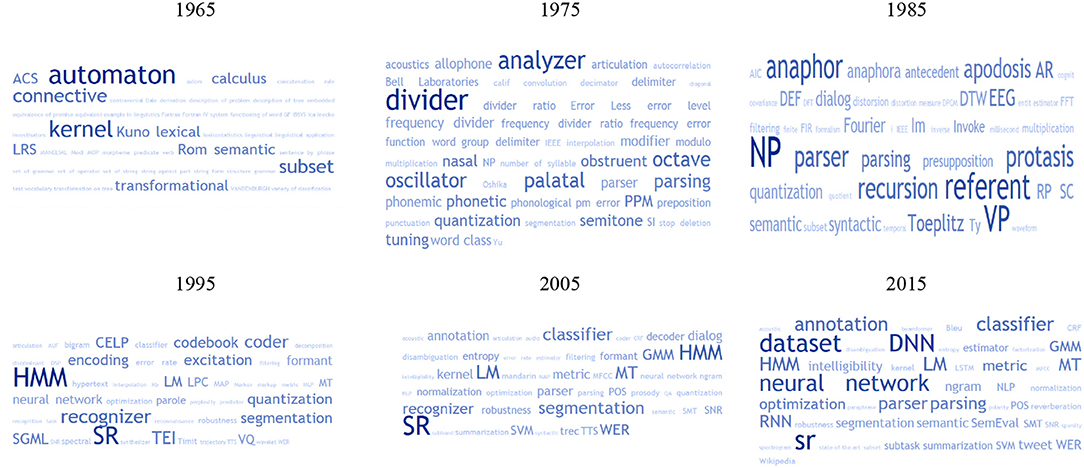
Figure 7. Tag cloud based on the abstracts from 1965 to 2015.
Research Topic Prediction
Machine Learning for Time Series Prediction
We also explored the feasibility of predicting the research topics for the coming years based on the past (Francopoulo et al., 2016a). We used for this the Weka9 machine learning software package (Witten et al., 2011). We applied each of the 21 algorithms contained in Weka to the time series of terms up to 2014 ordered according to their frequency and retained the one which provided the best results with the corresponding set of optimal parameters (especially the past history time length), after a-posteriori verification on the observed 2015 data. We then applied this software to the full set of the NLP4NLP corpus, year by year.
Table 2 gives the ranking of the most frequent terms in 2013 and 2014 with their frequency, the topic predicted by the selected Weka algorithm for 2015 on the basis of the past rankings and the ranking actually observed in 2015. We see that the prediction is correct for the top term (“dataset”). The next predicted term was “annotation” which only appears at the 9th rank, probably due to the fact that LREC didn't take place in 2015. It is followed by “POS,” which actually appears at the 4th rank with a frequency close to the predicted one.
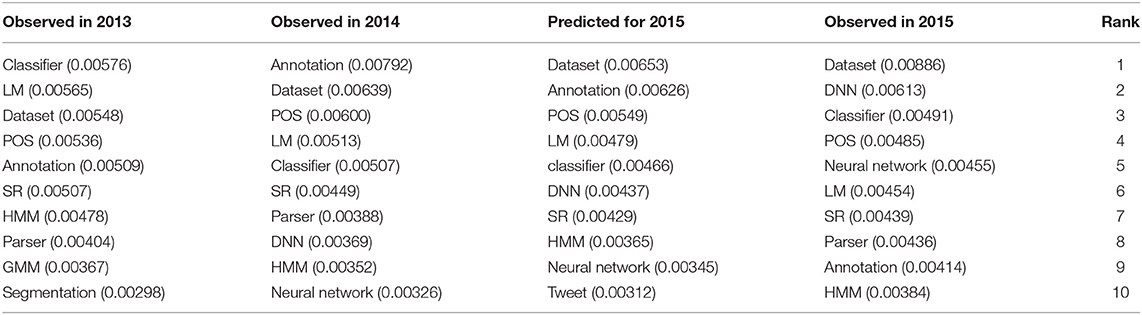
Table 2. Research topics prediction using the Weka software environment.
Prediction Reliability
As we have the information on the actual observations in the annual rankings, it is possible to measure the reliability of the predictions by measuring the distance between the predicted frequencies and the observed frequencies. Figure 8 gives this distance for the predictions in year 2011 to 2015 based on time series until 2010. We see that the distance largely increases in 2013, i.e., 3 years after the year of prediction. We may therefore think that it is not unreasonable to predict the future of a research domain within a 2-year horizon (unless a major discovery happens in the meanwhile…).
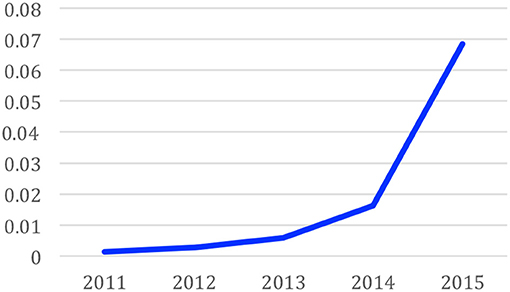
Figure 8. Reliability of the predictions: prediction error over the years from 2011.
Scientific Paradigms Ruptures
It is also possible to measure the difference between the prediction and the observation in each year. It provides a measure of the “surprise” between what we were expecting and what actually occurred. The years where this “surprise” is the largest may correspond to epistemological ruptures. Figure 9 gives the evolution of this distance between 2011 and 2015. We see that 2012 was a year of big changes.
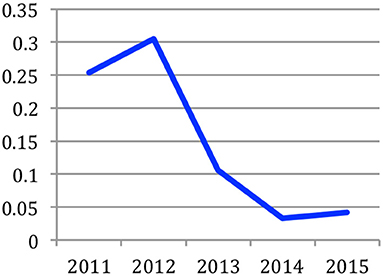
Figure 9. Evolution of the distance between prediction and observation over the years.
We may also compute this distance for a specific topic, in order to analyze the way this term evolves compared with what was expected. Figure 10 shows the evolution of the “Deep Neural Network” (DNN) topic. We see that up to 2014, we didn't expect the success of this approach in the next year, while, starting in 2014, it became part of the usual set of tools for automatic language processing.
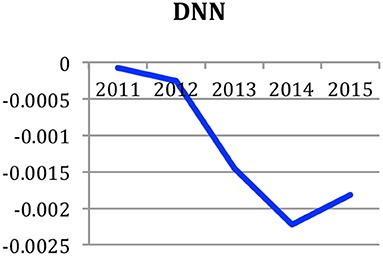
Figure 10. Measure of the expectation of an emerging research topic: Deep Neural Networks (DNN).
Predictions for the Next 5 Years
Table 3 provides the predictions for the next 5 years starting in 2016: not surprisingly, it is expected that Neural Networks, more or less deep and more or less recurrent, will keep on attracting the researchers' attention.
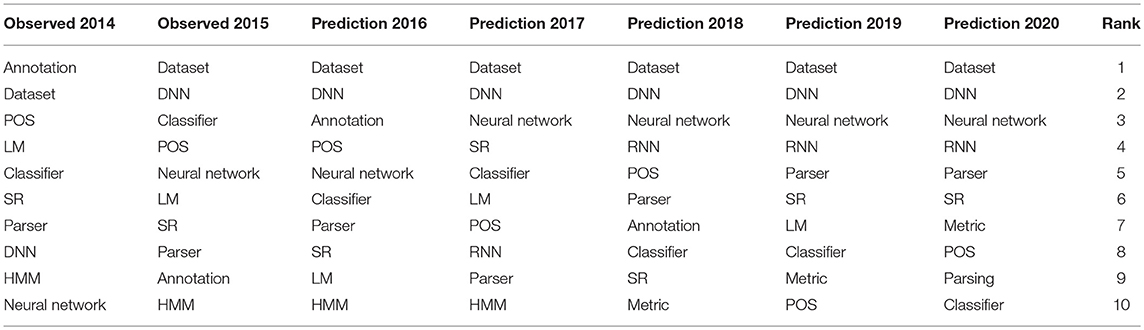
Table 3. Predictions for the next 5 years 2016–2020.
Innovation
New Terms Introduced by the Authors
We then studied when and who introduced new terms, as a mark of the innovative ability of various authors, which may also provide an estimate of their contribution to the advances of the scientific domain (Mariani et al., 2018a). We make the hypothesis that an innovation is induced by the introduction of a term which was previously unused in the community and then became popular. We consider the 61,661 documents written in English and the 42,278 authors who used the 3,314,671 terms contained in those documents. Two thousand and fifty-four of those terms are present in the 20 documents of the first year (1965), which we consider as the starting point for the introduction of new terms, while we find 333,616 of those terms in the 3,214 documents published in 2015.
We then take into account the terms that are of scientific interest (excluding author's names, unless they correspond to a specific algorithm or method, city names, laboratory names, etc.). For each of these terms, starting from 1965, we determine the author(s) who introduced the term, referred to as the “inventor(s)” of the term. This may yield several names, as the papers could be co-authored or the term could be mentioned in more than one paper on a given year.
Table A1 provides the ranked list of the 10 most popular terms according to their presence in 2015. The ranking of the terms slightly differs if we consider the frequency or the presence. The most frequent term in the archive according to Table 1, Hidden Markov Models (HMM), doesn't appear on Table A1 as it is ranked 16th in 2015. The most present term is Dataset, which appeared first in 1966, when it was mentioned in a single paper authored by L. Urdang10, while it was mentioned 14,039 times in 1,472 papers in 2015, and 65,250 times in 9,940 papers overall (i.e., in 16% of the papers!). From its first mention in the introduction of a panel session by Bonnie Lynn Webber at ACL11 in 1980 to 2015, the number of papers mentioning Neural Networks increased from 1 to 1037, and the number of occurrences reached 8,024 in 2015. Metric, Subset, Classifier, Speech Recognition, Optimization, Annotation, Part-of-Speech, and Language Model are other examples of terms that are presently most popular.
Measuring the Importance of Topics
We then considered the way to measure the importance of a term. Figure 11A gives an example of the annual presence (percentage of papers containing the term) for the term “cross validation,” which was encountered for the first time in 2 papers in 2000. In order to measure the success of the term over time, we may consider all papers or only those (“external papers” marked in red) that are written by authors who are different than those who introduced the term (marked in blue).
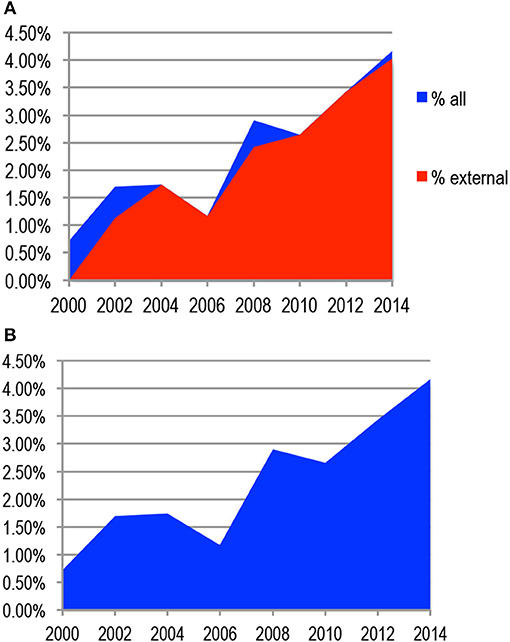
Figure 11. (A) Presence of the term “cross validation” over the years. (B) Innovation Score of the term “cross validation”.
We propose to compute as the annual innovation score of the term the presence of the term on that year (in this example, it went from 0.75% of the papers in 2000 to 4% of the papers in 2014) and to compute as the global innovation score of the term the corresponding surface, taking also into account the inventors' papers in the year of introduction and all the papers in the subsequent years (Figure 11B).
In this way, it takes into account the years when the term gains popularity (2000 to 2004, 2006 to 2008, and 2010 to 2014 in the case of “cross validation”), as well as those when it loses popularity (2004 to 2006 and 2008 to 2010). The innovation score for the term is the sum of the yearly presences of the term and amounts to 0.17 (17%). This approach emphasizes the importance of the term in the first years when it is mentioned, as the total number of papers is then lower. Some non-scientific terms may not have been filtered out, but their influence will be small as their presence is limited and random, while terms that became popular at some point in the past but lost popularity afterwards will remain in consideration.
We considered the 1,000 most frequent terms over the 50-year period, as we believe they contain most of the important scientific advances in the field of SNLP. Given the poor quality and low number of different sources and papers in the first years, we decided to only consider the period from 1975 to 2015. This innovation measure provides an overall ranking of the terms. We also computed separate rankings for NLP and for Speech (Table 4), based on the categorization of the sources.
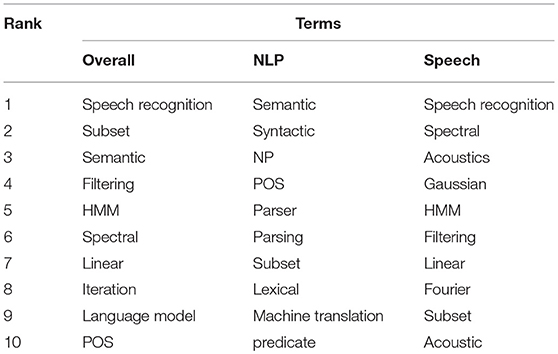
Table 4. Global ranking of the importance of the terms overall and separately for Speech and NLP.
We studied the evolution of the presence of the terms over the years, in order to check the changes in paradigm. However, the fact that some conferences are annual, while others are biennial brings noise, as we already observed when studying citations. Instead of considering the annual presence of the terms (percentage of papers containing a given term on a given year), we therefore considered the cumulative presence of the terms (percentage of papers containing a given term up to a given year) (Figure 12).
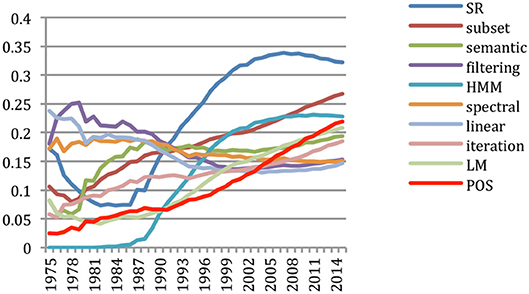
Figure 12. Cumulative presence of the 10 most important terms over time (% of all papers).
We see that Speech Recognition has been a very popular topic over the years, reaching a presence in close to 35% of the papers published up to 2008. Its shape coincides with Hidden Markov Models that accompanied the effort on Speech Recognition as the most successful method over a long period and had then been mentioned in close to 25% of the papers by that time. Semantic processing was a hot topic of research by the end of the 80's, and regained interest recently. Language Models and Part-of-Speech received continuing marks of interest over the years.
Measuring Authors' Innovation
We also computed in a similar way an innovation score for each author, illustrating his or her contribution in the introduction and early use of new terms that subsequently became popular. The score is computed as the sum over the years of the annual presence of the terms in papers published by the authors (percentage of papers containing the term and signed by the author on a given year). This innovation measure provided an overall ranking of the authors. We also computed separate rankings for NLP and for Speech Processing (Table 5).
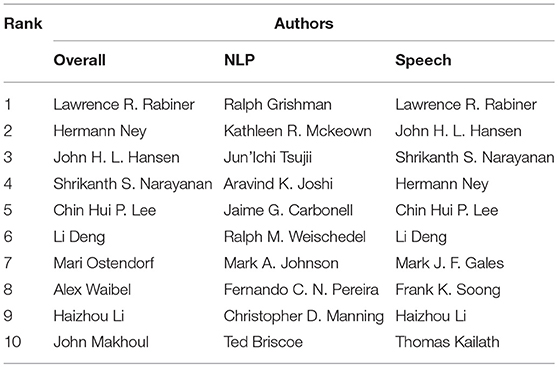
Table 5. Global ranking of authors overall and separately for Speech and NLP.
We should stress that this measure doesn't place on the forefront uniquely the “inventors” of a new topic, as it is difficult to identify them given that we only consider a subset of the scientific literature over a limited period. It rather helps identifying the early adopters who published a lot when or after the topic was initially introduced. We studied several cases where renowned authors don't appear within the 10 top authors contributing to those terms, such as F. Jelinek regarding Hidden Markov Models. The reason is that they initially published in a different research field than SNLP (the IEEE Transactions on Information Theory in the case of F. Jelinek, for example) that we don't consider in our corpus. This measure also reflects the size of the production of papers from the authors on emerging topics, with an emphasis on the pioneering most ancient authors, such as L. Rabiner and J. Makhoul, at a time when the total number of papers was low. The overall ranking also favors those who published both in Speech and Language Processing, such as H. Ney or A. Waibel.
We may study the domains where the authors brought their main contributions, and how it evolves over time. We faced the same problem due to the noise brought by the different frequency of the conferences as we did when studying the evolution of the terms, and we rather considered the cumulative contribution of the author specific to that term [percentage of papers signed by the author among the papers containing a given term (that we will call “topical papers”) up to a given year]. We see for example that L. Rabiner brought important early contributions to the fields of Acoustics, Signal Processing and Speech Recognition in general, and specifically to Linear Prediction Coding (LPC) and filtering (Figure 13). He even authored 30% of the papers dealing with LPC which were published up to 1976 and the only paper mentioning endpoint detection in 1975.
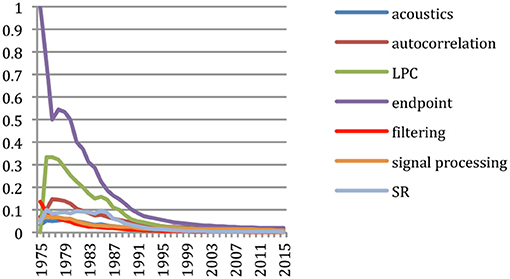
Figure 13. Main contributions areas for L. Rabiner (% of topical papers).
H. Ney brought important contributions to the study of perplexity (authoring 10% of the papers which were published on that topic up to 1988) and in Language Models (LM) using trigrams and bigrams (Figure 14).
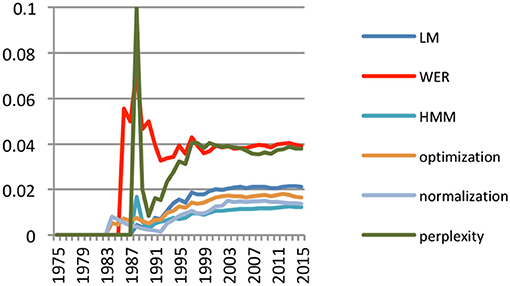
Figure 14. Main contribution areas for H. Ney (% of topical papers).
A. Waibel brought important contributions in the use of HMM and even more of Neural Networks for speech and language processing already in the early 90s (Figure 15).
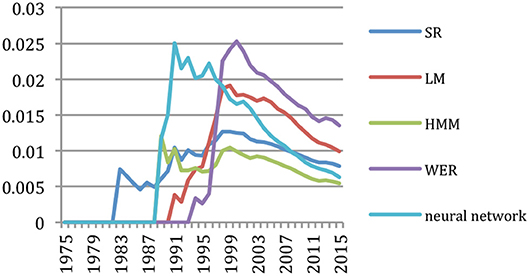
Figure 15. Main contribution areas for A. Waibel (% of topical papers).
We may also wish to study the contributions of authors on a specific topic, using the same cumulative score. Figure 16 provides the cumulative percentage of papers containing the term HMM published up to a given year by the 10 most contributing authors. We also added F. Jelinek as a well-known pioneer in that field and S. Levinson as the author of the first article containing that term in our corpus, which represented 0.4% of the papers published in 1982. We see the contributions of pioneers such as F. Soong, of important contributors in an early stage such as C. H. Lee, S. Furui, or K. Shikano or a later stage such as M. Gales.
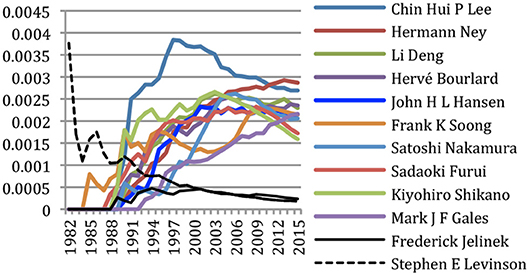
Figure 16. Authors' contributions to HMM in SNLP (% of all papers).
Similarly, we studied the authors' contributions to Deep Neural Networks (DNN) which recently gained a large audience (Figure 17). We see the strong contribution of Asian authors on this topic, with the pioneering contributions of Dong Yu and Li Deng up to 2012 where they represented altogether about 50% of the papers mentioning DNN since 2009, while Deliang Wang published later but with a large productivity which finally places him at the second rank globally.
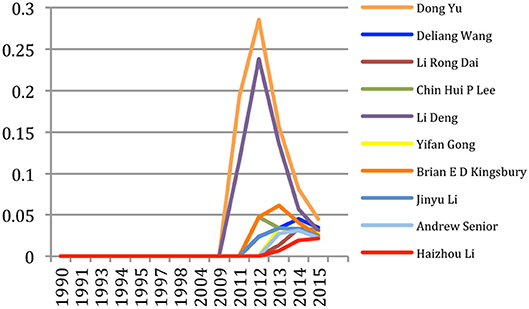
Figure 17. Authors' contributions to the study of DNN in speech and language processing (% of topical papers).
Measuring the Innovation in Publications
We finally computed with the same approach an innovation score for each publication. The score is similarly computed as the sum over the years of the annual presence of the terms in papers published in the source, conference or journal (percentage of papers containing the term which were published in the publication on a given year). This innovation measure provided an overall ranking of the publication. We also computed separate rankings for NLP and for Speech Processing (Table 6).
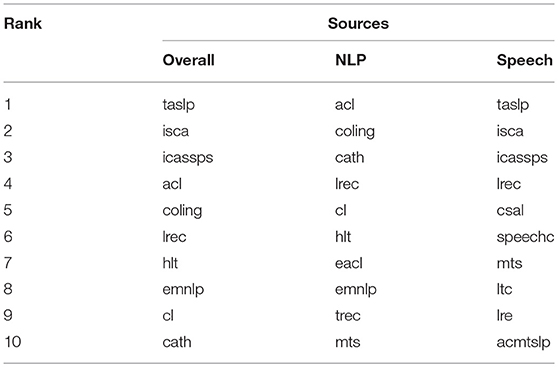
Table 6. Global ranking of the importance of the sources overall and separately for Speech and NLP.
Just as in the case of authors, the measure also reflects here the productivity, which favors the Speech Processing field where more papers have been published, and the pioneering activities, as reflected by the ranking of IEEE TASLP. In the overall ranking, publications that concern both Speech and Language Processing (LREC, HLT) also get a bonus here.
We may study the domains where the publications brought their main contributions, and how it evolves over time. We faced the same problem due to the noise brought by the different frequency of the conferences as we did when studying the evolution of the terms and authors, and we rather considered the cumulative contribution of the publication specific to that term (percentage of papers published in the source among the papers containing the term up to a given year). We see for example (Figure 18) that ACL showed a strong activity and represented 40% of papers published about parsing, 35% of papers published about semantic, syntactic, and lexical and 25% of papers published about Machine Translation up to 1985. Its share in those areas then globally decreases to about 15% of the total number of publications in 2015, due to the launching of new conferences and journals, while the share of publications on Machine Translation within ACL recently increased.
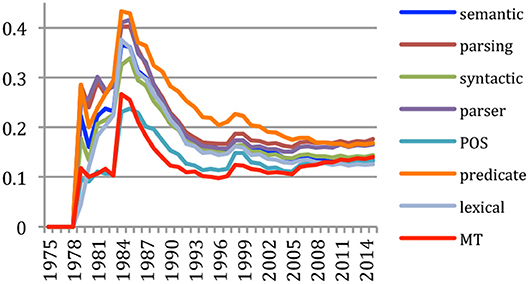
Figure 18. Main domains within the ACL conference series (% of topical papers).
We may also wish to study the contributions of publications to a specific term, using the same cumulative score. Figure 19 provides the cumulative percentage of papers containing the term HMM published up to a given year by the 10 most contributing publications. We see that all papers were initially published in the IEEE Transactions on Speech and Audio Processing. Other publications took a share of those contributions when they were created (Computer Speech and Language starting in 1986, ISCA Conference series starting in 1987) or when we start having access to them (IEEE-ICASSP, starting in 1990). We see that ISCA Conference series represents 45% of the papers published on HMM up to 2015, while IEEE-ICASSP represents 25%. We also see that HMMs were first used in speech processing related publications, then in NLP publications as well (ACL, EMNLP), while publications that are placed in both (CSL, HLT, LREC) helped spreading the approach from speech to NLP.
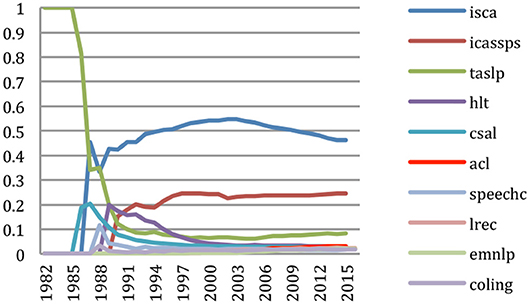
Figure 19. Sources' contributions to the study of HMM (% of topical papers).
The measure of innovation we propose for terms, authors and sources gives an image of the scientific community that seems acceptable. However, it emphasizes the eldest contributions and the productivity, and should be refined. In this analysis, we faced the problem of the lack of quality of the most ancient data that was obtained through OCR from the paper version of the proceedings, which sometimes even contain handwritten comments! For that reason, we focused the study on the period starting in 1975 and we still had to carry out some manual corrections. An automatic term extraction process taking into account the context in which the term is identified would allow making the distinction between real and false occurrences of the terms, especially when they have acronyms as variants. It would avoid the tedious manual checking that we presently conduct and would improve the overall process.
Use of Language Resources
The LRE Map
We have similarly conducted an analysis of the mentions of Language Resources (LR) in the papers of the corpus. Language Resources are bricks that are being used by researchers to conduct their research investigations and develop their system (Francopoulo et al., 2016b). We consider here Language Resources in the broad sense embracing data (e.g., corpus, lexicons, dictionaries, terminological databases, etc.), tools (e.g., morpho-syntactic taggers, prosodic analyzers, annotation tools, etc.), system evaluation resources (e.g., metrics, software, training, dry run or test corpus, evaluation package, etc.), and meta-resources (e.g., best practices, guidelines, norms, standards, etc.).
We considered the Language Resources that are mentioned in the LRE Map (Calzolari et al., 2012). This database was produced in the FlaReNet European project and is constituted by the authors of papers at various conferences of the domain who are invited when submitting their paper to fill in a questionnaire which provides the main characteristics of the Language Resources produced or used in the research investigations that they report in their paper. The LRE Map that we used contains information harvested in 10 conferences from 2010 to 2012, for a total of 4,396 resources. After cleaning those entries (correcting the name of the resources, eliminating the duplicates, regrouping the various versions of resources from the same family, etc.), we ended up with 1,301 different resources that we searched in the NLP4NLP corpus.
Evolution of the Use of Language Resources
Table A2 provides the number of mentions (that we will call “existences”) of different Language Resources from the LRE Map together with the number of documents that were published each year from 1965 to 2015, with the list of the 10 most cited Language Resources every year. We studied the evolution of the number of different resources mentioned in the papers compared with the evolution of the number of papers over the years (Figure 20). It appears that the corresponding curves cross in 2005, date since which more than one Language Resource is mentioned on average in a paper. This may reflect the shift from Knowledge-based approaches to Data-driven approaches in the history of NLP research.
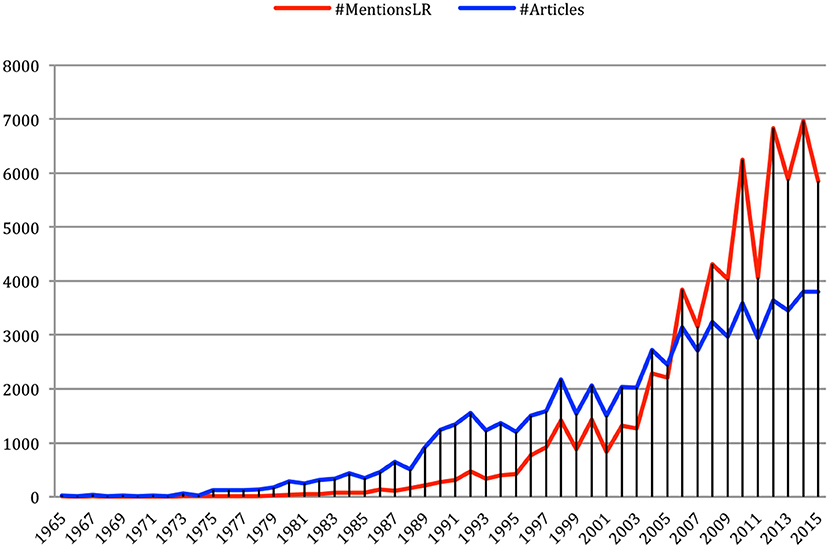
Figure 20. Evolution of the number of mentions of Language Resources in papers over the years.
Table 7 provides the ranking of Language Resources according to the number of papers where they are mentioned (“existences”). It also gives for each resource its type (corpus, lexicon, tool, etc.), the number of mentions in the papers (“occurrences”), the first authors who mentioned it as well as the first publications, and the first and final year when it was mentioned. We see that “WordNet” comes first, followed by “Timit,” “Wikipedia,” “Penn Treebank” and the “Praat” speech analysis tool.
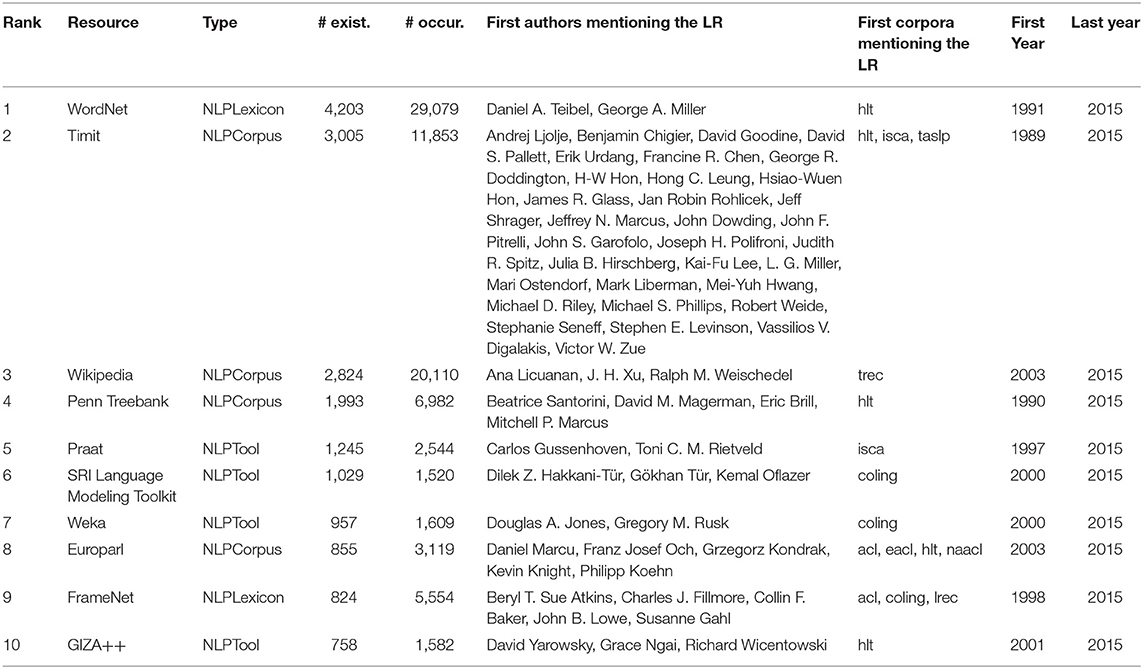
Table 7. Presence of the LRE Map Language Resources in the NLP4NLP articles.
One may also track the propagation of a Language Resource in the corpus. Figure 21 gives the propagation of the “WordNet” resource, which initially appeared in the HLT conference in 1991, and then propagated on the following years, first in computational linguistics conferences, then also in speech processing conferences. Figure 22 provides another view of the same propagation, which includes the number of mentions in each of the sources.
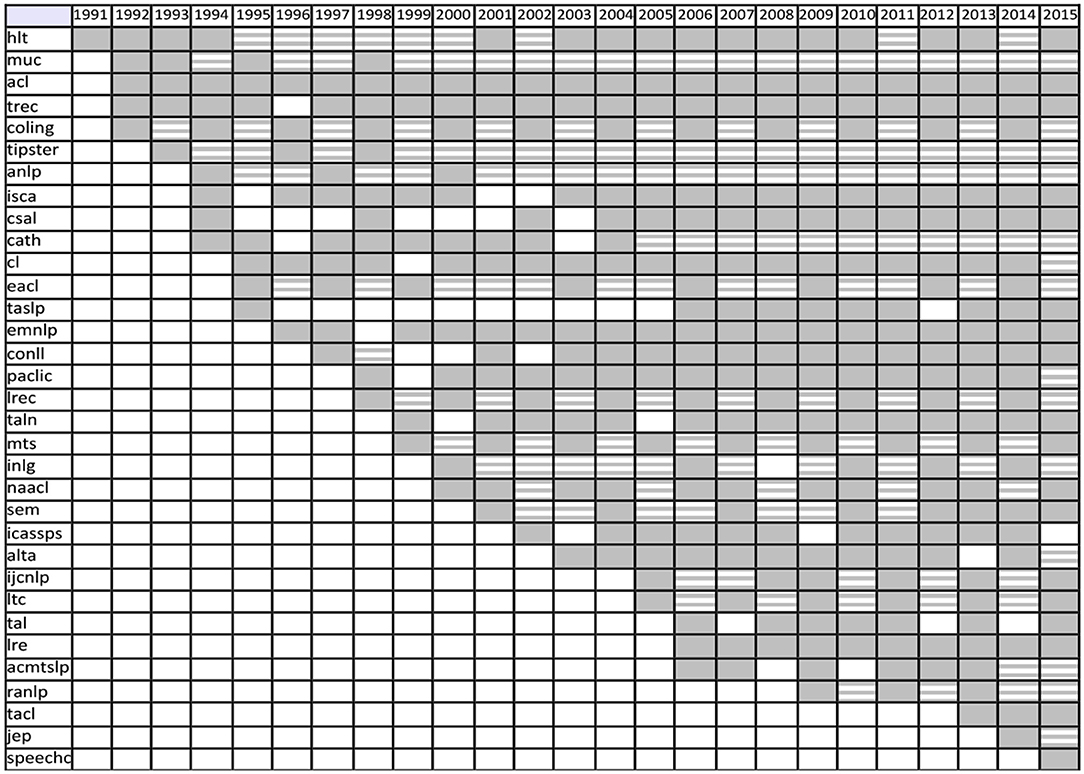
Figure 21. Propagation of the mention of the “Wordnet” resource in NLP4NLP12 conferences and journals.
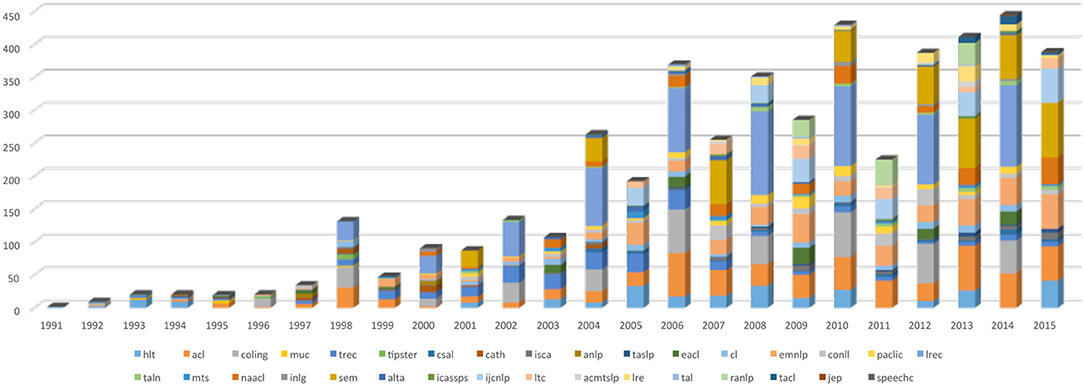
Figure 22. Propagation of the mention of the “Wordnet” resource in NLP4NLP conferences and journals, including the number of mentions.
Language Resources Impact Factor
We may attribute an Impact Factor to Language Resources according to the number of articles that mention the resource as it appears in Table 7. Table 8 provides the Impact Factors for the LR of the “Data” and “Tools” types. It exemplifies the importance of the corresponding LR for conducting research in NLP and aims at recognizing the contribution of the researchers who provided those LR, just like a citation index.
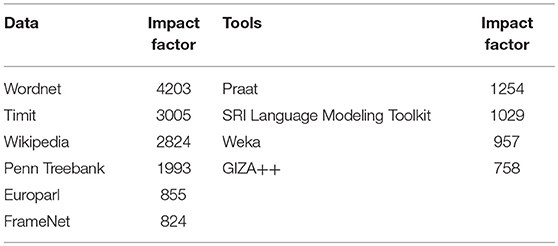
Table 8. Language resources impact factor (data and tools).
Text Reuse and Plagiarism
Here we study the reuse of NLP4NLP papers in other NLP4NLP papers (Mariani et al., 2016, 2017a).
Data
We should remind that we consider here the 67,937 documents coming from various conferences and journals which constitute a large part of the existing published articles in the field, apart from the workshop proceedings and the published books. Some documents are identical as they were published in joint conferences, but we must take them into account individually in order to study the flow of reuse across conferences and journals. The corpus follows the organization of the ACL Anthology with two parts in parallel. For each document, on one side, the metadata is recorded with the author names and the title under the form of a BibTex file. On the other side, the PDF document is recorded on disk in its original form. Each document is labeled with a unique identifier, for instance paper identified as number 1 at the LREC 2000 conference is named “lrec2000_1” and is reified as two files: “lrec2000_1.bib” and “lrec2000_1.pdf.” Figures are not extracted because we are unable to compare images. See Francopoulo et al. (2015) for more details about the extraction process as well as the solutions for some tricky problems like joint conferences management or abstract/body/reference sections detection. The majority (90%) of the documents come from conferences, the rest coming from journals. The overall number of words is roughly 270M. The texts are in four languages: English, French, German, and Russian. The number of texts in German and Russian is < 0.5%. They are detected automatically and are ignored. The texts in French are a little bit more numerous (3%), so they are kept with the same status as the English ones. This is not a problem as our tool is able to process English and French. The corpus is a collection of documents of a single technical domain which is NLP in the broad sense, and of course, some conferences are specialized in certain topics like written language processing, spoken language processing, including signal processing, information retrieval or machine translation. We also considered here the list of 48,894 authors.
Definitions
As the terminology is fuzzy and contradictory among the scientific literature, we needed first to define four important terms in order to avoid any misunderstanding (Table 9):
• The term “self-reuse” is used for a copy & paste when the source of the copy has an author who belongs to the group of authors of the text of the paste and when the source is cited.
• The term “self-plagiarism” is used for a copy & paste when the source of the copy has similarly an author who belongs to the group of authors of the text of the paste, but when the source is not cited.
• The term “reuse” is used for a copy & paste when the source of the copy has no author in the group of authors of the paste and when the source is cited.
• The term “plagiarism” is used for a copy & paste when the source of the copy has no author in the group of the paste and when the source is not cited.
Table 9. Definition of terms.
Said in other words, the terms “self-reuse” and “reuse” qualify a situation with a proper source citation, on the contrary of “self-plagiarism” and “plagiarism.” Let's note that in spite of the fact that the term “self-plagiarism” seems to be contradictory, we use this term because it is the usual habit within the community of the plagiarism detection. Some authors also use the term “recycling,” for instance (HaCohen-Kerner et al., 2010).
Another point to clarify concerns the expression “source papers.” As a convention, we call “focus” the corpus corresponding to the source which is studied. The whole NL4NLP collection is the “search space.” We examine the copy & paste operations in both directions: we study the configuration with a source paper borrowing fragments of text from other papers of the NLP4NLP collection, in other words, a backward study, and we also study in the reverse direction the fragments of the source paper being borrowed by papers of the NLP4NLP collection, in other words, a forward study.
Algorithm for Computing Papers Similarity
Comparison of word sequences has proven to be an effective method for detection of copy & paste (Clough et al., 2002a) and in several occasions, this method won the PAN contest (Barron-Cedeno et al., 2010), so we will adopt this strategy. In our case, the corpus is first processed with the deep NLP parser TagParser (Francopoulo, 2008) to produce a Passage format (Vilnat et al., 2010) with lemma and part-of-speech (POS) indications.
The algorithm is as follows:
• For each document of the focus (the source corpus), all the sliding windows13 of 7 lemmas (excluding punctuations) are built and recorded under the form of a character string key in an index locally to a document.
• An index gathering all these local indexes is built and is called the “focus index.”
• For each document apart from the focus (i.e., outside the source corpus), all the sliding windows are built and only the windows contained in the focus index are recorded in an index locally to this document. This filtering operation is done to optimize the comparison phase, as there is no need to compare the windows out of the focus index.
• Then, the keys are compared to compute a similarity overlapping score (Lyon et al., 2001) between documents D1 and D2, with the Jaccard distance:
• The pairs of documents D1/D2 are then filtered according to a threshold of 0.04 to retain only significant scoring situations.
In a first implementation, we compared the raw character strings with a segmentation based on space and punctuation. But, due to the fact that the input is the result of PDF formatting, the texts may contain variable caesura for line endings or some little textual variations. Our objective is to compare at a higher level than hyphen variation (there are different sorts of hyphens), caesura (the sequence X/-/endOfLine/Y needs to match an entry XY in the lexicon to distinguish from an hyphen binding a composition), upper/lower case variation, plural, orthographic variation (“normalise” vs. “normalize”), spellchecking (particularly useful when the PDF is an image and when the extraction is of low quality) and abbreviation (“NP” vs. “Noun Phrase” or “HMM” vs. “Hidden Markov Model”). Some rubbish sequence of characters (e.g., a series of hyphens) were also detected and cleaned.
Given that a parser takes all these variations and cleanings into account, we decided to apply a full linguistic parsing, as a second strategy. The syntactic structures and relations are ignored. Then a module for entity linking is called in order to bind different names referring to the same entity, a process often labeled as “entity linking” in the literature (Guo et al., 2011; Moro et al., 2014). This process is based on a Knowledge Base called “Global Atlas” (Francopoulo et al., 2013) which comprises the LRE Map (Calzolari et al., 2012). Thus, “British National Corpus” is considered as possibly abbreviated to “BNC,” as well as less regular names like “ItalWordNet” possibly abbreviated to “IWN.” Each entry of the Knowledge Base has a canonical form, possibly associated with different variants: the aim is to normalize into a canonical form to neutralize proper noun obfuscations based on variant substitutions. After this processing, only the sentences with at least a verb are considered.
We examined the differences between those two strategies concerning all types of copy & paste situations above the threshold, choosing the LREC source as the focus. The results are presented in Table 10, with the last column adding the two other columns without the duplicates produced by the couples of the same year.
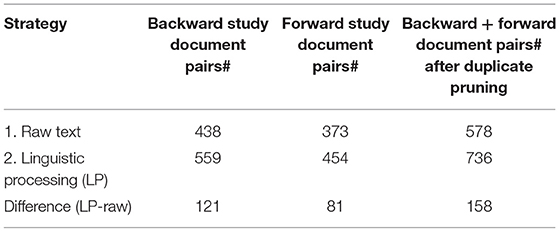
Table 10. Comparison of the two strategies on the LREC corpus.
The strategy based on linguistic processing provides more pairs (+158) and we examined these differences. Among these pairs, the vast majority (80%) concerns caesura: this is normal because most conferences demand a double column format, so the authors frequently use caesura to save place14. The other differences (20%) are mainly caused by lexical variations and spellchecking. Thus, the results show that using raw texts gives a more “silent” system. The drawback is that the computation is much longer15, but we think that it is worth the value. There are three parameters that had to be tuned: the window size, the distance function and the threshold. The main problem we had was that we did not have any gold standard to evaluate the quality specifically on our corpus and the burden to annotate a corpus is too heavy. We therefore decided to start from the parameters presented in the articles related to the PAN contest. We then computed the results, picked a random selection of pairs that we examined and tuned the parameters accordingly. All experiments were conducted with LREC as the focus and NLP4NLP as the search space.
In the PAN related articles, different window sizes are used. A window of five tokens is the most frequent one (Kasprzak and Brandejs, 2010), but our results shows that a lot of common sequences like “the linguistic unit is the” overload the pairwise score. After some trials, we decided to select a size of seven tokens.
Concerning the distance function, the Jaccard distance is frequently used but let's note that other formulas are applicable and documented in the literature. For instance, some authors use an approximation with the following formula: score (D1, D2) = shared windows# / min(D1 windows#, D2 windows#) (Clough and Stevenson, 2011), which is faster to compute, because there is no need to compute the union. Given that computation time is not a problem for us, we kept the most used function, which is the Jaccard distance.
Concerning the threshold, we tried thresholds of 0.03 and 0.04 and we compared the results. The last value gave more significant results, as it reduced noise, while still allowing to detect meaningful pairs of similar papers. We therefore considered as potential reused or plagiarized couples of papers all couples with a similarity score of 4% or more.
Categorization of the Results
After running the first trials, we discovered that using the Jaccard distance resulted in considering as similar a set of two papers, one of them being of small content. This may be the case for invited talks, for example, when the author only provides a short abstract. In this case, a simple acknowledgment to the same institution may produce a similarity score higher than the threshold. The same happens for some eldest papers when the OCR produced a truncated document. In order to solve this problem, we added a second threshold on the minimum number of shared windows that we set at 50 after considering the corresponding erroneous cases. We also found after those first trials erroneous results of the OCR for some eldest papers which resulted in files containing several papers, in full or in fragments, or where blanks were inserted after each individual character. We excluded those papers from the corpus being considered. Checking those results, we also mentioned several cases where the author was the same, but with a different spelling, or where references were properly quoted, but with a different wording, a different spelling (US vs. British English, for example) or an improper reference to the source. We had to manually correct those cases, and move the corresponding couples of papers in the right category (from reuse or plagiarism to self-reuse or self-plagiarism in the case of authors names, from plagiarism to reuse, in the case of references).
Our aim is to distinguish a copy & paste fragment associated with a citation compared to a fragment without any citation. To this end, we proceed with an approximation: we do not bind exactly the anchor in the text, but we parse the reference section and consider that, globally to the text, the document cites (or not) the other document. Due to the fact, that we have proper author identification for each document, the corpus forms a complex web of citations. We are thus able to distinguish self-reuse vs. self-plagiarism and reuse vs. plagiarism. We are in a situation slightly different from METER where the references are not linked. Let's recall that METER is the corpus usually involved in plagiarism detection competitions (Gaizauskas et al., 2001; Clough et al., 2002b).
Given the fact that some papers and drafts of papers can circulate among researchers before the official published date, it is impossible to verify exactly when a document is issued; moreover we do not have any more detailed time indication than the year, as we don't know the date of submission. This is why we also consider the same year within the comparisons. In this case, it is difficult to determine which are the borrowing and borrowed papers, and in some cases they may even have been written simultaneously. However, if one paper cites the second one, while it is not cited by the second one, it may serve as a sign to consider it as the borrowing paper.
The program computes a detailed result for each individual publication as an HTML page where all similar pairs of documents are listed with their similarity score, with the common fragments displayed as red highlighted snippets and HTML links back to the original 67,937 documents16. For each of the 4 categories (Self-reuse, Self-Plagiarism, Reuse and Plagiarism), the program produces the list of couples of “similar” papers according to our criteria, with their similarity score, identification of the common parts and indication of the same authors list or title (Figures 23–25).
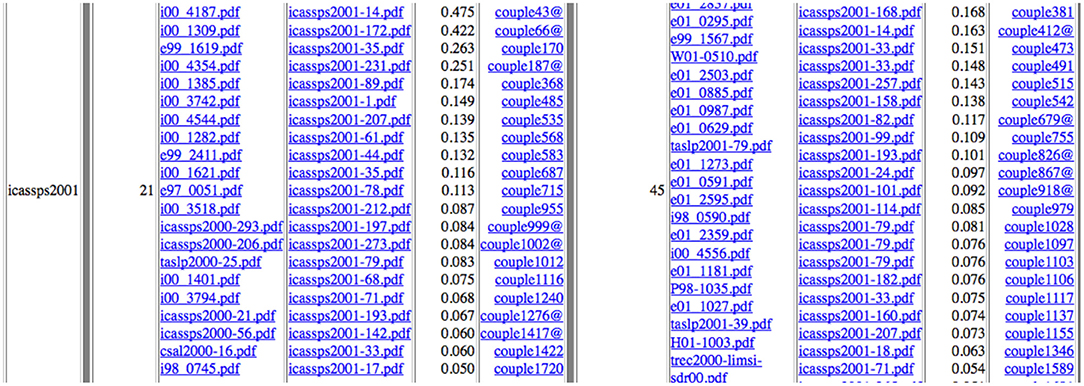
Figure 23. Example of ICASSP 2001 Speech papers self-reusing (left: 21 cases identified) and self-plagiarizing (right: 45 cases identified) other papers with similarity scores (@ following the couple number indicates that the two papers have the same full list of authors).

Figure 24. Example of ICASSP 2001 Speech papers reusing (left: no case identified) and plagiarizing (right: 3 cases identified) other papers with similarity scores.
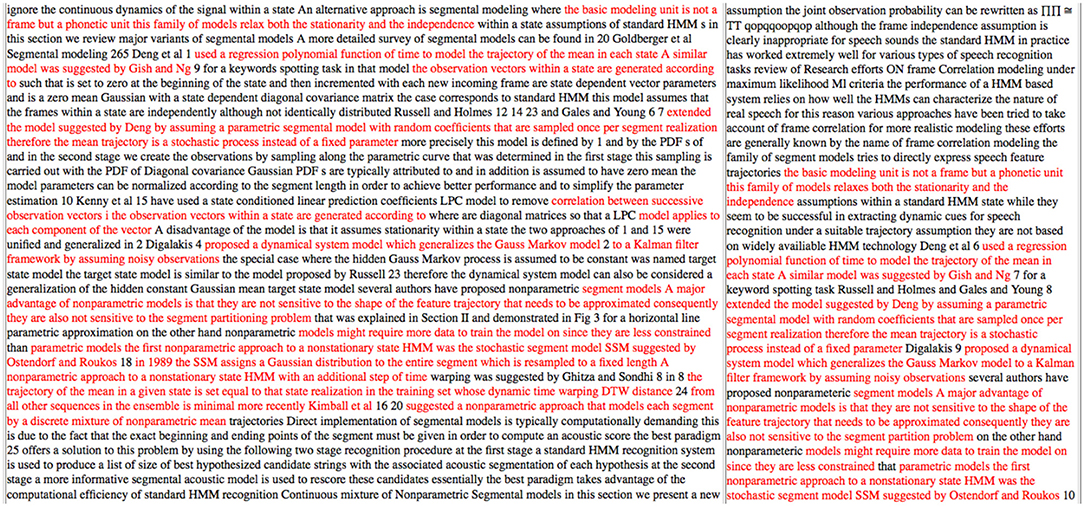
Figure 25. Example in ICASSP 2001 of common fragments (marked in red) for couple 5 articles showing a global similarity score of 0.10 (10%).
The program produces also global results in the form of matrices (Tables 11, 12) for each of the four categories (Self-reuse, Self-Plagiarism, Reuse, and Plagiarism) displaying the number of papers that are similar in each couple of the 34 sources, in the forward and backward directions (using sources are on the X axis, while used sources are on the Y axis. The total of used and using papers, and the difference between those totals, are also presented, while the 5 top using or used sources are indicated.
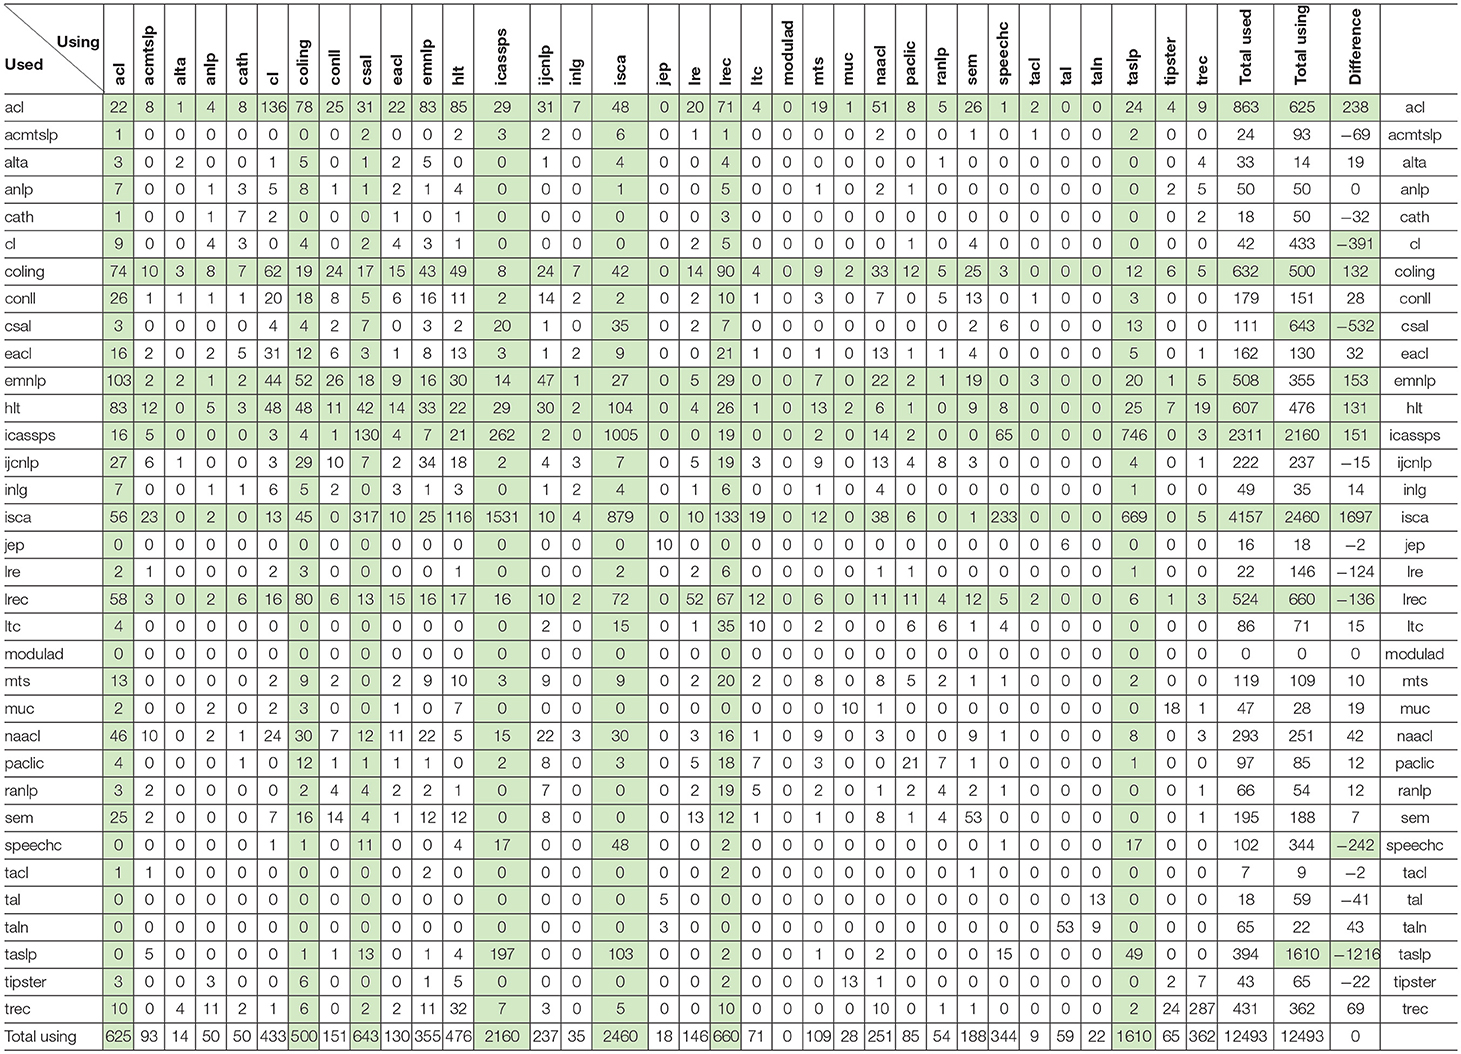
Table 11. Self-reuse and Self-Plagiarism Matrix, with indication in green of the 7 most using and used sources, and of the ones with significant differences between used and using.
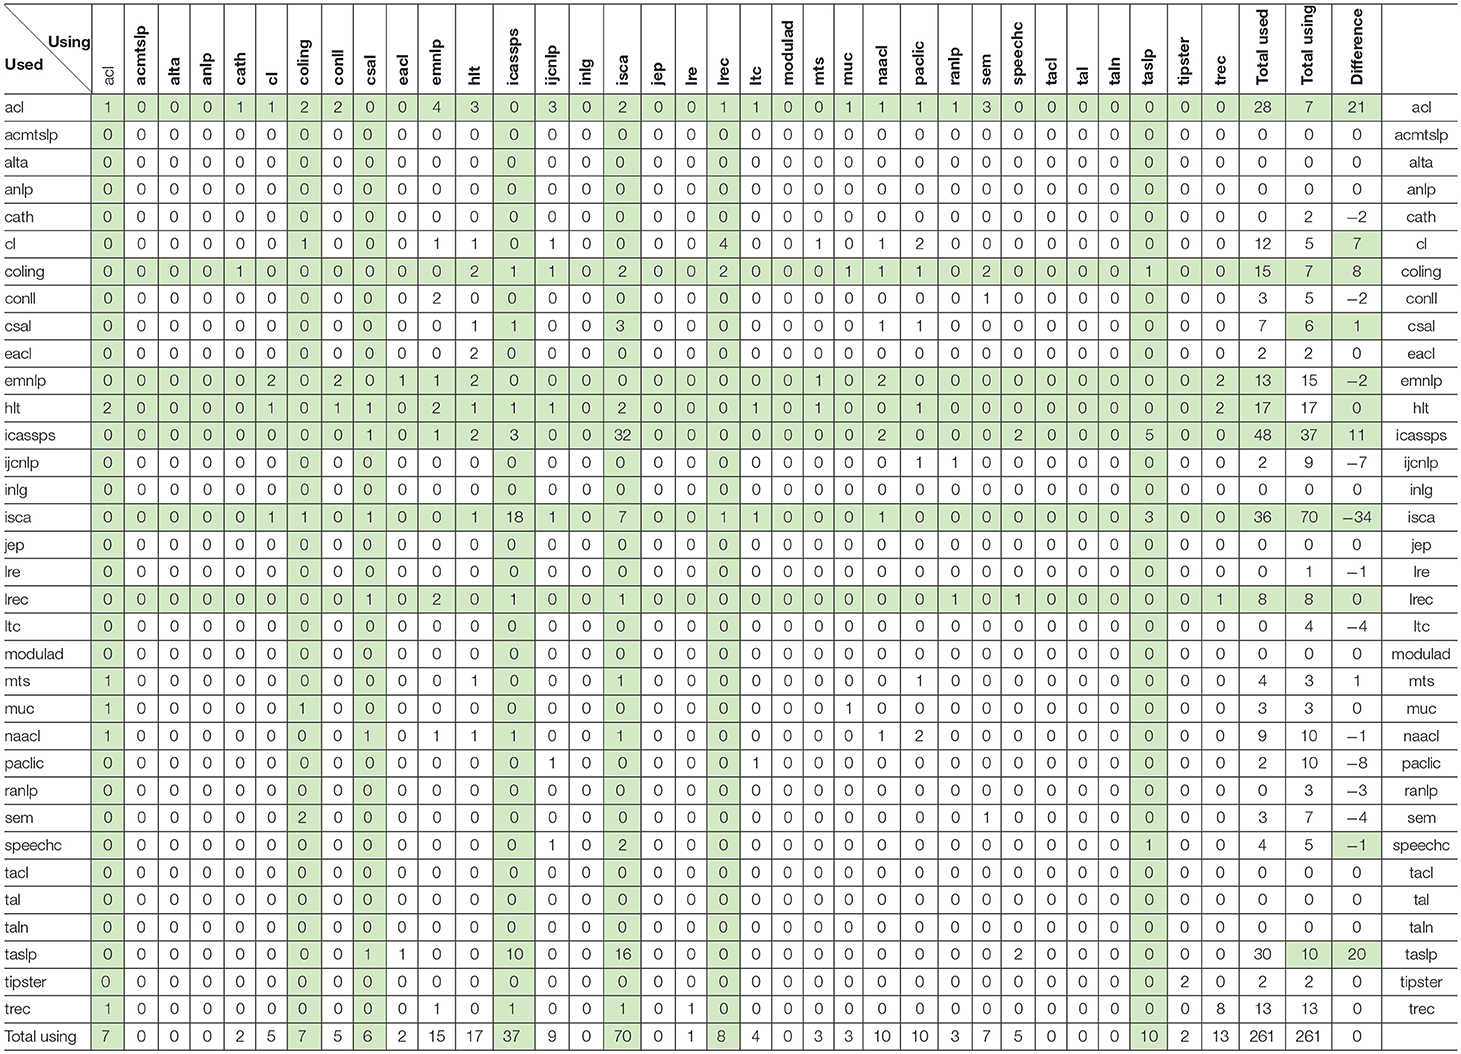
Table 12. Reuse and Plagiarism Matrix, with indication in green of the 7 most using and used sources, and of the ones with significant differences between used and using.
Self-Reuse and Self-Plagiarism
Table 11 provides the results for self-reuse (authors reusing their own text while quoting the source paper) and self-plagiarism (authors reusing their own text without quoting the source paper). As we see, it is a rather frequent phenomenon, with a total of 12,493 documents, i.e., 18% of the 67,937 documents! In 61% of the cases (7,650 self-plagiarisms over 12,493), the authors even do not quote the source paper. We found that 205 papers have exactly the same title, and that 130 papers have both the same title and the same list of authors! Also 3,560 papers have exactly the same list of authors.
We see that the most used sources are the large conferences: ISCA, IEEE-ICASSP, ACL, COLING, HLT, EMNLP, and LREC. The most using sources are not only those large conferences, but also the journals: IEEE-Transactions on Acoustics, Speech and Language Processing (and its various avatars) (TASLP), Computer Speech and Language (CSAL), Computational Linguistics (CL), and Speech Com. If we consider the balance between the using and the used sources, we see the flow of papers from conferences to journals. The largest flows of self-reuse and self-plagiarism concern ISCA and ICASSP (in both directions, but especially from ISCA to ICASSP), ICASSP and ISCA to TASLP (also in the reverse direction) and to CSAL, ISCA to Speech Com, ACL to Computational Linguistics, ISCA to LREC and EMNLP to ACL.
If we want to study the influence a given conference (or journal) has on another, we must however recall that these figures are raw figures in terms of number of documents, and we must not forget that some conferences (or journals) are much bigger than others, for instance ISCA is a conference with more than 18K documents compared to LRE which is a journal with only 308 documents. If we relate the number of published papers that reuse another paper to the total number of published papers, we may see that 17% of the LRE papers (52 over 308) use content coming from the LREC conferences, without quoting them in 66% of the cases. Also the frequency of the conferences (annual or biennial) and the calendar (date of the conference and of the submission deadline) may influence the flow of papers between the sources.
The similarity scores range from 4 to 100% (Figure 26). If we consider the 65,003 different documents, we see that 11,372 couples of documents (18% of the total number of documents) have a similarity score superior or equal to 4%, about 4,560 couples (1.3% of the total) have a similarity score equal or superior to 10% and about 860 (6.6% of the total number) a similarity score superior or equal to 30%. The ones with the largest similarity score correspond to the same paper published by the same author at two successive TREC conferences. The next two couples both correspond to very similar papers published by the same authors first at an ISCA conference, then at ICASSP on the following year. We also found cases of republishing the corrigendum of a previously published paper or of republishing a paper with a small difference in the title and one missing author in the authors' list. In one case, the same research center is described by the same author in two different conferences with an overlapping of 90%. In another case, the difference of the two papers is primarily in the name of the systems being presented, funded by the same project agency in two different contracts, while the description has a 45% overlap!
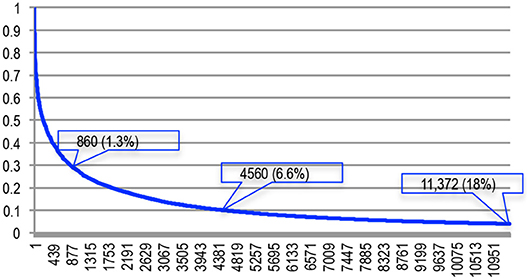
Figure 26. Similarity scores of the couples detected as self-reuse/self-plagiarism.
Reuse and Plagiarism
Table 12 provides the results for reuse (authors reusing fragments of the texts of other authors while quoting the source paper) and plagiarism (authors reusing fragments of the texts of other authors without quoting the source paper). As we see, there are very few cases altogether. Only 261 papers (i.e., < 0.4% of the 67,937 documents) reuse a fragment of papers written by other authors. In 60% of the cases (146 over 261), the authors do not quote the source paper, but these possible cases of plagiarism only represent 0.2% of the total number of papers. Given those small numbers, we were able to conduct a complete manual checking of those couples.
Among the couple papers placed in the “Reuse” category, it appeared that several have a least one author in common, but with a somehow different spelling and should therefore be placed in the “Self-reuse” category. Among the couples of papers placed in the “Plagiarism” category, some have a least one author in common, but with a somehow different spelling (see Figure 27) and should therefore be placed in the “Self-plagiarism” category.

Figure 27. Variants in spelling authors' names.
Others correctly quote the source paper, but with variants in the spelling of the authors' names (Figure 28), of the paper's title (Figure 29) or of the conference or journal. Those variants may also be due to the style guidelines of the conference or journal. We also find the cases of mentioning but forgetting to place the source paper in the references. Those papers should therefore be placed in the “Reuse” category.

Figure 28. Variants in spelling authors' names in reference.

Figure 29. Variants in spelling authors' names and papers titles in reference.
It therefore finally resulted in 104 cases of “reuse” and 116 possible cases of plagiarism (0.17% of the papers) that we studied more closely. We found the following explanations:
• The paper cites another reference from the same authors of the source paper (typically a previous reference, or a paper published in a Journal) (45 cases).
• Both papers use extracts of a third paper that they both cite (31 cases).
• The authors of the two papers are different, but from the same laboratory (typically in industrial laboratories or funding agencies) (11 cases).
• The authors previously co-authored papers (typically as supervisor and Ph.D. student or postdoc) but are now in a different laboratory (11 cases).
• The authors of the papers are different, but collaborated in the same project which is presented in the two papers (2 cases).
• The two papers present the same short example, result, or definition coming from another event (13 cases).
If we exclude those 113 cases, only 3 cases of possible plagiarism remain that correspond to the same paper which appears as a patchwork of 3 other papers, while sharing several references with them, the highest similarity score being only 10%, with a shared window of 200 tokens (see Figures 24, 25).
Here, the similarity scores range from 4 to 27% (Figure 30). If we consider the 65,003 different documents, we see that 220 couples of documents (0.3% of the total number of documents) have a similarity score superior or equal to 4%, and only 18 couples (0.03% of the total number) have a similarity score equal or higher than 10%. For example, the couple showing the highest similarity score comprises a paper published at Interspeech in 2013 and a paper published at ICASSP in 2015 which both describe the Kaldi system using the words of the initial paper published at the IEEE ASRU workshop in 2011, that they both properly quote.
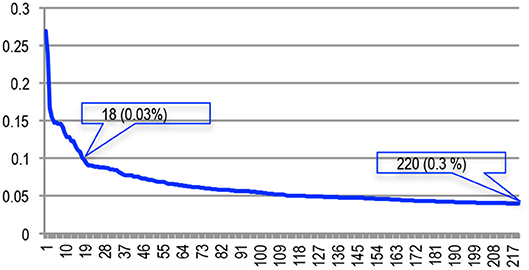
Figure 30. Similarity scores of the couples detected as reuse/plagiarism.
Time Delay Between Publication and Reuse
We now consider the duration between the publication of a paper and its reuse (in all 4 categories) in another publication (Table 13). It appears that 38% of the similar papers were published on the same year, 71% within the next year, 83% over 2 years, and 93% over 3 years (Figures 31, 32). Only 7% reuse material from an earlier period. The average duration is 1.22 years. Thirty percent of the similar papers published on the same year concern the couple of conferences ISCA-ICASSP.
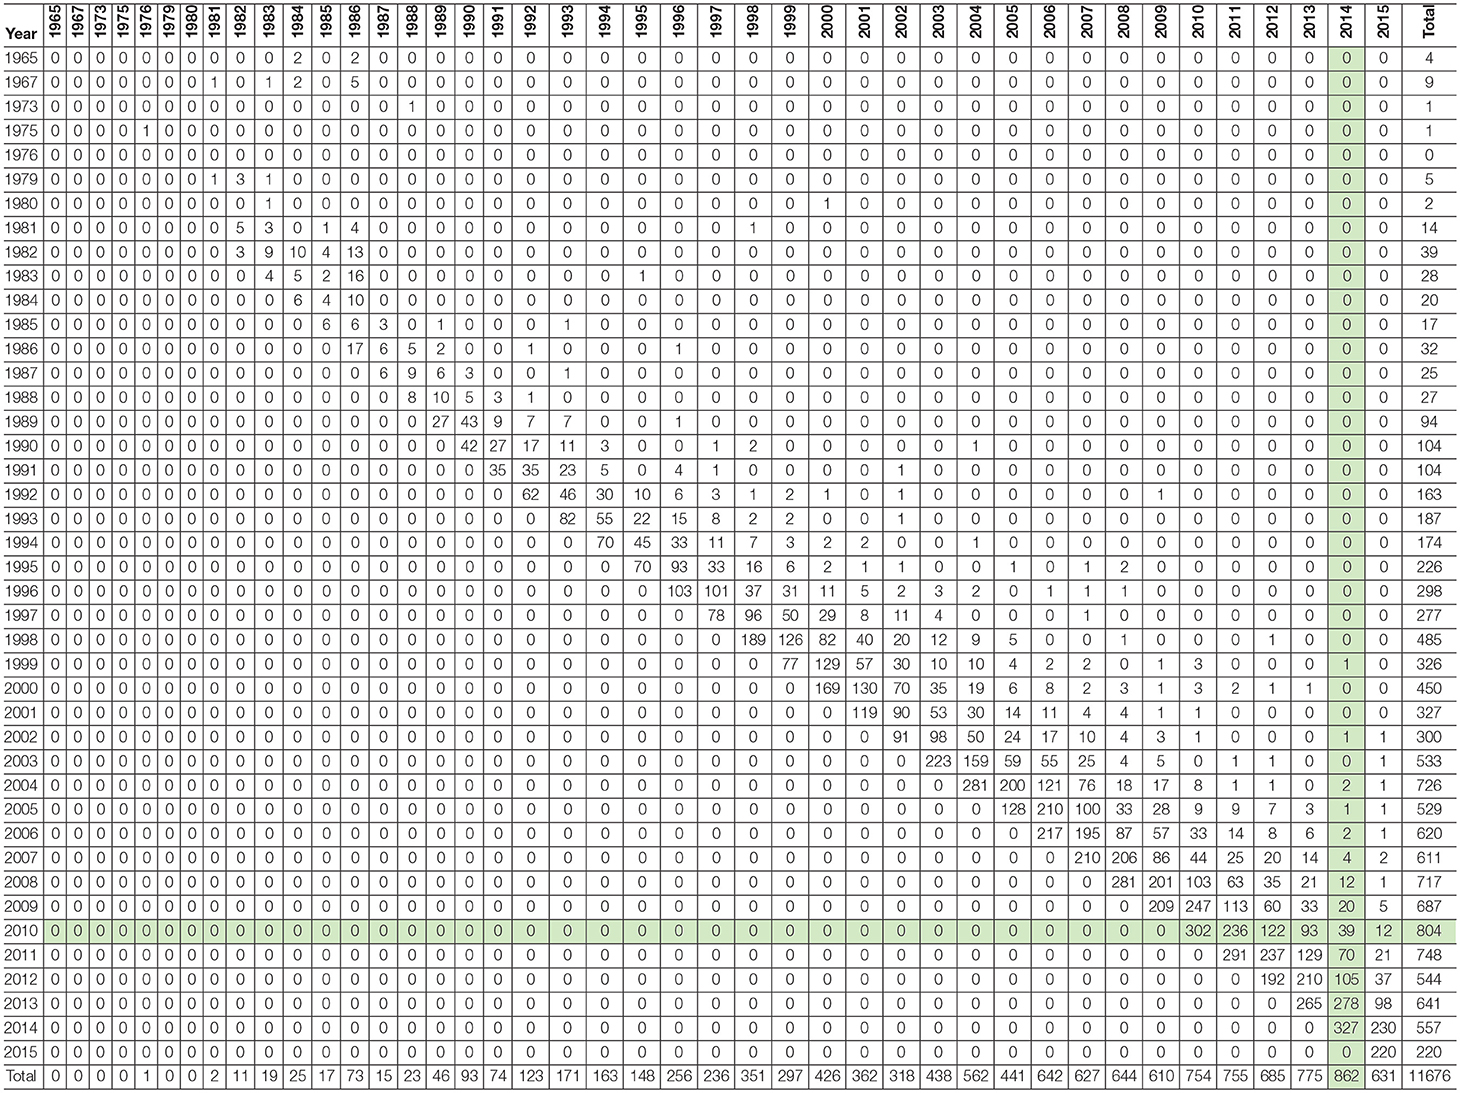
Table 13. Number of papers reusing and number of papers being reused over the years (1965–2015), with indication in green of the years with the largest number of reused and reusing papers.
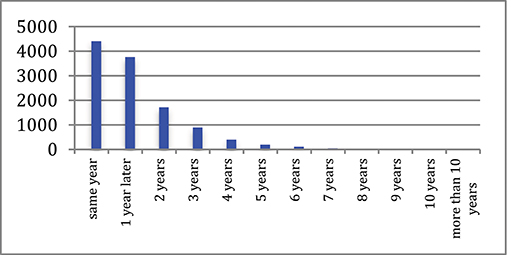
Figure 31. Time delay between publication and reuse.
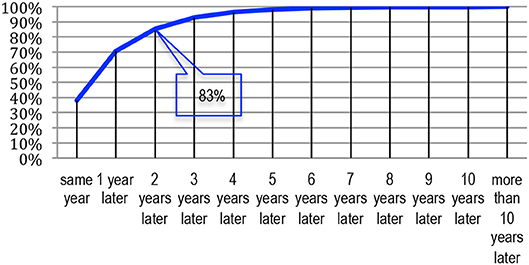
Figure 32. Time delay between publication and reuse (in %).
If we consider the reuse of conference papers in journal papers (Figures 33, 34), we observe a similar time schedule, with a delay of one year: 12% of the reused papers were published on the same year, 41% within the next year, 68% over 2 years, 85% over 3 years and 93% over 4 years. Only 7% reuse material from an earlier period. The average duration is 2.07 years.
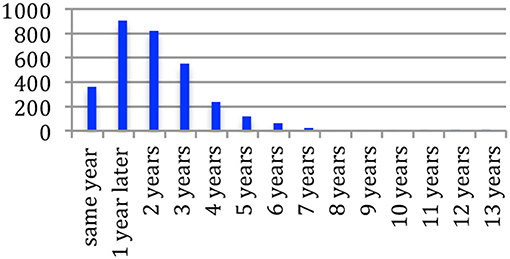
Figure 33. Time delay between publication in conferences and reuse in journals.
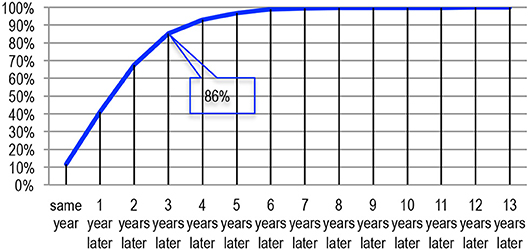
Figure 34. Time delay between publication in conferences and reuse in journals (in %).
Legal and Ethical Limits
The first obvious ascertainment is that self-reusing is much more frequent than reusing the content of others. With a comparable threshold of 0.04, when we consider the total of the two directions, there are 11,372 self-reuse and self-plagiarism detected pairs, compared with 104 reuse and 116 plagiarism detected pairs. Globally, the source papers are quoted only in 40% of the cases on average, a percentage which falls down from 40 to 25% if the papers are published on the same year.
Plagiarism may raise legal issues if it violates copyright, but the right to quote17 exists in certain conditions, considering the Berne convention for the Protection of Literary and Artistic Works18: “National legislations usually embody the Berne convention limits in one or more of the following requirements:
• The cited paragraphs are within a reasonable limit,
• Clearly marked as quotations and fully referenced,
• “The resulting new work is not just a collection of quotations, but constitutes a fully original work in itself,”
• “We could also add that the cited paragraph must have a function in the goal of the citing paper.”
Obviously, most of the cases reported in this paper comply with the right to quote. The limits of the cited paragraph vary from country to country. In France and Canada, for example, a limit of 10% of both the copying and copied texts seems to be acceptable. As we've seen, it appears that we stay within those limits in all cases in NLP4NLP.
Self-reuse and self-plagiarism are of a different nature and are related to the ethics and deontology of a community. Let's recall that they concern papers that have at least one author in common. Of course, a copy & paste operation is easy and frequent but there is another phenomena to take into account which is difficult to distinguish from copy & paste: this is the style of the author. All the authors have habits to formulate their ideas, and, even on a long period, most authors seem to keep the same chunks of prepared words. As we've seen, almost 40% of the cases concern papers that are published on the same year: authors submit two similar papers at two different conferences on the same year, and publish the two papers in both conferences if both are accepted, and they may be unable to properly cite the other paper if it is not yet published or even accepted. It is very difficult for a reviewer to detect and prevent those cases as none of the papers are published when the other one is submitted.
Another frequent case is the publication of a paper in a journal after its publication in a conference. Here also, it is a natural and usual process, sometimes even encouraged by the journal editors after a pre-selection of the best papers in a conference.
As a tentative to moderate these figures and to justify self-reuse and self-plagiarism of previously published material, it is worth quoting Pamela Samuelson (Samuelson, 1994):
• The previous work must be restated to lay the groundwork for a new contribution in the second work,
• Portions of the previous work must be repeated to deal with new evidence or arguments,
• The audience for each work is so different that publishing the same work in different places is necessary to get the message out,
• The authors think they said it so well the first time that it makes no sense to say it differently a second time.
She considers that 30% is an upper limit in the reuse of parts of a paper previously published by the same authors. As we've seen in Figure 26, only 1.3% of the documents would fall in this category in NLP4NLP.
We believe that following these two sets of principles regarding (self) reuse and plagiarism will help maintaining an ethical behavior in our community.
Conclusions
The present paper and its companion one offer a survey of the literature attached to NLP for the last 50 years, and provide examples of the numerous analyses that can be conducted using available tools, some of them resulting from the research conducted in NLP.
As it appears in the various findings, research in NLP for spoken, written and signed languages has made major advances over the past 50 years through constant and steady scientific effort that was fostered thanks to the availability of a necessary infrastructure made up of publicly funded programs, largely available language resources, and regularly organized evaluation campaigns. It keeps on progressing at a high pace, with a very active and coordinated research community. The ethical issues are properly addressed and bridges between the spoken, written and sign language processing communities are being reinforced, through the use of comparable methodologies.
As already mentioned, the lack of a consistent and uniform identification of entities (authors names, gender, affiliations, paper language, conference and journal titles, funding agencies, etc.) required a tedious manual correction process only made possible because we knew the main components of the field. The same applies for Language Resources, where we find initiatives for identifying resources in a persistent and unique way such as the ISLRN (International Standard Language Resource Number) (Choukri et al., 2012). Researchers in other disciplines, e.g., biology (Bravo et al., 2015), face the same problems. Establishing standards for such domain-independent identification demands an international effort in order to ensure that the identifiers are unique and appears as a challenge for the scientific community. Therefore, different scientific communities could benefit from mutual experience and methodologies.
Perspectives
We now plan to investigate more deeply the structure of the research community corresponding to the NLP4NLP corpus. We aim at identifying factions of people who publish together or cite each other. We also plan to refine the study of the polarity of the citations, and deepen the potential detection of weak signals and emerging trends. Establishing links among authors, citations and topics will allow us to study the changes in the topics of interest for authors or factions.
We would like to improve automatic information (names, references, terms) extraction by taking into account the context, in order to make the distinction between real and false occurrences of the information. It would avoid the tedious manual checking that we presently conduct and would improve the overall process.
It should also be noticed that the raw data we gathered and the information we extracted after substantial cleaning could provide data for evaluation campaigns (such as automatic Name Extraction, or Multimedia Gender Detection).
We finally hope that the reader will find interest in the reported results, and may also find inspiration for further interpretation of the reported measures or for conducting other measures on the available data.
Author Contributions
All authors listed have made a substantial, direct and intellectual contribution to the work, and approved it for publication. JM launched the initiative following an invitation to give a keynote talk at Interspeech 2013 to celebrate the 25th anniversary of this major conference in spoken language processing and coordinated the following related and extended works from 2013 to 2018. GF produced the NLP4NLP corpus and developed all the tools that were used for analyzing the corpus. PP participated in the research group and provided advices on the use of NLP tools. FV specifically developed the GapChart visualization tool.
Conflict of Interest Statement
The authors declare that the research was conducted in the absence of any commercial or financial relationships that could be construed as a potential conflict of interest.
Acknowledgments
We wish to thank the ACL colleagues, Ken Church, Sanjeev Khudanpur, Amjbad Abu Jbara, Dragomir Radev, and Simone Teufel, who helped them in the starting phase, Isabel Trancoso, who gave her ISCA Archive analysis on the use of assessment and corpora, Wolfgang Hess, who produced and provided a 14 GBytes ISCA Archive, Emmanuelle Foxonet who provided a list of authors given names with genre, Florian Boudin, who made available the TALN Anthology, Helen van der Stelt and Jolanda Voogd (Springer) who provided the LRE data and Douglas O'Shaughnessy, Denise Hurley, Rebecca Wollman and Casey Schwartz (IEEE) who provided the IEEE ICASSP and TASLP data, Nancy Ide and Christopher Cieri who largely improved the readability of parts of this paper. They also thank Khalid Choukri, Alexandre Sicard, and Nicoletta Calzolari, who provided information about the past LREC conferences, Victoria Arranz, Ioanna Giannopoulou, Johann Gorlier, Jérémy Leixa, Valérie Mapelli, and Hélène Mazo, who helped in recovering the metadata for LREC 1998, and all the editors, organizers, reviewers and authors over those 50 years without whom this analysis could not have been conducted!.
Apologies
This survey has been made on textual data, which cover a 50-year period, including scanned content. The analysis uses tools that automatically process the content of the scientific papers and may make errors. Therefore, the results should be regarded as reflecting a large margin of error. The authors wish to apologize for any errors the reader may detect, and they will gladly rectify any such errors in future releases of the survey results.
Relationship With Other Papers and Reuse of Previous Material
The present paper is accompanied by another paper “Mariani, Joseph, Paroubek, Patrick, Francopoulo, Gil and Vernier, Frédéric (2018). The NLP4NLP Corpus (II): 50 Years of Research in Speech and Language Processing,” in the same special issue of Frontiers in Research Metrics and Analytics on “Mining Scientific Papers: NLP-enhanced Bibliometrics” edited by Iana Atanassova, Marc Bertin and Philipp Mayr, which describes the content of this corpus. A summary of the joint two papers has been presented as a keynote talk at the Oriental-Cocosda conference in Seoul (“Joseph Mariani, Gil Francopoulo, Patrick Paroubek, Frédéric Vernier, Rediscovering 50 Years of Discoveries in Speech and Language Processing: A Survey. Oriental Cocosda conference, Seoul, 1-3 November 2017”) (Mariani et al., 2017b).
This paper assembles the content of several former papers which described various results of experiments conducted on the NLP4NLP corpus (http://www.nlp4nlp.org). Material from the corresponding previously published sources, listed below, is re-used within permission, implicit or explicit open-licence rights, as follows:
1. Francopoulo, Gil, Mariani, Joseph and Paroubek Patrick (2016). Linking Language Resources and NLP Papers, Workshop on Research Results Reproducibility and Resources Citation in Science and Technology of Language, LREC 2016, Tenth International Conference on Language Resources and Evaluation, Portorož, Slovenia, May 24, 2016
This paper analyzes the mention of the Language Resources contained in the LRE Map in the NLP4NLP papers.
The reused material concerns Tables 1, 2 and Figure 2.
2. Mariani, Joseph, Paroubek, Patrick, Francopoulo, Gil and Hamon, Olivier (2014). Rediscovering 15 Years of Discoveries in Language Resources and Evaluation: The LREC Anthology Analysis, LREC 2014, 26-31 May 2014, Reykjavik, Iceland, published within the Proceedings of LREC Conference 2014, http://www.lrec-conf.org/proceedings/lrec2014/index.html
This paper analyzes the Language Resources and Evaluation Conference (LREC) over 15 years (1998-2014).
The reused material concerns section Research Topic Prediction.
3. Mariani, Joseph, Paroubek, Patrick, Francopoulo, Gil and Hamon, Olivier (2016). Rediscovering 15 + 2 Years of Discoveries in Language Resources and Evaluation, Language Resources and Evaluation Journal, 2016, pp. 1-56, ISSN: 1574-0218, doi: 10.1007/s10579-016-9352-9
This paper has been selected among the LREC 2014 papers to be published in a special issue of the Language Resources and Evaluation Journal. It is an extended version of the previous paper, in the following dimensions: extension of the LREC content with the proceedings of the LREC 2014 conference (hence the change in the title of the paper (“15 +2 Years” instead of “15 Years”), and comparison with two other conferences among those contained in NLP4NLP (namely ACL and Interspeech).
The reused material concerns section Research Topic Prediction (mainly subsections Archive Analysis, Terms Frequency and Presence and Tag Clouds for Frequent Terms).
4. Francopoulo, Gil, Mariani, Joseph and Paroubek, Patrick (2016). Predictive Modeling: Guessing the NLP Terms of Tomorrow. LREC 2016, Tenth International Conference on Language Resources and Evaluation Proceedings, Portorož, Slovenia, May 23-28, 2016
This paper analyzes the possibility to predict the future research topics.
The reused material concerns section Research Topic Prediction.
5. Mariani, Joseph, Francopoulo, Gil and Paroubek, Patrick (2018). Measuring Innovation in Speech and Language Processing Publications, LREC 2018, 9-11 May 2018, Miyazaki, Japan.
This paper analyzes the innovations brought in the various research topics by the various authors and the various publications within NLP4NLP.
The reused material concerns section Innovation.
6. Mariani, Joseph, Francopoulo, Gil and Paroubek, Patrick (2016). A Study of Reuse and Plagiarism in Speech and Natural Language Processing papers. Joint Workshop on Bibliometric-enhanced Information Retrieval and Natural Language Processing for Digital Libraries (BIRNDL 2016). 4th Bibliometric-enhanced Information Retrieval (BIR) and 2nd Workshop on text and citation analysis for scholarly digital libraries (NLPIR4DL), Joint Conference on Digital Libraries (JCDL'16), Newark, New Jersey, USA, 23 June 2016.
This paper analyzes the reuse and plagiarism of papers in the NLP4NLP corpus.
The reused material concerns section Text Reuse and Plagiarism (mainly subsections Data, Definitions, Algorithm for Computing Papers Similarity, Categorization of the Results, and Time Delay Between Publication and Reuse).
7. Mariani, Joseph, Francopoulo, Gil and Paroubek, Patrick (2017). Reuse and Plagiarism in Speech and Natural Language Processing Publications, Proc. International Journal of Digital Libraries. (2017), doi: 10.1007/s00799-017-0211-0
This paper has been selected among the BIRNDL 2016 papers to be published in a special issue of the International Journal of Digital Libraries. It is an extended version of the previous paper, with a detailed analysis of the findings and a study on the timing of the reuses.
The reused material concerns section Text Reuse and Plagiarism (mainly subsections Self-Reuse and Self-Plagiarism, Reuse and Plagiarism, and Legal and Ethical Limits).
Footnotes
2. ^ Version 3 (BNC XML Edition), 2007. Distributed by Oxford University Computing Services on behalf of the BNC Consortium. URL: http://www.natcorp.ox.ac.uk/
4. ^ www.grsampson.net/Resources.html
6. ^ Sometimes called “Boolean frequency” or “binary frequency.”
7. ^ Gapchart: https://rankvis.limsi.fr/
8. ^ www.tagcrowd.com. Our thanks to Daniel Steinbock for providing access to this web service.
9. ^ www.cs.waikato.ac.nz/ml/weka
10. ^ Laurence Urdang (1966), The Systems Designs and Devices Used to Process The Random House Dictionary of the English Language. Computer and the Humanities. Interestingly, the author writes: “Each unit of information-regardless of length-was called a dataset, a name which we coined at the time. (For various reasons, this word does not happen to be an entry in The Random House Dictionary of the English Language, our new book, which I shall refer to as the RHD).” a statement which witnesses her authorship of the term.
11. ^ Interestingly, she mentions the Arthur Clarke's “2001, Space Odyssey” movie: “Barring Clarke's reliance on the triumph of automatic neural network generation, what are the major hurdles that still need to be overcome before Natural Language Interactive Systems become practical?” which may appear as a premonition in 1980!
12. ^ Hatched slots correspond to years where the conference didn't occur or the journal wasn't published.
13. ^ Also called “n-grams” in some NLP publications.
14. ^ Concerning this specific problem, for instance, PACLIC and COLING which are one column formatted give much better extraction quality than LREC and ACL which are two columns formatted.
15. ^ It takes 25 h instead of 3 h on a mid-range mono-processor Xeon E3-1270 V2 with 32G of RAM.
16. ^ But the space limitations do not allow to present these results in lengthy details. Furthermore, we do not want to display personal results.
17. ^ en.wikipedia.org/wiki/Right_to_quote
18. ^ Berne Convention for the Protection of Literary and Artistic Works (as amended on Sept. 28, 1979). http://www.wipo.int/wipolex/en/treaties/text.jsp?file_id=283693
References
Barron-Cedeno, A., Potthast, M., Rosso, P., Stein, B., and Eiselt, A. (2010). “Corpus and evaluation measures for automatic plagiarism detection,” in Proceedings of LREC (Valletta).
Bravo, E., Calzolari, A., De Castro, P., Mabile, L., Napolitani, F., Rossi, A. M., et al. (2015). Developing a guideline to standardize the citation of bioresources in journal articles (CoBRA). BMC Med. 13:33. doi: 10.1186/s12916-015-0266-y
Calzolari, N., Del Gratta, R., Francopoulo, G., Mariani, J., Rubino, F., Russo, I., et al. (2012). “The LRE map. harmonising community descriptions of resources,” in Proceedings of the Language Resources and Evaluation Conference (LREC 2012) (Istanbul).
Choukri, K., Arranz, V., Hamon, O., and Park, J. (2012). “Using the international standard language resource number: practical and technical aspects,” in Proceedings of the Language Resources and Evaluation Conference (LREC 2012) (Istanbul).
Clough, P., Gaizauskas, R., and Piao, S. S. L. (2002b). “Building and annotating a corpus for the study of journalistic text reuse,” in Proceedings of LREC (Las Palmas).
Clough, P., Gaizauskas, R., Piao, S. S. L., and Wilks, Y. (2002a). “Measuring text reuse,” in Proceedings of ACL'02 (Philadelphia, PA).
Clough, P., and Stevenson, M. (2011). Developing a corpus of plagiarised short answers. Lang. Resour. Eval. J. 45, 5–24. doi: 10.1007/s10579-009-9112-1
Drouin, P. (2004). “Detection of domain specific terminology using corpora comparison,” in Proceedings of the Language Resources and Evaluation Conference (LREC 2004) (Lisbon).
Francopoulo, G. (2008). “TagParser: well on the way to ISO-TC37 conformance,” in ICGL (International Conference on Global Interoperability for Language Resources) (Hong Kong).
Francopoulo, G., Marcoul, F., Causse, D., and Piparo, G. (2013). “Global atlas: proper nouns, from Wikipedia to LMF,” in LMF-Lexical Markup Framework, ed G. Francopoulo (ISTE/Wiley), 227–241.
Francopoulo, G., Mariani, J., and Paroubek, P. (2015). NLP4NLP: The Cobbler's Children Won't Go Unshod. Available online at: www.dlib.org/dlib/november15/francopoulo/11francopoulo.html
Francopoulo, G., Mariani, J., and Paroubek, P. (2016a). “Predictive modeling: guessing the NLP terms of tomorrow,” in LREC 2016, Tenth International Conference on Language Resources and Evaluation Proceedings (Portorož).
Francopoulo, G., Mariani, J., and Paroubek, P. (2016b). “Linking language resources and NLP papers,” in Workshop on Research Results Reproducibility and Resources Citation in Science and Technology of Language, LREC 2016, Tenth International Conference on Language Resources and Evaluation (Portorož).
Gaizauskas, R., Foster, J., Wilks, Y., Arundel, J., Clough, P., and Piao, S. S. L. (2001). “The METER corpus: a corpus for analysing journalistic text reuse,” in Proceedings of the Corpus Linguistics Conference (Lancaster).
Guo, Y., Che, W., Liu, T., and Li, S. (2011). “A graph-based method for entity linking,” in International Joint Conference on NLP (Chiang Mai).
HaCohen-Kerner, Y., Tayeb, A., and Ben-Dror, N. (2010). “Detection of simple plagiarism in computer science papers,” in Proceedings of the 23rd International Conference on Computational Linguistics (COLING) (Beijing).
Hall, D. L.W., Jurafsky, D., and Manning, C. (2008). “Studying the history of ideas using topic models,” in Proceedings of the Conference on Empirical Methods in Natural Language Processing (EMNLP'08) (Honolulu, HI), 363–371.
Ide, N., Suderman, K., and Simms, B. (2010). “ANC2Go: a web application for customized corpus creation,” in Proceedings of the Seventh Conference on International Language Resources and Evaluation (LREC'10) (Valletta: European Language Resources Association).
Kasprzak, J., and Brandejs, M. (2010). “Improving the reliability of the plagiarism detection system lab,” in Proceedings of the Uncovering Plagiarism, Authorship and Social Software Misuse (PAN) (Padua).
Koehn, P. (2005). “Europarl: a parallel corpus for statistical machine translation,” in Conference Proceedings: The Tenth Machine Translation Summit (Phuket), 79–86.
Lyon, C., Malcolm, J., and Dickerson, B. (2001). “Detecting short passages of similar text in large document collections,” in Proc. of the Empirical Methods in Natural Language Processing Conference (Pittsburgh, PA).
Mariani, J., Francopoulo, G., and Paroubek, P. (2016). “A study of reuse and plagiarism in speech and natural language processing papers,” in Joint Workshop on Bibliometric-enhanced Information Retrieval and Natural Language Processing for Digital Libraries (BIRNDL 2016). 4th Bibliometric-enhanced Information Retrieval (BIR) and 2nd Workshop on text and citation analysis for scholarly digital libraries (NLPIR4DL), Joint Conference on Digital Libraries (JCDL '16) (Newark, NJ).
Mariani, J., Francopoulo, G., and Paroubek, P. (2017a). Reuse and plagiarism in speech and natural language processing publications. P. Int. J. Digit Libr. 19, 113–126. doi: 10.1007/s00799-017-0211-0
Mariani, J., Francopoulo, G., and Paroubek, P. (2018a). “Measuring innovation in speech and language processing publications,” in LREC 2018 (Miyazaki).
Mariani, J., Francopoulo, G., and Paroubek, P. (2018b). The NLP4NLP corpus (I): 50 years of publication, collaboration and citation in speech and language processing. Front. Res. Metr. Anal. 3:36. doi: 10.3389/frma.2018.00036
Mariani, J., Francopoulo, G., Paroubek, P., and Vernier, F. (2017b). “Rediscovering 50 years of discoveries in speech and language processing: a survey,” in Oriental Cocosda Conference (Seoul: IEEE XPlore). doi: 10.1109/ICSDA.2017.8384413
Moro, A., Raganato, A., and Navigli, R. (2014). Entity linking meets word sense disambiguation: a unified approach. Trans. Assoc. Comput. Linguist. 2, 231–244.
Paul, M., and Girju, R. (2009). “Topic modeling of research fields: an interdisciplinary perspective,” in Recent Advances in Natural Language Processing (RANLP 2009) (Borovets).
Perin, C., Boy, J., and Vernier, F. (2016). “GapChart: a gap strategy to visualize the temporal evolution of both ranks and scores,” in IEEE Computer Graphics and Applications, Special Issue on Sports Data Visualization, Vol. 36.
Vilnat, A., Paroubek, P., de la Clergerie, E., Francopoulo, G., and Guénot, M. L. (2010). “PASSAGE syntactic representation: a minimal common ground for evaluation,” in Proceedings of LREC 2010 (Valletta).
Witten, I. H., Eibe, F., and Hall, M. A. (2011). Data Mining: Practical Machine Learning Tools and Techniques, 3rd Edn. Burlington, VT: Morgan Kaufmann.
Appendix
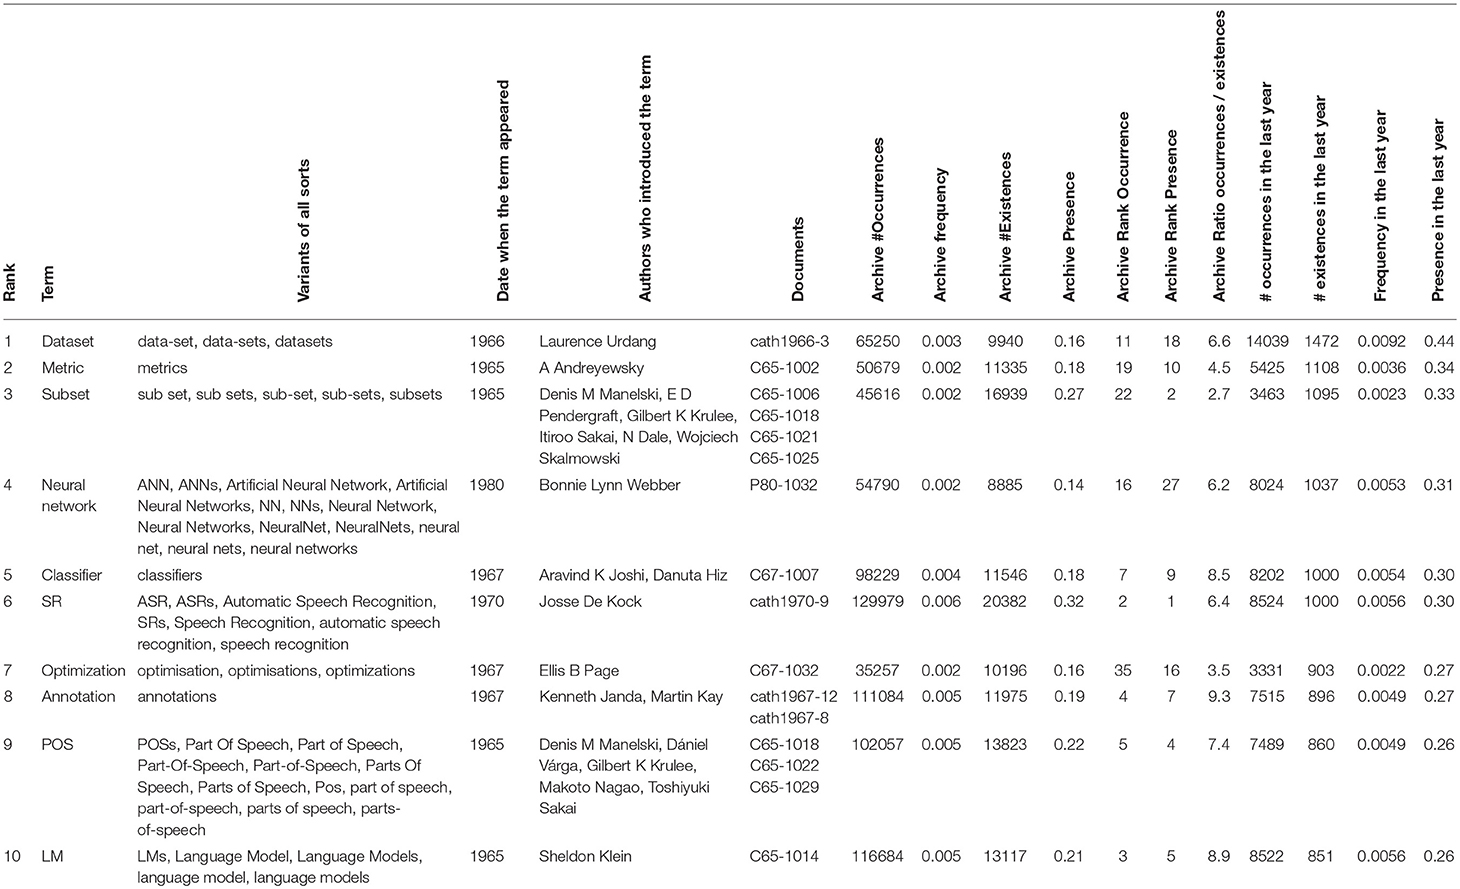
Table A1. Ten most present terms in 2015, with variants, date, authors and publications where they were first introduced, number of occurrences and existences in 2015, number of occurrences, frequency, number of existences and presence in the 50 year archive, with ranking and average number of occurrences of the terms in the documents where they appear.
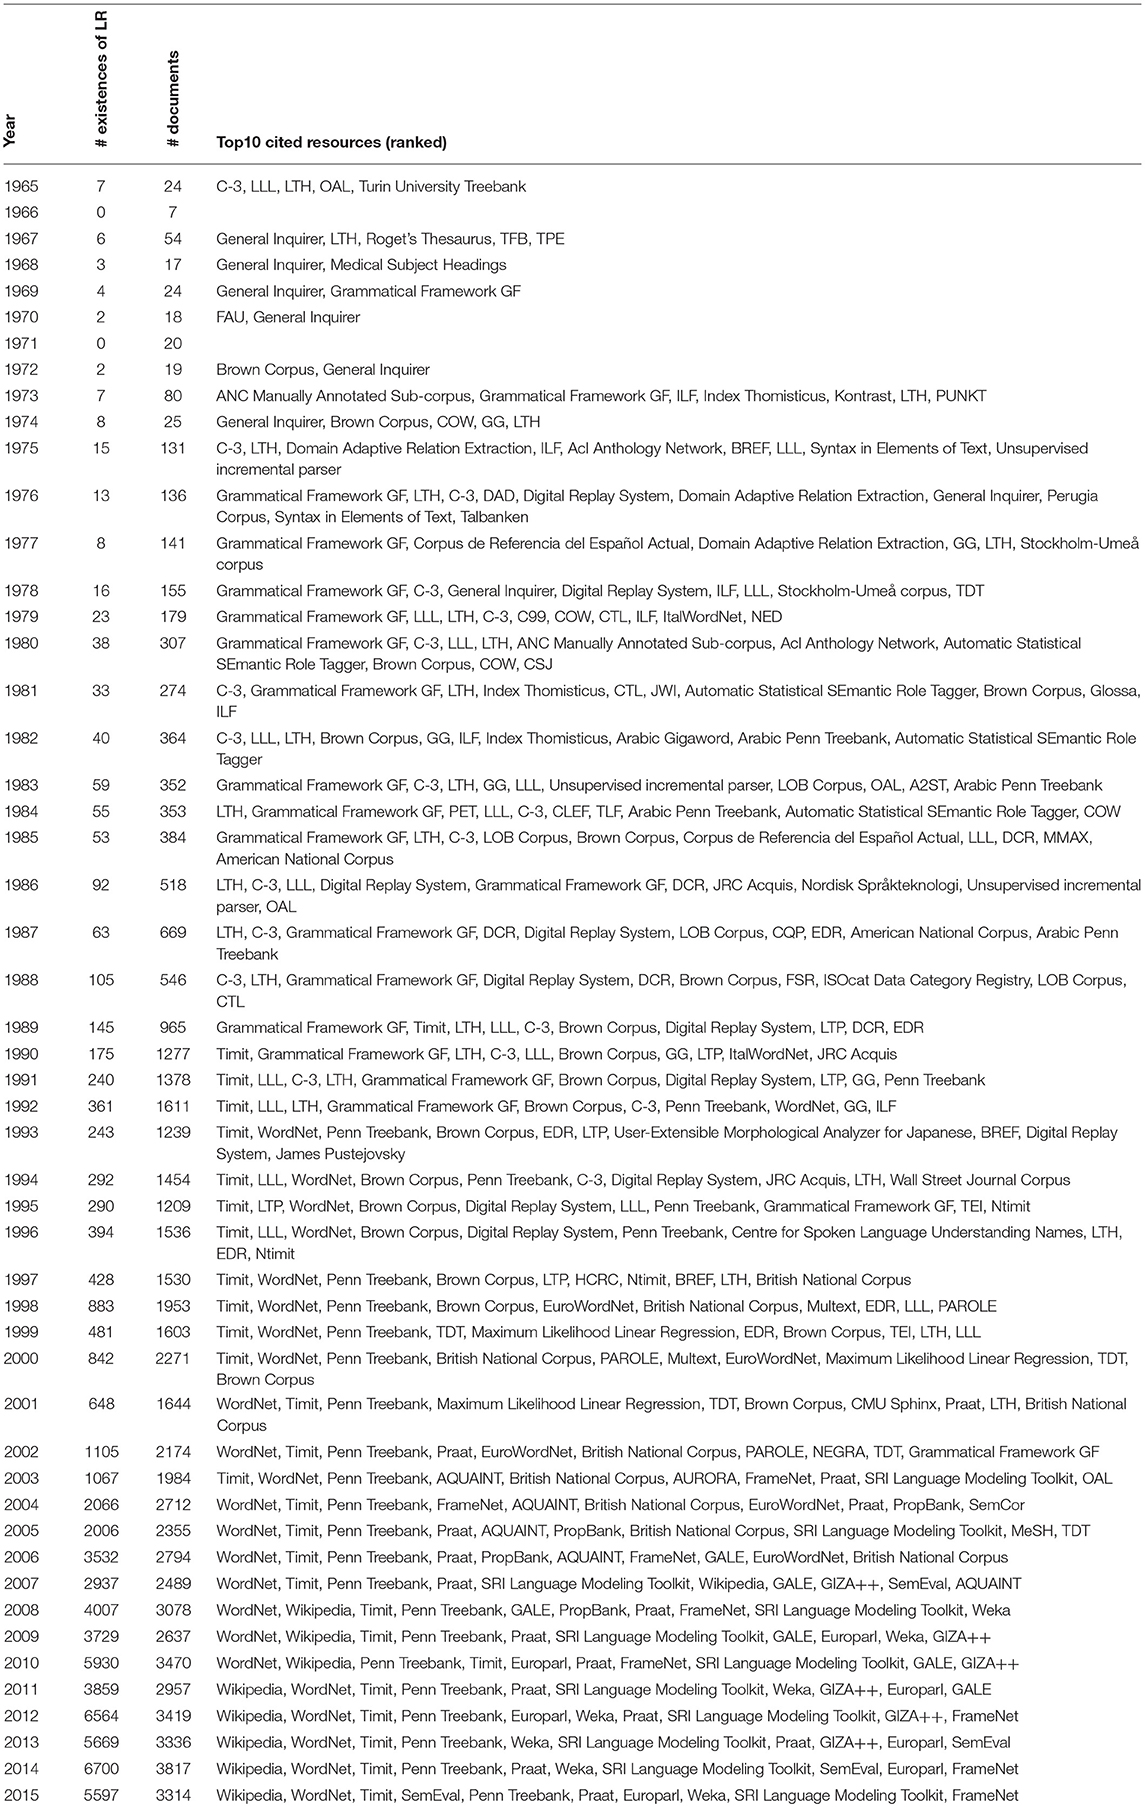
Table A2. Ranked top 10 mentioned LRE map language resources per year (1965–2015).
Keywords: speech processing, natural language processing, text analytics, bibliometrics, scientometrics, informetrics
Citation: Mariani J, Francopoulo G, Paroubek P and Vernier F (2019) The NLP4NLP Corpus (II): 50 Years of Research in Speech and Language Processing. Front. Res. Metr. Anal. 3:37. doi: 10.3389/frma.2018.00037
Received: 30 January 2018; Accepted: 07 December 2018;
Published: 07 February 2019.
Edited by:
Iana Atanassova, Université Bourgogne Franche-Comté, FranceReviewed by:
Qi Yu, Shanxi Medical University, ChinaMariannig Le Béchec, Claude Bernard University Lyon 1, France
Copyright © 2019 Mariani, Francopoulo, Paroubek and Vernier. This is an open-access article distributed under the terms of the Creative Commons Attribution License (CC BY). The use, distribution or reproduction in other forums is permitted, provided the original author(s) and the copyright owner(s) are credited and that the original publication in this journal is cited, in accordance with accepted academic practice. No use, distribution or reproduction is permitted which does not comply with these terms.
*Correspondence: Joseph Mariani, am9zZXBoLm1hcmlhbmlAbGltc2kuZnI=