 Alessandro Rovetta
- 1Research and Disclosure Division, Mensana srls, Brescia, Italy
- 2Technological and Scientific Research, Redeev srl, Napoli, Italy
Background: Alongside the COVID-19 pandemic, government authorities around the world have had to face a growing infodemic capable of causing serious damages to public health and economy. In this context, the use of infoveillance tools has become a primary necessity.
Objective: The aim of this study is to test the reliability of a widely used infoveillance tool which is Google Trends. In particular, the paper focuses on the analysis of relative search volumes (RSVs) quantifying their dependence on the day they are collected.
Methods: RSVs of the query coronavirus + covid during February 1—December 4, 2020 (period 1), and February 20—May 18, 2020 (period 2), were collected daily by Google Trends from December 8 to 27, 2020. The survey covered Italian regions and cities, and countries and cities worldwide. The search category was set to all categories. Each dataset was analyzed to observe any dependencies of RSVs from the day they were gathered. To do this, by calling
Results: Google Trends has been subject to an acceptable quantity of anomalies only as regards the RSVs of Italian regions (0% in both periods 1 and 2) and countries worldwide (9.7% during period 1 and 10.9% during period 2). However, the correlations between RSVs and COVID-19 cases underwent significant variations even in these two datasets (
Conclusion: In the considered timespans, Google Trends has proved to be reliable only for surveys concerning RSVs of countries worldwide. Since RSVs values showed a high dependence on the day they were gathered, it is essential for future research that the authors collect queries’ data for several consecutive days and work with their RSVs averages instead of daily RSVs, trying to minimize the standard errors until an established confidence threshold is respected. Further research is needed to evaluate the effectiveness of this method.
Introduction
A novel coronavirus was identified in Wuhan (Hubei province, China) in late 2019 (Wu et al., 2020). This was responsible for a severe respiratory disease named COVID-19 by the WHO on February 11, 2020. The virus, formerly reported as 2019-nCoV, was subsequently named SARS-CoV-2. Despite attempts by governments and the scientific community to contain the infection, COVID-19 has spread beyond the Chinese borders and was declared a pandemic by the WHO on March 11, 2020 (Cascella et al., 2021). Such pandemic has put a strain on health systems and economies of countries worldwide, causing more than 3 million deaths and forcing governments to implement very restrictive lockdowns (Askitas et al., 2021). In this scenario, fake news and inaccurate information circulated widely on the web creating severe issues to public health and economy all over the world (Pennycook et al., 2020; Rovetta and Bhagavathula, 2020; Tagliabue et al., 2020; Tasnim et al., 2020). Dr Tedros Adhanom Ghebreyesus-director of the World Health Organization (WHO) - claimed that the battle we are fighting does not only concern the epidemic but also its infodemic (UNS, 2020). Moreover, the WHO itself has launched an international campaign called “Managing the COVID-19 infodemic: Promoting healthy behaviors and mitigating the harm from misinformation and disinformation” to sensitize states to contrast the spread of misinformation (WHO, 2020). To date, one of the main problems consists in conspiracy news relating to alleged vaccine damage, which can seriously compromise the international strategy for the abatement of SARS-CoV-2 (Tollefson, 2021). Therefore, the demand for new effective and efficient infodemiological methods has never been as pressing as today. In this regard, scientists are increasingly adopting infoveillance tools to monitoring the infodemic on websites, social media, and newspapers (Zeraatkar and Ahmadi, 2020). Numerous research groups have exploited the state-of-art of machine learning to catalog and analyze the large flows of COVID-19-related information circulating on social networks, forums, and online platforms like Twitter, Reddit, Instagram, Facebook, and YouTube (Tsao et al., 2021). Among the most skillful approaches, Rustam et al. adopted a wide variety of supervised algorithms such as random forest (RF), XGBoost classifier, support vector classifier (SVC), extra trees classifier (ETC), decision tree (DT), and long-short term memory (LSTM) deep learning model to analyze COVID-19-related tweets sentiment (Rustam et al., 2021). Their results showed that: 1) Extra Trees Classifiers outperformed all other models by achieving a 0.93 accuracy score using the authors’ proposed concatenated features set; 2) the LSTM achieved low accuracy as compared to machine learning classifiers. Nonetheless, Jelodar et al. implemented a novel application for natural language process (NLP) based on an LSTM model for the same purpose on Reddit posts, obtaining convincing results (Jelodar et al., 2020). Mackey et al. also studied the dissemination of fake and dangerous information on Twitter and Instagram through NLP and deep learning (Mackey et al., 2020). Although this evidence seems contradictory, it merely shows the vast range of unexplored possibilities offered by machine learning for infodemiological aims and, at the same time, that the model accuracy depends strongly on the initial conditions. Ergo, Machine learning showed excellent effectiveness but it has limitations (Mohri et al., 2012). As highlighted by comparing scientific literature, its application needs ad-hoc interventions not always assimilable in a general methodology. Supervised algorithms require large training datasets to produce inferred functions for mapping new examples; such a procedure consumes time and resources, thus slowing down the infoveillance process consistently. On the contrary, unsupervized models learn from raw data without any prior knowledge; therefore, results might be less inaccurate and take more time if compared with supervised learning. Moreover, datasets always require appropriate processing before using them. In this regard, many authors have preferred to adopt more traditional methods, like multivariate regressions, cross-correlations, time-series analysis, and descriptive statistics (Tsao et al., 2021). The majority of these are now integrated into easy-to-use automatic kits available for Microsoft Excel software or similar (e.g., Real Statistics and Zaiontz, 2021; XLSTAT, 2021), which is a great advantage in terms of operational speed. However, when dealing with platforms such as Twitter, Reddit, Instagram, or Facebook, the collection and analysis of posts is still laborious: indeed, it requires the use of databases already extracted (which limits the power of investigation) or application programming interfaces (APIs) and all datasets must be suitably processed before use (Kim et al., 2020). Therefore, while all of the above methods are essential and powerful for historical data analysis, more immediate and rapid tools are equally necessary for quasi-real-time infoveillance. In particular, Google Trends—an open online infoveillance tool developed by Google™—has been widely used by the scientific community not only for monitoring disinformation but also for making rapid epidemiological predictions on the spread of infectious diseases (Mavragani and Ochoa, 2019). Google Trends quantifies the users’ web interest in a keyword (e.g., “football”) by returning a normalized value ranging from 0 to 100, called relative search volume, proportional to the ratio between the keyword-related queries and the total web queries. The user can also narrow the analysis to specific geographical areas (continents, states, regions, cities, etc.) in a fixed timelapse. In this regard, the quantitative analysis of relative search volumes of pre-selected queries was used for several purposes during COVID-19 pandemic: 1) predicting COVID-19 cases (Ahmad et al., 2020; Ayyoubzadeh et al., 2020; Jimenez et al., 2020; Mavragani and Gkillas, 2020; Sulyok et al., 2020; Venkatesh and Gandhi, 2020; Prasanth et al., 2021), 2) studying the web interest in COVID-19 (Effenberger et al., 2020; Hu et al., 2020; Rovetta and Castaldo, 2020; Springer et al., 2020), 3) studying the adoption of infodemic terms and related consequences (Cinelli et al., 2020; Cuan-Baltazar et al., 2020; Rovetta and Bhagavathula, 2020), 4) studying a full range of users’ psychological-emotional responses (Husnayain et al., 2020; Rovetta and Castaldo, 2020; Zattoni et al., 2020; Brodeur et al., 2021; Zitting et al., 2021), 5) studying the impact of mass media and governmental policies on users’ web searches (Rovetta and Bhagavathula, 2020; Sousa-Pinto et al., 2020; Huynh Dagher et al., 2021), 6) studying the economic-commercial impact (Brodeur et al., 2021; Sotis, 2021), 7) studying the spread of COVID-19 symptoms (Ahmad et al., 2020; Jimenez et al., 2020; Kluger and Scrivener, 2020; Walker et al., 2020), 8) studying other various web interests (Berger et al., 2021; Elsaie and Youssef, 2021). This type of research is mainly based on the search for statistical cross-correlations between users’ web searches related to specific topics, such as symptoms, drugs, therapies, vaccines, number of infected people, number of deaths, anxiety, fear, stress, etc., and the number of disease contagions and deaths officially registered after a certain timespan. However, not all that glitters is gold. First, many of these studies propose conflicting conclusions: specifically, some authors claim that the correlations between COVID-19 cases and web searches are generally spurious as mass media and government agencies’ announcements can influence them. Second, this paper shows that Google Trends has some limitations that are often overlooked and which risk heavily biasing and distorting correlation-based analytics. Furthermore, some anomalies in the calculus of relative search volumes (RSVs) could also alter any infodemiological analysis in an unpredictable way. Nonetheless, as shown above, a considerable portion of the academic world continues to rely on this tool to conduct its scientific investigations. This is probably due to the fact that Google Trends offers a simple and immediate way to obtain clean data (i.e., without complications related to privacy) on the vast majority of users’ web interests all over the world. This efficiency can be decisive in the epidemiological and infodemiological evaluation; indeed, although scientists and governments have launched mobile applications and websites with similar purposes (Kondylakis et al., 2020), the percentage of users involved is significantly lower than that of Google. Such services could also select a more targeted user, undermining the demand for randomness in the sample extraction (e.g., deniers and conspirators are automatically excluded from the dataset). Anyway, the combined use of both these methods could help us better understand their strengths and limitations and serve as a complete infoveillance approach. Therefore, the aim of this study is to delve into the aforementioned issues exploring their nature and searching for solutions to circumventing them, thus allowing the scientific community to continue using Google Trends through a more reliable approach.
Methods
To assess the reliability of Google Trends (GT), relative search volumes (RSVs) of a specific query in a fixed period were downloaded on different days as to reveal any dependence on the date they were collected. According to Google, RSVs are calculated as follows: each data point is divided by the total searches of the geography and time range it represents to compare relative popularity. Otherwise, places with the most search volume would always be ranked highest. The resulting numbers are then scaled on a range of 0–100 based on a topic’s proportion to all searches on all topics (Google Support, 2021). In this context, “anomalies” were defined as those countries, regions, or cities whose RSVs appeared only on specific days.
Data Collection
RSVs of the query coronavirus + covid were collected from two distinct periods: 1 February—4 December, 2020 (period 1), and 20 February—18 May, 2020 (period 2). As shown in previous studies, this query encompasses 80% of COVID-19-related web searches worldwide (Rovetta and Bhagavathula, 2020). For this reason, it has been considered well representative of the web interest in COVID-19. Furthermore, an independent verification confirmed these results, highlighting an increasing use of the keyword covid (Supplementary File S1). This final survey was carried out exploiting the rising queries and the associated queries directly provided by Google Trends. Period 1, corresponding to the Italian lockdown, was chosen for GT to provide daily RSVs, while period 2 was chosen for GT to provide weekly RSVs. The survey was carried out on Italian regions and cities, and worldwide countries and cities. All RSVs of periods 1 and 2 were collected daily for a minimum of 7 days and until any anomaly was highlighted; when no anomaly was identified within 15–20 days, the investigation was considered concluded. The data-collection period ranged from 8 to 25 December, 2020. The Google Trends category search-parameter was set to all categories. All details are shown in Table 1.
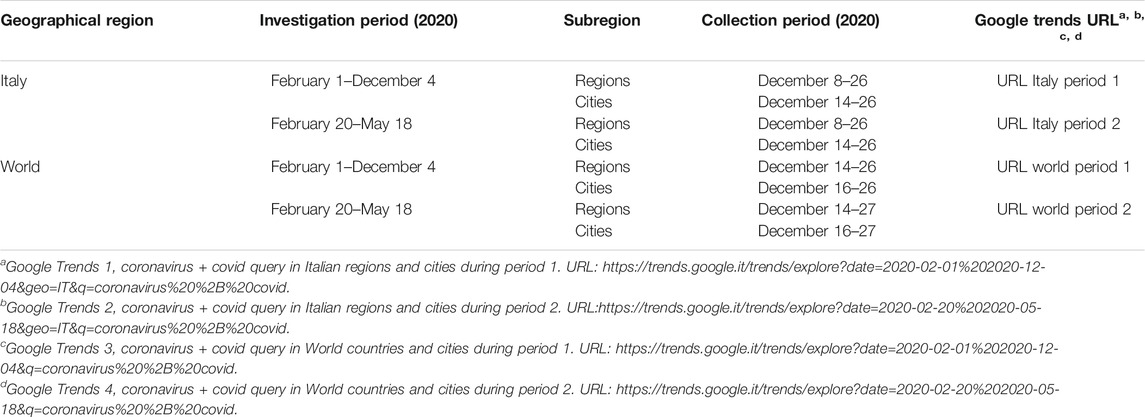
TABLE 1. Google Trends keywords summary.
Data on Italian COVID-19 cases was collected from the Italian Civil Protection Department official dashboard (ICPD, 2020). Data on international COVID-19 cases was collected from the World Health Organization official dashboard (WHO, 2020).
Statistical Analysis
By calling
Results
Italian Regions’ Web Interest During Period 1 (1 February–4 December, 2020)
As shown in Figure 1, there have been strong relationships between RSVs and the dates they were collected: in fact, the regional ranking of web interest underwent several unpredictable variations even as regards the peak values RSV = 100.
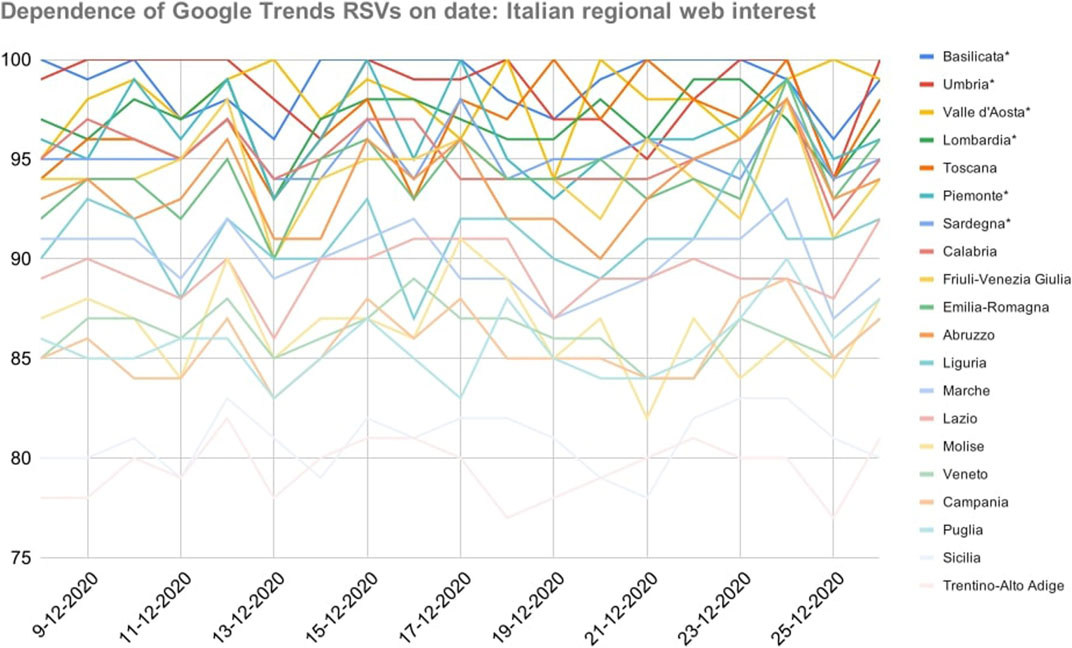
FIGURE 1. Dependence of Google Trends relative search volumes (RSVs) on collection date: Italian regions’ web interest in the query coronavirus + covid during period 1 (1 February–4 December, 2020). X-axis: dates on which the RSVs were collected. Y-axis: Google Trends RSV. * = Regions that showed a non-normal trend over time.
The daily standard deviation of the sample ranged in the interval [6.6, 7.6], making all values in the central band mutually confident. Because of that, any correlations between RSVs and COVID-19 cases (or related statistics) could not be meaningful if merely based on a single-day dataset. Furthermore, even supposing no variance in daily samples, the correlation between the number of COVID-19 cases and RSVs went from
Italian Regions’ Web Interest During Period 2 (20 February–18 May, 2020)
As shown in Figure 2 (next page), the variance of RSVs as a function of the day they were gathered was lower than that of the previous dataset
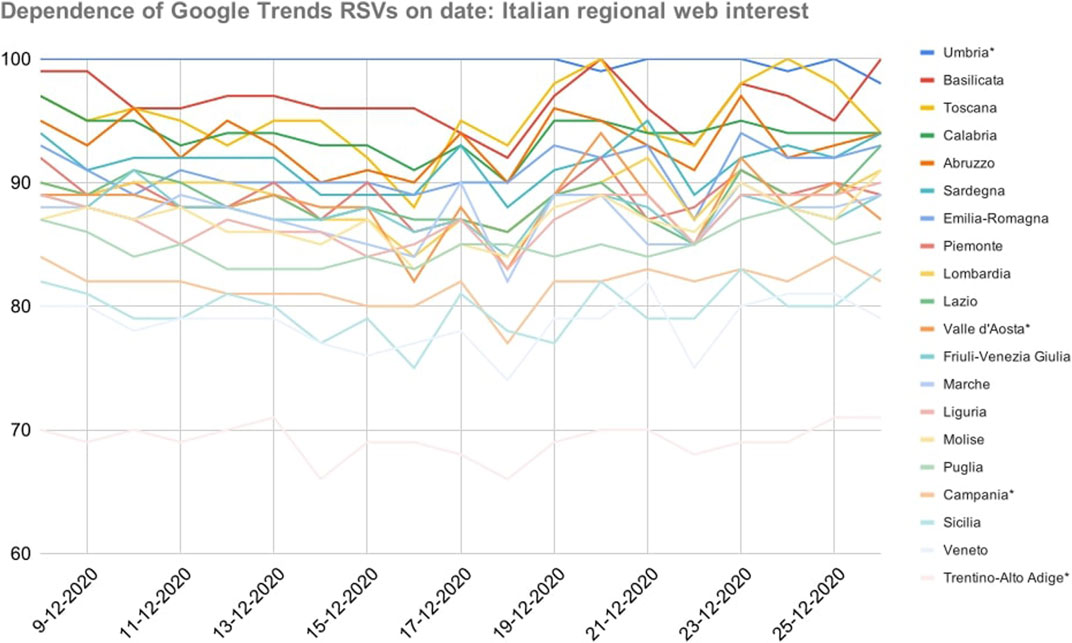
FIGURE 2. Dependence of Google Trends relative search volumes (RSVs) on collection date: Italian regions’ web interest in the query coronavirus + covid during period 2 (20 February–18 May, 2020). X-axis: dates on which the RSVs were collected. Y-axis: Google Trends RSV. * = Regions that showed a non-normal trend over time.
The confidence threshold was exceeded (e.g., Abruzzo, 47%). Spearman and Pearson correlations between COVID-19 cases and daily RSVs ranged in the intervals
Italian Cities’ Web Interest During Period 1 and Period 2
As shown in Tables 2, 3 (next two pages), significant anomalies occurred in 33.3% of Italian cities during period 1 and 45.8% during period 2. In particular, Perugia and Prato-absent respectively 7- and 10-times during period 1- recorded RSVs = 100 on 6 occasions. During period 2, Messina, Perugia, Pescara, Prato, and Salerno, recorded only 1 RSV out of 14 samples, while Parma recorded 2 RSVs. Therefore, any type of correlation or other statistical calculus, evaluation, or consideration on this dataset would be highly dependent on the day the data was gathered.
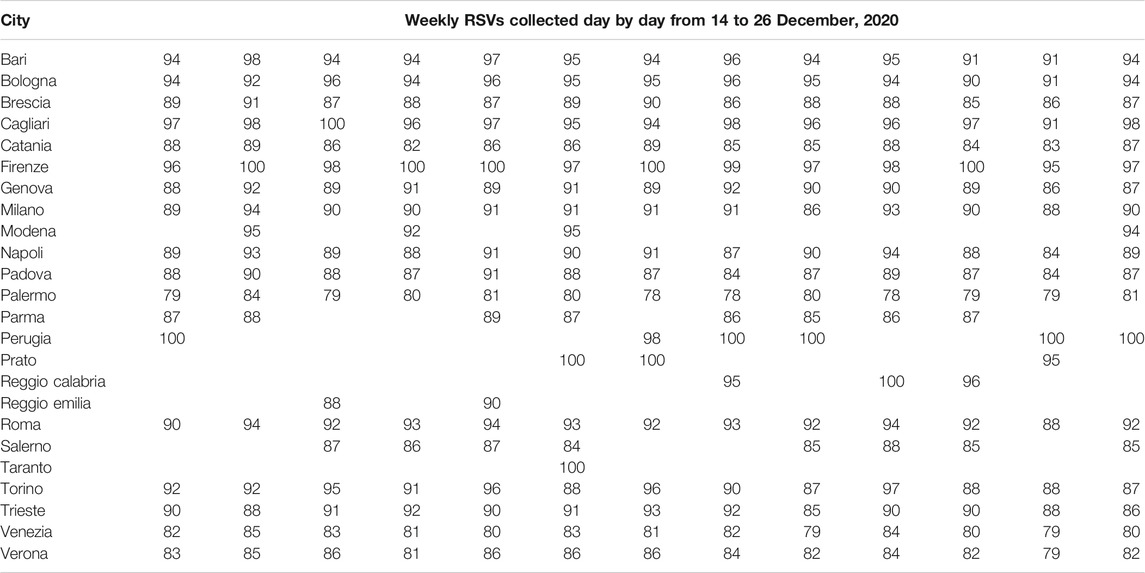
TABLE 2. Dependence of Google Trends relative search volumes (RSVs) on collection date: Italian cities’ web interest in the query coronavirus + covid during period 1 (1 February–4 December, 2020).
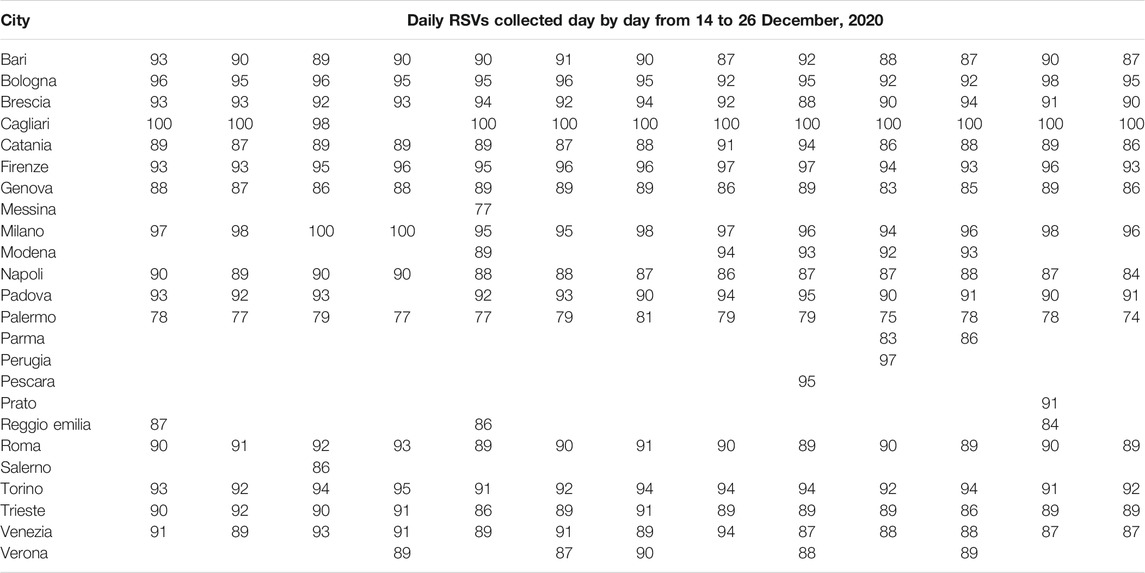
TABLE 3. Dependence of Google Trends relative search volumes (RSVs) on collection date: Italian cities’ web interest in the query coronavirus + covid during period 2 (20 February–18 May, 2020).
Global Web Interest During Period 1 (February–4 December, 2020)
Google Trends reported a maximum of 62 countries’ RSVs (Supplementary Table S1). Significant anomalies occurred in 6 cases (9.7%) and the peak
Global Web Interest During Period 2 (20 February–18 May, 2020)
Google Trends reported a maximum of 64 countries’ RSVs (Supplementary Table S2). Significant anomalies occurred in 7 cases (10.9%) and the peak
International Cities’ Web Interest During Period 1 and Period 2
As shown in Tables 4, 5 (next two pages), significant anomalies occurred in 30.4% of international cities during period 1 and 38.1% during period 2. In particular, Bogotà, Chicago, Dubai, Houston, Hyderabad, Los Angeles, Sao Paulo, Santiago of Chile were affected by anomalies during period 1 and period 2, which also included Milan (
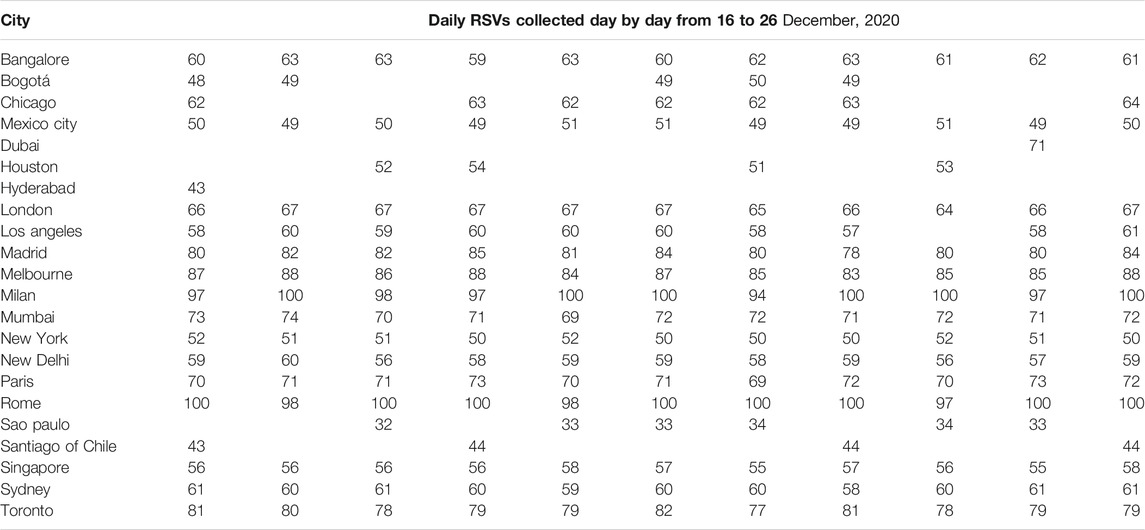
TABLE 4. Dependence of Google Trends relative search volumes (RSVs) on collection date: international cities’ web interest in the query coronavirus + covid during period 1 (1 February–4 December, 2020).
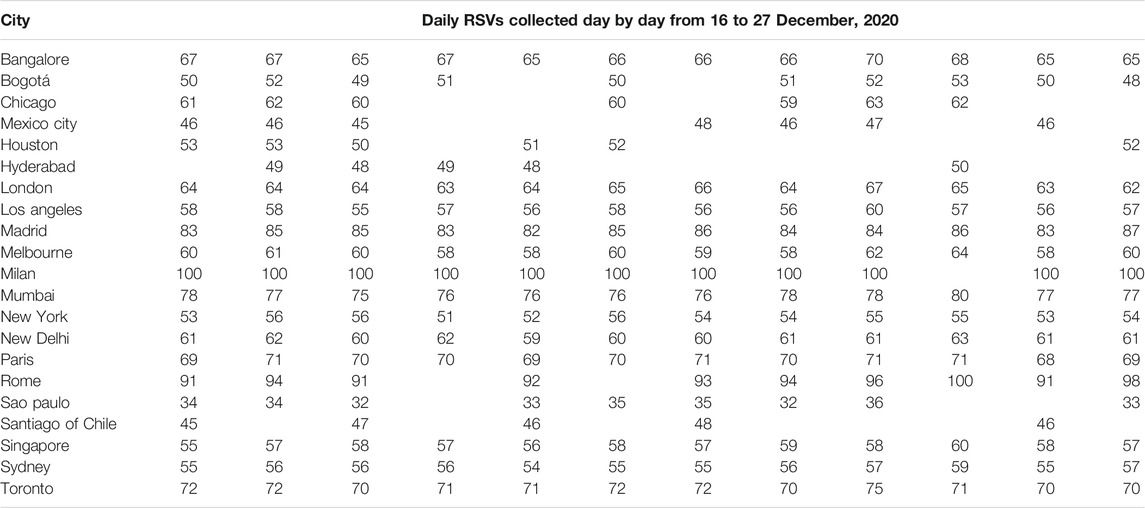
TABLE 5. Dependence of Google Trends relative search volumes (RSVs) on collection date: international cities’ web interest in the query coronavirus + covid during period 2 (20 February–18 May, 2020).
Discussion
As far as the author knows, this is the first study to assess Google Trends reliability through an iterated queries analysis. In particular, this paper clearly demonstrates a strong dependence of Google Trends relative search volumes (RSVs) values on the date they are gathered. The dataset of Italian regions above all, although if not affected by anomalies, showed how the collection of the same queries’ RSVs (i.e. same category, area and period) on different days is able to substantially modify a statistical correlation between RSVs themself and an external quantity (in this case, the number of COVID-19 infections). Moreover, in all the other datasets, an even greater problem was highlighted such as the presence or absence of specific RSVs depending on the day the sample was gathered. This phenomenon has also affected cities that have reached peak values on several occasions, such as Milan and Rome in the global dataset and Perugia and Prato in the Italian dataset. Furthermore, the fact that Prato and Perugia have reached a peak of web interest in the Italian dataset but not in the international dataset shows how Google Trends RSV measurement includes only specific geographical areas according to the search item chosen by the user. Finally, RSVs of Italian regions and cities as well as RSVs of international cities showed such a daily variance that these areas were often statistically confident with each other, compromising any search for correlations or any other rank-based grouping. The most reliable dataset—i.e. a sample that showed an acceptable number of anomalies and whose data did not exceed the confidence threshold—was that of countries worldwide both during period 1 and period 2. However, even in this case there were outliers capable of destroying the correlation between RSVs and COVID-19 cases. The results of this research cast an aura of uncertainty in using Google Trends for making infodemiological or epidemiological evaluations. In all studies conducted so far, data was extracted only once as the authors could not expect the dependence of RSVs on the day of collection. Anomalies can disrupt the statistical significance of a correlation, as they can change the distributive nature of the sample by transforming it from Gaussian to non-Gaussian or vice versa. Thus, depending on the type of correlation, they can irrevocably compromise the use of p-values as graded measures of evidence against the null hypothesis. Moreover, since Pearson coefficient is sensitive to outliers, they can drastically affect its strength (Mukaka, 2012). Finally, pronounced changes in RSV can invalidate the reliability of a dataset. For example, no analysis on the geographical distribution of web interest in a chosen topic for a specific area can be carried out when RSVs varies significantly from day to day (although the investigated period is always the same). But these are not the only criticalities that this survey has pointed out: indeed, this evidence shows that any study performed through Google Trends is inherently not reproducible. At present, the actual algorithm by which Google Trends detects query data is unknown. This makes it difficult, if not impossible, to identify the causes of this phenomenon. Alongside the limitations highlighted in this work, Cervellin et al. pointed out that web queries can be influenced by main media, further reducing the credibility of this research tool (Cervellin et al., 2017). Nuti et al. have previously found that a large multitude of papers lack the information needed to make them fully reproducible (Nuti et al., 2014). Nevertheless, Google Trends has served and still serves as an excellent tool for infoveillance and infodemiology: in fact, even admitting that newspapers and newscasts can influence web queries, it provides a way to quantify the web interest in a specific topic more efficiently than any other methods historically used (e.g., population surveys) (Amber et al., 2016; Dreher et al., 2018; Mohamad and Kok, 2019; Havelka et al., 2020). Moreover, it can be used as a complement to a traditional analysis (Schootman et al., 2014). During the COVID-19 pandemic, it was widely used by the scientific community and continues to be. Therefore, infoveillance and infodemiology scholars must adopt a more robust criterion for collecting data from Google Trends. Specifically, a series of steps can minimize the likelihood of fatal misinterpretation: 1) the trend of the RSV of a query for pre-selected periods and geographic regions must be gathered and monitored daily to assess its stability, i.e. the absence of anomalies and dramatic changes in the RSV of geographic subunits (like cities, regions, or nations). 2) If the trend has been stable for at least 7 days, continue to download data until statistical incompatibility between the RSVs of the various subunits has been reached (e.g., Welch’s t-test > 1.5). If the dataset is not normally distributed, it is recommended to perform at least 30 extractions; otherwise, it is possible to adopt a non-parametric test. 3) Use the mean RSV values of each subunit as measures to represent the sample, also providing their 95% confidence interval (or variability range). 4) When searching for correlations between RSV and other quantities, calculate them for every daily dataset and provide each mean value together with its 95% confidence interval (or variability range). This technique refers to standard frequentist inference criteria, ergo it applies to any frequentistic dataset. The central limit theorem ensures that mean values and confidence intervals are valid statistical measures for making comparisons regardless of data distribution (Kwak and Kim, 2017). Regarding the influence of media or external sources on RSV, Sato et al. are developing an analytical approach to clean up data from these disturbances (Sato et al., 2021). This would consent to the adoption of Google Trends also in the epidemiological field. In conclusion, Google Trends represents a great source of information for the entire scientific community. Nonetheless, more details should be provided by Google on how RSVs are presented to users. To ensure full reliability of a Google Trends dataset, it is essential for future research that authors collect queries’ data for several consecutive days and work with their RSVs averages instead of daily RSVs, trying to minimize the standard errors until an established confidence threshold is respected. Anyway, since this analysis is limited to a single query in two fixed time frames, further research is needed to understand when and how the proposed method is sufficient to contain the oscillations of the RSV acceptably. In particular, it is necessary to establish the causal relationship between Google Trends datasets selection and the occurrence of anomalies and sudden changes in the RSV.
Data Availability Statement
The original contributions presented in the study are included in the article/Supplementary Material, further inquiries can be directed to the corresponding author.
Author Contributions
The author confirms being the sole contributor of this work and has approved it for publication.
Conflict of Interest
Author AR was employed by company Redeev srl and Mensana srls.
Supplementary Material
The Supplementary Material for this article can be found online at: https://www.frontiersin.org/articles/10.3389/frma.2021.670226/full#supplementary-material
References
Ahmad, I., Flanagan, R., and Staller, K. (2020). Increased Internet Search Interest for GI Symptoms May Predict COVID-19 Cases in US Hotspots. Clin. Gastroenterol. Hepatol. 18 (12), 2833–2834.e3. doi:10.1016/j.cgh.2020.06.058
Amber, K. T., Bloom, R., and Hu, S. (2016). Association of Google Search Volume Index Peaks for Skin Cancer with Skin Cancer Awareness Month-Reply. JAMA Dermatol. 152 (1), 113–114. doi:10.1001/jamadermatol.2015.3815
Amrhein, V., Korner-Nievergelt, F., and Roth, T. (2017). The Earth Is Flat (P > 0.05): Significance Thresholds and the Crisis of Unreplicable Research. PeerJ. 5, e3544. doi:10.7717/peerj.3544
Askitas, N., Tatsiramos, K., and Verheyden, B. (2021). Estimating Worldwide Effects of Non-pharmaceutical Interventions on COVID-19 Incidence and Population Mobility Patterns Using a Multiple-Event Study. Sci. Rep. 11 (1), 1972. doi:10.1038/s41598-021-81442-x
Ayyoubzadeh, S. M., Ayyoubzadeh, S. M., Zahedi, H., Ahmadi, M., and R Niakan Kalhori, S. (2020). Predicting COVID-19 Incidence through Analysis of Google Trends Data in Iran: Data Mining and Deep Learning Pilot Study. JMIR Public Health Surveill. 6 (2), e18828. doi:10.2196/18828
Berger, L. M., Ferrari, G., Leturcq, M., Panico, L., and Solaz, A. (2021). COVID-19 Lockdowns and Demographically-Relevant Google Trends: A Cross-National Analysis. PLoS One 16 (3), e0248072. doi:10.1371/journal.pone.0248072
Brodeur, A., Clark, A. E., Fleche, S., and Powdthavee, N. (2021). COVID-19, Lockdowns and Well-Being: Evidence from Google Trends. J. Public Econ. 193, 104346. doi:10.1016/j.jpubeco.2020.104346
Cascella, M., Rajnik, M., Aleem, A., Dulebohn, S. C., and Di Napoli, R. (2021). Features, Evaluation, and Treatment of Coronavirus (COVID-19). 2021 Mar 1. in StatPearls [Internet]. Treasure Island, FL: StatPearls Publishing.
Cervellin, G., Comelli, I., and Lippi, G. (2017). Is Google Trends a Reliable Tool for Digital Epidemiology? Insights from Different Clinical Settings. J. Epidemiol. Glob. Health 7 (3), 185–189. doi:10.1016/j.jegh.2017.06.001
Cinelli, M., Quattrociocchi, W., Galeazzi, A., Valensise, C. M., Brugnoli, E., Schmidt, A. L., et al. (2020). The COVID-19 Social Media Infodemic. Sci. Rep. 10 (1), 16598. doi:10.1038/s41598-020-73510-5
Cuan-Baltazar, J. Y., Muñoz-Perez, M. J., Robledo-Vega, C., Pérez-Zepeda, M. F., and Soto-Vega, E. (2020). Misinformation of COVID-19 on the Internet: Infodemiology Study. JMIR Public Health Surveill. 6 (2), e18444. doi:10.2196/18444
Dreher, P. C., Tong, C., Ghiraldi, E., and Friedlander, J. I. (2018). Use of Google Trends to Track Online Behavior and Interest in Kidney Stone Surgery. Urology 121, 74–78. doi:10.1016/j.urology.2018.05.040
Effenberger, M., Kronbichler, A., Shin, J. I., Mayer, G., Tilg, H., and Perco, P. (2020). Association of the COVID-19 Pandemic with Internet Search Volumes: A Google TrendsTM Analysis. Int. J. Infect. Dis. 95, 192–197. doi:10.1016/j.ijid.2020.04.033
Elsaie, M. L., and Youssef, E. A. (2021). Interest in Aesthetics during COVID‐19 Pandemic: A Google Trends Analysis. J. Cosmet. Dermatol. 00, 1–12. doi:10.1111/jocd.14101
Ghasemi, A., and Zahediasl, S. (2012). Normality Tests for Statistical Analysis: A Guide for Non-statisticians. Int. J. Endocrinol. Metab. 10 (2), 486–489. doi:10.5812/ijem.3505
Google Support (2021). FAQ about Google Trends Data—How Is Google Trends Data Normalized?. Available at: https://support.google.com/trends/answer/4365533?hl=en (Accessed April 17, 2021).
Havelka, E. M., Mallen, C. D., and Shepherd, T. A. (2020). Using Google Trends to Assess the Impact of Global Public Health Days on Online Health Information Seeking Behaviour in Central and South America. J. Glob. Health 10 (1), 010403. doi:10.7189/jogh.10.010403
Hu, D., Lou, X., Xu, Z., Meng, N., Xie, Q., Zhang, M., et al. (2020). More Effective Strategies Are Required to Strengthen Public Awareness of COVID-19: Evidence from Google Trends. J. Glob. Health 10 (1), 011003. doi:10.7189/jogh.10.011003
Husnayain, A., Shim, E., Fuad, A., and Su, E. C.-Y. (2020). Understanding the Community Risk Perceptions of the COVID-19 Outbreak in South Korea: Infodemiology Study. J. Med. Internet Res. 22 (9), e19788. doi:10.2196/19788
Huynh Dagher, S., Lamé, G., Hubiche, T., Ezzedine, K., and Duong, T. A. (2021). The Influence of Media Coverage and Governmental Policies on Google Queries Related to COVID‐19 Cutaneous Symptoms: Infodemiology Study. JMIR Public Health Surveill. 7 (2), e25651. doi:10.2196/25651
Italian Civil Protection Department (ICPD) (2020). COVID-19 Updates. Available at: https://opendatadpc.maps.arcgis.com/apps/opsdashboard/index.html#/b0c68bce2cce478eaac82fe38d4138b1 (Accessed December 27, 2020).
Jelodar, H., Wang, Y., Orji, R., and Huang, S. (2020). Deep Sentiment Classification and Topic Discovery on Novel Coronavirus or COVID-19 Online Discussions: NLP Using LSTM Recurrent Neural Network Approach. IEEE J. Biomed. Health Inform. 24 (10), 2733–2742. doi:10.1109/JBHI.2020.3001216
Jimenez, A. J., Estevez-Reboredo, R. M., Santed, M. A., and Ramos, V. (2020). COVID-19 Symptom-Related Google Searches and Local COVID-19 Incidence in Spain: Correlational Study. J. Med. Internet Res. 22 (12), e23518. doi:10.2196/23518
Kim, T. K. (2015). T Test as a Parametric Statistic. Korean J. Anesthesiol. 68 (6), 540–546. doi:10.4097/kjae.2015.68.6.540
Kim, Y., Nordgren, R., and Emery, S. (2020). The Story of Goldilocks and Three Twitter's APIs: A Pilot Study on Twitter Data Sources and Disclosure. Int J Environ Res Public Health 17 (3), 864. doi:10.3390/ijerph17030864
Kluger, N., and Scrivener, J. N. (2020). The Use of Google Trends for Acral Symptoms during COVID‐19 Outbreak in France. J. Eur. Acad. Dermatol. Venereol. 34 (8), e358–e360. doi:10.1111/jdv.16572
Kondylakis, H., Katehakis, D. G., Kouroubali, A., Logothetidis, F., Triantafyllidis, A., Kalamaras, I., et al. (2020). COVID-19 Mobile Apps: A Systematic Review of the Literature. J. Med. Internet Res. 22 (12), e23170. doi:10.2196/23170
Kwak, S. G., and Kim, J. H. (2017). Central Limit Theorem: the Cornerstone of Modern Statistics. Korean J. Anesthesiol. 70 (2), 144–156. doi:10.4097/kjae.2017.70.2.144
Mackey, T. K., Li, J., Purushothaman, V., Nali, M., Shah, N., Bardier, C., et al. (2020). Big Data, Natural Language Processing, and Deep Learning to Detect and Characterize Illicit COVID-19 Product Sales: Infoveillance Study on Twitter and Instagram. JMIR Public Health Surveill. 6 (3), e20794. doi:10.2196/20794
Mavragani, A., and Gkillas, K. (2020). COVID-19 Predictability in the United States Using Google Trends Time Series. Sci. Rep. 10, 20693. doi:10.1038/s41598-020-77275-9
Mavragani, A., and Ochoa, G. (2019). Google Trends in Infodemiology and Infoveillance: Methodology Framework. JMIR Public Health Surveill. 5 (2), e13439. doi:10.2196/13439
Mohamad, M., and Kok, H. S. (2019). Using Google Trends Data to Study Public Interest in Breast Cancer Screening in Malaysia. Asian Pac. J. Cancer Prev. 20 (5), 1427–1432. doi:10.31557/APJCP.2019.20.5.1427
Mohri, M., Rostamizadeh, A., and Talwalkar, A. (2012). Foundations of Machine Learning. Cambridge, MA: The MIT Press. 9780262018258
Mukaka, M. M. (2012). Statistics Corner: A Guide to Appropriate Use of Correlation Coefficient in Medical Research. Malawi Med. J. 24 (3), 69–71.
Nuti, S. V., Wayda, B., Ranasinghe, I., Wang, S., Dreyer, R. P., Chen, S. I., et al. (2014). The Use of Google Trends in Health Care Research: A Systematic Review. PLoS One. 9 (10), e109583. doi:10.1371/journal.pone.0109583
Pennycook, G., McPhetres, J., Zhang, Y., Lu, J. G., and Rand, D. G. (2020). Fighting COVID-19 Misinformation on Social Media: Experimental Evidence for a Scalable Accuracy-Nudge Intervention. Psychol. Sci. 31, 770–780. doi:10.1177/0956797620939054
Prasanth, S., Singh, U., Kumar, A., Tikkiwal, V. A., and Chong, P. H. J. (2021). Forecasting Spread of COVID-19 Using Google Trends: A Hybrid GWO-Deep Learning Approach. Chaos, Solitons & Fractals 142, 110336. doi:10.1016/j.chaos.2020.110336
Real StatisticsZaiontz, C.(2021). Real Statistics Using Excel - Real Statistics Resource Pack. Available at: https://www.real-statistics.com/ (Accessed April 21, 2021).
Rovetta, A., and Bhagavathula, A. S. (2020). Global Infodemiology of COVID-19: Analysis of Google Web Searches and Instagram Hashtags. J. Med. Internet Res. 22 (8), e20673. doi:10.2196/20673
Rovetta, A., and Castaldo, L. (2020). The Impact of COVID-19 on Italian Web Users: A Quantitative Analysis of Regional Hygiene Interest and Emotional Response. Cureus 12 (9), e10719. doi:10.7759/cureus.10719
Rustam, F., Khalid, M., Aslam, W., Rupapara, V., Mehmood, A., and Choi, G. S. (2021). A Performance Comparison of Supervised Machine Learning Models for Covid-19 Tweets Sentiment Analysis. PLoS One 16 (2), e0245909. doi:10.1371/journal.pone.0245909
Sato, K., Mano, T., Toda, T., and Iwata, A. (2021). Need of Care in Interpreting Google Trends-Based COVID-19 Infodemiological Study Results: Potential Risk of False-Positivity. Res. Square [Preprint]. doi:10.21203/rs.3.rs-151518/v1
Schootman, M., Toor, A., Cavazos-Rehg, P., Jeffe, D. B., McQueen, A., Eberth, J., et al. (2015). The Utility of Google Trends Data to Examine Interest in Cancer Screening. BMJ Open 5, e006678. doi:10.1136/bmjopen-2014-006678
Sotis, C. (2021). How Do Google Searches for Symptoms, News and Unemployment Interact during COVID-19? A Lotka-Volterra Analysis of Google Trends Data. Qual. Quant., 1–16. doi:10.1007/s11135-020-01089-0
Sousa-Pinto, B., Anto, A., Czarlewski, W., Anto, J. M., Fonseca, J. A., and Bousquet, J. (2020). Assessment of the Impact of Media Coverage on COVID-19-Related Google Trends Data: Infodemiology Study. J. Med. Internet Res. 22 (8), e19611. doi:10.2196/19611
Springer, S., Menzel, L. M., and Zieger, M. (2020). Google Trends Provides a Tool to Monitor Population Concerns and Information Needs during COVID-19 Pandemic. Brain Behav. Immun. 87, 109–110. doi:10.1016/j.bbi.2020.04.073
Sulyok, M., Ferenci, T., and Walker, M. (2020). Google Trends Data and COVID‐19 in Europe: Correlations and Model Enhancement Are European Wide. Transbound Emerg. Dis. 00, 1–6. doi:10.1111/tbed.13887
Tagliabue, F., Galassi, L., and Mariani, P. (2020). The “Pandemic” of Disinformation in COVID-19. SN Compr. Clin. Med. 2, 1287–1289. doi:10.1007/s42399-020-00439-1
Tasnim, S., Hossain, M. M., and Mazumder, H. (2020). Impact of Rumors and Misinformation on COVID-19 in Social Media. J. Prev. Med. Public Health. 53 (3), 171–174. doi:10.3961/jpmph.20.094
Tollefson, J. (2021). The Race to Curb the Spread of COVID Vaccine Disinformation. Nature [Epub ahead of print]. doi:10.1038/d41586-021-00997-x
Tsao, S.-F., Chen, H., Tisseverasinghe, T., Yang, Y., Li, L., and Butt, Z. A. (2021). What Social Media Told Us in the Time of COVID-19: a Scoping Review. The Lancet Digital Health 3 (3), e175–e194. doi:10.1016/S2589-7500(20)30315-0
United Nations Website (2020). UN Tackles ‘infodemic’ of Misinformation and Cybercrime in COVID-19 Crisis. Available at: https://www.un.org/en/un-coronavirus-communications-team/un-tackling-%E2%80%98infodemic%E2%80%99-misinformation-and-cybercrime-covid-19 (Accessed December 28, 2020).
Venkatesh, U., and Gandhi, P. A. (2020). Prediction of COVID-19 Outbreaks Using Google Trends in India: A Retrospective Analysis. Healthc. Inform. Res. 26 (3), 175–184. doi:10.4258/hir.2020.26.3.175
Walker, A., Hopkins, C., and Surda, P. (2020). Use of Google Trends to Investigate Loss‐of‐smell‒related Searches during the COVID‐19 Outbreak. Int. Forum Allergy Rhinol. 10 (7), 839–847. doi:10.1002/alr.22580
World Health Organization Website (2020). Managing the COVID-19 Infodemic: Promoting Healthy Behaviours and Mitigating the Harm from Misinformation and Disinformation. Available at: https://www.who.int/news/item/23-09-2020-managing-the-covid-19-infodemic-promoting-healthy-behaviours-and-mitigating-the-harm-from-misinformation-and-disinformation (Accessed December 28, 2020).
World Health Organization (WHO) (2020). Coronavirus (COVID-19) Dashboard. Available at: https://covid19.who.int/ (Accessed December 28, 2020).
Wu, F., Zhao, S., Yu, B., Chen, Y.-M., Wang, W., Song, Z.-G., et al. (2020). A New Coronavirus Associated with Human Respiratory Disease in China. Nature 579 (7798), 265–269. doi:10.1038/s41586-020-2008-3
XLSTAT (2021). AddinsoftTM V. Available at: https://www.xlstat.com/en/ (Accessed April 21, 2021).
Zattoni, F., Gül, M., Soligo, M., Morlacco, A., Motterle, G., Collavino, J., et al. (2020). The Impact of COVID-19 Pandemic on Pornography Habits: a Global Analysis of Google Trends. Int. J. Impot Res. 1–8. doi:10.1038/s41443-020-00380-w
Zeraatkar, K., and Ahmadi, M. (2018). Trends of Infodemiology Studies: a Scoping Review. Health Info Libr. J. 35 (2), 91–120. doi:10.1111/hir.12216
Keywords: google trends, google trends data analysis, google trends data, COVID-19, social science research
Citation: Rovetta A (2021) Reliability of Google Trends: Analysis of the Limits and Potential of Web Infoveillance During COVID-19 Pandemic and for Future Research. Front. Res. Metr. Anal. 6:670226. doi: 10.3389/frma.2021.670226
Received: 20 February 2021; Accepted: 05 May 2021;
Published: 25 May 2021.
Edited by:
Dietmar Wolfram, University of Wisconsin–Milwaukee, United StatesReviewed by:
Yi Zhang, University of Technology Sydney, AustraliaEhsan Mohammadi, University of South Carolina, United States
Copyright © 2021 Rovetta. This is an open-access article distributed under the terms of the Creative Commons Attribution License (CC BY). The use, distribution or reproduction in other forums is permitted, provided the original author(s) and the copyright owner(s) are credited and that the original publication in this journal is cited, in accordance with accepted academic practice. No use, distribution or reproduction is permitted which does not comply with these terms.
*Correspondence: Alessandro Rovetta, cm92ZXR0YS5tcmVzZWFyY2hAZ21haWwuY29t, b3JjaWQub3JnLzAwMDAtMDAwMi00NjM0LTI3OVg=, WoS ID: AAT-9063-2020