 Joseph Mariani
 Gil Francopoulo
 Patrick Paroubek
 Frédéric Vernier1
- 1Université Paris-Saclay, CNRS, Laboratoire Interdisciplinaire des Sciences du Numérique, Orsay, France
- 2Tagmatica, Paris, France
This paper aims at analyzing the changes in the fields of speech and natural language processing over the recent past 5 years (2016–2020). It is in continuation of a series of two papers that we published in 2019 on the analysis of the NLP4NLP corpus, which contained articles published in 34 major conferences and journals in the field of speech and natural language processing, over a period of 50 years (1965–2015), and analyzed with the methods developed in the field of NLP, hence its name. The extended NLP4NLP+5 corpus now covers 55 years, comprising close to 90,000 documents [+30% compared with NLP4NLP: as many articles have been published in the single year 2020 than over the first 25 years (1965–1989)], 67,000 authors (+40%), 590,000 references (+80%), and approximately 380 million words (+40%). These analyses are conducted globally or comparatively among sources and also with the general scientific literature, with a focus on the past 5 years. It concludes in identifying profound changes in research topics as well as in the emergence of a new generation of authors and the appearance of new publications around artificial intelligence, neural networks, machine learning, and word embedding.
Introduction
Preliminary Remarks
The global aim of this series of studies was to investigate the speech and natural language processing (SNLP), research area through the related scientific publications, using a set of NLP tools, in harmony with the growing interest for scientometrics in SNLP [refer to Banchs, 2012; Jurafsky, 2016; Atanassova et al., 2019; Goh and Lepage, 2019; Mohammad, 2020a,b,c; Wang et al., 2020; Sharma et al., 2021 and many more] or in various domains such as economics (Muñoz-Céspedes et al., 2021), finance (Daudert and Ahmadi, 2019), or disinformation (Monogarova et al., 2021).
The first results of these studies were presented in two companion papers, published in the first special issue “Mining Scientific Papers Volume I: NLP-enhanced Bibliometrics” of the Frontiers in Research Metrics and Analytics journal; one on production, collaboration, and citation: “The NLP4NLP Corpus (I): 50 Years of Publication, Collaboration and Citation in Speech and Language Processing” (Mariani et al., 2019a) and a second one on the evolution of research topics over time, innovation, use of language resources and reuse of papers and plagiarism within and across publications: “The NLP4NLP Corpus (II): 50 Years of Research in Speech and Language Processing” (Mariani et al., 2019b).
We now extend this corpus by considering the articles published in the same 34 sources over the past 5 years (2016–2020). We watched during this period an increasing interest for machine-learning approaches for processing speech and natural language, and we wanted to examine how this was reflected in the scientific literature. Here, we therefore analyze these augmented data to identify the changes that happened during this period, both in terms of scientific topics and in terms of research community, reporting the results of this new study in a single article covering papers and authors' production and citation within these sources, which is submitted to the second special issue “Mining Scientific Papers Volume II: Knowledge Discovery and Data Exploitation” of the Frontiers in Research Metrics and Analytics journal. We invite the reader to refer to the previous extensive articles to get more insights on the used data and developed methods. In addition, we conducted here the study of the more than 1 million total number of references, to measure the possible influence of neighboring disciplines outside the NLP4NLP sources.
The NLP4NLP Speech and Natural Language Processing Corpus
The NLP4NLP corpus1 (Mariani et al., 2019a) contained papers from 34 conferences and journals on natural language processing (NLP) and spoken language processing (SLP) (Table 1) published over 50 years (1965–2015), gathering about 68,000 articles and 270MWords from about 50,000 different authors, and about 325,000 references. Although it represents a good picture of the international research investigations of the SNLP community, many papers, including important seminal papers, related to this field, may have been published in other publications than these. Given the uncertainty of the existence of a proper review process, we did not include the content neither of workshops nor of publications such as arXiv2, a popular non-peer-reviewed, free distribution service and open-access archive created in 1991 and now maintained at Cornell University. It should be noticed that conferences may be held annually, may appear every 2 years (on even or odd years), and may also be organized jointly on the same year.
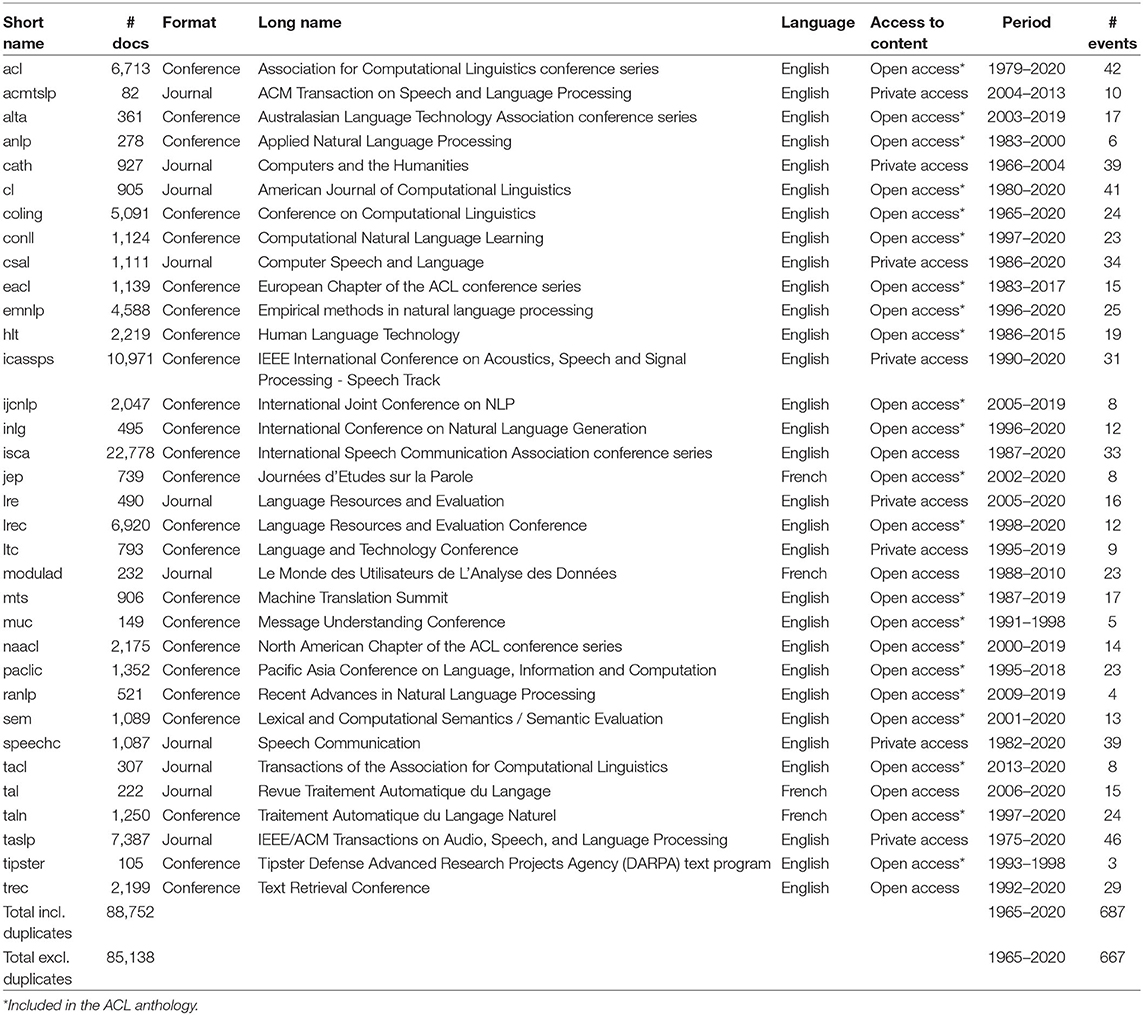
Table 1. The NLP4NLP+5 corpus of conferences (24) and journals (10).
The NLP4NLP+5 Speech and Natural Language Processing Corpus
The NLP4NLP+5 corpus covers the same 34 publications up to 2020, hence 5 more years (2016–2020), which represents an addition in time of 10%. We preferred not to add new sources to facilitate the comparison between the situations in 2015 and 2020. However, we added in the present paper a Section Analysis of the Citation in NLP4NLP Papers of Sources From the Scientific Literature Outside NLP4NLP on the study of references to papers published in other sources than those of NLP4NLP. This new corpus also includes some articles published in 2015, which were not yet available at the time we produced the first NLP4NLP corpus. Some publications may no longer exist in this extended period (Table 1).
The extended NLP4NLP+5 new corpus contains 88,752 papers [+20,815 papers (+30%) compared with NLP4NLP], 85,138 papers if we exclude duplicates (such as papers published at joint conferences) and 84,006 papers after content checking (+20,649 papers), 587,000 references [+262,578 references (+80%)], 381 MWords [+111 MWords (+40%)], and 66,995 authors [+18,101 authors (+40%)]. The large increase in these numbers illustrates the dynamics of this research field.
To study the possible differences across different communities, we considered two different research areas, speech processing and natural language processing, and we attached the sources to each of those areas (Table 2), given that some sources (e.g., LREC, LRE, L&TC, MTS) may be attached to both research domains. We see that the number of documents related to speech is larger than the one related to NLP. We only considered the papers related to speech processing (named ICASSPS) in the IEEE ICASSP conference, which also includes a large number of papers on acoustics and signal processing in general.
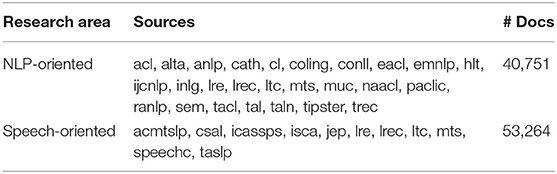
Table 2. Sources attached to each of the two research areas.
The number of conference or journal events3 may largely vary, from 3 for Tipster to 46 for the Institute of Electrical and Electronics Engineers (IEEE)/Association for Computing Machiner (ACM) TASLP and the time span is also different, from 5 years for Tipster to 55 years for COLING. The number of papers in each source largely varies, from 82 papers for the ACM TSLP to 22,778 papers for the ISCA conference series.
Global Analysis Of The Conferences And Journals
Production of Papers Over the Years
A total number of 88,752 documents have been published in the 34 sources over the years. If we do not separate the papers that were published at joint conferences, it reduces to 85,138 papers (Table 1), with a steady increase over time from 24 papers in 1965 to 5,430 in 2020 (Figure 1). This number fluctuates over the years, mainly due to the biennial frequency of some important conferences (especially LREC and COLING on even-numbered years). The largest number of papers ever has been published in 2020 (5,430 papers), comparable in a single year to the total number of papers (5,725 papers) published over the 25 initial years (1965–1989)!
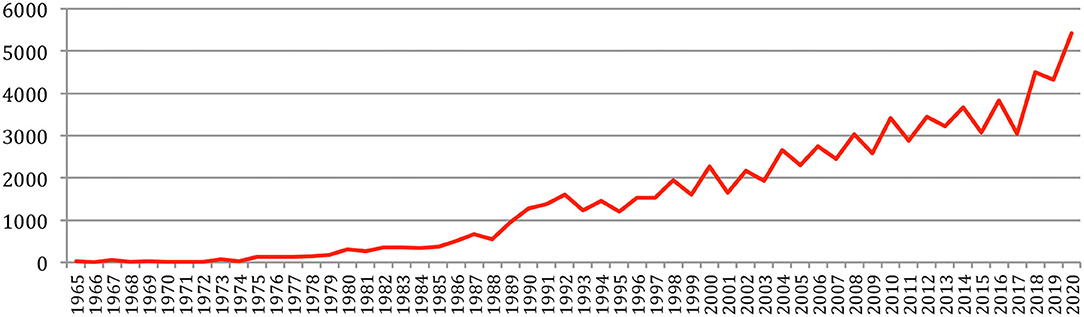
Figure 1. Number of papers each year.
The total number of papers itself still increases steadily at a rate which now stabilizes at about 6% per year (Figure 2), reaching 85,138 different documents as of 2020 (Figure 3).
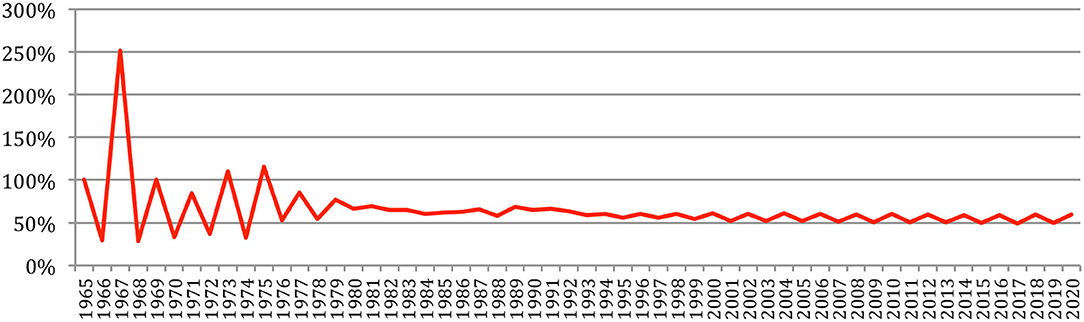
Figure 2. Increase in the number of papers over the years.

Figure 3. Cumulated number of papers over the years.
Data and Tools
Most of the data are freely available online on the Association for Computational Linguistics (ACL) anthology website, and others are freely available in the International Speech Communication Association (ISCA) and Text Retrieval Conference (TREC) archives. IEEE International Conference on Acoustics, Speech and Signal Processing - Speech Track (ICASSP) and Transactions on Audio, Speech, and Language Processing (TASLP) articles have been obtained through the IEEE, and Language Resources and Evaluation (LRE) articles through Springer. For this study, we only considered the papers written in English and French. Most of the documents were available as textual data in PDF, whereas the eldest ones were only available as scanned images and had to be OCRized, which resulted in a lower quality. The study of the authors, of the papers as well as of the papers cited in the references, is problematic due to variations in the same name (family name and given name, initials, middle initials, ordering, married name, etc.) and required a very tedious semi-automatic cleaning process (Mariani et al., 2014), and the same for the sources cited in the references. After a preprocessing phase, the metadata and contents are processed by higher level NLP tools, including a series of Java programs that we developed (Francopoulo et al., 2015a,b, 2016a).
Overall Analysis
Authors' Renewal and Redundancy
We studied the authors' renewal. Figure 4 clearly shows that the number of different authors increased a lot over the years, and especially in the recent years, in a similar way than the number of papers, to reach 66,995 authors in 2020.

Figure 4. Number of different authors over the years.
The number of different authors on a year also globally increased over time (Figure 5), with an exceptional increase in the past 5 years (from 6,562 in 2015 to 13,299 in 2020). The number of new authors from one conference to the next similarly increased over time, as well as the number of completely new authors, who had never published at any previous conference or journal issue. The largest number of completely new authors was in 2020 (5,778 authors), comparable in a single year to the total number of different authors (5,688) who published over the 25 initial years (1965–1989)!

Figure 5. Number of different authors, new authors, and completely new authors over time.
The percentage of new authors (Figure 6), which decreased from 100% in 1966 to 55% in 2011, increased since then to reach 65% in 2020, while the percentage of completely new authors, which decreased from 100% in 1966 to about 32% in 2011, now increased since then to reach 43% in 2020. This may reflect the arrival of “new blood” in the field, as it will be reflected in the next sections related to the analysis of authors' production, collaboration and citation, and the fact that researchers who started their careers in their 20s in 1965, which corresponds to the first year considered in our study, are now gradually retiring in their 70s.
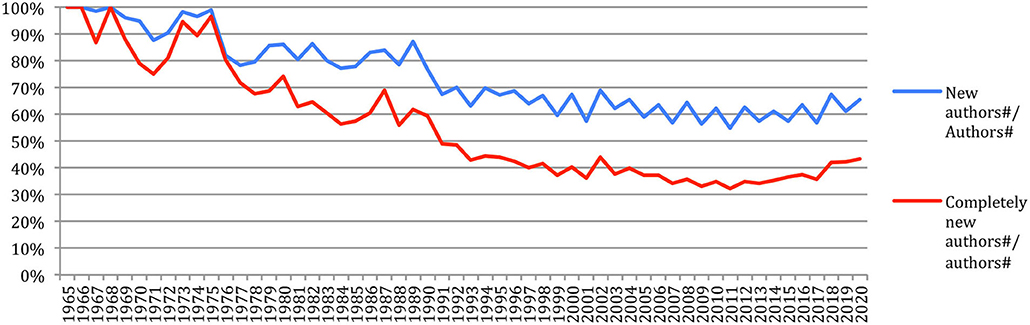
Figure 6. Percentage of new authors and completely new authors over time.
If we compare sources, the percentage of completely new authors at the most recent event of conferences or journals within the past 5 years (Figure 7) ranges from 39% for TALN or 43% for the JEP to 87% for RANLP or 81% for EACL, while the largest conferences show relatively low percentages (48% for ISCA, 51% for IEEE ICASSPS, 55% for ACL, and 56% for EMNLP). Compared with 2015, we notice a global increase in the percentage of completely new authors, especially in conferences and journals related to NLP.
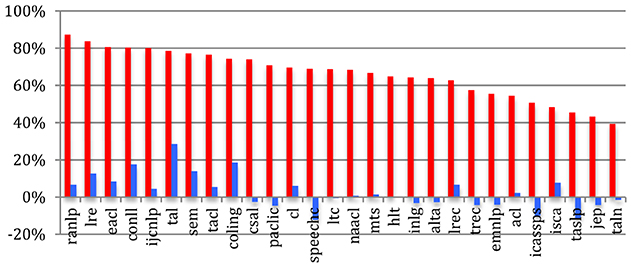
Figure 7. Percentage of completely new authors in the most recent event across the sources in 2020 (red) and difference with 2015 (blue).
We defined the author variety as the ratio of the number of different authors to the number of authorships4 at each conference. This ratio would be 100% if each author's name appears in only one paper. Author redundancy corresponds to 100% author variety. Author redundancy increased over time and has now stabilized at about 40% since 2008 (Figure 8).
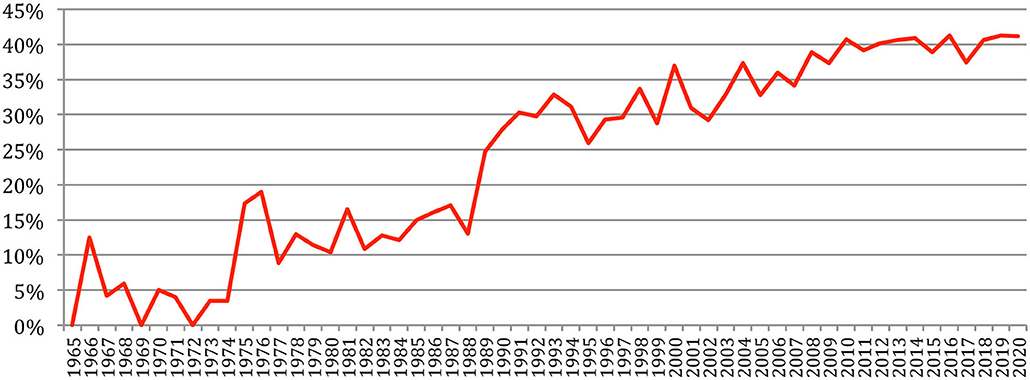
Figure 8. Author redundancy over time.
Author redundancy is large in conferences such as ISCA or ICASSP, whereas it is lower in journals and slightly increased globally since 2015 (Figure 9).
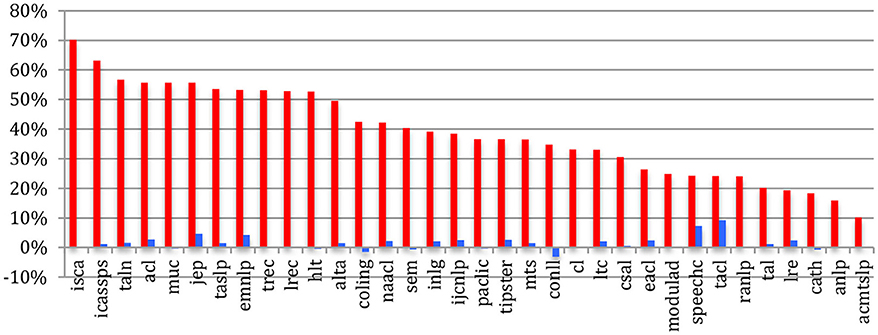
Figure 9. Author redundancy across the sources in 2020 (red) and difference with 2015 (blue).
Papers and Authorship
The number of authorships increases from 32 in 1965 to 22,610 in 2020 at even a higher pace than the number of papers (Figure 10).
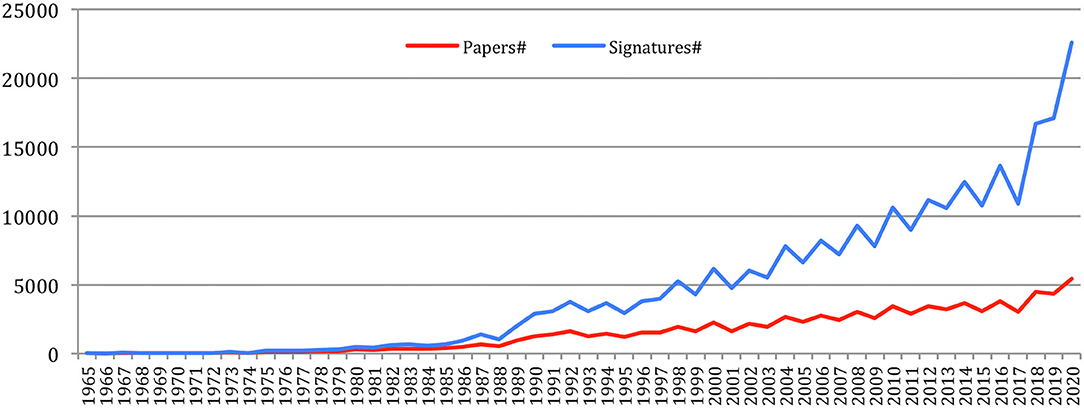
Figure 10. Number of papers and authorships over time.
Authors' Gender
The author gender study is performed with the help of a lexicon of given names with gender information (male, female, epicene5). As already noted, variations due to different cultural habits for naming people (single vs. multiple given names, family vs. clan names, inclusion of honorific particles, ordering of the components, etc.) (Fu et al., 2010), changes in editorial practices, and sharing of the same name by large groups of individuals contribute to make identification by name a real issue (Vogel and Jurafsky, 2012). In some cases, we only have an initial for the first name, which made gender guessing impossible unless the same person appears with his/her first name in full in another publication. Although the result of the automatic processing was hand-checked by an expert of the domain for the most frequent names, the results presented here should therefore be considered with caution, allowing for an error margin.
A total of 46% of the authors are male, whereas 14% are female, 4% are epicene, and 36% are of unknown gender. Considering the paper authorships, which take into account the authors' productivity, and assuming that the authors of unknown gender have the same gender distribution as the ones that are categorized, male authors account in 2020 for 80% (compared to 83% in 2015) and female authors for 20% (compared to 17% in 2015) of the authorships (Figure 11), hence a slight improvement.

Figure 11. Gender of the authors' contributions over time.
IEEE TASLP and ICASSPS have, in 2020 just as in 2015, the most unbalanced situation (respectively, 10 and 13% of female authors), whereas the French conferences (JEP, TALN) and journals (TAL), together with LRE and LREC, have a better balanced one (from 30 to 41% of female authors). The largest increase over the past 5 years (+4%) appears for JEP and TACL (Figure 12).
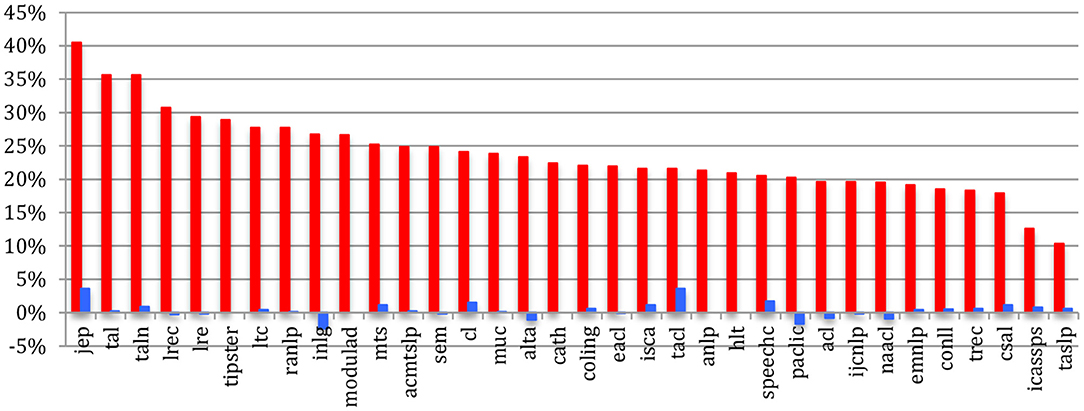
Figure 12. Percentage of female authors across the sources in 2020 (red) and difference with 2015 (blue).
Authors' Production and Co-production
The most productive author published 453 papers, whereas 36,791 authors (55% of the 66,995 authors) published only one paper. Table 3 gives the list of the 12 most productive authors. We see that the eight most productive authors are the same than in 2015, with a slightly different ranking. A total of two newcomers are ranked 9 and 10, specialized in machine learning (ML): James R. Glass (unsupervised ML) and Yang Liu (Federated ML). Some authors (James Glass, Yang Liu, Haizhou Li, Satoshi Nakamura, and Shri Narayanan) increased their number of papers by 30% and more within the past 5 years!
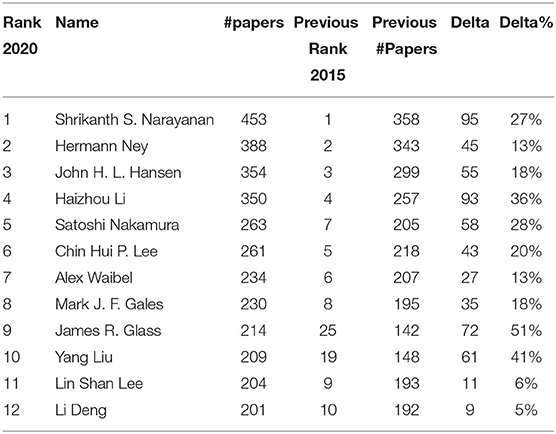
Table 3. 12 most productive authors (up to 2020, in comparison with 2015).
But if we focus on the past 5 years (2016–2020) (Table 4), we notice that only two authors (Shrikanth S. Narayanan and Haizhou Li)6 still appear in that ranking. Others energically contributed to the research effort on speech and language processing with a new angle benefiting from supervised or unsupervised machine-learning approaches, some already active in that field but also many new names, showing the great vitality of a new generation of researchers, who published more than 15 papers per year in this recent 5-year period.
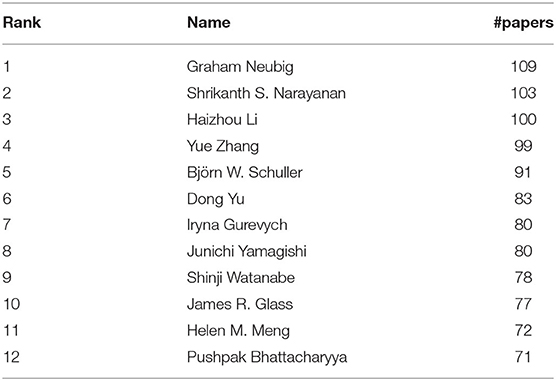
Table 4. 12 most productive authors in the past 5 years (2016 to 2020).
Collaborations
Authors' Collaborations
The number of authors per paper still increases, with more than 4 authors per paper on average, compared with 3.5 in 2015 (Figure 13).
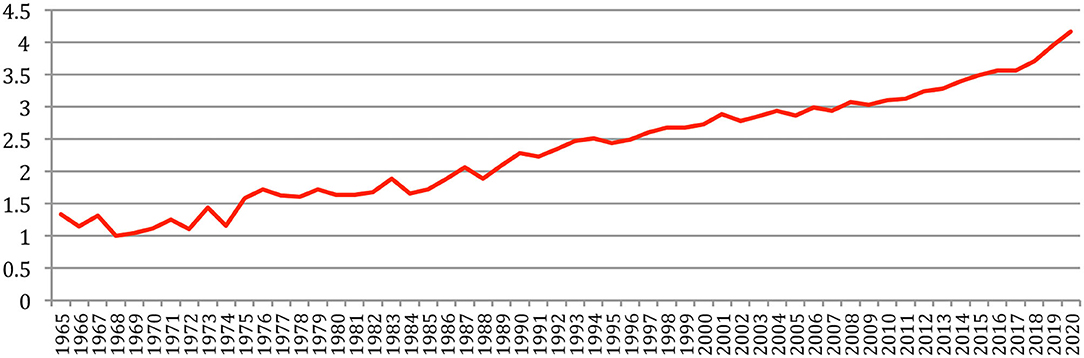
Figure 13. Average number of authors per paper.
Table 5 gives the number of authors who published papers as single authors, and the names of the ones who published 10 papers or more. A total of 60,193 authors (90% of the authors) never published a paper as single author7. The ranking is very similar to 2015, including six newcomers (Mark Huckvale, Mark Jan Nederhof, Hagai Aronowitz, Philip Rose, Shunichi Ishihara, and Oi Yee Kwong).
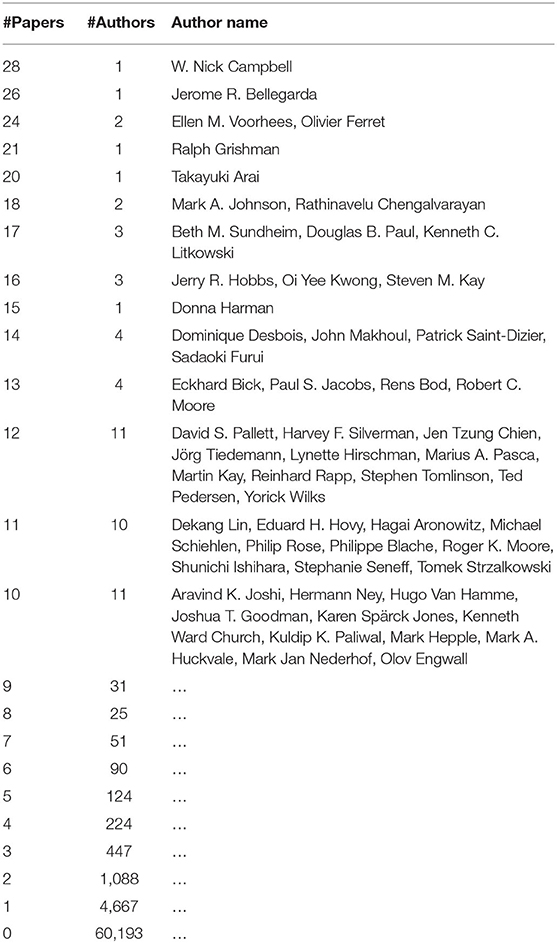
Table 5. Number and names of authors of single author papers.
The number of papers with a single author decreased from 75% in 1965 to 3% in 2020, illustrating the changes in the way research that is being conducted.
Up to 2015, the paper with the largest number of co-authors was a META-Net paper published at LREC 2014 (44 co-authors). It is now surpassed by three other papers:
• A paper with 45 co-authors from Microsoft published in TACL 2020
• A paper with 47 co-authors on the European Language Technology landscape published at LREC 2020
• A paper with 58 co-authors on the I4U Speaker Recognition NIST evaluation 2016 published at Interspeech 2017.
The most collaborating author collaborated with 403 different co-authors, whereas 2,430 authors only published alone. An author collaborates on average with 7.9 other authors (compared to 6.6 in 2015), whereas 157 authors published with 100 or more different co-authors. Table 6 provides the list of the 12 authors with the highest number of co-authors.
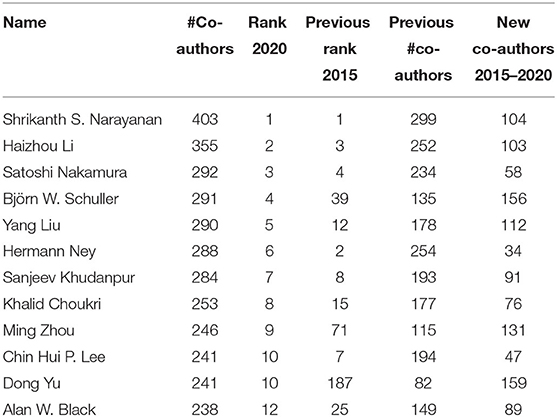
Table 6. The 12 authors with the largest number of co-authors (up to 2020, in comparison with 2015).
Table 7 provides the list of the 12 authors who had the largest number of collaborations, possibly with the same co-authors.
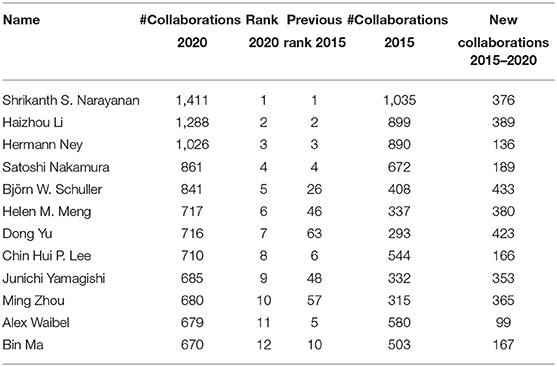
Table 7. The 12 authors with the largest number of collaborations (up to 2020, in comparison with 2015).
As we can see, some authors increased a lot, and even doubled, the number of co-authors and of collaborations in the recent years, whereas there are seven newcomers in the ranking (Björn Schüller, Khalid Choukri, Dong Yu, Alan Black, Helen Meng, Junichi Yamagishi, and Ming Zhou).
If we focus on the past 5 years (2016–2020), we see that only three authors (Haizhou Li, Shri Narayanan, and Yang Liu) are still among the 12 authors with the largest number of co-authors (Table 8), whereas we notice many new names, often of Asian origin (Yue Zhang, Dong Yu, Yu Zhang, Kongaik Lee, Ming Zhou, and Shinji Watanabe) who constitute a new community around the use of supervised or unsupervised machine-learning approaches.

Table 8. The 12 authors with the largest number of co-authors in the past 5 years (2016–2020).
Collaboration Graph
The NLP4NLP+5 collaboration graph (refer to Appendix 4) contains 66,995 nodes corresponding to the 66,995 different authors (48,894 in 2015) and163,189 edges between these nodes (162,497 in 2015).
When comparing the various sources, we do not notice any meaningful changes between 2015 and 2020 regarding the diameter, density, average clustering coefficient, or connected components that were presented in our previous paper, whereas the mean degree (defined as the average number of co-authors for each author), which illustrates the degree of collaboration within a source, shows a large increase for TACL (4.5–6.9), EMNLP (4.2–5.9), and ACL (4.2–5.6) over this period (Figure 14).
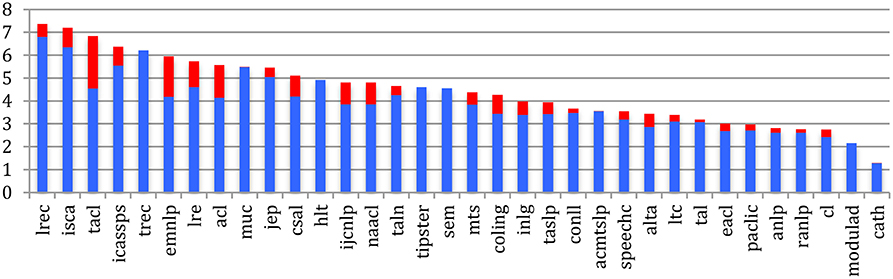
Figure 14. Mean degree of the collaboration graph for the 34 sources in 2015 (blue) and 2020 (red).
Measures of Centrality in the Collaboration Graph
As we see in Table 9, some authors in the top 10 in terms of closeness centrality also appear in the two other types of centralities (degree centrality and betweeness centrality), eventually with a different ranking, whereas others do not. Compared with 2015, we notice “newcomers” among the 10 most “central” authors:
• Yang Liu, Alan Black, Dong Yu (closeness centrality: those who are central in a community)
• Björn Schuller, Yang Liu, Khalid Choukri, Ming Zhou, Dong Yu (degree centrality: those who most collaborate)
• Laurent Besacier, Alan Black, Sanjeev Khudanpur (betweenness centrality: those who make bridges between communities).
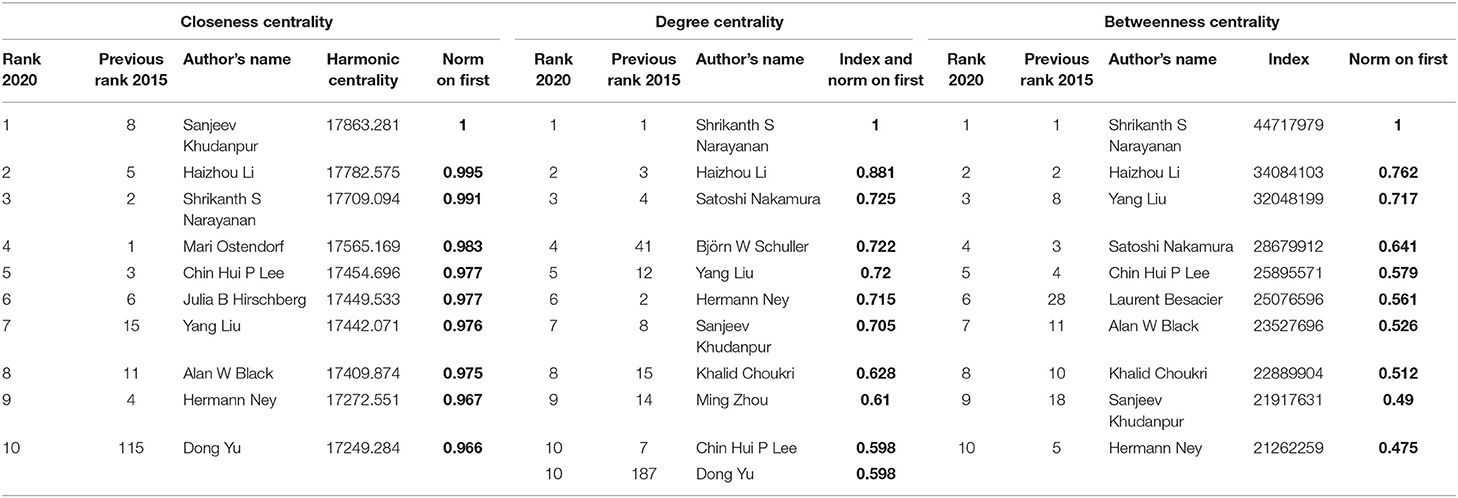
Table 9. Computation and comparison of the closeness centrality, degree centrality, and betweenness centrality for the 10 most central authors (up to 2020, in comparison with 2015).
If we consider the period 2016–2020, we see that only Sanjeev Khudanpur is still among the 10 most central authors, in terms of closeness centrality (Table 10).
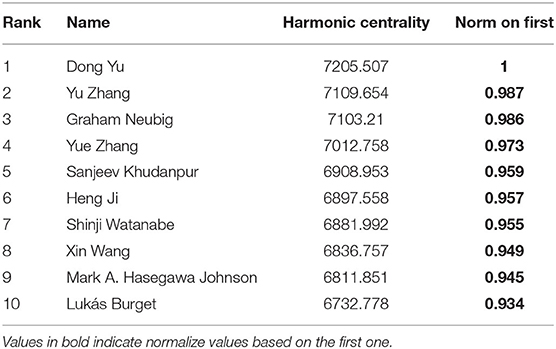
Table 10. Closeness centrality for the 10 most central authors in the past 5 years (2016–2020).
In addition to that, only three authors among the 10 most “Betweenness Central” authors up to 2015 are still in the ranking for the 2016–2020 period (Shri Narayanan, Yang Liu, and Haizhou Li). New authors may bring bridges with new scientific communities. Some authors may be absent from this 2016–2020 ranking, while increasing their global “up to 2020” ranking in this period due to the enlargement of previous communities (Table 11).

Table 11. Betweenness centrality for the 10 most central authors in the past 5 years (2016–2020).
Citations
Global Analysis
We studied citations of NLP4NLP+5 papers in the 78,927 NLP4NLP+5 papers that contain a list of references. If we consider the papers that were published in joint conferences as different papers, the number of references is equal to 585,531. If we consider them as the same paper, the number of references in NLP4NLP+5 papers goes down to 535,989 and is equal to the number of citations of NLP4NLP+5 papers.
The average number of NLP4NLP+5 references in NLP4NLP+5 papers increased over time from close to 0 in 1965 to 12.7 in 2020 (was 9.7 in 2015) (Figure 15), as a result of the citing habits and of the increase in the number of published papers.
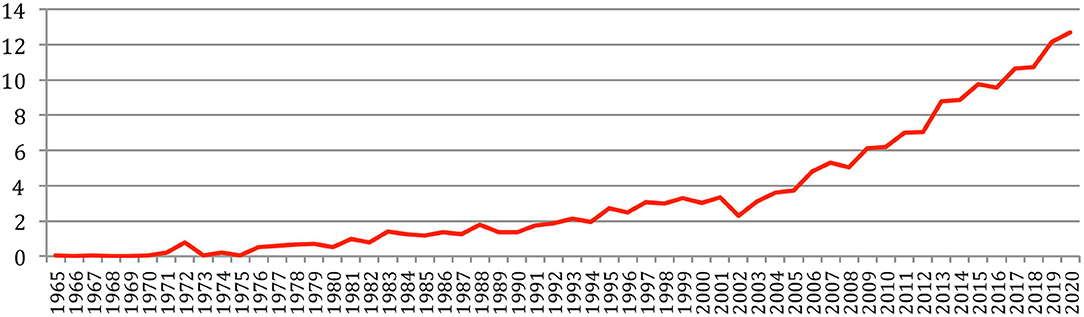
Figure 15. The average number of references per paper over the years.
The trend concerning the average number of citations per paper over the years (Figure 16) is less clear. Obviously, the most recent papers are less cited than the older ones, with a number of more than nine citations on average per paper for the papers of the most cited year (2003) and less than one citation on average for the papers published in 2020, given that they can only be cited by the papers published on the same year. It seems that papers need on average 3 years after publication to be properly cited, and that the average number of citations for a paper is stabilized at about 6–8 citations per paper if we consider the period 1993–2018.
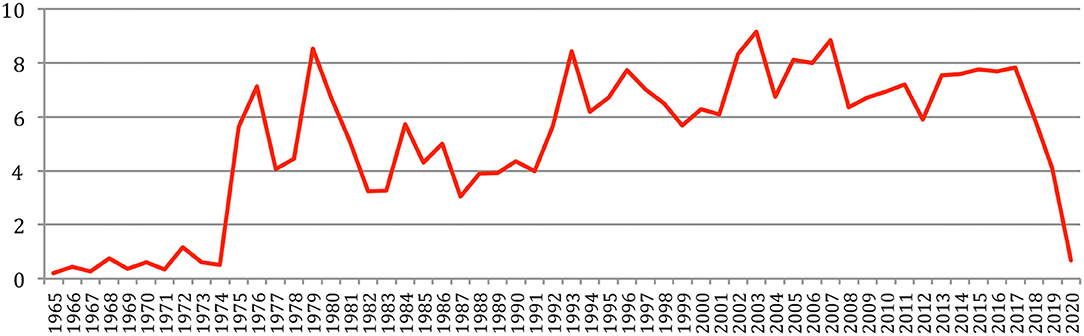
Figure 16. The average number of citations of a paper over the years.
Among the 66,995 authors, 23,850 (36%) are never cited (even 25,281 (38%) if we exclude self-citations). These percentages slightly improved compared with 2015 (respectively, 42 and 44%). However, those never cited authors may come from neighboring research domains (artificial intelligence, machine learning, medical engineering, acoustics, phonetics, general linguistics, etc.), where they may be largely cited. Among the 85,138 papers, 31,603 (37%) are never cited [even 40,111 (47%) if we exclude self-citations by the authors of these papers] also showing a slight improvement compared with 2015 (respectively, 44 and 54%) (Table 12).

Table 12. Absence of citations of authors and papers within NLP4NLP+5.
Analysis of Authors' Citations
Most Cited Authors
Table 13 gives the list of the 20 most cited authors up to 2020, with the number of citations for each author, the number of papers written by the author, and the percentage of self-citation with a comparison to 2015. We may notice that the seven most cited authors up to 2015 are still present in 2020, but that 50% of the authors of 2020 (mostly attached to the machine learning and word embedding research-based communities) are newcomers in this ranking.
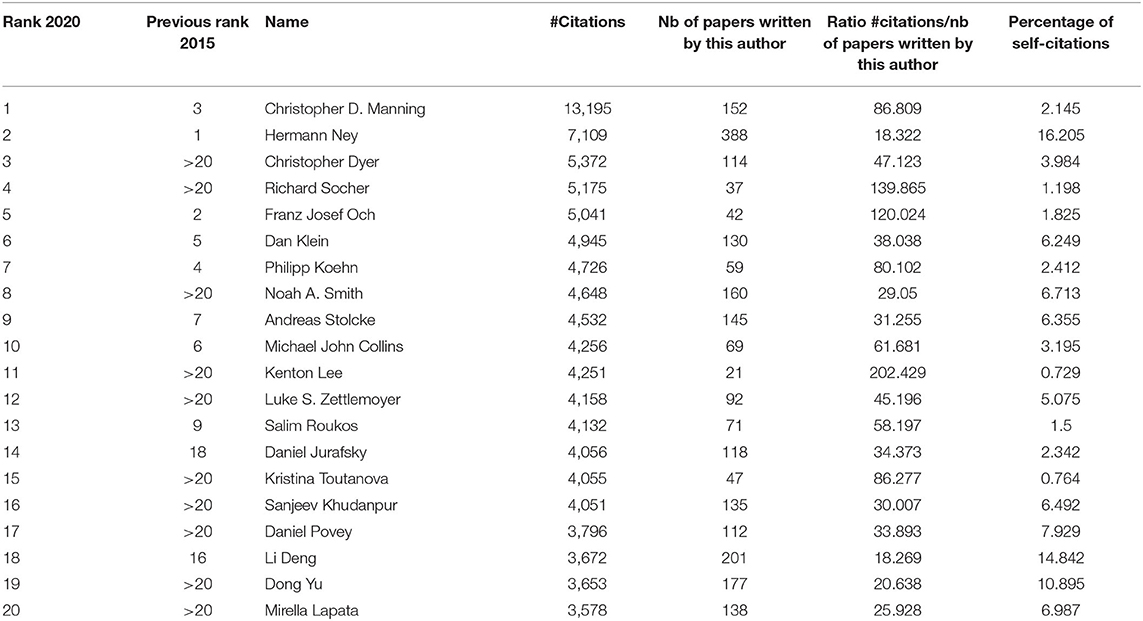
Table 13. A total of 20 most cited authors up to 2020.
Table 14 provides the number of citations, either by themselves (self-citations) or by others (external citations), for the most productive authors that appear in Table 3. We see that only two of the 20 most productive authors (Herman Ney, Li Deng) also appear among the 20 most cited authors.
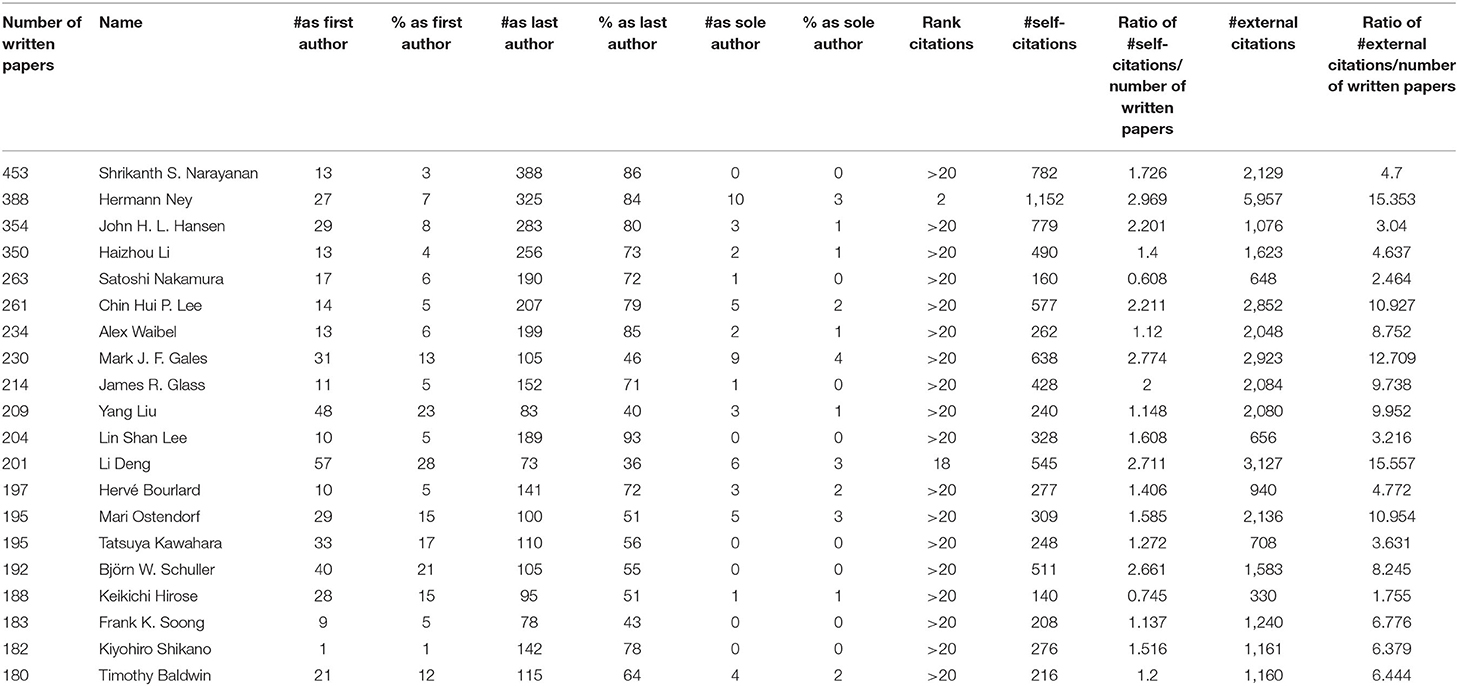
Table 14. The number of citations for the 20 most productive authors (1965–2020).
We may express that the publishing profile is very different among authors. The authors who publish a lot are not necessarily the ones who are the most cited (from 1.75 to 15 citations per paper on average) and the role of authors varies, from the main contributor to team manager, depending on their place in the authorship list and the cultural habits. Some authors are used to cite their own papers, while others are not (from 0.6 to 2.9 citations of their own paper on average).
If we now only consider the 2016–2020 period (papers published over 55 years that are cited in this 5-year period) (Table 15), we see that only one author of the 2015 ranking (Chris Manning) is still among the 20 most cited authors for this period!
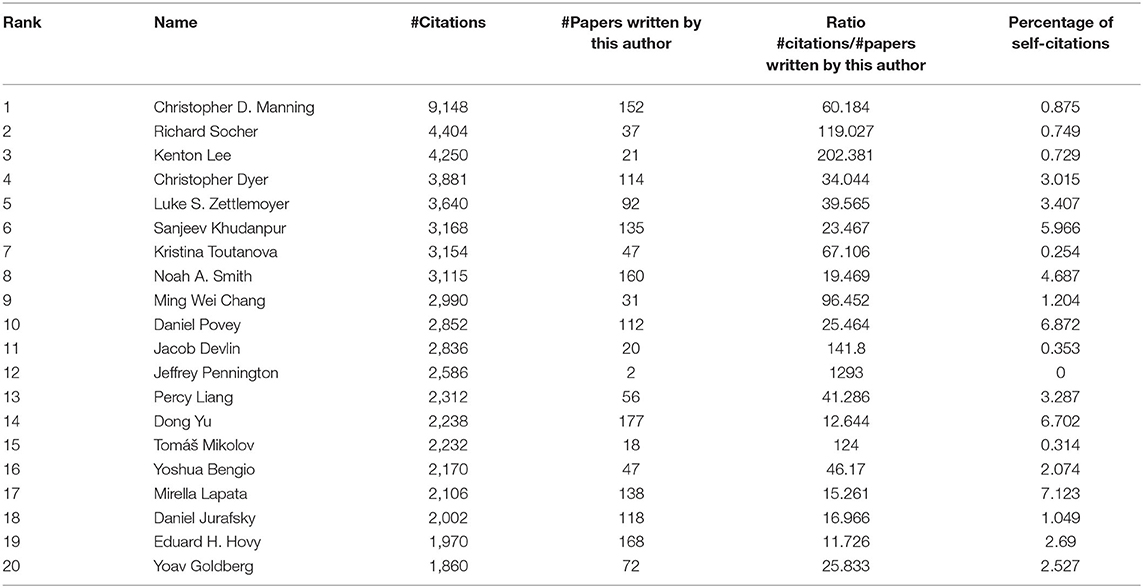
Table 15. A number of 20 most cited authors in the past 5 years (2016–2020).
Some authors who published a small number of seminal papers got a huge number of citations (such as Jeffrey Pennington, for the “Glove paper,” with two papers totaling 2,586 citations, with no self-citation!). However, as it will appear in the next section, getting a high h-index necessitates both publishing a lot and having a lot of citations of these published papers.
Authors' H-Index
Despite the criticisms that are attached to this measure and as it was included in our previous paper, we computed the h-index of the authors based only on the papers published in the NLP4NLP+5 corpus. Table 16 provides the list of the 20 authors with the largest h-index up to 2020, with a comparison to 2015 (based on the papers published and cited in the respective 55- and 50-year time periods). We see that Christopher Manning has still the largest h-index: he published 49 papers, which were cited at least 49 times. About 55% of the authors with highest h-index up to 2015 are still in the top 20 authors with highest h-index up to 2020, while 45% are newcomers (also mostly coming from the machine learning and word embedding research-based communities).

Table 16. List of the 20 authors with the largest h-index up to 2020 in comparison with 2015.
If we consider the h-index in the past 5 years (based on the papers published on 55 years and cited in the 2016–2020 period) (Table 17), we see that only five authors (Chris Manning, Noah Smith, Dan Klein, Daniel Jurafsky, and Mirella Lapata) with highest h-index up to 2015 are still in the top 20 authors with highest h-index for the 2016–2020 period!
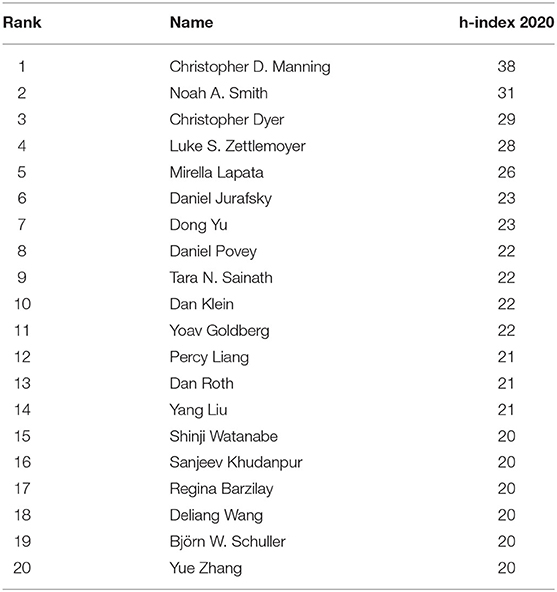
Table 17. List of the 20 authors with the largest h-index for the past 5 years (2016–2020).
Analysis of Papers' Citations
Most Cited Papers
Table 18 provides the list of the 20 most cited papers up to 2020 and a comparison with 2015. A number of 11 (55%) of the 20 most cited papers up to 2015 are still among the 20 most cited papers up to 2020, whereas it includes five newcomers and four papers published in or after 2015, with a special emphasis on word embedding and deep learning (Glove and BERT). The most cited paper up to 2015 is still the most cited up to 2020 (BLEU MT evaluation measure). The most cited papers are still mostly those related to language data (Penn Treebank, Wordnet, and Europarl), evaluation metrics (BLEU), language processing tools (Glove, BERT, Moses, SRILM), or methodology surveys (word representations, statistical alignment, statistical and neuronal machine translation). The largest number of highly cited papers comes from the ACL conference (4), NAACL (3), the Computational Linguistics journal (3), and the IEEE TASLP (3), whereas four papers now come from the EMNLP conference, which was previously absent from this ranking.

Table 18. The number of 20 most cited papers up to 2020.
While if we only consider the 20 most cited papers in the period of 2016–2020 (papers published over 55 years that are cited in this 5-year period) (Table 19), 75% of those papers were not in the 2015 ranking!
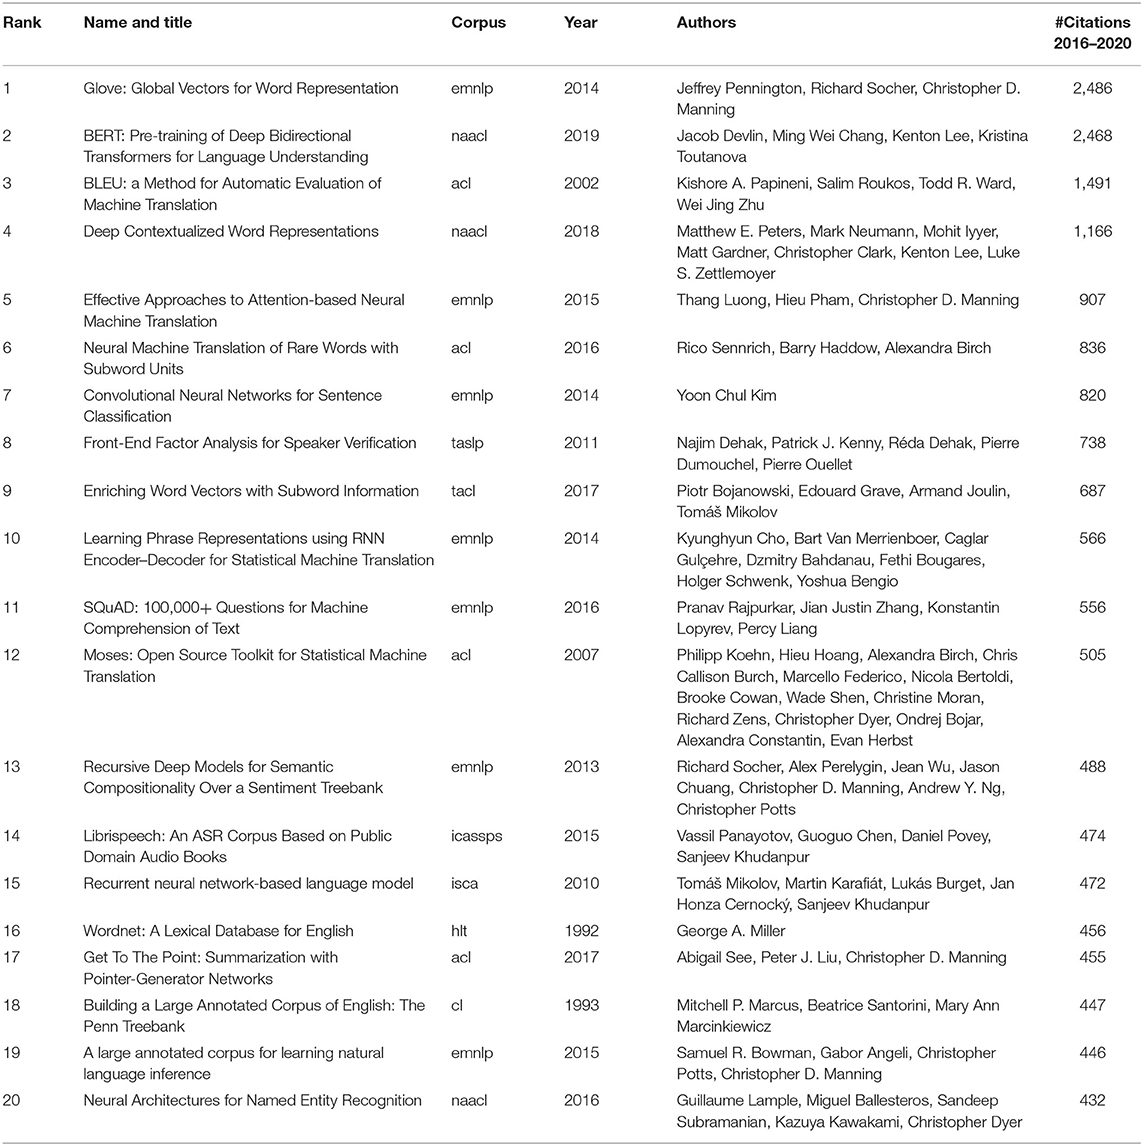
Table 19. The number of 20 most cited papers for the past 5 years (2016–2020).
Analysis of Citations Among NLP4NLP Sources
Comparison of NLP vs. Speech Processing Sources
When comparing the number of articles being cited in NLP vs. speech-oriented publications (Figure 17), we see that this number is increasing much more importantly in the NLP ones since 2001, providing that 2020 cannot be considered due to the previously expressed reason.

Figure 17. Number of NLP (blue) vs. Speech (red) articles being cited over time.
This is also reflected in the ratio of NLP vs. speech articles' citations (Figure 18), given that we only had NLP sources until 1975. We then had a ratio of about 60% of NLP papers being cited from 1975 to 1989, then a balanced ratio until 2001, and since then an increasing percentage of NLP papers which attained 75% in 2019.

Figure 18. Percentage of NLP (blue) vs. Speech (red) articles being cited over time.
Comparison of Citations for Six Major Conferences and Journals
The comparative study of the number of cumulative citations of previously published papers in six important conferences (ACL, COLING, EMNLP, ICASSPS, ISCA, and LREC) shows (Figure 19) that the number of ISCA papers being cited grows at a high rate over time, in agreement with the ISCA Board policy which decided in 2005 to enlarge the number of pages from 6 to 7, providing that the allowed extra page should only consist of references. The same appears more recently for ACL. ICASSPS comes in the third position, whereas EMNLP recently showed an important increase. We then find a group of two with COLING and LREC.
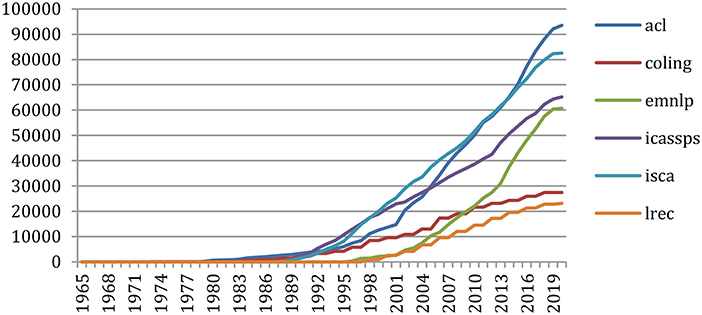
Figure 19. Number of references to papers of 6 major conferences over the years.
Doing the same on six major journals (Computational Linguistics, Computer Speech and Language, Language Resources and Evaluation, Speech Communication, IEEE Transactions on Audio, Speech, and Language Processing, and Transactions of the ACL) shows (Figure 20) the importance of the reference to the IEEE Transactions, followed by Computational Linguistics. The Transactions of the ACL recently made a large increase.
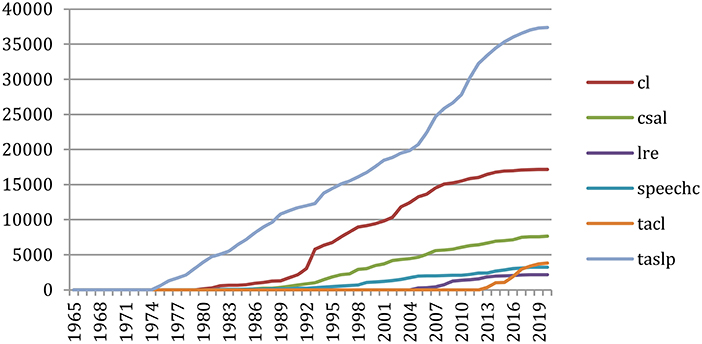
Figure 20. Number of references to papers of 6 major journals over the years.
Citation Graph
We considered (refer to Appendix 4) the 85,138 papers and the 66,995 authors in NLP4NLP+5 in the citation graph, which includes 587,000 references. When comparing the sources, it should be remembered that the time periods are different, as well as the frequency and number of events for conferences or journals.
Authors' Citation Graph. When comparing the various sources, there are also no meaningful changes between 2015 and 2020 regarding the diameter, density, average clustering coefficient, and connected components of the Internal Authors Citations and Ingoing Global Authors Citations that were presented in our previous paper.
The mean degree of the Outgoing Global Authors Citations graph of the citing authors (i.e., average number of authors being cited by each author), measuring the average number of authors citations within a source, shows a large increase for most sources (Figure 21), following the general trend (refer to Figure 15), especially recently in the NLP sources (TACL, EMNLP, ACL, CL, NAACL, IJCNLP, and CONLL) with more than 40 authors being cited by each author on average.
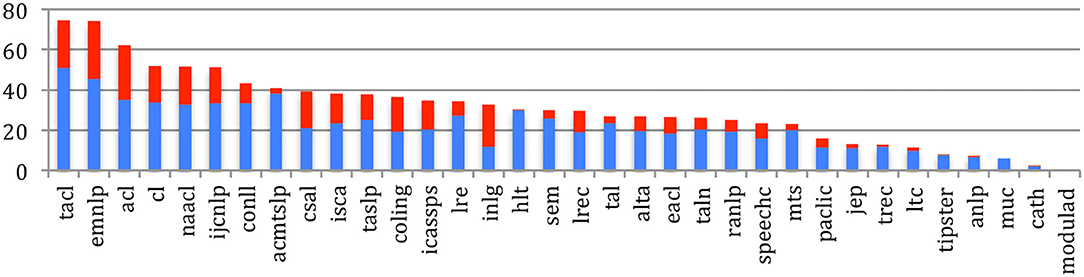
Figure 21. Mean Degree of authors citing authors in general for the 34 sources in 2015 (blue) and 2020 (red).
The mean degree of the Ingoing Global Authors Citations graph of the authors being cited in each of the 34 sources (Figure 22) shows that authors who publish in Computational Linguistics are still the most cited, but are now closely followed by authors in TACL, with a tremendous increase, then ACL, NACL, HLT, and EMNLP, with more than 60 citations of each author on average.
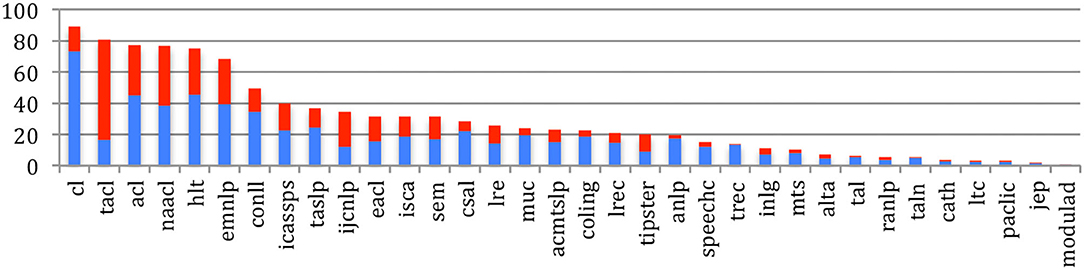
Figure 22. Mean Degree of authors being cited for the 34 sources in 2015 (blue) and 2020 (red).
Papers' Citation Graph. There are no meaningful changes between 2015 and 2020 regarding the diameter, density, average clustering coefficient, and connected components of the Internal Papers Citations and Ingoing Global Papers Citations, when comparing the various sources.
The mean degree of the Outgoing Global Papers Citations graph of the citing papers (i.e., average number of references in each paper), measuring the average number of papers citations within a source, shows an increase for most sources (Figure 23), following the general trend (refer to Figure 15), especially the NLP sources (TACL, CL, EMNLP, ACL, NAACL, IJCNLP, CONLL, CSAL, and LRE) with more than 10 references in each paper on average.
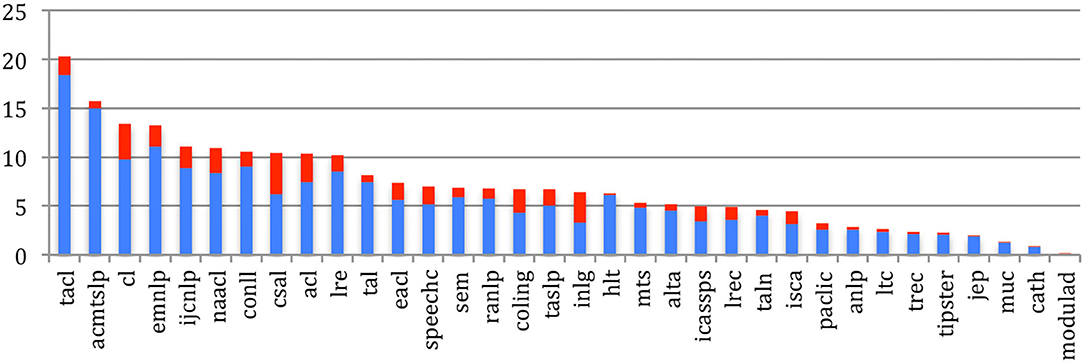
Figure 23. Mean Degree of papers citing papers in general for the 34 sources in 2015 (blue) and 2020 (red).
Figure 24 provides the average number of papers being cited from each of the 34 sources. Papers published in Computational Linguistics are still the most cited (more than 25 times on average), but are now more closely followed by various NLP sources (TACL (with a tremendous increase), NAACL, HLT, ACL, EMNLP, and CONLL), with more than 10 citations of each paper on average.
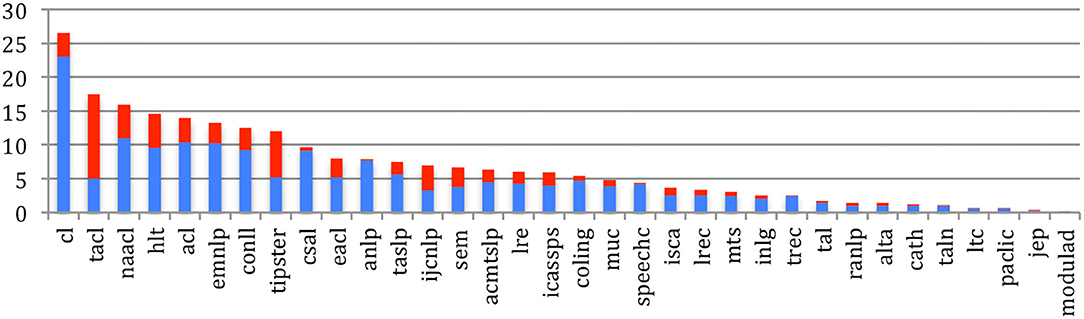
Figure 24. Mean Degree of papers being cited for the 34 sources in 2015 (blue) and 2020 (red).
Sources' H-Index
Figure 25 provides the internal h-index (NLP4NLP papers being cited by papers of any NLP4NLP source) for the 34 sources. The largest h-index is obtained by ACL, where 109 papers are cited 109 times or more in the NLP4NLP+5 papers, followed by EMNLP, which increased considerably its h-index over the past 5 years from 55 in 2015 to 90 in 2020, TASLP (84), ICASSPS (77), and ISCA Interspeech (76).
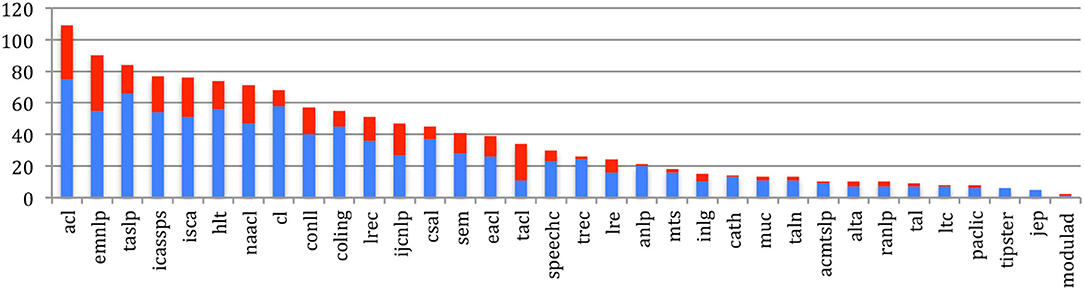
Figure 25. Internal h-index of the 34 sources in 2015 (blue) and 2020 (red).
Analysis of the Citation in NLP4NLP Papers of Sources From the Scientific Literature Outside NLP4NLP
Extraction of References
In the internal NLP4NLP citation analysis, references were extracted through a highly reliable checking of titles, as we possess the knowledge of the NLP4NLP paper titles. We cannot use the same approach if we want to explore the citation of articles that were published in other sources than the NLP4NLP ones, as we do not have a list of the titles of all those articles. We therefore used a different strategy based on the use of the ParsCit software (Councill et al., 2008) to identify the sources within the reference sections of articles for a limited set of NLP4NLP articles. This new process is resulted in a list of raw variants of source naming, which necessitated a manual cleaning, as it contained a lot of noise, followed by normalization and categorization in four categories (Conferences, Workshops, Journals, and Books).
All the cleaned variants for a given source are kept, for instance, a short name compared to an extended name. We then implemented an algorithm to detect the source names within the reference sections for all NLP4NLP papers. The detection is technically conducted by means of an intermediate computation of a robust key made of uppercase letters and normalization of separators, as the aim is to compare names on the ground of significant characters and to ignore noise and unsignificant details. We then use these data to compare the citations in NLP4NLP articles of the articles published within and outside NLP4NLP sources8.
Global Analysis
Starting from 32,918 entries, we conducted the manual cleaning and categorization process which resulted in 13,017 different variants of the sources, and, after normalization, in the identification of 3,311 different sources outside the 34 NLP4NLP ones, corresponding to conferences (1,304), workshops (669), journals (1,109), and books (229).
Figure 26 provides the evolution of the total number of references, which attains 121,619 references in 2020 for a cumulated total of 1,038,468 references over the years, and of NLP4NLP references, which attains 72,289 in 2020 for a cumulated total of 654,340 references (63% of the total number of references) with this new calculation based on source detection. These numbers clearly illustrate the representativity of the 34 NLP4NLP sources totaling close to 20,000 references on average per source, compared with about 110 references on average per source for the 3,311 non-NLP4NLP sources.
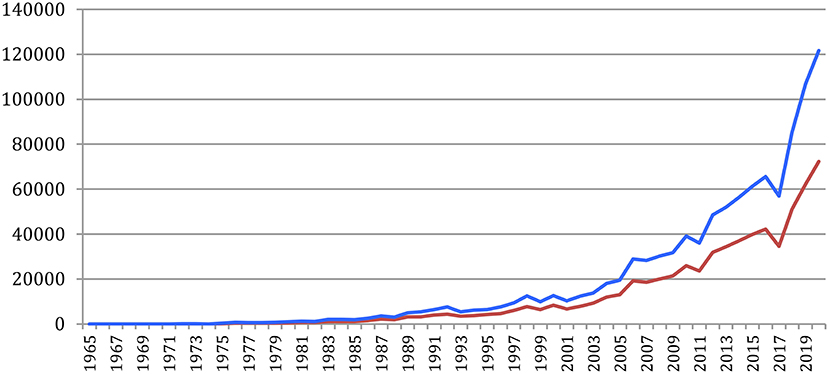
Figure 26. Total number of references (blue) and of NLP4NLP references (red) in NLP4NLP papers yearly.
Figure 27 provides the percentage of NLP4NLP papers in the references. After a hectic period both due to the small quantity and low quality of data, mostly OCRized, until 1976, the ratio of NLP4NLP references stabilized at about 60% until 1994. It then rose up to 67% in 2009 and slowly decreased since then to attain 60% in 2020 with the appearance of new publications.

Figure 27. Percentage of NLP4NLP papers in the references.
Figure 28 provides the average number of references per paper globally and specifically to NLP4NLP papers. We see that this number increases similarly to attain an average of 25 references per paper, as a result of the citing habits, the increase of the number of publications and of published papers in the literature and the generalization of electronic publishing, as already expressed in section Global Analysis (Figure 15), where only NLP4NLP papers were considered based on title identification.
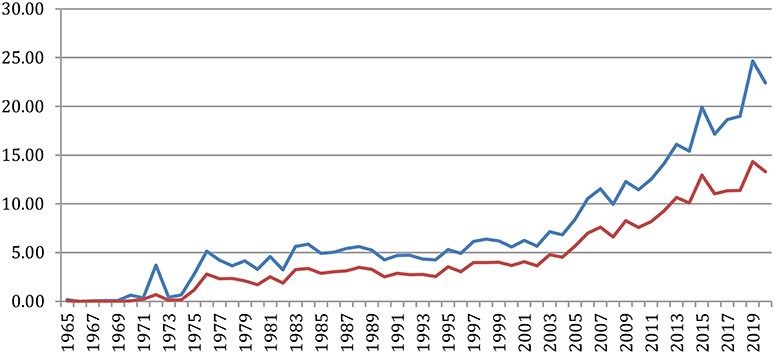
Figure 28. Average number of references per paper globally (blue) or only to NLP4NLP papers (red).
Specific Analysis of Non-NLP4NLP Sources
Some new sources attract many papers, which resulted in many citations, showing a drastic change in the publications habits. Figure 29 provides the number of references in NLP4NLP+5 papers to arXiv preprints, with a huge increase in the recent years (from two references in 2010 to 498 in 2015 and 12,751 in 2020).

Figure 29. Number of references to arXiv preprints.
Also, the number of references related to the publications in artificial intelligence, neural networks, and machine learning, such as the conference on Artificial Intelligence of the Association for the Advancement of Artificial Intelligence (aaai), the International Joint Conference on Artificial Intelligence (ijcai), the International Conference on Machine Learning (icml), the International Conference on Learning Representations (iclr), the Neural Information Processing Systems conference (NeurIPS, formerly nips), or the Machine Learning and Machine Learning Research Journals, greatly increased in the recent years (Figure 30).
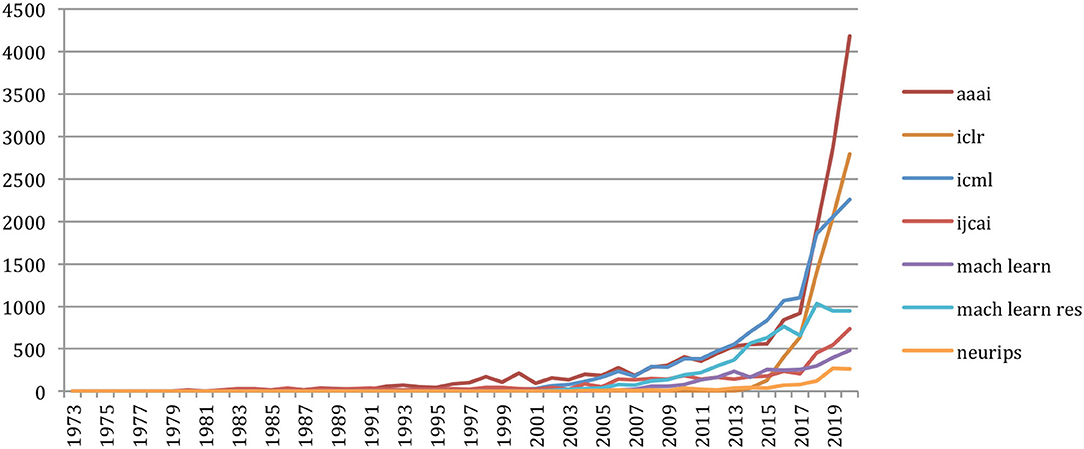
Figure 30. Number of references related to AI, neural networks, and machine-learning sources external to NLP4NLP.
Google Scholar H-5 Index
As of July 2021, Google Scholar (Table 20) places as we do ACL first in the ranking of the “Computational Linguistics” conferences and journals category9 with an h5-index of 157 and an h5-median of 275 within the past 5 years, followed by EMNLP (132), NAACL (105), COLING (64), TACL (59), ELRA LREC (52), SEMEVAL (52), EACL (52), WMT (47), CONLL (43), CSL (34), SIGDIAL (34), Computational Linguistics (30), and IJCNLP (30). In the “Signal Processing” category10, Google Scholar places IEEE ICASSP (96) first, then ISCA Interspeech (89), IEEE TASLP (60), LREC (53), CSL (34), SIGDIAL (34), and Speech Communication (28). This ranking covers the past 5 years and therefore reflects the recent trends compared with our own results, which concern a smaller number of sources but a longer time period.
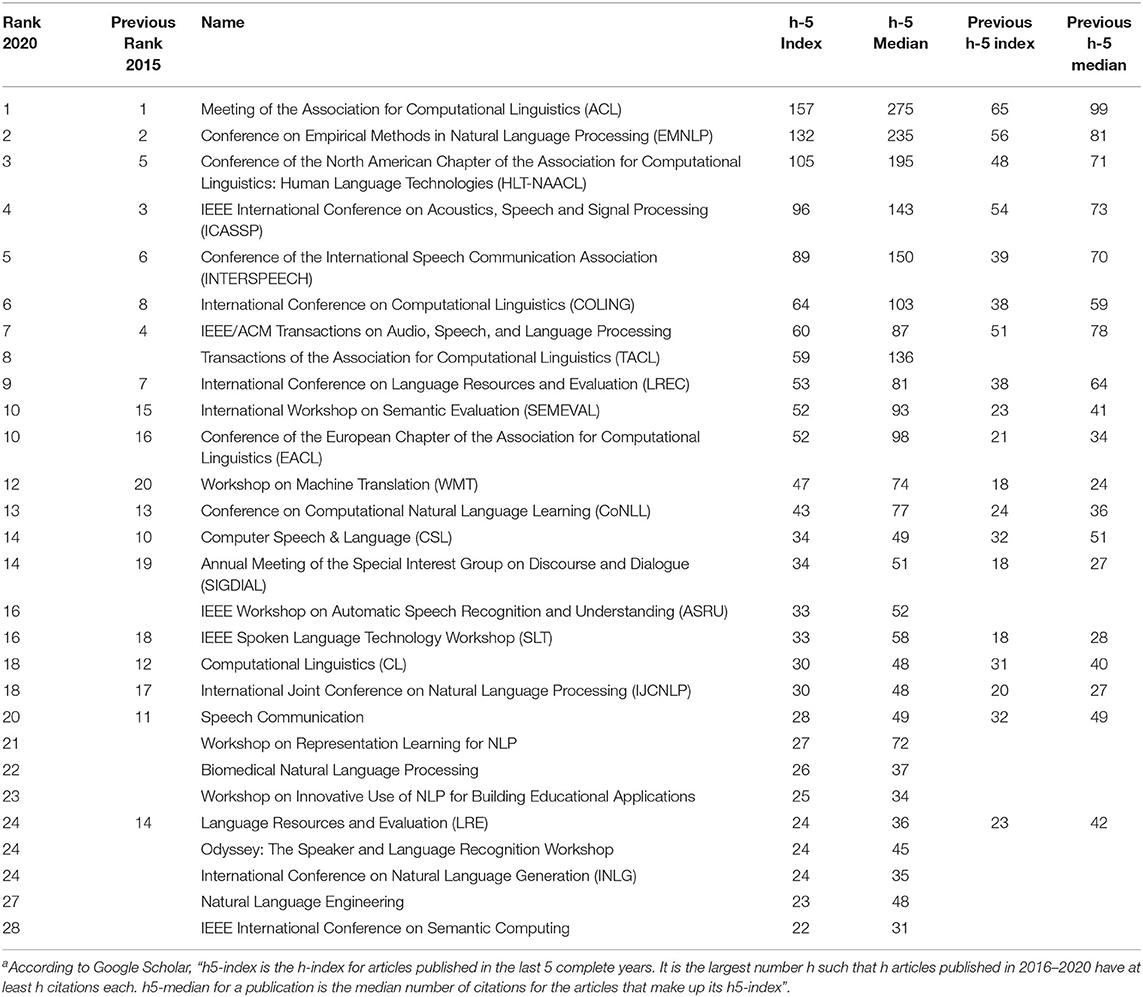
Table 20. Ranking of 28 top sources according to Google Scholar h5-index over the past 5 years (2016–2020)a, in comparison with the previous ranking over 2011–2015.
Most conferences of the field considerably increased, and some (such as ACL, EMNLP, NAACL, ISCA Interspeech, Semeval, EACL) even more than doubled, their h-index over the past 5 years, whereas journals stayed at about the same level, apart from the Transactions of the ACL (TACL), which was launched in 2013 and did not appear in the previous ranking. arXiv is also not considered here.
Topics
Archive Analysis
Here, our objectives are 2-fold: i) to compute the most frequent terms used in the domain, ii) to study their variation over time. Like the study of citations, our initial input is the textual content of the papers available in a digital format or that had been scanned. It contains a grand total of 380,828,636 words, mostly in English, over 55 years (1965–2020).
Terms Frequency and Presence
As depicted in Mariani et al. (2019b), we distinguished SNLP-specific technical terms from common general English ones after syntactic parsing, with the hypothesis that when a sequence of words is inside the NLP4NLP+5 corpus and not inside the general language profile, the term is specific to the field of SNLP. The 88,752 documents reduce to 81,634 documents when considering only the papers written in English. They include 4,488,521 different terms (unigrams, bigrams, and trigrams) and 34,828,279 term occurrences. The 500 most frequent terms (including their synonyms and variations in upper/lower case, singular/plural number, US/UK difference, abbreviation/expanded form, and the absence/presence of a semantically neutral adjective) in the field of SNLP were computed over the period of 55 years.
We called “existence”11 the fact that a term exists in a document and “presence” the percentage of documents where the term exists. We computed in that way the occurrences, frequencies, existences, and presences of the terms globally and over time (1965–2020) and also the average number of occurrences of the terms in the documents where they appear (Table 21).
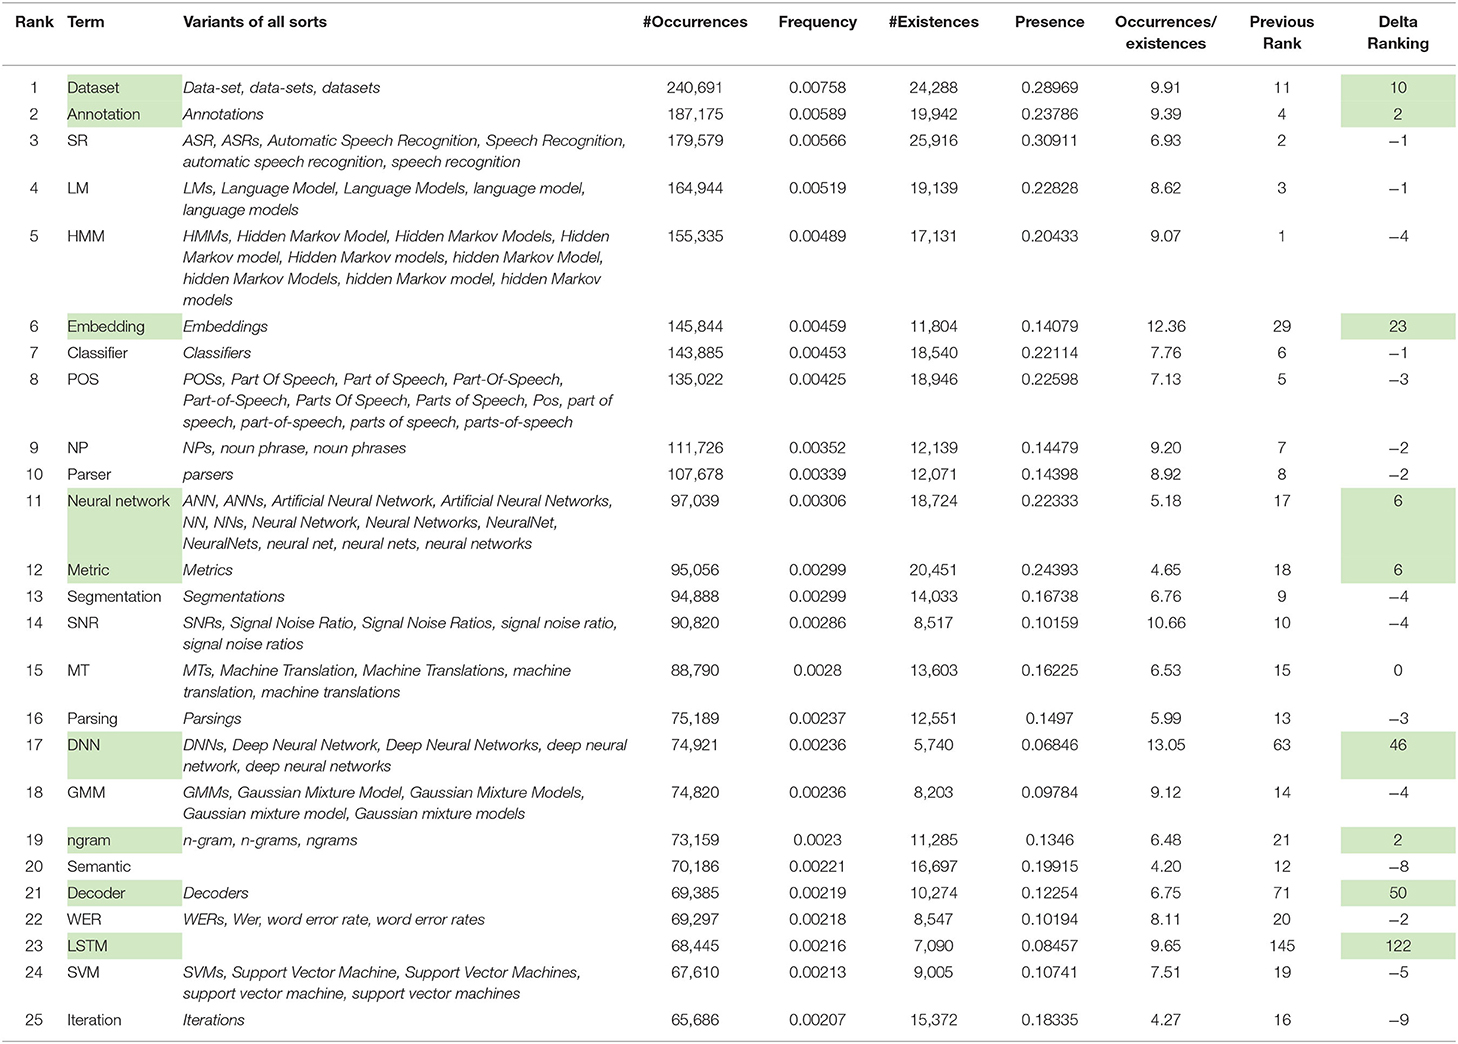
Table 21. The number of 25 most frequent terms up to 2020 overall, with number of occurrences and existences, frequency and presence, in comparison with 2015 (terms marked in green are those which progressed in frequency).
The ranking of the terms may slightly differ according to their frequency or to their presence. The most frequent term overall is “dataset,” which accounts for 7.6% of the terms and is present in 29% of the papers, whereas the most present term is “Speech Recognition,” which is present in 31% of the papers while accounting for 5.7% of the terms. The average number of occurrences of the terms in the documents where they appear varies a lot (from 4.2 for “semantic” to more than 13 for “Deep Neural Network” or 12 for “Embedding”).
We also compared the ranking with the 2015 one. A total of 17 of the 20 most frequent terms up to 2015 are still present in this list, with few changes. We see a large progress in the terms associated with the neural network and machine-learning approaches [“dataset,” “embedding,” “neural network,” “DNN (Deep Neural Networks),” “decoder,” and “LSTM (Long Short-Term Memory)”] and a small decrease for the terms related to previous approaches [“HMM (Hidden Markov Models)”, “GMM (Gaussian Mixture Models)”, “SVM (Support Vector Machine)”].
Change in Topics
The GapChart visualization tool12 that we developed (Perin et al., 2016) allows us to study the evolution of the terms over the years, based on their frequency or their presence. Figure 31 provides a glimpse of the evolution of topics over time, and we invite the reader to freely access the tool to get a better insight on the evolution of specific terms, such as those illustrated in the following figures.

Figure 31. Overview of the GapChart (2000 to 2011) illustrating the parameters. Years appear on the X-axis, and ordered terms (here according to their presence) appear on the Y-axis (10 terms in each color).
Figure 32 provides the evolution of the 25 most present terms in the past 10-year period (2010–2020). We see that some terms stay in this list over 10 years, such as “dataset,” “metric,” or “annotation,” while terms related to neural network and machine-learning approaches (such as “embedding,” “encoder,” “BERT (Bidirectional Encoder Representations from Transformers),” “transformer,” “softmax,” “hyperparameter,” “epoch,” “CNN (Convolutional Neural Networks),” “RNN (Recurrent Neural Networks),” “LSTM,” and “DNN”) made a large progression.
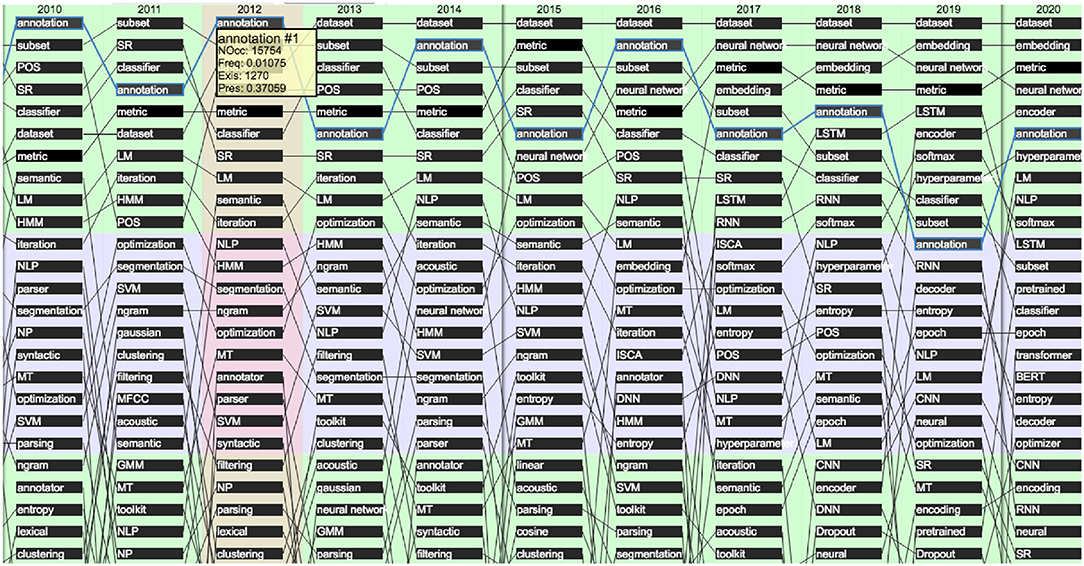
Figure 32. Evolution of the top 25 terms over the past 10 years (2010 to 2020) according to their presence (raw ranking without smoothing).
We may also select specific terms. Figure 33 focuses on the terms “HMM” and “Neural Network” in the 30-year period (1990–2020). It shows the slight preference for “Neural Network” up to 1992, then the supremacy of “HMM” up to 2015 and the recent burst of “Neural Networks” starting in 2013.

Figure 33. Evolution of the terms “HMM” (in green) and “Neural Network” (in blue) over the past 30 years (1990 to 2020) according to their presence in the papers.
The progress on terms related to neural networks and machine learning was especially spectacular over the past 5 years (2015–2020) (Figures 34–36).
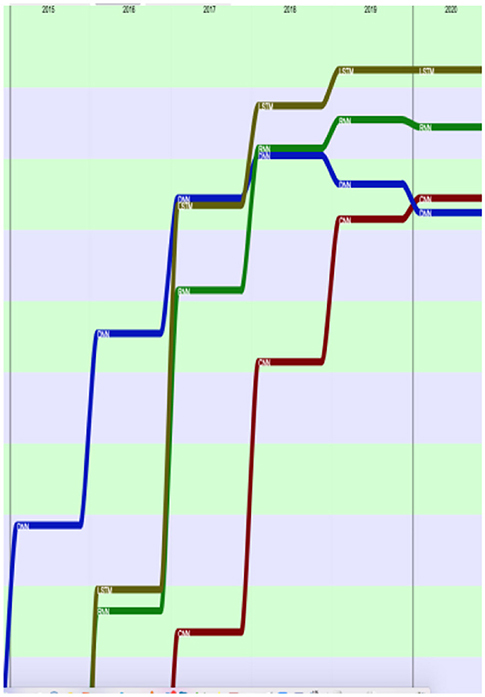
Figure 34. Evolution of the terms “LSTM” (brown), “RNN” (green), “DNN” (blue) and “CNN” (red) over the past 5 years (from the 100th rank in 2015 to the 30th in 2020), according to their presence.
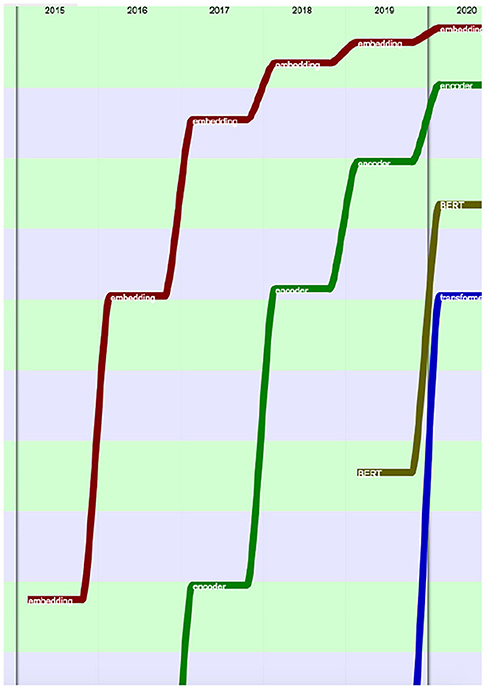
Figure 35. Evolution of the terms “embedding” (red), “encoder” (green), “BERT” (brown) and “transformer” (blue) over the past 5 years (from the 100th rank in 2015 to the 40th in 2020), according to their presence.
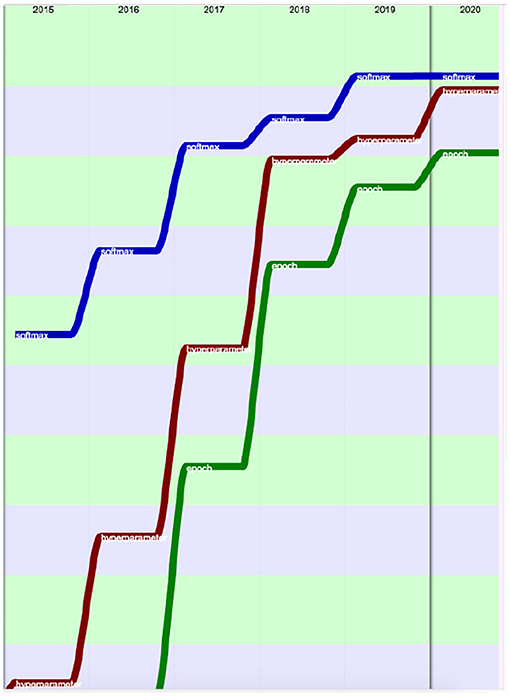
Figure 36. Evolution of the terms “softmax” (blue), “hyperparameter” (red) and “epoch” (green) over the past 5 years (from the 100th rank in 2015 to the 20th in 2020), according to their presence.
Tag Clouds for Frequent Terms
Tag Clouds provide an estimate of the main terms used on a given year. For this purpose, we use TagCrowd13 to generate Tag Clouds. We conducted experiments on full texts and on papers' abstracts and found that papers' abstracts provide a more meaningful analysis as they are more synthetic and contain a larger ratio of technical terms compared with general language. Figures 37A,B provide the Tag Clouds for 2015 and 2020. We clearly see the burst of terms related to machine learning (“BERT,” “CNN,” “decoder,” “embedding,” “encoder,” “pretraining,” “transformer”) that were absent in 2015, and the sustainability of “neural network,” “annotation,” “metric,” and “LM” (“Language Model”).
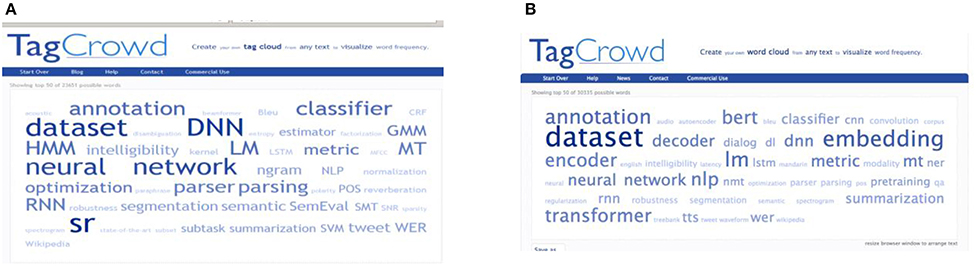
Figure 37. (A) Tag Cloud based on the abstracts of 2015. (B) Tag Cloud based on the abstracts of 2020.
Research Topic Prediction
Machine Learning for Time Series Prediction
We explored the feasibility of predicting the research topics for the coming years based on the past (Francopoulo et al., 2016a). We selected in the time series plug-in of the Weka14 machine-learning software package (Witten et al., 2011) the Gaussian Processes algorithm with an 18-year window that provided the best results on predicting the term frequency. We then applied this software to the full set of the NLP4NLP+5 corpus, year by year.
Table 22 provides the ranking of the most frequent terms in 2018 and 2019 with their observed frequency, the topic predicted by the selected Weka algorithm for 2020 based on the smallest gap between predictions and observations on the past rankings and the ranking actually observed in 2020. We see that the prediction to have the term within the most frequent top 10 is correct for 8 of them.
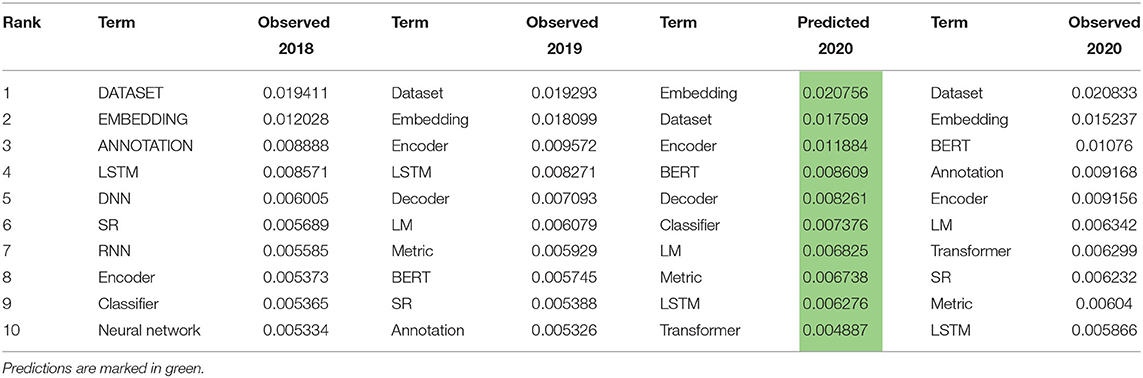
Table 22. Research topic prediction based on term frequency using the selected Weka algorithm.
Prediction Reliability
As we published such predictions for the years 2016–2020 in our previous paper, we were eager to verify whether these predictions were correct or not. We thus compared these predictions with the actual figures for these 5 years (Table 23). It appears that the predictions were quite reliable: the number of terms correctly predicted to appear within the 10 top terms varies from 7 to 8 in the first 3 years (2016, 2017, and 2018) that follow the year when the prediction was made (2015) and then decreases to 4 on the 4th year (given that BERT did not exist at the time of the prediction and therefore could not be predicted) and 3 in the 5th year, whereas one term (“dataset”) was correctly predicted with the right ranking for the 5 years. It therefore confirms the assumption we made in our previous papers that predictions seem to be reasonable within a 3-year horizon (unless a major discovery happens in the meanwhile) in this research domain.

Table 23. Comparison of the terms predicted in 2015 for the next 5 years (2016–2020) with the actual observations on these years (Predictions are in italics. Terms correctly predicted to appear among the 10 top terms are marked in yellow, term correctly predicted at its rank is marked in green).
Scientific Paradigms Ruptures
As expressed in our previous paper (Mariani et al., 2019b), “the difference between the prediction and the observation on each year provides a measure of the ‘surprise' between what was expected and what actually occurred. The years where this ‘surprise' is the largest may correspond to epistemological ruptures.” Figure 38 provides the evolution of this distance between 2011 and 2020, computed as the average absolute value of the difference between prediction and observation for the 200 most frequent terms. It suggests that 2012 was a year of big changes, which then reduced for 2 consecutive years and then slightly evolved since 2014.

Figure 38. Evolution of the distance between prediction and observation over the years.
The same distance between prediction and observation for a specific topic illustrates the way this term evolved compared with what was expected. Figure 39 shows the evolution of the “Deep Neural Network” (DNN) term. It suggests that the popularity (as measured by the frequency of the term) of this approach in the next year was underestimated up to 2015, then overestimated until 2018.
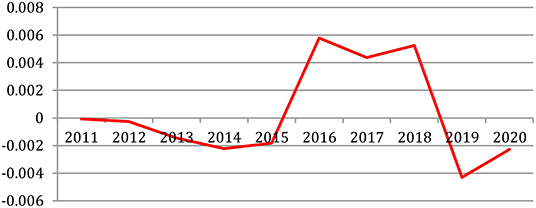
Figure 39. Measure of the expectation of an emerging research topic: Deep Neural Networks (DNN).
Predictions for the Next 5 Years
The predictions for the next 5 years (2021–2025) are provided in Table 24: it is expected that methods based on machine learning, word embedding, and neural networks will keep on attracting the researchers' attention, with a sustained interest for “Language Models (LM)” and a growing interest for “BERT” and “transformer.”
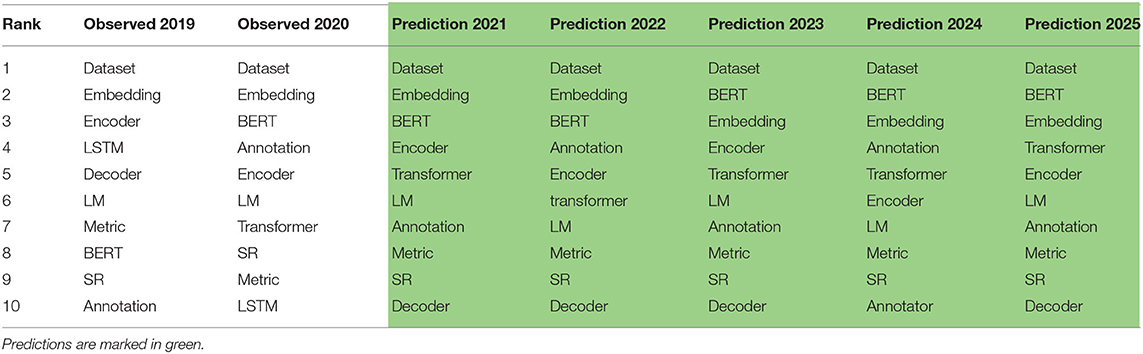
Table 24. Predictions for the next 5 years (2021–2025).
Innovation
New Terms Introduced by the Authors
We studied who introduced new terms which became popular, where and when, to assess the innovative contributions of authors and sources to the advances of the scientific domain (Mariani et al., 2018b). We considered the 81,634 documents written in English and the 61,431 authors who used the 4,488,498 terms contained in these documents. A number of 2,968 of these terms are present in the 22 documents of the first year (1965) that we considered as the starting date for the introduction of new terms, while we found 594,807 of these terms in the 5,313 documents published in 2020. We should stress that the birth of a term is only searched in the 34 NLP4NLP+5 sources and that it may have had a different meaning when it was first introduced.
Table 25 provides the ranked list of the 10 most popular terms according to their presence in 2020 and a comparison with the ranking in 2015. We should notice that 50% of the top 10 terms have changed, with a spectacular increase in the terms related to machine learning and neural networks (“embedding,” “encoder,” “hyperparameter,” and “LSTM”).
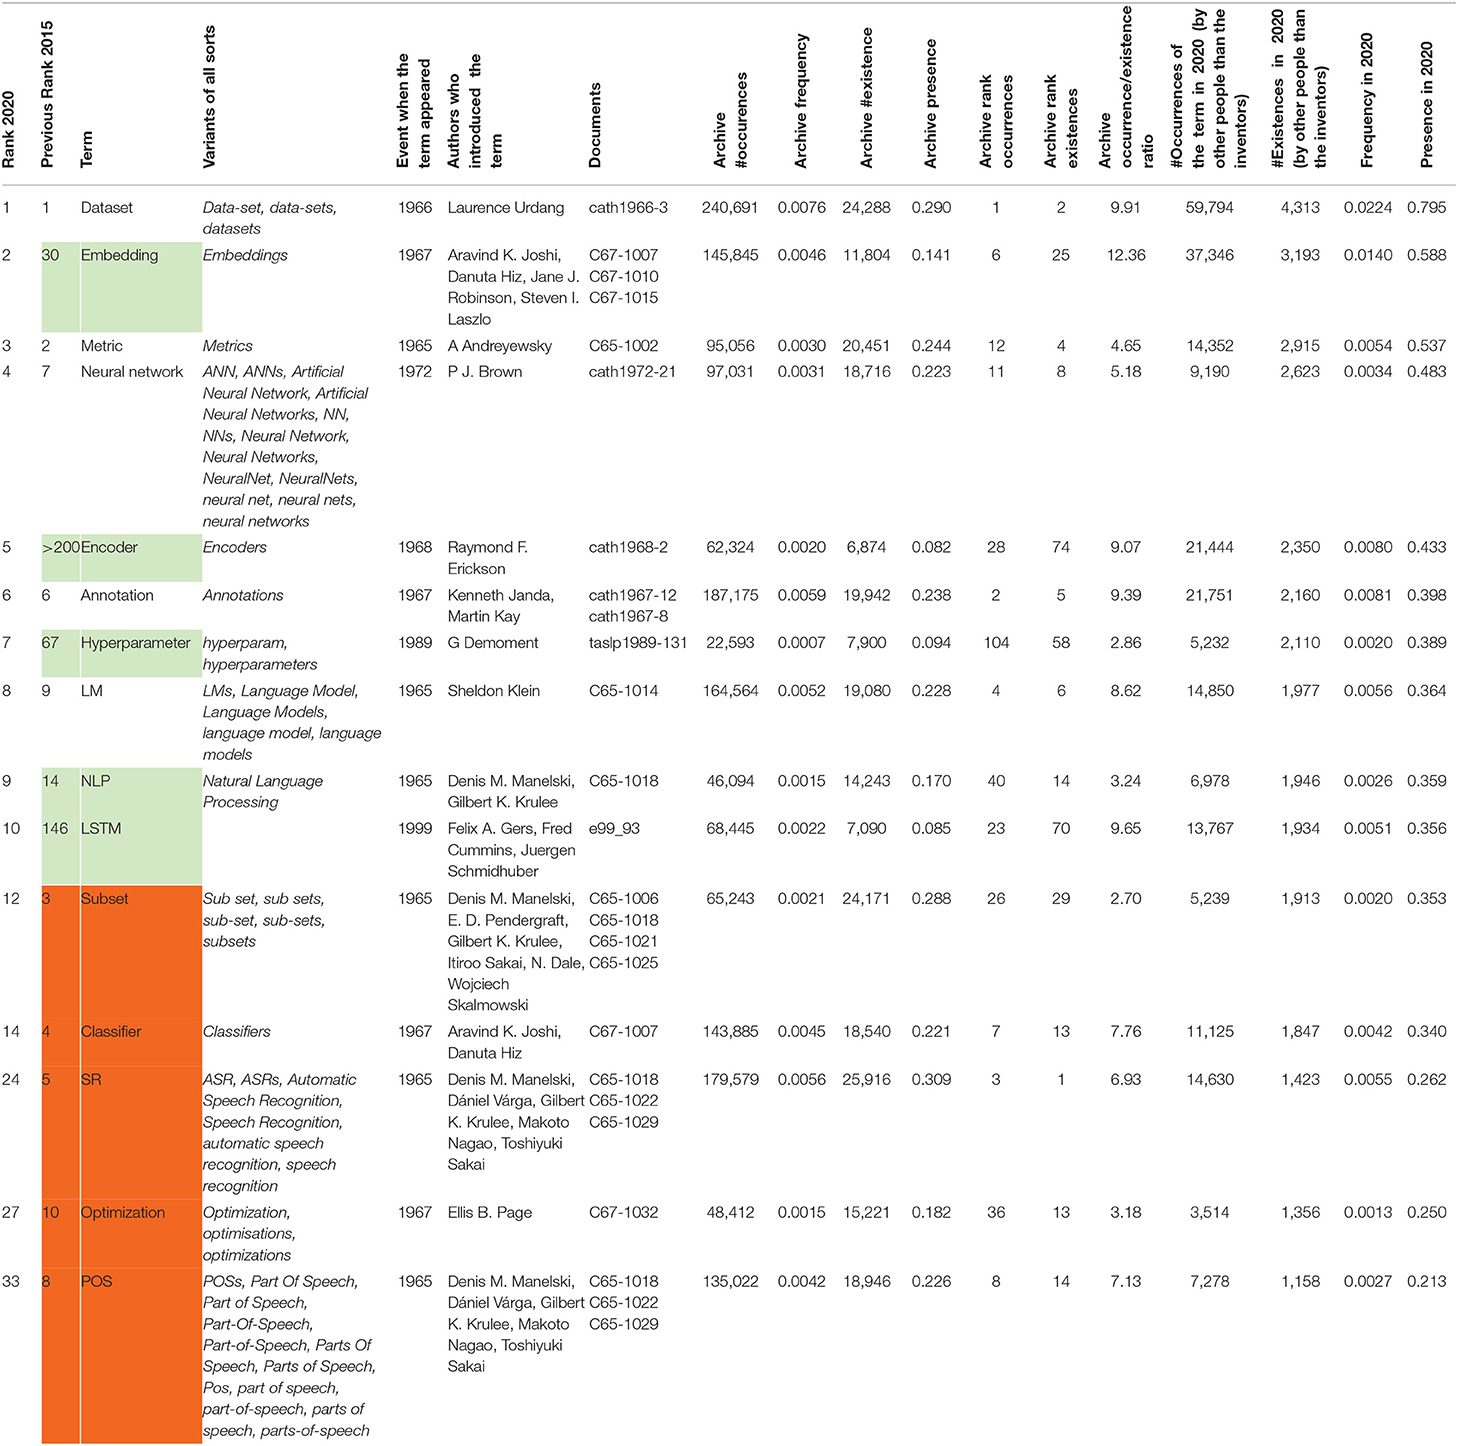
Table 25. The number of 10 most present terms in 2020, with variants, date, authors, and publications where they were first introduced, number of occurrences and existences in 2020, number of occurrences, frequency, number of existences and presence in the 55-year archive, with ranking and average number of occurrences of the terms in the documents where they appear, and comparison with the ranking in 2015 (the terms which joined the top 10 are marked in green, while the 5 which went out are marked in orange with their new and former ranking).
Measuring the Importance of Topics
In our previous paper, we proposed to measure the “innovation score” of a term, as the sum of the yearly presence of the term since its introduction.
We initially considered the 1,000 most frequent terms over the 55-year period, but given the poor quality and low number of different sources and papers in the first years, we decided to only consider the 45-year period from 1975 to 2020. Table 26 provides the overall ranking of the terms overall and specifically for the NLP and speech processing categories. This list is very similar to the one we computed in 2015 with a slightly different ranking.
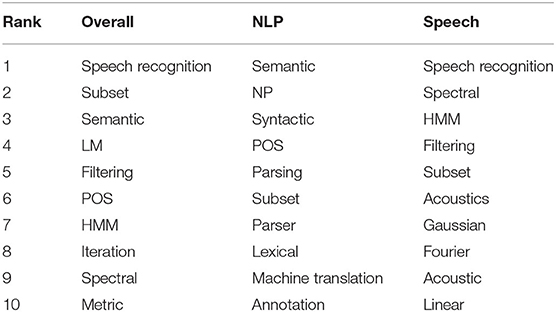
Table 26. Global ranking of the innovation score of the terms overall and separately for speech and NLP up to 2020.
We studied the evolution of the cumulative presence of the terms over the years (percentage of papers containing a given term up to a given year), to check the changes in paradigm while avoiding the noise due to the conference frequency. Figure 40 provides the evolution of the 10 most popular terms according to this measure. Their global ranking over the years corresponds to the order of the terms in the legend of the figure, as it will be the case for all figures in this section Innovation. Percentages are provided either in relation to the total number of papers (qualified as “all papers”), or with the papers related to a specific topic (qualified as “topical papers”).
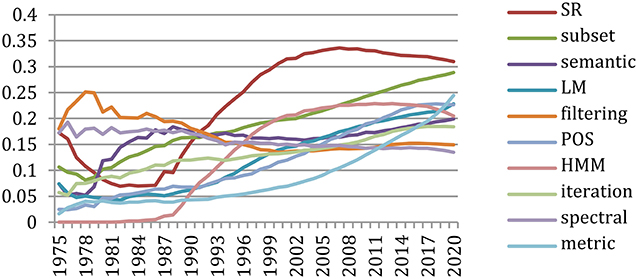
Figure 40. Cumulative presence of the 10 most important terms over time (% of all papers).
We see for example that Speech Recognition (“SR”) has been a very popular topic over the years, reaching a presence in close to 35% of the papers published up to 2008, then slightly decreasing.
Measuring Authors' Innovation
We computed in a similar way an innovation score for each author, illustrating his or her contribution in the introduction and early use of new terms that subsequently became popular, as the sum over the years of the annual presence of the terms in papers published by the author (percentage of papers containing the term and signed by the author on a given year), overall and specifically for the NLP and for the speech processing categories (Table 27). The names in this table are also very similar to those of 2015, with a slightly different ranking.

Table 27. Global ranking of the authors overall and separately for speech and NLP up to 2020.
This measure does not place on the forefront uniquely the “inventors” of a new topic, as it is difficult to identify them, given that we only consider a subset of the scientific literature (the NLP4NLP+5 corpus), but it includes the early adopters who published a lot when or just after the topic was initially introduced. Therefore, authors of highly cited papers introducing innovative approaches (such as Glove or BERT recently) do not fully benefit for their innovation, as many authors immediately adopted, used, and published with these approaches on the same year.
Measuring the Innovation in Sources
We also computed an innovation score for each source as the sum over the years of the annual presence of the terms in papers published in the source, conference or journal (percentage of papers containing the term which were published in the publication on a given year), overall and specifically for NLP and for Speech Processing (Table 28). The names in this table are also very similar to those of 2015, with a slightly different ranking (progress for EMNLP in NLP and ISCA overall and in Speech Processing).
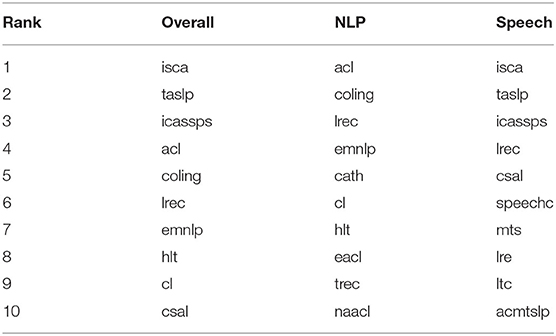
Table 28. Global ranking of the sources overall and separately for Speech and NLP up to 2020.
Measuring the Contribution of Authors and Sources to a Specific Topic
We may also study the contributions of authors or sources to a specific topic, using the cumulative innovation score of authors and sources attached to this topic.
Contributions to the Study of “HMM”
Figure 41 provides the cumulative percentage of papers containing the term “HMM “published up to a given year by the 10 most contributing authors, ranked according to the innovation measure up to 202015. Compared with 2015, we only observe the appearance of Junishi Yamagishi on innovative HMM-based speech synthesis.
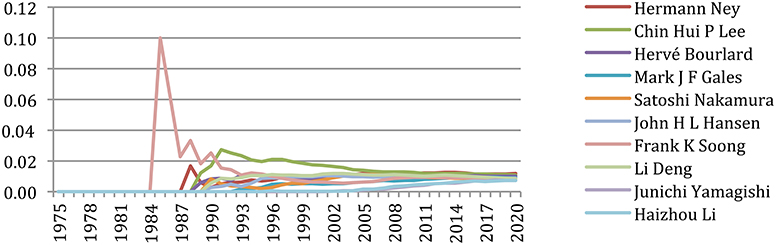
Figure 41. Authors' contributions to “HMM” in speech and NLP (% of topical papers).
We also do not observe much difference regarding the contributions of the various sources to HMMs (Figure 42), with the IEEE TASLP as a pioneer in this area since 198216, while ISCA Conference series represents 45% and IEEE-ICASSP 25% of the papers published on HMM up to 2020 and publications that are placed in both speech and NLP (CSL, HLT, LREC) help to spread the approach from speech processing to NLP as well (ACL, EMNLP).
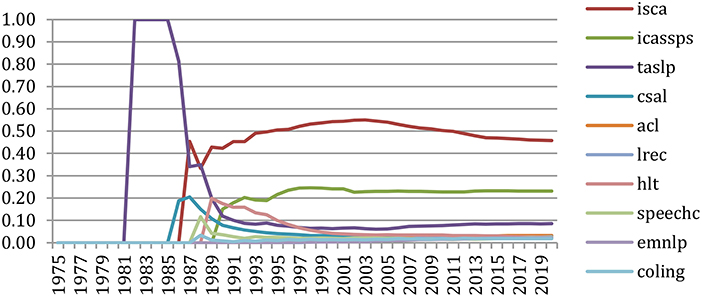
Figure 42. Sources' contributions to “HMM” in speech and NLP (% of topical papers).
Contributions to the Study of “DNN”
We studied the authors' contributions over the years17 to deep neural networks (“DNNs”) that recently gained a large audience, in terms of percentage of authors and papers (“presence”) mentioning the term (Figure 43).
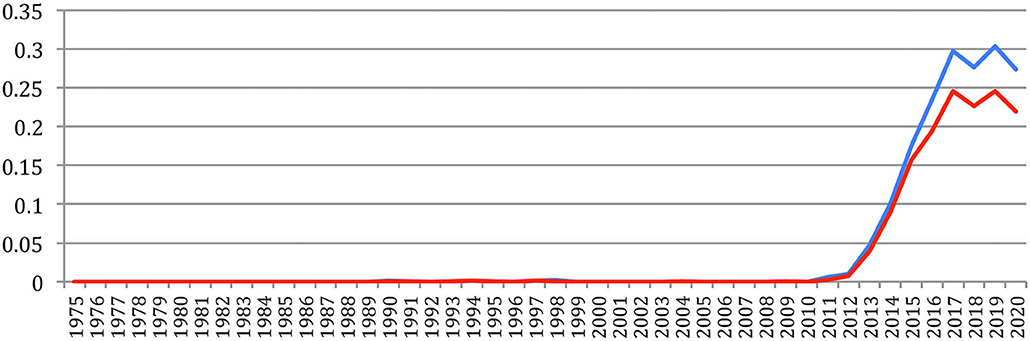
Figure 43. Percentages of authors (blue) and of papers (red) mentioning “DNN” in speech and NLP over the years (% of all papers).
We notice the important contribution of Asian authors to this topic (Figure 44), with the pioneering contributions of Dong Yu who published about 30% of the papers published on this topic until 2012. Compared with 2015, we notice larger changes than in the case of HMMs, as it is a more changing field, with the appearance of new names (Shinji Watanabe, Tomohiro Nakatani, Helen Meng, and Shri Narayanan).
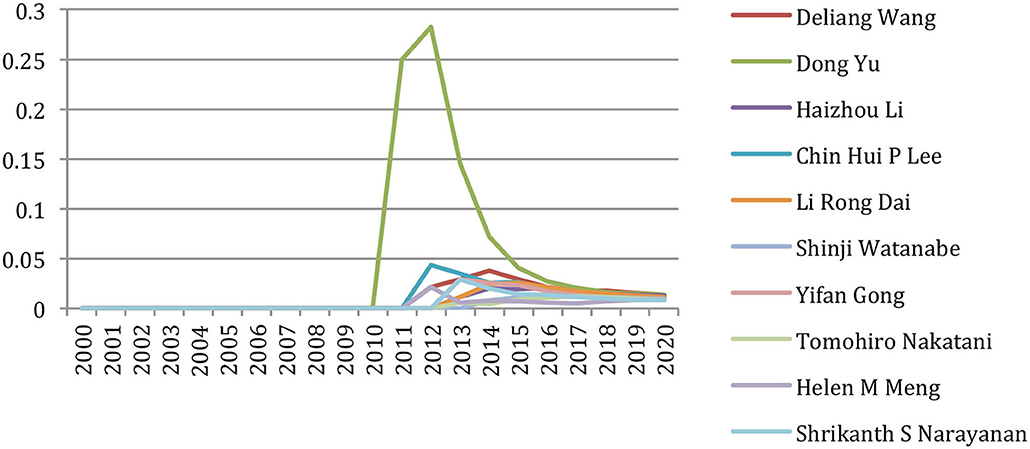
Figure 44. Cumulative authors' contributions to the study of DNN in speech and NLP (% of topical papers).
We may then also study how an author contribution to a specific topic compares with his/her main contributions to other topics, and how it evolved over the years. Figure 45 illustrates the fact that the contributions of Dong Yu are essentially focused on deep neural networks and second on the Softmax function in the years 2011–2013.
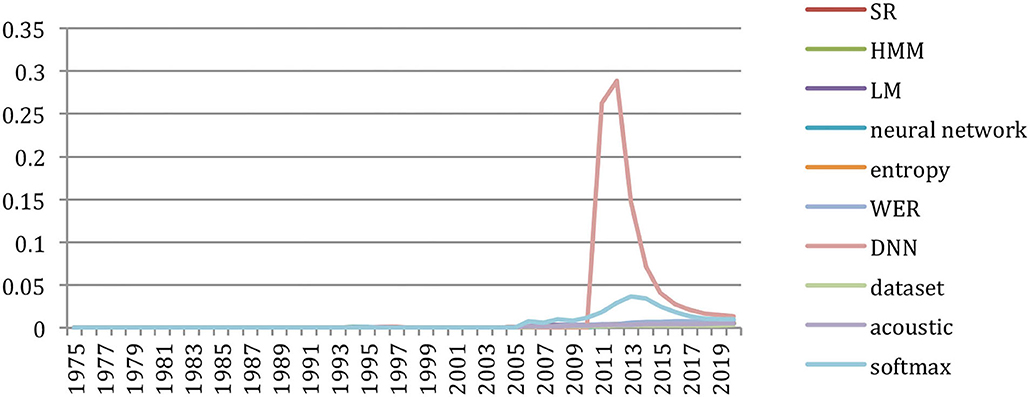
Figure 45. Main contribution areas for Dong Yu (% of topical papers).
Looking at the source contribution to “DNN,” we see that it started from the speech community (ISCA Interspeech and IEEE TASLP) and then diffused in the natural language processing community (starting with ACL) (Figure 46).

Figure 46. Cumulative sources' contributions to “DNN” in speech processing and NLP (% of topical papers).
Contributions to the Study of “Embedding”
Similarly, we studied the authors' contributions over the years18 to “Embedding” which was used for many years from the 70s but gained since 2015 a large audience, in terms of percentage of authors and papers (“presence”) mentioning the term (Figure 47).
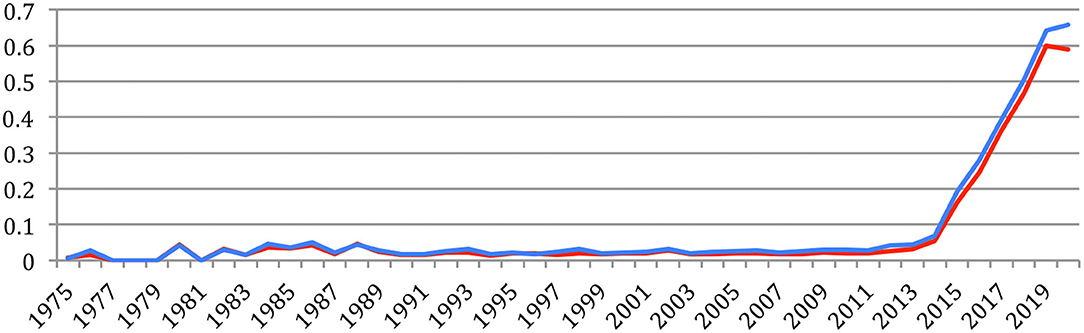
Figure 47. Percentages of authors (blue) and of papers (red) mentioning “Embedding” in speech and NLP (% of all papers).
Figure 48 shows the contribution of authors to the topic of Embedding, which both shows the individual contributions and the large increase in the presence of the topic since 2015, as illustrated in Figure 47.
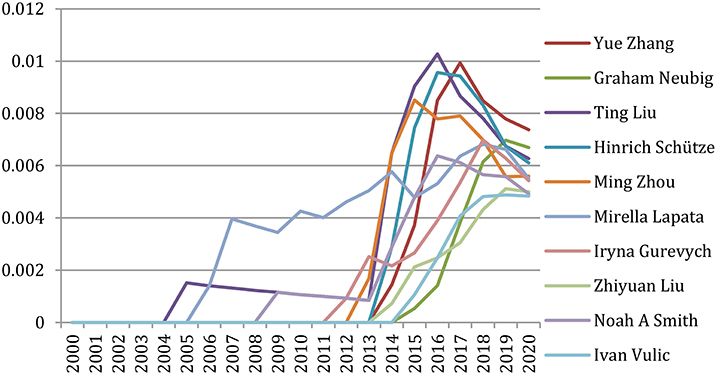
Figure 48. Cumulative authors' contributions to the study of “Embedding” in speech and NLP (% of topical papers).
In this case, the topic was initiated in the natural language processing community (COLING, ACL, IJCNLP) and then diffused in the speech community as well (ISCA Interspeech, ICASSP, TASLP) (Figure 49).
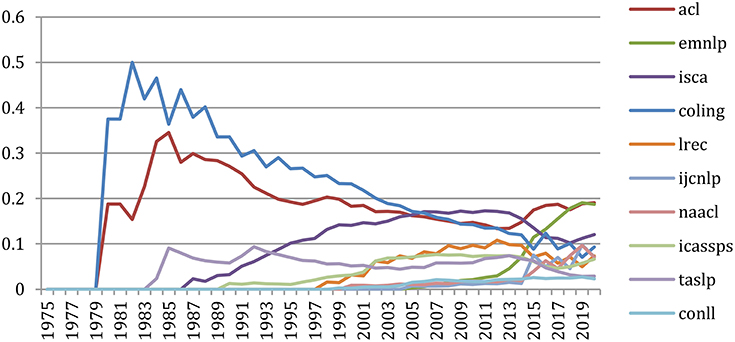
Figure 49. Cumulative sources' contributions to the study of “Embedding” in speech and NLP (% of topical papers).
We may then also study how a source contribution to a specific topic compares with its main contributions to other topics, and how it evolved over the years. Figure 50 clearly illustrates the major contribution in the recent years of the EMNLP conference to the research on “embedding,” where almost 20% of the papers produced so far on this topic have been published.
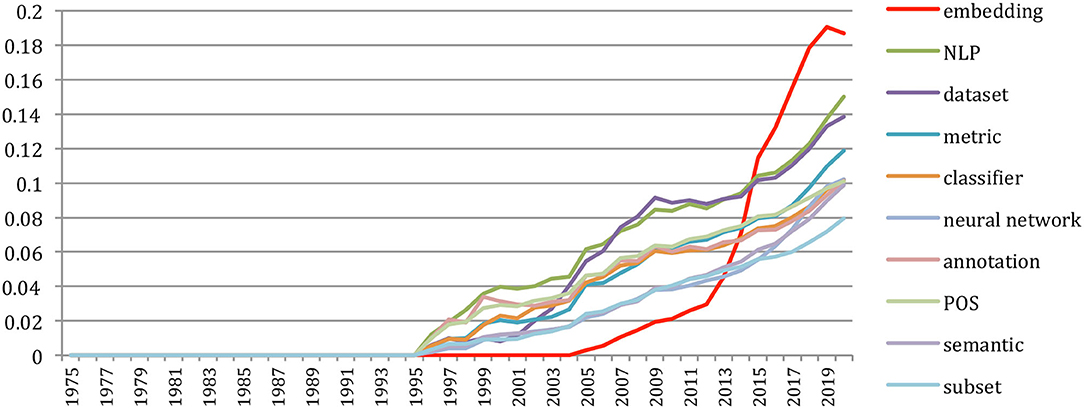
Figure 50. Main contributions of the EMNLP conference series (% of topical papers).
Use of Language Resources
The LRE Map
We have conducted an analysis of language resources (LR) as bricks that are used by the researchers to conduct their research investigations and develop their systems (Francopoulo et al., 2016b). We consider here language resources in the broad sense, embracing data (e.g., corpus, lexicons, dictionaries, terminological databases, language models, etc.), tools (e.g., morpho-syntactic taggers, prosodic analyzers, annotation tools, algorithms, software packages, etc.), system evaluation resources (e.g., metrics, training, dry run or test corpus, evaluation packages, etc.), and meta-resources (e.g., best practices, guidelines, norms, standards, etc.) that are mentioned in the LRE Map (Calzolari et al., 2012). This database is produced by the authors of papers at various conferences and workshops of the domain who are invited when submitting their paper to fill in a questionnaire which provides the main characteristics of the language resources produced or used in the research investigations that they report in their paper.
The version of the LRE Map that we used in our previous paper contained information harvested from the authors in 10 conferences from 2010 to 2012, for a total of 4,396 different resources. In the present paper, we use an updated version of the LRE Map containing data harvested in 53 conferences and workshops from 2010 to 2018 (6 more years), for a total of 9,725 resources, that we cleaned up (correct the name of the resources, eliminate the duplicates, regroup the various versions of resources from the same family, etc.). We finally ended up with 5,609 different resources that we searched in the articles of the NLP4NLP+5 corpus.
Evolution of the Use of Language Resources
Figure 51 provides the evolution of the number of different resources mentioned in the papers (that we call “existence”) compared with the evolution of the number of papers over the years, whereas Figure 52 provides the average number of language resources mentioned in a paper (that we call “presence”). The corresponding curves cross in 2002, when more than one language resource was mentioned on average in a paper, reflecting the shift from knowledge-based approaches to data-driven approaches in SNLP research. Since 2015, the number of mentions of language resources largely increased, to attain 16,000 mentions in 2020, whereas the number of papers also greatly increased, and the ratio stays at about 3 language resources mentioned in a paper on qaverage.
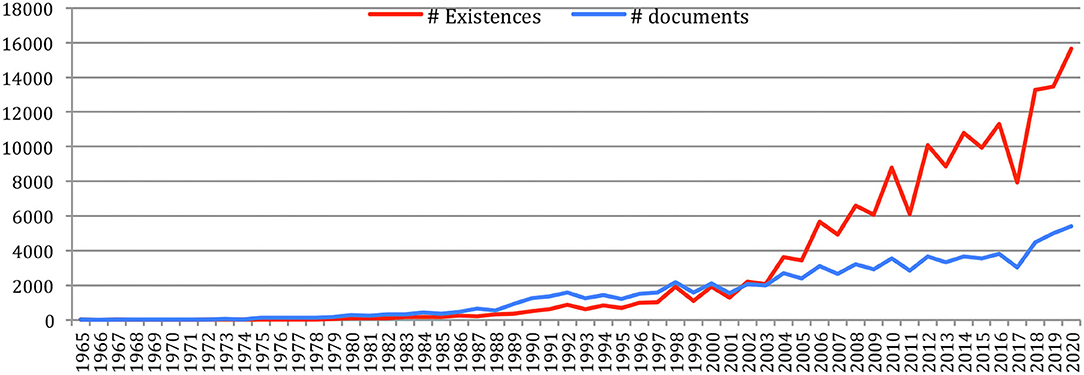
Figure 51. Evolution of the number of papers and of mentions of language resources in papers over the years.
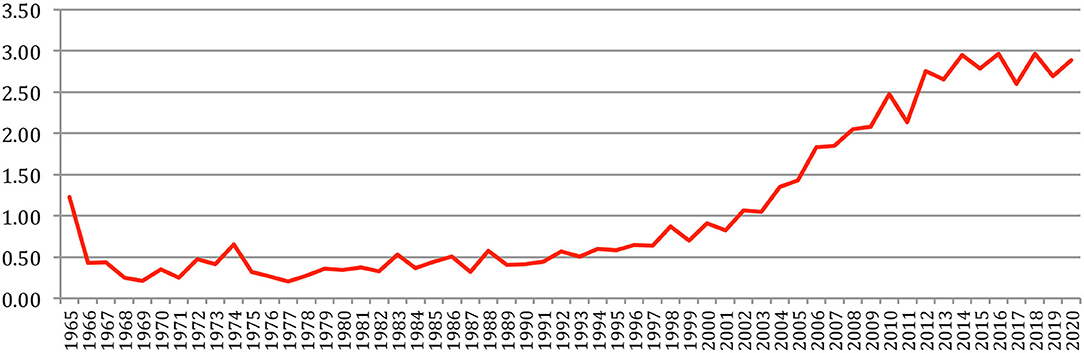
Figure 52. Evolution of the ratio between the number of mentions of Language Resources in papers and the number of papers over the years.
Table 29 provides the ranking of language resources according to their “existence” (number of papers where they are mentioned), their type (corpus, lexicon, tool, etc.), their number of “occurrences” (number of mentions in the papers), the first authors who mentioned them as well as the first publications, and the first and final years when they were mentioned, and a comparison with the 2015 ranking. We see that half of the language resources that were in the previous ranking are still present, “Wikipedia” now being at the first rank, while the other half were previously at a rank higher than 10th (BLEU, MATLAB, AnCora) or were not considered in the LRE Map, being posterior to 2012 (Word2Vec, Glove). We also see that a language resource such as Word2Vec was immediately adopted by many authors on the very same year when it appeared first in a paper of the NLP4NLP+5 corpus.

Table 29. Presence of the LRE Map language resources in NLP4NLP+5 articles (2020 compared with 2015).
Table 30 provides over the past 20 years (2000 to 2020) the number of mentions of the different language resources from the LRE Map together with the number of documents that were published and the list of the 10 most cited language resources on that year. We see in the recent years, the increase of language resources related to machine learning and neural networks (Word2Vec, Weka, Glove, Keras, Seq2Seq, ROBERTa), as well as to the use of metrics (BLEU and now ROUGE) and the appearance of new speech corpora (LibriSpeech, SquaD).
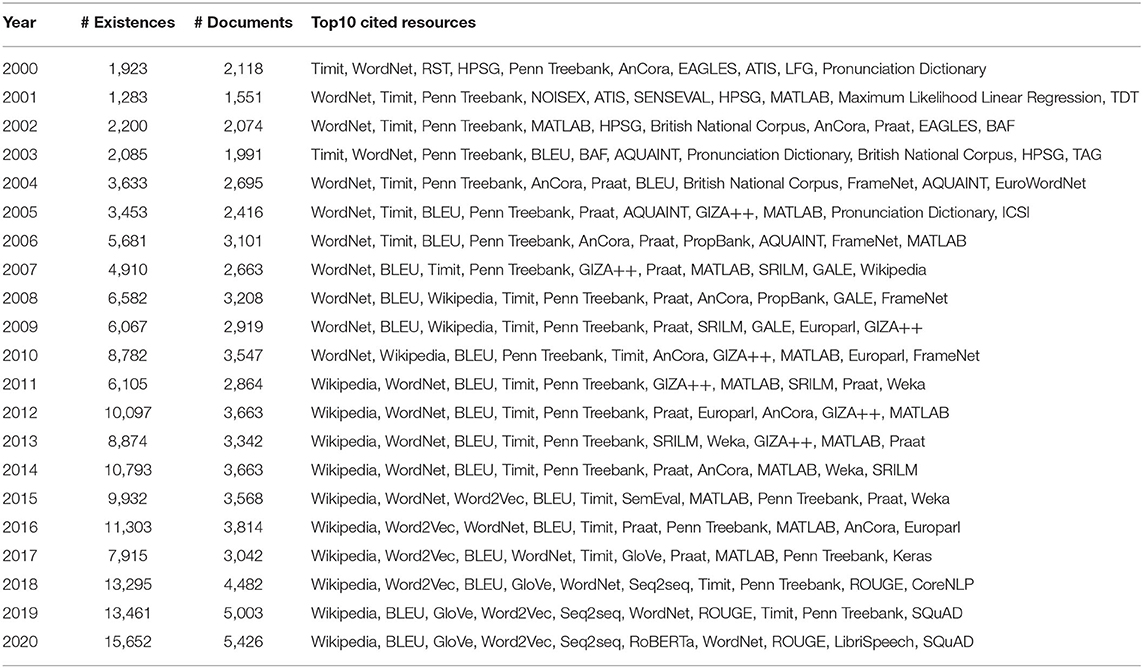
Table 30. Ranked top 10 mentioned LRE Map language resources per year (2000–2020).
Language Resource Impact Factor
We proposed to define the “Impact Factor” of a language resource as its existence, in recognition of the importance of the corresponding language resources for conducting research in NLP and of the researchers who provided these useful language resources, similar to the role of a citation index. Table 31 provides the impact factors for the language resources of the “Data,” “Evaluation,” and “Tools” types. We can notice the importance of quality measures (BLEU introduced for machine translation and ROUGE for text summarization) and of the recent burst of machine-learning toolkits (Word2Vec, GloVe, Weka, Seq2seq).

Table 31. Language resources impact factor (data, specifications, and tools).
Text Reuse and Plagiarism
Here we studied the reuse of the textual content of NLP4NLP+5 papers in other NLP4NLP+5 papers (Mariani et al., 2016, 2018a).
Data
We considered here 88,752 documents published by 66,995 authors from 1965 to 2020, which constitute a large part of the published articles in the field of SNLP, apart from the workshop proceedings and the published books.
The preparation of the textual data is described in the study of Francopoulo et al. (2015b). The overall number of words is roughly 380 MWords. Only the texts in English and French have been retained.
Algorithm for Computing Papers Similarity
The detection of “copy & paste” as defined in Appendix 5 is conducted through an algorithm described in the study of Mariani et al. (2019b). The comparison is conducted on a window of seven tokens, using the Jaccard distance and a threshold of 0.04. We therefore consider as potentially reused or plagiarized all couples of articles with a similarity score of 4% or more according to our measure of similarity.
Categorization of the Results
Our previous experiments showed that it is necessary to carefully check the results as it may contain false alarms due to the presence of short texts, such as acknowledgments, or of truncated or merged documents due to OCRization for the eldest data. In many cases, the author appears with a different spelling, or references are properly quoted, but with a different wording, a different spelling (e.g., American vs. British English) or an improper reference to the source. We had to manually correct these cases and move the corresponding couples of papers to the right category (from “reuse” or “plagiarism” to “self-reuse” or “self-plagiarism” in the case of papers' authors names, from “plagiarism” to “reuse” in the case of references). This manual correction can be done for the articles placed in the “reuse” and “plagiarism” categories, as they are not very numerous, whereas the detection of the authors' name ensures a good reliability for the “self-reuse” and “self-plagiarism” categories.
For each of the 4 copy and paste categories, we produced the list of couples of “similar” papers according to our criteria, with their similarity score, identification of the common parts, and indication of a similar list of authors or of the same title.
Results on NLP4NLP+5
We do not include in this paper the matrices for each of the four categories (self-reuse, self-plagiarism, reuse, and plagiarism) displaying the number of papers that are similar for each couple of the 34 sources (considered as “using sources” and “used sources”) that were presented in our previous paper, as they do not show a large difference with the previous findings. On the 13,068 cases detected using the NLP4NLP+5 corpus, 5,799 (44%) are identified as self-reuse, 6,942 (53%) as self-plagiarism, 152 (1.5%) as reuse, and 175 (1.5%) as plagiarism.
Figure 53 provides the percentage of papers that are detected as using parts of other papers over the years, whereas Figure 54 provides the percentage of papers that are detected as having been used by other papers over the years, given that they almost entirely correspond to self-reuse and self-plagiarism.

Figure 53. Percentage of papers reusing a part of other papers over the years.
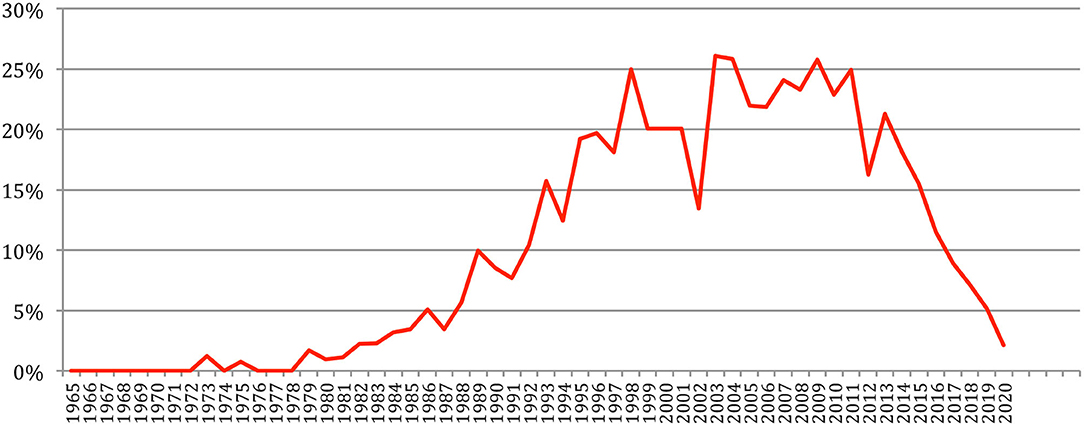
Figure 54. Percentage of papers being reused by other papers over the years.
As it clearly shows, self-reuse and self-plagiarism keep being very common: about 25% of papers use parts of previous papers, whereas parts of 25% of papers are used in a new paper. This may also be related to the submission of similar papers at two different conferences on the same year, or to the publication in a journal of a paper previously published in a conference.
Just as noticed in our previous NLP4NLP study, the reuse of papers is done within a short time period (on the same year in 40% of the cases, and within 2 years in 85% of the cases). The reuse of conference papers in journal articles is done with a slightly longer delay (on the same year in 11% of the cases, and within 3 years in 84% of the cases).
Plagiarism
We characterized plagiarism by authors using in a paper a large part (more than 4%) of textual content from a paper of other authors without citing the source paper.
In our previous study related to publications up to 2015, 116 cases of possible plagiarisms were detected over 50 years on a total of 63,357 papers (less than 0.4%), which reduced to only one case with a 10% similarity score after a careful manual checking made possible by the small number of detected cases, as described in the study of Mariani et al. (2019b).
From 2015 to 2020, 47 cases of possible plagiarism are detected on a total of 20,649 papers, which also reduce to a single case after a careful manual checking! In addition to the various reasons for the false detection of plagiarism identified in our previous study, we also found out that a paper may be identified as plagiarizing another paper, whereas the authors of that other paper actually plagiarize themselves a former paper of the previous authors!
Conclusions
When comparing the study contained in this paper with the findings of our two previous papers, we may first consider the results that reinforce on 55 years the conclusions that we made on 50 years.
As already encountered while pursuing the study reported in our previous papers, we appreciated the benefit to have access to a large quantity of publications that are now freely accessible online, while we faced the difficulty of dealing with proprietary data which requires extensive discussions with the publishers to explain the nature of our investigations that necessitates a large collection of papers. It also raises the problem of distributing the data, replicating the results and updating the corpus.
We still struggled with the lack of a consistent and uniform identification of entities (titles, authors names, gender, affiliations, conference and journal names, funding agencies, names of language resources, etc.), which required a tedious manual correction process. This problem would need an international effort to provide unique identifiers to these entities, or else sophisticated disambiguation processes.
We also see that there is less and slow progress in the feminization of the research community.
This study confirmed the possibility to predict some future scientific developments for the next 3 years.
The study of reuse and plagiarism still concludes in the scarcity of real plagiarism cases, a conclusion which, however, needs a careful manual checking in addition to any automatic process, and in the commonness of the reuse of previously published textual content by the same authors which is very widespread and easily understandable, especially when turning a conference paper into a journal article.
While confirming these previous findings, this study also illustrates the tremendous changes in the speech and natural language processing community that happened during the past 5 years.
We first notice a very intense research activity reflected by a huge increase in the number of papers and authors, similar in the single year 2020 to what occurred in the first 25 years of our corpus.
More and more collaborations took place among authors, who formed new clusters. Important changes appear in the ranked list of the most productive, most collaborative, most cited, and best h-indexed authors, with the appearance of many new names, especially of Asian origins, who publish a lot, while many researchers of the pioneering times are now gradually retiring. Also, it seems that slightly more focus is nowadays devoted to NLP compared to speech processing where many breakthroughs have already been achieved in the recent past and which now shares many scientific challenges and many similar approaches in common with NLP.
This is due to the appearance of new paradigms, such as deep learning, word embedding, or unsupervised machine learning, which immediately attracted a large community of researchers, due to the acceleration in publishing, who increasingly publish in conferences and journals either within NLP4NLP, where we notice a specific increase in activity for the Transactions of the ACL, or outside of the NLP4NLP core research area and publications, especially in arXiv which now appears as a popular free open-access not-peer-reviewed publication facility.
The use of language resources is also increasing a lot, according to the crucial need of data in machine-learning approaches for developing and improving the quality of systems related to a language, a population or a task, and of proper metrics to measure quality and progress. New language resources of various kinds (dataset, tools, metrics) specifically related to these paradigms became quickly very popular.
Some research domains were initiated or reactivated, such as semantic analysis, sentiment analysis, speech translation, or processing of low-resourced languages.
Perspectives
We would like to improve the quality of the automatic extraction of information (such as authors' names, references, sources, terms, language resources) to reduce the burden of manual corrections by taking into account the context through novel approaches of disambiguation based on word embedding.
We believe that the raw data that we gathered and the information that we extracted after substantial manual cleaning would provide interesting training and test data for evaluation campaigns (such as automatic name extraction, named entity disambiguation or gender detection).
Data Availability Statement
The datasets presented in this study can be found in online repositories. The names of the repository/repositories and accession number(s) can be found below: http://www.nlp4nlp.org.
Author Contributions
JM coordinated the production and writing of the paper. GF produced the corpus and developed the software packages. PP provided specific analyses and regular advices. FV developed the GapChart visualization tool. All authors contributed to the article and approved the submitted version.
Conflict of Interest
GF was employed by Tagmatica.
The remaining authors declare that the research was conducted in the absence of any commercial or financial relationships that could be construed as a potential conflict of interest.
Publisher's Note
All claims expressed in this article are solely those of the authors and do not necessarily represent those of their affiliated organizations, or those of the publisher, the editors and the reviewers. Any product that may be evaluated in this article, or claim that may be made by its manufacturer, is not guaranteed or endorsed by the publisher.
Footnotes
3. ^We call “event” the holding of a conference or the publication of a volume of a journal.
4. ^“Authorship” is the signature of a paper by a given author, whatever the number of affiliations he/she may have. If an author published two papers in a conference, it counts for two authorships for this author.
5. ^“Epicene” means that the given name is gender ambiguous.
6. ^We notice a small discrepancy in the numbers due to the 2015 papers which were not counted in the previous study.
7. ^Keynote papers are not taken into account if their content was not included in the conference proceedings.
8. ^NLP4NLP sources are slightly different here, as it is no more possible to differentiate papers specifically related to speech in the ICASSP conference.
9. ^http://scholar.google.com/citations?view_op=top_venues&hl=en&vq=eng_computationallinguistics
10. ^https://scholar.google.fr/citations?view_op=top_venues&hl=fr&vq=eng_signalprocessing
11. ^Also called “Boolean frequency” or “binary frequency”.
12. ^Gapchart: http://vernier.frederic.free.fr/Infovis/rankVis4/.
14. ^www.cs.waikato.ac.nz/ml/weka
15. ^Some authors have published earlier on that topic, but don't belong to the 10 most contributive ones on the long run.
16. ^We only had access to IEEE ICASSP proceedings since 1990, while Computer Speech and Language started in 1986 and the ISCA Conference Series in 1987.
17. ^The term “DNN” appeared first in a paper published in 1990 (Yamaguchi et al., 1989), but with the meaning of “Dynamic Programming Neural Network”, with a reference to a paper published by Sakoe at ICASSP 1989 (which is not considered in NLP4NLP+5). However, the low presence of the term with this meaning rightly prevents these authors to appear among the main contributors to “DNN” in its present meaning.
18. ^Here also, the term appeared early in 1967, but with a different meaning and a low presence until the recent years.
References
Atanassova, I., Bertin, M., and Mayr, P. (2019). Mining scientific papers: NLP-enhanced bibliometrics. Front. Res. Metrics Anal., 4, 2. doi: 10.3389/frma.2019.00002/full
Banchs, R. E. (2012). Proceedings of the ACL-2012 Special Workshop on Rediscovering 50 Years of Discoveries Association for Computational Linguistics Jeju, Korea. Available online at: http://aclweb.org/anthology/W12-32
Calzolari, N., Del Gratta, R., Francopoulo, G., Mariani, J., Rubino, F., Russo, I., et al. (2012). “The LRE Map. Harmonising community descriptions of resources,” in Proceedings of the Language Resources and Evaluation Conference (LREC 2012) (Istanbul).
Councill, I. G., Giles, C., and Kan, M-. Y. (2008). “ParsCit: An open-source CRF reference string parsing package,” in Proceedings of LREC 2008(Marrakesh).
Daudert, T., and Ahmadi, S. (2019). “CoFiF: A corpus of financial reports in French language,” in Proceedings of the First Workshop on Financial Technology and Natural Language Processing. (Macao), 21–26.
Francopoulo, G., Mariani, J., and Paroubek, P. (2015a). “NLP4NLP: the Cobbler's children won't go unshod,” in 4th International Workshop on Mining Scientific Publications (WOSP2015), Joint Conference on Digital Libraries 2015 (JCDL 2015) (Knoxville, TN).
Francopoulo, G., Mariani, J., and Paroubek, P. (2015b). “NLP4NLP: applying NLP to written and spoken scientific NLP corpora,” in Workshop on Mining Scientific Papers: Computational Linguistics and Bibliometrics, 15th International Society of Scientometrics and Informetrics Conference (ISSI 2015) (Istanbul).
Francopoulo, G., Mariani, J., and Paroubek, P. (2016a). “Predictive modeling: guessing the NLP terms of tomorrow,” in LREC 2016, Tenth International Conference on Language Resources and Evaluation Proceedings (Portorož).
Francopoulo, G., Mariani, J., and Paroubek, P. (2016b). “Linking Language Resources and NLP Papers, Workshop on Research Results Reproducibility and Resources Citation in Science and Technology of Language, LREC 2016,” in Tenth International Conference on Language Resources and Evaluation (Portorož).
Fu, Y., Xu, F., and Uszkoreit, H. (2010). “Determining the origin and structure of person names,” in Proceedings of LREC 2010 (Valletta), 3417–3422
Goh, C. L., and Lepage, Y. (2019). “Extraction of lexical bundles used in natural language processing articles,” in 2019 International Conference on Advanced Computer Science and information Systems (ICACSIS) (Bali), (223–228).
Jurafsky, D. (2016). “Ketchup, interdisciplinarity, and the spread of innovation in speech and language processing,” in Proc. Interspeech (San Francisco, CA), 8–12.
Mariani, J., Cieri, C., Francopoulo, G., Paroubek, P., and Delaborde, M. (2014). “Facing the identification problem in language-related scientific data analysis,” in Proceedings of LREC 2014 (Reykjavik, Iceland), 26–31.
Mariani, J., Francopoulo, G., and Paroubek, P. (2016). “A study of reuse and plagiarism in speech and natural language processing papers,” in Joint Workshop on Bibliometric-enhanced Information Retrieval and Natural Language Processing for Digital Libraries (BIRNDL 2016). 4th Bibliometric-Enhanced Information Retrieval (BIR) and 2nd Workshop on Text and Citation Analysis for Scholarly Digital Libraries (NLPIR4DL), Joint Conference on Digital Libraries (JCDL '16), 23 June 2016 (Newark).
Mariani, J., Francopoulo, G., and Paroubek, P. (2018a). Reuse and plagiarism in speech and natural language processing publications. Int. J. Digital Libr. 18, 1–14. doi: 10.1007/s00799-017-0211-0
Mariani, J., Francopoulo, G., and Paroubek, P. (2018b). “Measuring innovation in speech and language processing publications,” in LREC 2018, (Miyazaki, Japan), 9–11.
Mariani, J., Francopoulo, G., and Paroubek, P. (2019a). “The NLP4NLP Corpus (I): 50 years of publication, collaboration and citation in speech and language processing, Frontiers in Research Metrics and Analytics, Vol. 3,” in Mining Scientific Papers: NLP-enhanced Bibliometrics, eds I. Atanassova, M. Bertin and P. Mayr. doi: 10.3389/frma.2018.00036
Mariani, J., Francopoulo, G., Paroubek, P., and Vernier, F. (2019b). “The NLP4NLP Corpus (II): 50 years of research in speech and language processing, Frontiers in Research Metrics and Analytics, Vol. 3,” in Mining Scientific Papers: NLP-enhanced Bibliometrics, eds I. Atanassova, M. Bertin and P. Mayr. doi: 10.3389/frma.2018.00037
Mohammad, S. M. (2020a). “Nlp scholar: a dataset for examining the state of nlp research,” in Proceedings of the 12th Language Resources and Evaluation Conference. (Marseille), (p. 868–877).
Mohammad, S. M. (2020b). Nlp scholar: an interactive visual explorer for natural language processing literature. arXiv[Preprint].arXiv:2006.01131. doi: 10.48550/arXiv.2006.01131
Mohammad, S. M. (2020c). Examining citations of natural language processing literature. arXiv[Preprint].arXiv:2005.00912. doi: 10.48550/arXiv.2005.00912
Monogarova, A., Shiryaeva, T., and Arupova, N. (2021). The language of russian fake stories: a corpus-based study of the topical change in the viral disinformation. J. Lang. Educ. 7, 83–106. doi: 10.17323/jle.2021.11371
Muñoz-Céspedes, E., Ibar-Alonso, R., and de Ros Lorenzo, S. (2021). Financial literacy and sustainable consumer behavior. Sustainability 13, 9145. doi: 10.3390/su13169145
Perin, C., Boy, J., and Vernier, F. (2016). “GapChart: a gap strategy to visualize the temporal evolution of both ranks and scores,” in IEEE Computer Graphics and Applications. 36, 38–49. doi: 10.1109/MCG.2016.100
Sharma, A., Chhablani, G., Pandey, H., and Patil, R. (2021). DRIFT: a toolkit for diachronic analysis of scientific literature. arXiv[Preprint].arXiv:2107.01198. doi: 10.48550/arXiv.2107.01198
Vogel, A., and Jurafsky, D. (2012). “He said, she said: gender in the ACL anthology,” in Proceedings of the ACL-2012 Special Workshop on Rediscovering 50 Years of Discoveries (ACL'12) (Stroudsburg, PA: Association for Computational Linguistics), 33–41.
Wang, S., Zhang, C., and Palmer, A. (2020). “Guest editorial,” Special issue “Information Discovery with Machine Intelligence for Language.” Inf Discov Deliv. 48, 113–6. doi: 10.1108/IDD-08-2020-090
Witten, I. H., Eibe, F., and Hall, M. A. (2011). Data Mining: Practical Machine Learning Tools and Techniques. Third Edition. Burlington: Morgan Kaufmann.
Yamaguchi, K., Sakamoto, K., Akabane, T., and Fujimoto, Y. (1989). “A neural network for speaker-independent isolated word recognition,” in First International Conference on Spoken Language Processing (ICSLP 90), (Kobe).
Appendix
Appendix 1: Acknowledgments
The authors wish to thank the ACL colleagues, Ken Church, Sanjeev Khudanpur, Amjbad Abu Jbara, Dragomir Radev, and Simone Teufel, who helped them in the starting phase, Isabel Trancoso, who gave her ISCA Archive analysis on the use of assessment and corpora, Wolfgang Hess, who produced and provided a 14 GBytes ISCA Archive, Emmanuelle Foxonet who provided a list of authors' given names with the genre, Florian Boudin, who made available the TALN Anthology, Helen van der Stelt and Jolanda Voogd (Springer) who provided the LRE data and Douglas O'Shaughnessy, Denise Hurley, Rebecca Wollman, Casey Schwartz, Dilek Hakkani-Tür, Kathy Jackson, William Colacchio and Shirley Wisk (IEEE) who provided the IEEE ICASSP and TASLP data. They also thank Khalid Choukri, Alexandre Sicard, Nicoletta Calzolari, Riccardo del Gratta, Sara Goggi, and Gabriella Pardelli who provided information about the past LREC conferences and the LRE Map, Victoria Arranz, Ioanna Giannopoulou, Johann Gorlier, Jérémy Leixa, Valérie Mapelli, and Hélène Mazo, who helped in recovering the metadata for LREC 1998, Nancy Ide and Christopher Cieri for their advice and all the editors, organizers, reviewers and authors over those 55 years without whom this analysis could not have been conducted!
Appendix 2: Apologies
This survey has been made on textual data, which covers a 55-year period, including scanned content. The analysis uses tools that automatically process the content of the scientific papers and may make errors. Therefore, the results should be regarded as reflecting a large margin of error. The authors wish to apologize for any errors the reader may detect, and they will gladly rectify any such errors in future releases of the survey results.
Appendix 3: Relationship With Other Papers and Reuse of Previous Material
The present paper is the follow up of a series of two papers:
• Mariani et al. (2019a). The NLP4NLP Corpus (I): 50 Years of Publication, Collaboration, and Citation in Speech and Language Processing
• Mariani et al. (2019b). The NLP4NLP Corpus (II): 50 Years of Research in Speech and Language Processing,
which appeared in the same special issue on “Mining Scientific Papers: NLP-enhanced Bibliometrics” of the Frontiers in Research Metrics and Analytics journal, edited by Iana Atanassova, Marc Bertin, and Philipp Mayr.
Appendix 4: Collaboration and Citation Graphs Terminology
Definitions of a collaboration graph as a model of social network and on the various structures and measures (nodes, edges, connected component, giant component, cliques, collaboration distance, collaboration path, diameter, degree of a node, clustering coefficient, density, etc.) are given in Mariani et al. (2018a). We assessed the position of each author in the Collaboration Graph according to various kinds of centrality: Closeness centrality, also called harmonic centrality (average closeness distance of an author with all other authors belonging to the same connected component), degree centrality (number of different co-authors of each author, i.e. the number of edges attached to the corresponding node), betweenness centrality [number of paths crossing a node, which reflects the importance of an author as a bridge across different sets of authors (or sub-communities)]. We also defined citing and cited papers and authors citation graphs and their structure and measures (strongly connected components, symmetric strongly connected components, citation distance, diameter, degree of a node, average clustering coefficient, density, etc.) (Mariani et al., 2018a). We studied the four Citing and Cited/Authors and Papers Graphs for each of the 34 sources, either internally to the source or in the context of the NLP4NLP+5 corpus, for the authors:
-the citation by the source authors of the source authors (“Internal Authors Citations”),
-the citation by the source authors of NLP4NLP+5 authors (“Outgoing Global Authors Citations”),
-the citation by NLP4NLP+5 authors of the source authors (“Ingoing Global Authors Citations”).
and for the papers:
-the citation in the source papers of the same source (“Internal Papers Citation”),
-the citation in the source papers of NLP4NLP+5 papers (“Outgoing Global Papers Citation”),
-the citation in NLP4NLP+5 papers of the source papers (“Ingoing Global Papers Citations”).
Appendix 5: “Copy and Paste” Terminology
As the terminology is fuzzy and contradictory among the scientific literature, we first defined four types of “copy & paste” (Table A1):
• “self-reuse” when the source of the copy has an author who belongs to the group of authors of the text of the paste and when the source is cited.
• “self-plagiarism” when the source of the copy has an author who belongs to the group of authors of the text of the paste, but when the source is not cited.
• “reuse” when the source of the copy has no author in the group of authors of the paste and when the source is cited.
• “plagiarism” when the source of the copy has no author in the group of the paste and when the source is not cited.
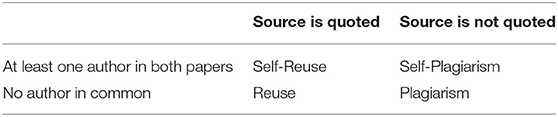
Table A1. Definition of terms.
Keywords: speech processing, natural language processing, artificial intelligence, neural networks, machine learning, research metrics, text mining
Citation: Mariani J, Francopoulo G, Paroubek P and Vernier F (2022) NLP4NLP+5: The Deep (R)evolution in Speech and Language Processing. Front. Res. Metr. Anal. 7:863126. doi: 10.3389/frma.2022.863126
Received: 26 January 2022; Accepted: 28 February 2022;
Published: 27 July 2022.
Edited by:
Iana Atanassova, Université Bourgogne Franche-Comté, FranceReviewed by:
Frederique Bordignon, École des ponts ParisTech (ENPC), FranceChengzhi Zhang, Nanjing University of Science and Technology, China
Copyright © 2022 Mariani, Francopoulo, Paroubek and Vernier. This is an open-access article distributed under the terms of the Creative Commons Attribution License (CC BY). The use, distribution or reproduction in other forums is permitted, provided the original author(s) and the copyright owner(s) are credited and that the original publication in this journal is cited, in accordance with accepted academic practice. No use, distribution or reproduction is permitted which does not comply with these terms.
*Correspondence: Joseph Mariani, Sm9zZXBoLk1hcmlhbmlAbGltc2kuZnI=