 Tjalling de Haas
 Wiebe Nijland
 Brian W. McArdell
 Maurice W. M. L. Kalthof1
- 1Department of Physical Geography, Utrecht University, Utrecht, Netherlands
- 2Swiss Federal Institute for Forest, Snow and Landscape Research WSL, Birmensdorf, Switzerland
High-quality digital surface models (DSMs) generated from structure-from-motion (SfM) based on imagery captured from unmanned aerial vehicles (UAVs), are increasingly used for topographic change detection. Classically, DSMs were generated for each survey individually and then compared to quantify topographic change, but recently it was shown that co-aligning the images of multiple surveys may enhance the accuracy of topographic change detection. Here, we use nine surveys over the Illgraben debris-flow torrent in the Swiss Alps to compare the accuracy of three approaches for UAV-SfM topographic change detection: 1) the classical approach where each survey is processed individually using ground control points (GCPs), 2) co-alignment of all surveys without GCPs, and 3) co-alignment of all surveys with GCPs. We demonstrate that compared to the classical approach co-alignment with GCPs leads to a minor and marginally significant increase in absolute accuracy. Moreover, compared to the classical approach co-alignment enhances the relative accuracy of topographic change detection by a factor 4 with GCPs and a factor 3 without GCPs, leading to xy and z offsets <0.1 m for both co-alignment approaches. We further show that co-alignment leads to particularly large improvements in the accuracy of poorly aligned surveys that have severe offsets when processed individually, by forcing them onto the more accurate common geometry set by the other surveys. Based on these results we advocate that co-alignment, preferably with GCPs to ensure a high absolute accuracy, should become common-practice in high-accuracy UAV-SfM topographic change detection studies for projects with sufficient stable areas.
Introduction
Unmanned aerial vehicles (UAVs) are increasingly used for topographic mapping (e.g., Anders et al., 2019). High-resolution Digital Surface Models (DSMs) can be created from UAV imagery with unprecedented accuracy and low costs from structure-from-motion (SfM) techniques (Westoby et al., 2012; Fonstad et al., 2013). UAV-SfM derived DSMs have therefore been extensively generated for research in a broad range of disciplines and environments (e.g., De Haas et al., 2014; Immerzeel et al., 2014; Lucieer et al., 2014; Smith et al., 2016).
Topographic change detection is a compelling approach for linking geomorphic processes and forcings to surface change (Cook, 2017). Effective change detection requires repeated surveys of an area of interest at the relevant geomorphic time scale, sufficient accuracy and precision to resolve changes of the relevant magnitude, and a consistent reference frame for accurate comparison (Cook, 2017). The recent advances in UAV-SfM techniques have made it possible to meet these criteria at relatively low cost and time demands, resulting in a surge of UAV-SfM based geomorphic change detection studies (e.g., Eltner et al., 2016; Anders et al., 2019). However, especially for topographic change detection it is of key importance that the differenced DSMs are both accurate and spatially consistent (Feurer and Vinatier, 2018).
To obtain high-quality DSMs from UAV-SfM, either very accurate camera locations (direct georeferencing; Turner et al., 2013; Hugenholtz et al., 2016; Zhang et al., 2019) or precisely located ground control points (GCPs) (indirect georeferencing; James and Robson, 2014; Carrivick et al., 2016), both at cm-scale precision, are needed to georeference the three-dimensional (3D) model and to optimize camera interior parameters and camera positions and orientations. In the absence of both very accurate camera locations and ground control points large errors and distortions may be present in generated 3D models (Carbonneau and Dietrich, 2017; James et al., 2017).
In the classical UAV-SfM topographic change detection approach, 3D models are made for each survey and then compared to quantify topographic change (e.g., Duró et al., 2018). Recently, however, Feurer and Vinatier (2018) demonstrated that processing aerial images from multiple surveys as a single block in the alignment phase of structure from motion (SfM) processing allows for computing coherent multi-temporal DSMs when using low accuracy GCPs—an approach referred to as co-alignment (Cook and Dietze, 2019) or time-SIFT (Feurer and Vinatier, 2018). Cook and Dietze (2019) showed that co-alignment of UAV-derived imagery without ground control results in a nearly identical distribution of measured changes compared to the classical approach using GCPs. They found that compared to a standard approach without ground control, co-alignment increases the relative accuracy level of change detection from several meters to 10–15 cm. A drawback of this approach, however, is that it results in high comparative (relative) accuracy between the surveys, but that external (absolute) accuracy is low inhibiting comparison with external data. The recent findings by Feurer and Vinatier (2018) and Cook and Dietze (2019) show that there is great potential in using co-alignment in producing higher-accuracy DSMs for topographic change detection. However, key questions that are left unanswered are: 1) do high-accuracy GCPs affect the accuracy of UAV-SfM based topographic change detection through co-alignment; and 2) how does co-alignment perform on datasets consisting of large numbers of surveys.
Here, we compare the absolute and relative accuracies of three approaches for UAV-SfM topographic change detection using nine surveys over the Illgraben debris-flow torrent in the Swiss Alps: 1) the classical approach where each survey is processed individually using GCPs, 2) co-alignment of all surveys without GCPs, and 3) co-alignment of all surveys with GCPs. We demonstrate that combining co-alignment with GCPs leads to the most accurate topographic change detection, outperforming the classical approach by a factor 4, and that co-alignment particularly improves the accuracy of poorly aligned surveys in the dataset. We therefore advocate that co-alignment should become common practice in future UAV-SfM topographic change detection studies. This approach can be easily applied and semi-automated in SfM software, such as Agisoft Metashape Pro (formerly Photoscan Pro) as demonstrated here, but also in most alternative SfM software packages.
Study Site
We study bed-elevation change as a result of debris-flow activity in the Illgraben torrent in the southwestern Swiss Alps. This study focusses on the lowest 950 m of the channel (Figure 1), which has an average gradient of ∼4°, an average width of ∼25 m, has steep banks and is incised into an alluvial fan. The alluvial fan surface on the west side of the channel is completely covered by forest. On the east side of the channel the lowest 450 m is covered by houses, roads, a football field, and some forest, while further upstream the banks are fully covered by forest.
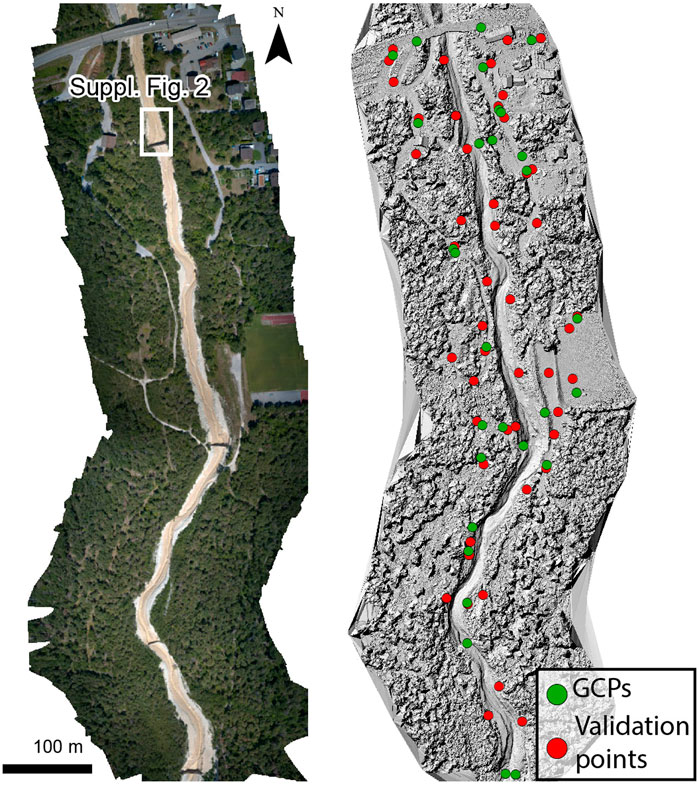
FIGURE 1. Orthophoto and hillshaded DSM of the study area, showing the locations of the GCPs and validation points. Imagery from survey 7 (30-07-2019). The center of the study area is located at 46°18'25.55"N and 7°38'2.97"E.
There is a long history of debris flows in the Illgraben torrent, with multiple debris flows and debris floods each year (McArdell et al., 2007; Berger et al., 2011; Bennett et al., 2014; De Haas et al., 2020). These debris flows are generally triggered by intense rainfall during summer storms between May and October, and originate from a catchment that extends from the top of the Illhorn mountain (elevation 2,716 m a.s.l.) to the Rhone River on the valley floor (610 m a.s.l.). The channel stretching from the Illhorn mountain to the Rhone River has a length of ∼6.5 km. On the lowest 4.8 km of the channel 29 check dams are present—this reach has an unconsolidated bed (Schürch et al., 2011; De Haas et al., 2020). For the last 2 km downstream the channel traverses a large alluvial fan. At the downstream end of the channel an automated observation station is operated by the Swiss Federal Institute for Forest, Snow and Landscape Research (WSL), which records a myriad of flow properties and collects imagery (McArdell et al., 2007; Schlunegger et al., 2009).
Methods
Data Acquisition
UAV imagery of the study reach was captured during nine surveys between November 8, 2018 and August 30, 2019, covering the activity of nine debris flows (Table 1). Between each survey one debris flow typically occurred, although for two surveys the cumulative effect of two debris flows which occurred within a day of each other was captured. The surveys were flown with a DJI Mavic 2 Pro using Litchi flight planning software. The Mavic 2 Pro is equipped with a 1” CMOS sensor collecting imagery with a size of 20 megapixels. Imagery was captured in two separate flights during each survey, at an altitude of 100 m above the ground surface resulting in a ground sampling distance of 2.5 cm. Flight planning was optimized over time and differed between surveys. In general, images were captured with a side overlap of 80% and a forward overlap of 70%. During some surveys nadir images were captured from both channel banks and the middle of the channel and images with a 25° off-nadir camera pitch over the middle of the channel looking in an upstream direction, while during other surveys nadir and 25° off-nadir images were captured over both the banks and channel (Table 1). Our survey follows a narrow channel, and therefore the along-channel overlap is limited to only three flight lines—this may have lowered the overall quality of our models compared to surveys with a larger numbers of overlapping flight lines in all directions. The number of aerial images in the surveys varied between 168 and 396 (Table 1). A total of 29 anthropogenic and natural terrain features were used as ground control points (GCPs), including manholes, road surface marks, cobbles and boulders (Figure 1). These GCPs were measured with a Leica network RTK GNSS system with ∼2 cm accuracy.
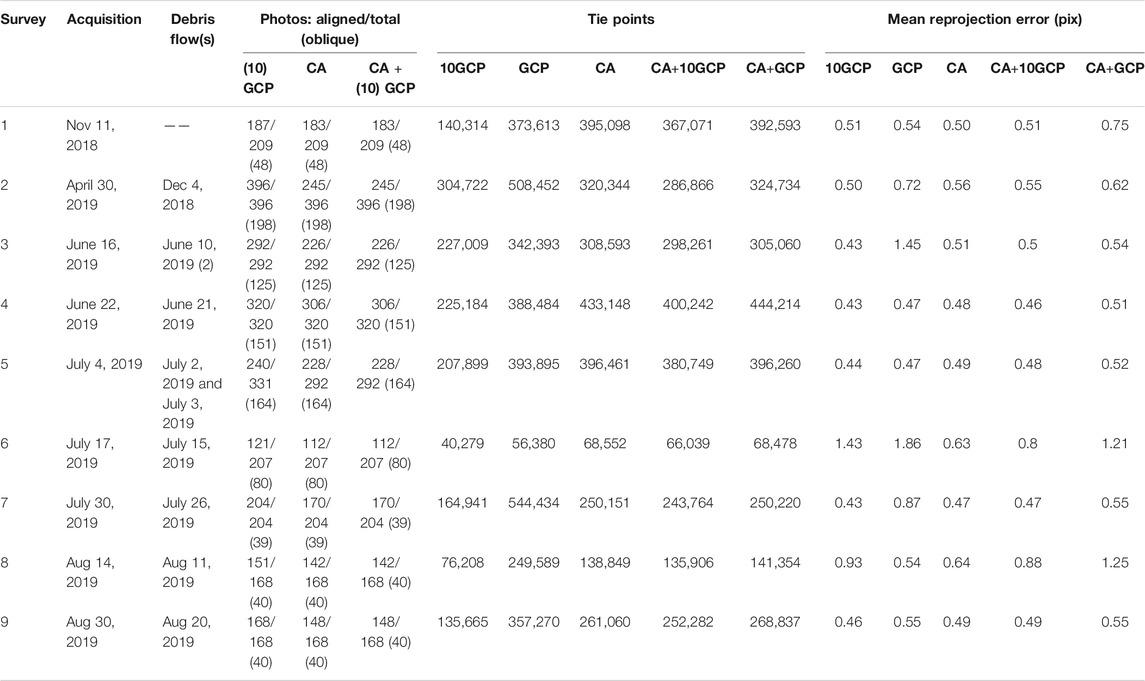
TABLE 1. Survey characteristics and dates of captured debris flows.
Data Processing
The SfM processing was performed using Agisoft Metashape Pro (v. 1.5.2). Our general procedure in Agisoft Metashape Pro was as follows. We set photo location accuracy to 10 m in the XY direction, and 100 m in the Z direction, while we used the GCP location accuracy as reported by the Leica network RTK GNSS system (1–5 cm). Photo alignment was performed at high-quality settings using 60,000 and 20,000 key and tie point limits, respectively. These numbers were chosen because they enabled more aggressive point cloud filtering without creating holes in our datasets compared to the default of 40,000 and 4,000 key and tie points, respectively, while at the same time limiting calculation time compared to calculating the maximum possible number of key and tie points. The alignment was typically optimized by removing 1) tie points present in less than three images, 2) with a reconstruction uncertainty larger than 50, 3) with a projection accuracy larger than 10, and 4) a reprojection error larger than 1. After each of these steps the alignment was optimized using adaptive camera model fitting. GCPs were included between filter steps 3 and 4. Dense clouds were generated at high quality and mild depth filtering. Orthophotos were generated using a smoothed mesh of the sparse point clouds, and exported with a ground sampling distance of 2.5 cm. Note that using the sparse point cloud to generate the orthophotos works for our study, where both GCPs and validation points are in stable, relatively flat, areas, but that for studies in rougher terrain it would be beneficial to generate orthophotos based on the dense point cloud. To filter erroneous points and overhanging vegetation from the dense point clouds we adopted the approach of De Haas et al. (2020) using LAStools (rapidlasso GmbH). The procedure removes low noise (i.e., noise below the actual ground surface) and filters overhanging vegetation, while retaining natural detail in the channel, and mostly avoids clipping at steep sections at the channel banks and check dams. Low noise points are typical for dense point clouds generated using UAV photogrammetry, and were filtered by removing points more than 0.1 m below a smoothed 20th height percentile surface with a step size of 0.5 m (cf. Isenburg, 2019). To remove overhanging vegetation ground points were classified using the lasground functionality in LAStools with “ultra fine” settings, after which all non-ground points were removed. Lasground uses the ATIN algorithm designed for lidar point clouds (Axelsson, 2000) which is found to be reliable for photogrammetric data as well (Serifoglu Yilmaz et al., 2018; Anders et al., 2019). This approach removes overhanging and sparse vegetation in the channel, but retains most of the fine details in the channel at the expense of including dense vegetation in geomorphologically inactive areas which were not of interest to our analysis. Finally, filtered points were rasterized into a DSM with a ground sampling distance of 5 cm using a TIN triangulation by LasTools.
We compared three workflows for generating DSMs and change detection (Figure 2): 1) the classical approach where each survey was individually processed using GCPs; 2) the co-alignment approach where the imagery from the nine surveys is processed together without GCPs (cf. Cook and Dietze, 2019); and 3) the co-alignment approach with GCPs. The co-alignment approach for processing UAV imagery for optimized change detection was first proposed by Cook and Dietze (2019) – we take the co-alignment approach a step further and apply it to nine surveys while also using GCPs. Following Cook and Dietze (2019) we imported the photographs from the nine surveys into a single chunk in Metashape Pro and performed the point detection and matching, initial bundle adjustment, and optimization steps on the combined set of photographs (Figure 2). Following the alignment and optimization steps, the photos from the different surveys were separated by creating nine duplicates of the original chunk and keeping only those photos from the relevant time step calculating dense clouds for each survey while preserving common position information and camera calibrations.
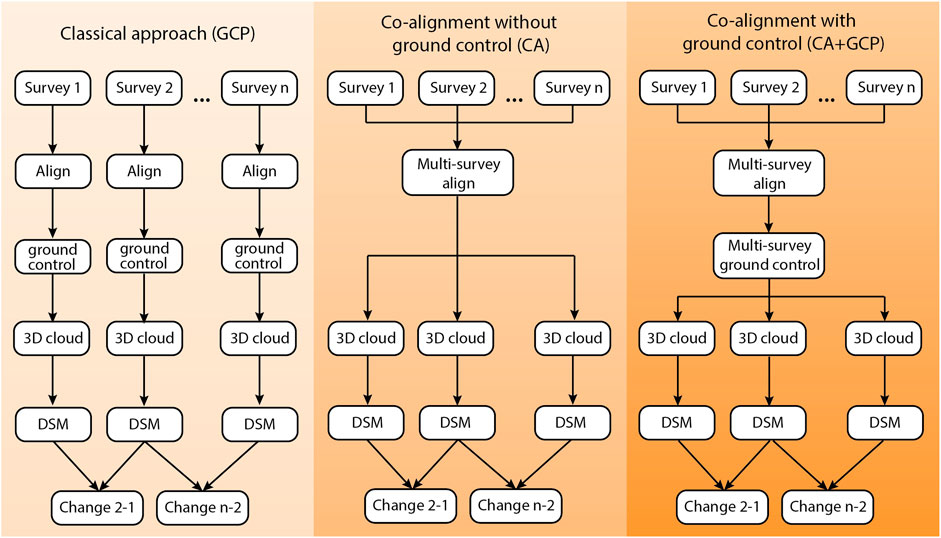
FIGURE 2. Generic workflows of the three tested approaches for UAV-SfM based topographic changes detection: (1) the classical approach where each survey is processed individually and ground control is applied (GCP); (2) co-alignment without ground control (CA); (3) co-alignment with ground control (CA+GCP).
Data Analysis
We employed two different approaches to assess 1) the absolute accuracy of the models and 2) the relative accuracy of the models (a measure for the accuracy of the change detection). To determine the absolute accuracy of the models we used 10 GCPs to build the models (Figure 1), and used the remaining GCPs as check points. The absolute accuracy was then determined by quantifying the offset between check points in the models and reality in xy and z directions. For this analysis the xy coordinates of the check points were identified on the orthophoto, while their elevation was extracted from the corresponding DSM.
To analyze the relative accuracy of change detection using the three approaches, we selected 48 validation points that consisted of anthropogenic and natural terrain features that were unchanged during the study period (Figure 1). These point were well-spread through our study area, and include terrain features comprising cobbles, boulders, manholes, and road surface marks. To quantify the accuracy of the models we then quantified the absolute offset, both in the xy and z directions, between these points on the DSMs of the nine time steps. This quantification was done by calculating the mean absolute offset in xy and z directions, relative to the mean location of the points in the nine surveys. We further evaluated offset as a function of the distance to the most nearby GCP, to assess if and how the accuracy of the change detection varies with distance from the most nearby GCP for the two approaches that include GCPs. We did not compare entire point cloud regions because the channel changed substantially between events, and the banks were largely covered by forest with an irregular surface not suitable for accurate matching of the point clouds of the different surveys.
This data analysis approach results in five scenarios: 1) 10GCP: individually processing of each time step using 10 GCPs; 2) GCP; individually processing of each time step using all GCPs; 3) CA; co-alignment of the nine surveys without using GCPs; 4) CA+10GCP; co-alignment of the nine surveys using 10 GCPs; 5) CA+GCP; co-alignment of the nine surveys using all GCPs.
Results
Agisoft Metashape Pro managed to co-align the nine surveys without problems, despite the substantial changes in the debris-flow torrent during the survey period (De Haas et al., 2020) and the large area of forest in our study area that partly changed in appearance between the autumn, spring, and summer flights. We did find that surveys 6 and 8 were relatively poorly aligned, both when processed individually and when co-aligned. These surveys had relatively large root mean square reprojection errors and a relatively low number of tie points (Table 1). The root mean square reprojection errors of surveys 6 and 8 are 1.2 and 0.8 pix, respectively, while the root mean square reprojection error of the other surveys is on average 0.6 pix. In addition, surveys 6 and 8 had ∼60,000 and 150,000 tie points, respectively, compared to an average of ∼320,000 tie points in the other surveys.
Absolute Accuracy
The absolute accuracy of the co-alignment approach without GCPs is very low, with a mean xy offset of 11 m and a mean z offset of 21 m (Figure 3A), which is the result of the low-accuracy global positioning system (GPS) onboard the DJI Mavic 2 Pro. In part these offsets may result from distortions such as doming, but the effect of such distortions on the total offset is likely minor compared to the offset resulting from the relatively large GPS error. The classical approach wherein surveys are processed individually using GCPs results in a mean xy offset of 0.17 m, while the co-alignment approach using GCPs results in a slightly lower mean xy offset of 0.15 m. This difference is only marginally significant (t-test, p = 0.09). In the z direction the mean offset is 0.08 m for the classical approach and 0.07 m for the co-alignment approach with GCPs (Figure 3B), which is a marginally significant difference (p = 0.06). There is thus only a small difference in absolute accuracy between the classical approach wherein surveys are processed individually and the co-alignment approach when a number of GCPs is used. However, the relative accuracy between these approaches does differ significantly when tested against a larger number of validation points with 1) a better spread, 2) inclusion of the forested area where image matching is more challenging, and 3) larger distances to the nearest GCP, compared to the GCPs used as check points here, as shown below.
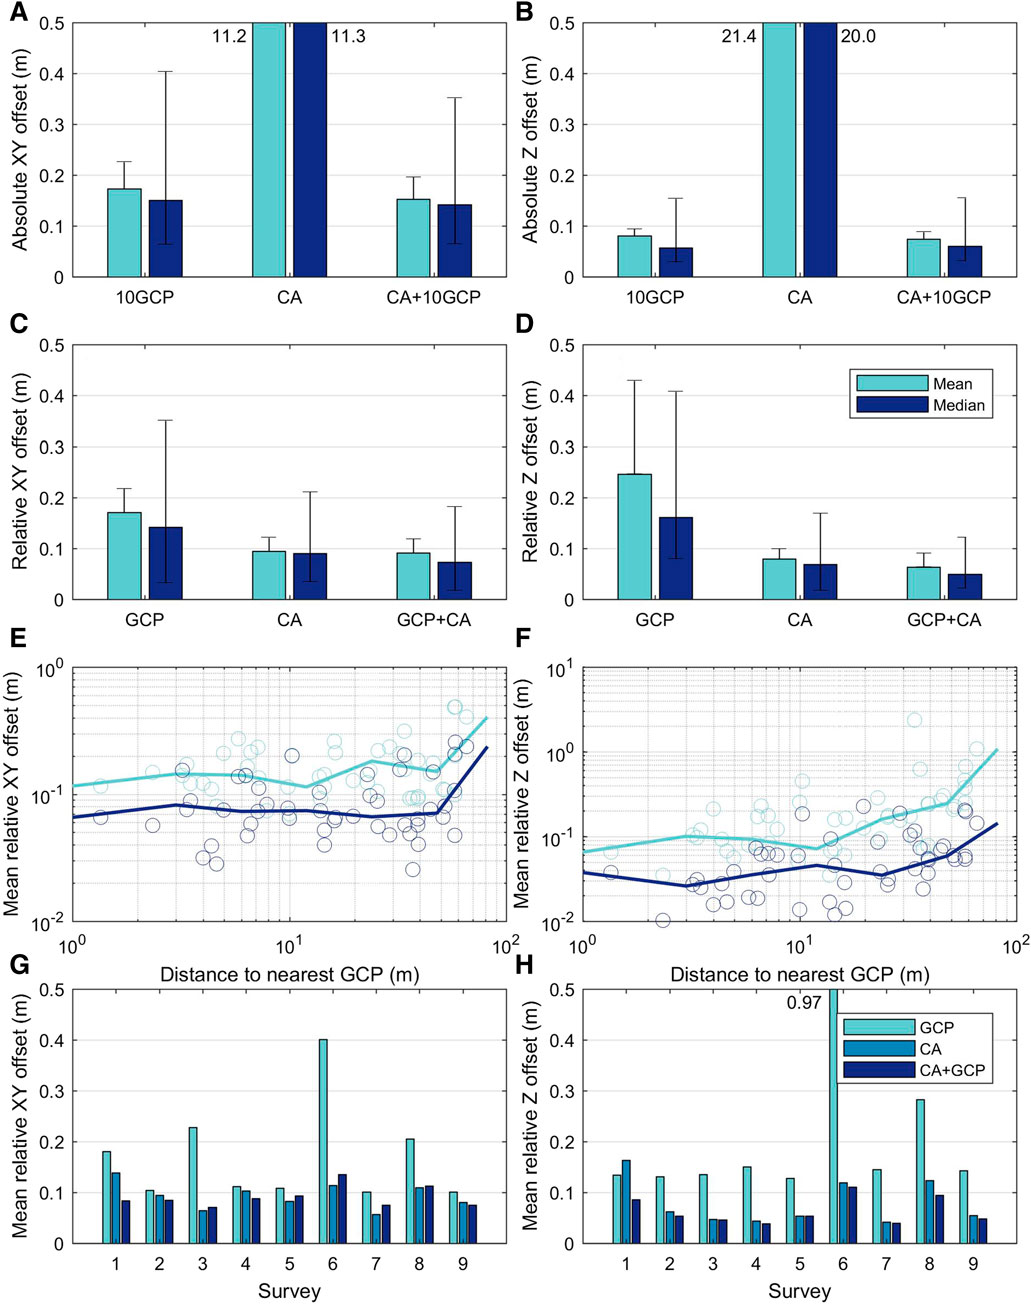
FIGURE 3. (A,B) Absolute mean and median accuracy in the (A) xy direction and (B) z direction for all surveys combined, processed with the classical approach where surveys are processed individually using 10 GCPs (10GCP), co-alignment without GCPs (CA) and co-alignment with 10 GCPs (CA+10GCP), showing the highest accuracy of the co-alignment including GCP and a very low absolute accuracy for co-alignment without GCPs. Error bars denote standard deviation for the mean and 25th and 75th percentile for the median (C,D) Mean and median offset in the (C) xy direction and (D) z direction for all surveys combined, processed with the classical approach where surveys are processed individually using GCPs (GCP), co-alignment without GCPs (CA) and co-alignment with GCPs (CA+GCP), showing a higher accuracy of the co-alignment approaches (E,F) Distance to the nearest GCP vs. the mean offsets in the xy and z directions, respectively, showing that the 3D model accuracy decreases with increasing distance to the nearest GCP. The fitted lines represent the moving average (G,H) Mean offset in the (G) xy direction and (H) z direction for the nine surveys analyzed here. The image shows that the co-alignment approaches lead to a lower offset in the xy and z directions compared to the classical approach, especially for the poorly aligned surveys 6 and 8.
Relative Accuracy
We assess the relative accuracy of the DSMs generated via the classical and co-alignment approaches with all available GCPs (scenarios GCP and CA+GCP), because using all available GCPs is the common practice in UAV-SfM topographic change detection studies, and co-alignment without GCPs (scenario CA). The classical approach wherein surveys are processed individually using GCPs results in the largest offset between the DSMs of the nine surveys in both the xy and z directions (Figures 3C,D). The mean offset between the surveys in the xy direction for the classical approach is 0.17 m and for both the co-alignment with and without GCPs the offset is 0.09 m. In the z direction the mean offset between the surveys is 0.25 m for the classical approach, while it is 0.08 m for the co-alignment without GCPs and 0.06 m for the co-alignment with GCPs. These differences are all significant in a t-test with p < 0.05. As such, co-aligning the surveys improves the xy offset by approximately a factor 2, while the improvement in the z direction approaches a factor 3 for co-alignment without GCPs and 4 for co-alignment with GCPs.
For both the classical approach and co-alignment with GCPs, the offset in the xy and z directions increases with distance from the nearest GCP (Figures 3E,F), in line with previous research (e.g., Kraus, 2011; Tonkin and Midgley, 2016). This trend is more pronounced for the z offset compared to the xy offset. The distance of the validation points to the nearest GCP was relatively small in our survey, ranging from a few m to almost 100 m, and we find that the offset most strongly increases when the distance to the nearest GCP exceeds 10 m, typically by a factor three moving from a distance of ∼10 m to ∼100 m.
If we break down the errors per survey, we see that surveys 6 and 8 have large offsets in both the xy and z directions for the models generated via the classical approach (Figures 3G,H). The xy offset of 0.4 m for survey 6 is approximately a factor 4 larger than the typical offset of ∼0.1 m. The z offset for survey 6 is even more dramatic with a value of 0.97 m compared to a typical value of 0.15 m for the models made via the classical approach. For survey 8 the offset in the xy and z directions exceeds the typical offset of the other surveys by approximately a factor 2. Interestingly, when applying the co-alignment approach, either with or without GCPs, the xy and z offsets of these surveys are strongly reduced. While the offsets of surveys 6 and 8 are still slightly larger than that of the other surveys in this case, it has dropped to an acceptable offset of 0.1 m in both the xy and z directions. This shows that co-alignment forces otherwise poorly aligned surveys onto the more accurate common geometry set by the other surveys, thereby strongly decreasing the offset between the surveys and increasing the accuracy of topographic change detection.
The low relative accuracy of the models of surveys 6 and 8 predominantly results from a low number and poor distribution of tie points. In particular, limited numbers of tie points were created on the forested channel banks for these surveys (possibly as a result of relatively strong winds), which caused the tie points to concentrate along the narrow channel bed and the inhabited areas in the north of our study area. This caused a weak model geometry, resulting in a low accuracy elevation model wherein the channel-bed elevation was largely underestimated while the channel bank elevation was mostly overestimated or vice versa. These deviations were commonly larger than a few meters. This is illustrated in Supplementary Figure S1, which shows how the classical approach locally led to a ∼2 m bias in the topographic change between surveys 6 and 7 over a part of the channel bed.
Discussion and Conclusion
Our results show that co-aligning multiple surveys through UAV-SfM leads to more accurate topographic change detection (relative accuracy) compared to the classical approach where each survey is processed individually, as previously found by Feurer and Vinatier (2018) and Cook and Dietze (2019). Co-alignment with GCPs leads to a marginally significant increase in absolute accuracy compared to the classical approach where each survey is processed individually using GCPs. Using GCPs in the co-alignment procedure does lead to a slightly increased topographic change detection accuracy compared to co-aligning without GCPs, but both approaches perform well with an offset in the xy and z directions below 0.1 m. Such accuracy is more than sufficient for most applications of change detection in a wide range of fields including geosciences, forestry, ecology, archaeology, mining and engineering (e.g., Lucieer et al., 2014; Torres-Sánchez et al., 2014; Braun et al., 2015; Lee and Choi, 2015; Qin et al., 2016; James et al., 2017; Duró et al., 2018; Hemmelder et al., 2018). Co-alignment allows for more reliable change detection because during the reconstruction all images (from all surveys) are optimized within the same adjustment, using homologous image points covering several surveys and therefore resulting in a joint camera geometry. Potential systematic errors are therefore spatially consistent, and as a result do not influence comparisons between the 3D models of the surveys, such that their comparative accuracy is much higher and topographic change detection is more accurate. The increase in relative accuracy is the result of the generation of common tie points between multiple surveys, which impose a joint geometry (Cook and Dietze, 2019). Our results show that especially when multiple surveys are co-aligned, this forces poorly aligned surveys, which retain this poor quality even after adding a large number of GCPs, onto the more accurate common geometry set by the other surveys (Figures 3G,H). This strongly improves the accuracy of topographic change detection for those surveys that are poorly aligned using the classical approach.
A key limitation of the co-alignment approach is that sufficient common tie points may not be generated when an area changes too much in appearance between surveys or when there have been too much changes in the area of interest (Cook and Dietze, 2019). Yet, for our study area co-alignment was successful, despite that substantial changes occurred in the torrent bed (De Haas et al., 2020), and changes in appearance from autumn to summer in the forest that covers the largest part of our study area.
While Cook and Dietze (2019) suggested that co-alignment without GCPs can be used for change detection with a level of detection comparable to that of a survey grade GCP-constrained pair of models, for our dataset combining nine surveys, co-alignment without GCPs outperforms the classical approach where surveys are processed individually with GCPs. This can be attributed to our finding that the co-alignment procedure forces surveys with poor alignment into a common geometric framework, strongly limiting their offset from the other surveys. Still, as pointed out by Cook and Dietze (2019) one has to bear in mind that 3D models created through co-alignment in the absence of GCPs may still contain absolute errors and distortions such as doming (James and Robson, 2014; Carbonneau and Dietrich, 2017). Moreover, the absolute location of models created in the absence of GCPs typically has a low accuracy—here we find an absolute xy offset of ∼10 m and z offset of ∼20 m - inhibiting comparison with external sources such as lidar topography (e.g., Neugirg et al., 2016; Izumida et al., 2017).
In short, given the higher accuracy of topographic change detection obtained by co-alignment approaches, especially when combined with GCPs, compared to the classical approach where surveys are processed individually with GCPs, we advocate that co-alignment should become common practice in UAV-SfM based topographic change detection when sufficient stable areas are available. The co-alignment approach was found to enhance the accuracy of topographic change detection by a factor 3-4 in the z direction and a factor 2 in the xy direction. A particularly large advantage of co-alignment is that it forces poor quality (parts of) surveys to the more robust common geometry set by the other surveys, which strongly increases the comparability of the surveys and the accuracy of topographic change detection. The co-alignment approach can be applied and be semi-automated in most SfM software packages, such that there should be no technical limitations in applying co-alignment instead of the classical approach processing each survey separately providing sufficient processing power.
Although this work and that presented by Feurer and Vinatier (2018) and Cook and Dietze (2019), shows that there is great potential in using co-alignment or time-SIFT for creating DSMs from aerial imagery, so far this method has only been tested on a limited number of sites and under a limited range of conditions. Future research is thus needed to identify the full potential and limitations of this approach. To identify this, we need studies assessing the performance of co-alignment in a wide range of environments, for example systematically exploring the effects of different sensors, flight plans, image tilt, number and distribution of GCPs, and different survey combinations.
Data Availability Statement
The raw data supporting the conclusions of this article will be made available by the authors, without undue reservation.
Author Contributions
This manuscript was written by TH with help from all co-authors. The study was designed by TH and WN. Data collection was performed by TH, WN, and BM. Data analysis was performed by MK, TH, and WN. Funding was obtained by TH.
Funding
This work was funded by the Netherlands Organization for Scientific Research (NWO) (Grant No. 016.Veni.192.001 to TdH).
Conflict of Interest
The authors declare that the research was conducted in the absence of any commercial or financial relationships that could be construed as a potential conflict of interest.
Acknowledgments
We gratefully acknowledge field assistance from Steven de Jong, Sjoukje de Lange and Lonneke Roelofs.
Supplementary Material
The Supplementary Material for this article can be found online at: https://www.frontiersin.org/articles/10.3389/frsen.2021.626810/full#supplementary-material.
References
Anders, N., Valente, J., Masselink, R., and Keesstra, S. (2019). Comparing filtering techniques for removing vegetation from UAV-based photogrammetric point clouds. Drones 3 (3), 61. doi:10.3390/drones3030061
Axelsson, P. (2000). DEM generation from laser scanner data using adaptive TIN models. Int. Arch. Photogramm. Remote Sens. 33 (4), 110–117.
Bennett, G. L., Molnar, P., McArdell, B. W., and Burlando, P. (2014). A probabilistic sediment cascade model of sediment transfer in the Illgraben. Water Resour. Res. 50, 1225–1244. doi:10.1002/2013wr013806
Berger, C., McArdell, B. W., and Schlunegger, F. (2011). Sediment transfer patterns at the Illgraben catchment, Switzerland: implications for the time scales of debris flow activities. Geomorphology 125, 421–432. doi:10.1016/j.geomorph.2010.10.019
Braun, A., Tuttas, S., Borrmann, A., and Stilla, U. (2015). “Automated progress monitoring based on photogrammetric point clouds and precedence relationship graphs,” in Proceedings of the 32nd international symposium on automation and robotics in construction (ISARC), Oulu, Finland, 1–7.
Carbonneau, P. E., and Dietrich, J. T. (2017). Cost-effective non-metric photogrammetry from consumer-grade sUAS: implications for direct georeferencing of structure from motion photogrammetry. Earth Surf. Process. Landforms 42, 473–486. doi:10.1002/esp.4012
Carrivick, J. L., Smith, M. W., and Quincey, D. J. (2016). Structure from motion in the geosciences. Chichester, United Kingdom: John Wiley & Sons.
Cook, K. L. (2017). An evaluation of the effectiveness of low-cost UAVs and structure from motion for geomorphic change detection. Geomorphology 278, 195–208. doi:10.1016/j.geomorph.2016.11.009
Cook, K. L., and Dietze, M. (2019). Short Communication: a simple workflow for robust low-cost UAV-derived change detection without ground control points. Earth Surf. Dyn. 7, 1009–1017. doi:10.5194/esurf-7-1009-2019
De Haas, T., Ventra, D., Carbonneau, P. E., and Kleinhans, M. G. (2014). Debris-flow dominance of alluvial fans masked by runoff reworking and weathering. Geomorphology 217, 165–181. doi:10.1016/j.geomorph.2014.04.028
De Haas, T., Nijland, W., De Jong, S. M., and McArdell, B. W. (2020). How memory effects, check dams, and channel geometry control erosion and deposition by debris flows. Sci. Rep. 10 (1), 14024. doi:10.1038/s41598-020-71016-8
Duró, G., Crosato, A., Kleinhans, M. G., and Uijttewaal, W. S. J. (2018). Bank erosion processes measured with UAV-SfM along complex banklines of a straight mid-sized river reach. Earth Surf. Dyn. 6, 933–953. doi:10.5194/esurf-6-933-2018
Eltner, A., Kaiser, A., Castillo, C., Rock, G., Neugirg, F., and Abellán, A. (2016). Image-based surface reconstruction in geomorphometry–merits, limits and developments. Earth Surf. Dynam. 4 (2), 359–389.
Feurer, D., and Vinatier, F. (2018). Joining multi-epoch archival aerial images in a single SfM block allows 3-D change detection with almost exclusively image information. ISPRS J. Photogramm. Remote Sens. 146, 495–506. doi:10.1016/j.isprsjprs.2018.10.016
Fonstad, M. A., Dietrich, J. T., Courville, B. C., Jensen, J. L., and Carbonneau, P. E. (2013). Topographic structure from motion: a new development in photogrammetric measurement. Earth Surf. Process. Landforms 38, 421–430. doi:10.1002/esp.3366
Hemmelder, S., Marra, W., Markies, H., and De Jong, S. M. (2018). Monitoring river morphology & bank erosion using UAV imagery—a case study of the river Buëch, Hautes-Alpes, France. Int. J. Appl. Earth Obs. Geoinf. 73, 428–437. doi:10.1016/j.jag.2018.07.016
Hugenholtz, C., Brown, O., Walker, J., Barchyn, T., Nesbit, P., Kucharczyk, M., et al. (2016). Spatial accuracy of UAV-derived orthoimagery and topography: comparing photogrammetric models processed with direct geo-referencing and ground control points. Geomatica 70, 21–30. doi:10.5623/cig2016-102
Immerzeel, W. W., Kraaijenbrink, P. D. A., Shea, J. M., Shrestha, A. B., Pellicciotti, F., Bierkens, M. F. P., et al. (2014). High-resolution monitoring of Himalayan glacier dynamics using unmanned aerial vehicles. Remote Sens. Environ. 150, 93–103. doi:10.1016/j.rse.2014.04.025
Isenburg, M. (2019). Digital pothole removal: clean road surface from noisy Pix4D point cloud. rapidlasso blog. Available at: https://rapidlasso.com/2019/01/02/digital-pothole-removal-clean-road-surface-from-noisy-pix4d-point-cloud/(Accessed December 10, 2020).
Izumida, A., Uchiyama, S., and Sugai, T. (2017). Application of UAV-SfM photogrammetry and aerial lidar to a disastrous flood: repeated topographic measurement of a newly formed crevasse splay of the Kinu River, central Japan. Nat. Hazards Earth Syst. Sci. 17, 1505–1519. doi:10.5194/nhess-17-1505-2017
James, M. R., and Robson, S. (2014). Mitigating systematic error in topographic models derived from UAV and ground-based image networks. Earth Surf. Process. Landforms 39, 1413–1420. doi:10.1002/esp.3609
James, M. R., Robson, S., and Smith, M. W. (2017). 3-D uncertainty-based topographic change detection with structure-from-motion photogrammetry: precision maps for ground control and directly georeferenced surveys. Earth Surf. Process. Landforms 42, 1769–1788. doi:10.1002/esp.4125
Kraus, K. (2011). Photogrammetry: geometry from images and laser scans. Berlin, Germany: Walter de Gruyter.
Lee, S., and Choi, Y. (2015). Topographic survey at small-scale open-pit mines using a popular rotary-wing unmanned aerial vehicle (Drone), J. Korean Soc. Rock Mech. 25, 462–469. doi:10.7474/tus.2015.25.5.462
Lucieer, A., Jong, S. M. D., and Turner, D. (2014). Mapping landslide displacements using Structure from Motion (SfM) and image correlation of multi-temporal UAV photography. Prog. Phys. Geogr. Earth Environ. 38, 97–116. doi:10.1177/0309133313515293
McArdell, B. W., Bartelt, P., and Kowalski, J. (2007). Field observations of basal forces and fluid pore pressure in a debris flow. Geophys. Res. Lett. 34, L07406. doi:10.1029/2006gl029183
Neugirg, F., Stark, M., Kaiser, A., Vlacilova, M., Della Seta, M., Vergari, F., et al. (2016). Erosion processes in calanchi in the Upper Orcia Valley, Southern Tuscany, Italy based on multitemporal high-resolution terrestrial LiDAR and UAV surveys. Geomorphology 269, 8–22. doi:10.1016/j.geomorph.2016.06.027
Qin, R., Tian, J., and Reinartz, P. (2016). 3D change detection—approaches and applications. ISPRS J. Photogramm. Remote Sens. 122, 41–56. doi:10.1016/j.isprsjprs.2016.09.013
Schlunegger, F., Badoux, A., McArdell, B. W., Gwerder, C., Schnydrig, D., Rieke-Zapp, D., et al. (2009). Limits of sediment transfer in an alpine debris-flow catchment, Illgraben, Switzerland. Quat. Sci. Rev. 28, 1097–1105. doi:10.1016/j.quascirev.2008.10.025
Schürch, P., Densmore, A. L., Rosser, N. J., and McArdell, B. W. (2011). Dynamic controls on erosion and deposition on debris-flow fans. Geology 39, 827–830. doi:10.1130/g32103.1
Serifoglu Yilmaz, C., Yilmaz, V., and Güngör, O. (2018). Investigating the performances of commercial and non-commercial software for ground filtering of UAV-based point clouds. Int. J. Remote Sens. 39, 5016–5042. doi:10.1080/01431161.2017.1420942
Smith, M. W., Carrivick, J. L., and Quincey, D. J. (2016). Structure from motion photogrammetry in physical geography. Prog. Phys. Geogr. Earth Environ. 40, 247–275. doi:10.1177/0309133315615805
Tonkin, T. N., and Midgley, N. G. (2016). Ground-control networks for image based surface reconstruction: an investigation of optimum survey designs using UAV derived imagery and structure-from-motion photogrammetry. Remote Sens. 8, 786. doi:10.3390/rs8090786
Torres-Sánchez, J., Peña, J. M., de Castro, A. I., and López-Granados, F. (2014). Multi-temporal mapping of the vegetation fraction in early-season wheat fields using images from UAV. Comput. Electron. Agric. 103, 104–113. doi:10.1016/j.compag.2014.02.009
Turner, D., Lucieer, A., and Wallace, L. (2013). Direct georeferencing of ultrahigh-resolution UAV imagery. IEEE T. Geosci. Remote 52, 2738–2745. doi:10.1109/TGRS.2013.2265295
Westoby, M. J., Brasington, J., Glasser, N. F., Hambrey, M. J., and Reynolds, J. M. (2012). “Structure-from-Motion” photogrammetry: a low-cost, effective tool for geoscience applications. Geomorphology 179, 300–314. doi:10.1016/j.geomorph.2012.08.021
Zhang, H., Aldana-Jague, E., Clapuyt, F., Wilken, F., Vanacker, V., and Van Oost, K. (2019). Evaluating the potential of post-processing kinematic (PPK) georeferencing for UAV-based structure- from-motion (SfM) photogrammetry and surface change detection. Earth Surf. Dyn. 7, 807–827. doi:10.5194/esurf-7-807-2019
Keywords: UAV, drone, structure-from-motion, photogrammetry, co-alignment, time-SIFT, debris flow, Illgraben
Citation: de Haas T, Nijland W, McArdell BW and Kalthof MWML (2021) Case Report: Optimization of Topographic Change Detection With UAV Structure-From-Motion Photogrammetry Through Survey Co-Alignment. Front. Remote Sens. 2:626810. doi: 10.3389/frsen.2021.626810
Received: 06 November 2020; Accepted: 11 January 2021;
Published: 24 February 2021.
Edited by:
Eija Maarit Honkavaara, Finnish Geospatial Research Institute, FinlandReviewed by:
Anette Eltner, Technische Universität Dresden, GermanyDarren Turner, University of Tasmania, Australia
Copyright © 2021 de Haas, Nijland, McArdell and Kalthof. This is an open-access article distributed under the terms of the Creative Commons Attribution License (CC BY). The use, distribution or reproduction in other forums is permitted, provided the original author(s) and the copyright owner(s) are credited and that the original publication in this journal is cited, in accordance with accepted academic practice. No use, distribution or reproduction is permitted which does not comply with these terms.
*Correspondence: Tjalling de Haas, dC5kZWhhYXNAdXUubmw=