Morphometric Analysis on Vanniyar Basin in Dharmapuri, Southern India, Using Geo-Spatial Techniques
- 1Department of Civil Engineering, Sona College of Technology, Salem, India
- 2Department of Civil Engineering, Gnanamani College of Technology, Namakkal, India
The Vanniyar basin is located in Dharmapuri district, South India, and is severely affected by climate change. Due to changing climatic conditions and resulting poor precipitation characteristics, this district has received less rainfall over the last three decades (Dharmapuri District Statistical Hand book 2020). The objective of this investigative study is to utilize morphometric techniques and analyze their properties using GIS and image processing techniques. The linear, aerial, and relief morphometric aspects of the Vanniyar basin are analyzed. From the preliminary investigation, the study area occupies the Archean group of rocks. The drainage pattern of the Vanniyar basin is sub-dendritic to dendritic and classified into fifth-order drainage basins. The mean drainage density of the Vanniyar basin is 1.95 km/km2, which indicates that the basin has very permeable soil with intermediate drainage and low to moderate relief. The circularity ratio value reveals that the basin is circular with high to moderate relief and a structurally controlled drainage system. The elongation ratio value reveals that the basin is characterized by high susceptibility to erosion and sediment load. The stream length ratio between the streams of different orders of the Vanniyar basin shows a change in each sub-basin, indicating late youth stage of geomorphic development. From these research studies, farmers in the Vanniyar basin, river Cauvery may now comprehend their drainage basin’s geohydrological characteristics.
1 Introduction
Morphometry is the science of measuring and analyzing the arrangement of the earth’s surface, as well as the shape and size of its landforms (Clarke, 1966). The geology, structural components, geomorphology, vegetation, and soils of the area influence the drainage networks and flowing pattern of a river, which are complex in character and change over time and place (Rekha et al., 2011).
The conventional method of morphometric characteristics are revealed by Horton (1932), Horton (1945), Strahler (1964), Strahler (1957), Muller (1968), Shreve (1969), Evans (1972), Evans (1984), Chorley et al. (1984); Merritts and Vincent (1989); Ohmori (1993); Cox (1994); Oguchi (1997); Burrough and McDonnell (1998), Hurtrez et al. (1999), Srinivasa Vittala et al. (2004) and digital methods of morphometrics are studied by Krishnamurthy et al. (1996), Agarwal (1998), Biswas et al. (1999). Satellite images on Earth’s surfaces are analyzed by Agarwal (1998), Obi Reddy et al. (2002).
The morphometric analysis is performed successfully through the measurement of linear, aerial, relief, gradient of channel network, and contributing ground slope of the basin (Nantiyal, 1940; Nag and Chakraborty, 2003; Magesh et al., 2012; Qadir et al., 2021). The surface runoff and flow intensity of the drainage system can be estimated using the geomorphic features associated with morphometric parameters (Ozdemir and Bird 2009). The hydrologic and geomorphic processes occur within the watershed and morphometric characterization at the watershed scale reveals information regarding formation and development of land surface processes (Singh 1992; Singh 1995; Dar et al., 2013; Kanhaiya et al., 2018; Kanhaiya et al. 2019a; Kanhaiya et al. 2019b).
GIS-based evaluation using Shuttle Radar Topographic Mission (SRTM) and an Advanced Spaceborne Thermal Emission and Reflection Radiometer (ASTER) data have given a precise, fast, and an inexpensive way for analyzing hydrological systems (Smith and Sandwell 2003; Grohmann 2004; Kannan et al., 2018; Prakash et al., 2019). The processed DEM was used successfully for generating the stream network and other supporting layers (Sreedevi et al., 2005; Mesa 2006; Magesh et al., 2011).
Combination of the remote sensing satellite data and hydrological and spatial analysis in the GIS environment is made easy to identify and discriminate the drainage area (Pirasteh et al., 2010). The drainage delineation (Singh et al., 2018a; Singh et al., 2018b) shows better accuracy and clear demarcation of catchment ridgeline and more reliable flow path prediction in comparison with ASTER. The results qualify Indian DEM for using it operationally, which is equivalent and better than the other publicly available DEMs such as SRTM and ASTER DEM (Muralikrishnan et al., 2013).
Rai et al. (2017) observed that remote sensing satellite data are emerging as the most effective, time saving, and accurate technique for morphometric analysis of Kanhar River basin, India. Vipin Joseph Markose et al. (2014) studied the application of visual basic program ‘bearing, azimuth, and drainage (bAd) calculator,’ to morphometric analysis for Kali River basin, southwest coast of India. Using watershed as a basin unit in morphometric analysis is the most logical choice because all hydrological and geomorphic processes occur within the watershed have been proved Dikpal et al. (2017) by applying Amanikere watershed, Dakshina Pinakini basin, Karnataka, India. To establish morphometric parameters in Dudhnai river basin, a sub-basin of the river Brahmaputra, a combination strategy of employing topo sheet, remotely sensed digital elevation model, and morphometric ArcGIS toolbox was used (W. R. Singh et al., 2021). In this article, investigation was carried out to analyze the various morphological parameters to the Vanniyar basin, Tamil Nadu, South India, using the image processing technique.
1.1 Methodology
The Vanniyar basin comprises five sub-basins, namely, Yercaud, Pappireddipatti upper, Pappireddipatti lower, Morappur, and Harur. The drainage network of sub-basins has been delineated using remote sensing data- geocoded false color composite bands-2, 3, and 4 of IRS I C and I D (LISS III + PAN merged) on the 1:50,000 scale, and SOI topographical maps are used as a reference.
Using remote sensing techniques, a powerful tool in the recent years has emerged. Satellite remote sensing has the ability of obtaining a synoptic view of a large area at one time and very useful in analyzing the drainage morphometry. Hence, the present investigation has been undertaken. The satellite imageries of the study area were geometrically rectified with respect to the SoI. The drainage pattern was initially derived using SoI topographical maps and later updated using linearly stretched and edge-enhanced false color composite (FCC) of LISS III data. The sub-basin boundaries were also delineated from the SoI topographical maps. The digitized drainage map was then exported to the AutoCAD Map, transferred to GIS software, and transferred onto the base map of the study area prepared using SoI topographical maps, which have been used as a reference. GIS software such as ArcInfo (V 8.1.2) and Arc View (V 3.2.a) have been used for digitization and computational purpose and also for output generation. With the help of GIS software, the geological, geomorphological, soil, land use, slope, lineament, and drainage maps are prepared.
1.2 Aim and Objective of the Study
1. To extract and delineate drainage morphometric characteristics (linear, aerial, and relief) carried out from the topographical sheets.
2. To delineate drainage morphometric characteristics (linear, aerial, and relief) carried out from SoI topographical sheets.
3. To analyze the linear, aerial, and relief aspects of the study area.
4. To bring out the forms and processes of the study area.
The aim of the present study is to assess the morphometric characteristics of the Vanniyar basin using advanced remote sensing and GIS technology, and to compute basin morphometric characteristics for various parameters.
2 Study Area and Its Description
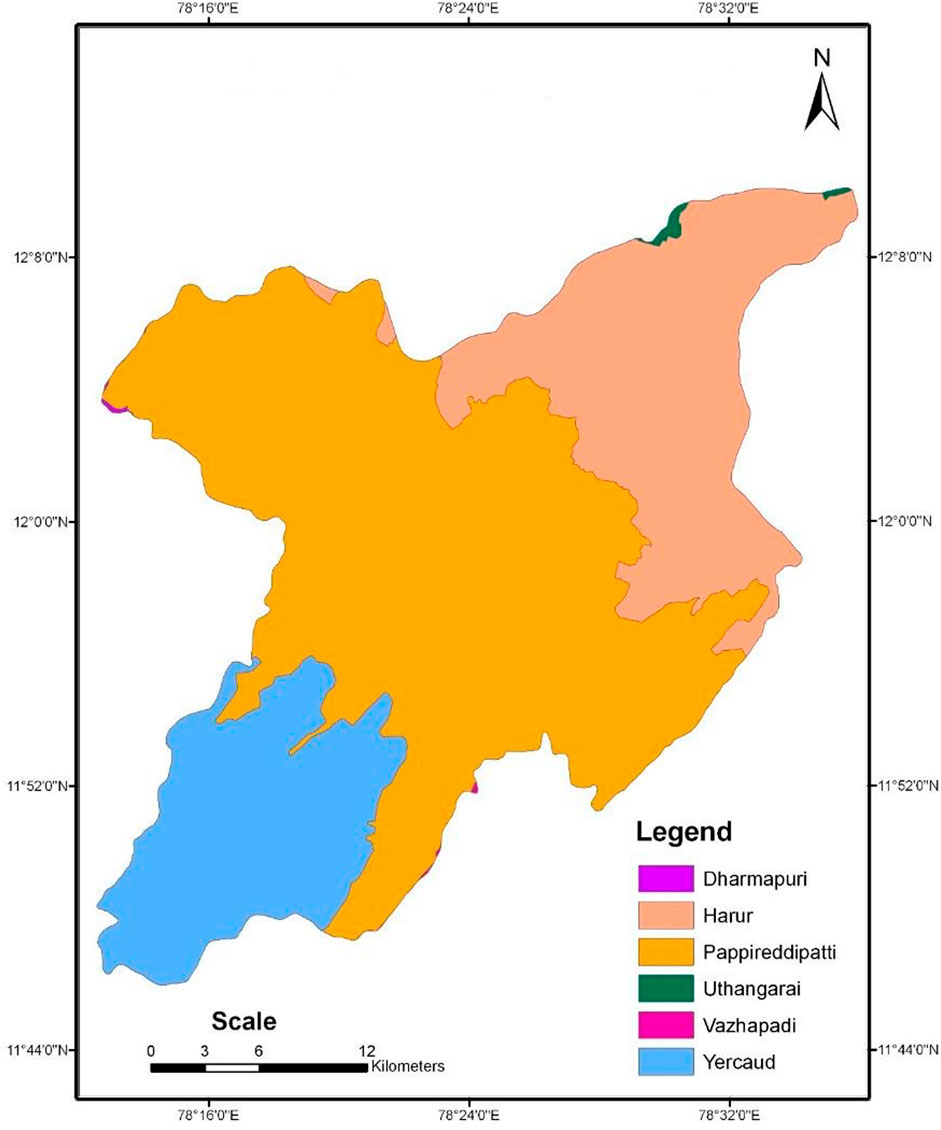
The study area, Vanniyar basin, Dharmapuri district, a western district of Tamil Nadu, South India, within latitudes 11° 47′ and 12° 33′ N and longitudes of 77° 02' and 78° 40' E. Vanniyar originates from the foothills of Shevaroy hills and passes through the northern direction of Dharmapuri district and meets the river Cauvery. The Vanniyar basin has an aerial extent of 1,066.31 km2. The Vanniyar basin consists of six taluks, namely, Dharmapuri, Harur, Pappireddipatti, Uthangarai, Vazhapadi, and Yercaud. Several isolated hillocks, such as Shevaroys, Chetteri, and Kalrayan are identified in the Vanniyar basin. The topography of the study area is generally plain, with an average elevation of 200 m above the mean sea level (MSL) in the south, and a maximum elevation of 1,600 m above the MSL in the northeast.
The study area experiences rainfall through the southwest monsoon and northeast monsoon with an average annual rainfall of 380 and 3,303 mm, respectively. A failure of the monsoon occurs once every 6 years, resulting under a severe drought condition. Vanniyar is characterized by a thick vegetation cover with a gentle undulating topography. With a limited available surface water resource, groundwater is a chief source for irrigation and drinking water. The rain collected in Vanniyar’s sub-basin passes through the river Cauvery and is obstructed by the Stanly multipurpose reservoir, Mettur, Salem, which is the source of irrigation for the delta district of Tamil Nadu, India. Metamorphic rock of Archean age is identified in the study area (Rajesh and Santosh, 2004). Figure 1 and Figure 2 shows the location and taluk of the Vanniyar basin, respectively.
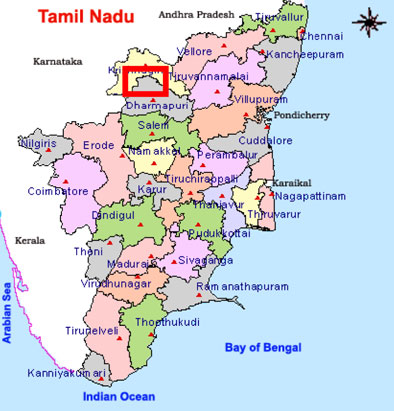
FIGURE 1. Location of the Vanniyar basin, Dharmapuri district, Tamil Nadu, India. Sources: Maps of India.
3 Geology
3.1 Geology of South India
A hypersthene gemstone from Shevaroy’s hill in Salem was identified by Holland (1900), later on, similar rocks were identified near Chennai, and a detailed survey on it was conducted. Yercaud hills are part of the Eastern Ghats, India and are believed to consist of an intermediate charnockite massif. However, Naidu (1963) believe that the Nilgiris and Shevaroy hills are not the charnockite massifs and recognize the following super groups in Tamil Nadu:
1. The super group khondalite–charnockite.
2. The Sathyamangalam super group (similar to Bargur).
3. The Bargur super group (comparable to Dharwar).
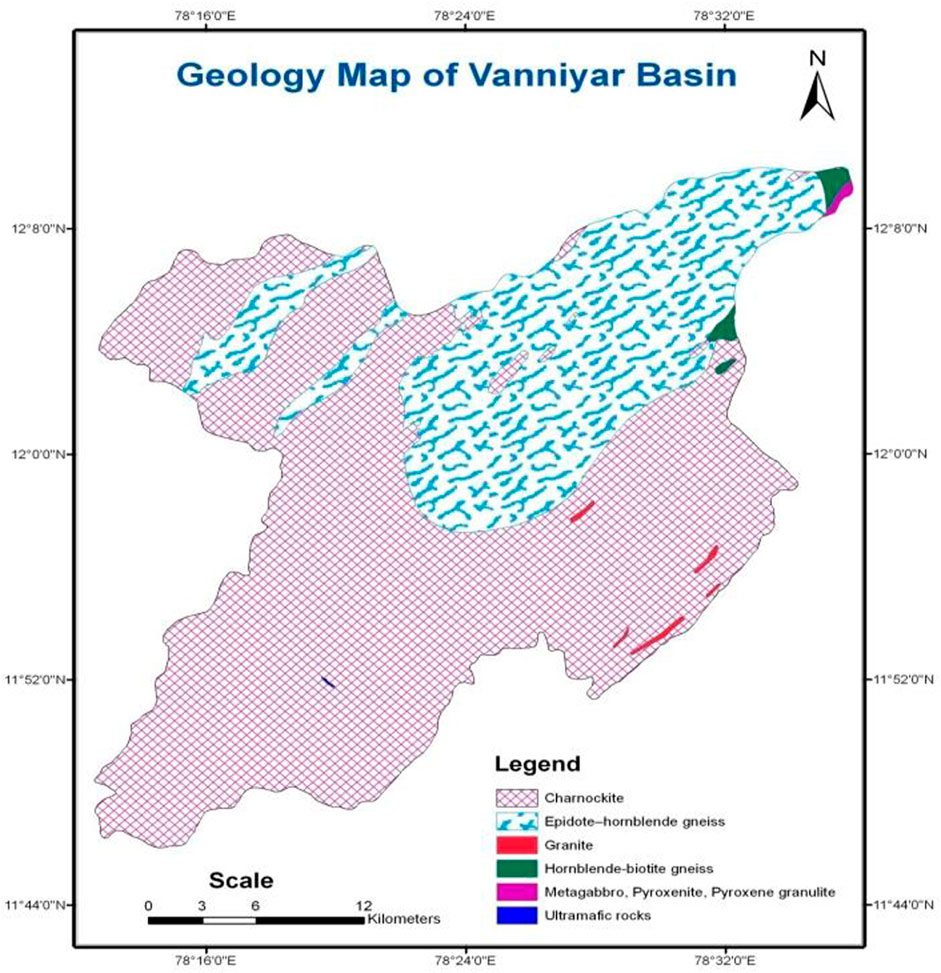
There are no clear contacts among these super groups, and contacts are primarily in the area of migmatization (Naidu, 1963). Recently, isotope dating of several rocks on the Indian Peninsula, 750 million years ago, especially in the study area, the highly graded terrain of Tamil Nadu represents an important metamorphic province in the world, wherein deeper segments of the crust are exposed, and are dominated by amphibolite’s and granulite facies rocks. It is essentially a Precambrian terrain, which covers over 80% of the landmass. Phanerozoic sedimentary rocks and river valley alluvium account for the rest. These include upper Gondwana sediments along linear troughs and the succession of Mesozoic to recent sediments in the sedimentary basins along the continental margin. The generalized stratigraphic succession is shown in Table.1. The Vanniyar basin is made up of charnockite, granite, epidote–hornblende, gneisses, hornblende–biotite gneiss, metagabbro, pyroxenite, pyroxene granulite, and ultramafic rocks. Table 2 and Figure 3 shows the stratigraphic succession and geological map of the Vanniyar basin, respectively.
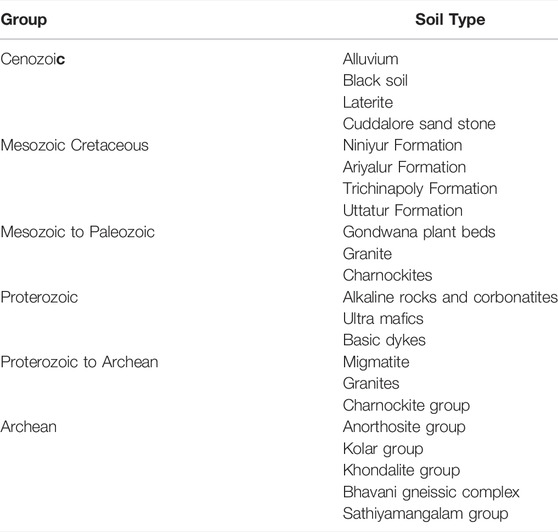
TABLE 1. Stratigraphic succession of Tamil Nadu, India (Reference Rajesh and Santosh, 2004).
3.2 Proterozoic Sequence
3.2.1 Charnockites
The name charnockite refers to orthopyroxene-bearing granite commonly found in the granulite facies terrain. High pressure–temperature conditions are essential for the formation of charnockites, which are of igneous origin by magmatic differentiation and in composition ranging from acid to ultrabasic. Vred enburg (1910) correlated the charnockite series and kondalite series with the Dharwar system of Karnataka, India. According to him, charnockite and kondalite represented intensively metamorphosed facies of the Dharwar system. Howie (1955), on the basis of studies on the geochemistry near Chennai, expressed the view that the rock represented calc-alkaline plutonic metamorphism. According to Subramaniam (1967), charnockite is grouped into four types as follows: 1) acid microperthitic charnockite; 2) intermediate gneissic charnockite; 3) basic noritic charnockite (Pyroxene granulite); and 4) ultrabasic charnockite. Acid microperthitic charnockite occurs as conformable lenses and migmatites. The intermediate gneissic charnockite is the most prevalent, and it is banded and foliated. Alternating bands of light-colored micro pertitic charnockite and layers of pyroxene granulite are seen in sheet-like form. Charnockites of Tamil Nadu, India have been classified into the “high land type” of the first generation charnockite and another “lowland” or “incipient.” The Shevaroy hills fall under a high land type with charnockite of the first generation. The charnockite present in the plains of the study area is a low land type. The pressure–temperature conditions of charnockite formation covering the Shervaroy hills (Raith and Srikantappa, 2007) are 6,800°C+550°C. An old granulite belt is defined in the Nilgiri–Shervaroy hills–Chennai belt in the north of Tamil Nadu. The charnockite on Vanniyar is fine and medium to coarse-grained. Sphene, apatite, zircon, and magnetite as secondary minerals are abundantly available.
3.2.2 Pyroxenites and Ultramafic
The pyroxene granulite shows the development of biotite, hornblende as a linear stream and retrogression, giving gneissic appearances in charnockite. The first stage of retrogression between charnockite and pyroxene granulates is across.
3.2.3 Alluvium
Alluvium is poorly deposited along the main course of the Vanniyar basin’s streams. It is present all along the drainage when it is ephemeral in nature.
3.2.4 Bauxite Deposits at Shevaroy Hills
Bauxite deposits are located in the tropical climate zone of the globe (Krishnan 1942). The Shevaroy hills are located 10 km due north of Salem, India. Bauxite deposits of these hills occur above an altitude of 1,500 m (Subramanian and Mani, 1979). The Shevaroy hill range is a part of the metamorphic province of Archean age. The rock types underlying the bauxite deposits are generally referred to as charnockites and leptynites. Mineralogically, they may be classified into non-garnetiferous and garnetiferous groups of rocks. The non-garnetiferonous rocks are mafic and intermediate composition rocks. The mafic types are characterized by clino and orthopyroxenes, plagioclase feldspar, quartz, and alkali feldspar; the intermediate types contain alkali and plagioclase feldspar, quartz, and ortho pyroxenes, in that order of abundance (Subramanian and Mani, 1979). In the garnetifrous rocks, alkali and plagioclase feldspars, quartz, and garnet are the major constituents with or without hyperthene.
3.2.5 Ultramafic Rocks
Dunite is an olivine that accumulates and forms the major rock unit in the ultramafic suite. They are dark green in color, generally altered and are cut across by numerous magnesite veins, which where intensively developed, may form almost stock work. The formation of serpentine by magnesia or the addition of silica could not be established. On the other hand, the sharp contacts of magnesite veins with the host rock are indicative of magmatic origin. Among ultramafic rocks, they show the maximum development of magnesite veins. The impure variety of magnesite veins and some silica might have resulted from the leaching of silica from the host rocks. Grains of chromite are also found in the study area (District Survey report, 2019).
3.2.6 Pyroxenite
Two generations of pyroxenites are noticed in the Vanniyar basin. The older one, associated with the peninsular gnessic complex, is seen on the southern side, and the younger one on the northern side, in contact with the ultramafic body. This rock comprises mainly olivine, orthopyroxene, clinopyroxene, and amphibole. The contact between pyroxenites and dunite and peridotite rocks is not clear. This may probably imply that the crystal setting in a basaltic magma chamber results in the formation of dunite at the bottom, followed by peridotite and then pyroxenite at the top. Lamprophyre, olivine gabbro, and amphibole–pyroxene rocks are noticed within the ultramafic, some of them forming, presumably, segregations within the ultramafic suite.
3.3 Geomorphology
Geomorphology is the scientific study of the origin of landforms based on a cause-and-effect relationship. Geomorphology is closer to geology and is moving away from geography. Geomorphology is the study of mountains, plateaus, plains, valleys, basins, and their associations with landforms, sediments, and developments comes under the domain of geomorphology. The morphology and the measurement of landform are useful in evaluating drainage basin parameters, which in turn is useful in understanding groundwater interaction. Groundwater recharge and runoff due to precipitation are controlled by geomorphic features. The occurrence, movement, and quality of groundwater are also controlled by geologic formations. The landforms depend upon the following features: 1) climatic region, 2) the bedrock beneath the surface, and 3) slope of the land. With the help of aerial photographs and land imagery, the terrain parameters and their landform structure, drainage, land use, and land cover are predicted. Figure 4 shows the geomorphological characteristics of the Vanniyar basin, Dharmapuri district, Tamil Nadu, India.
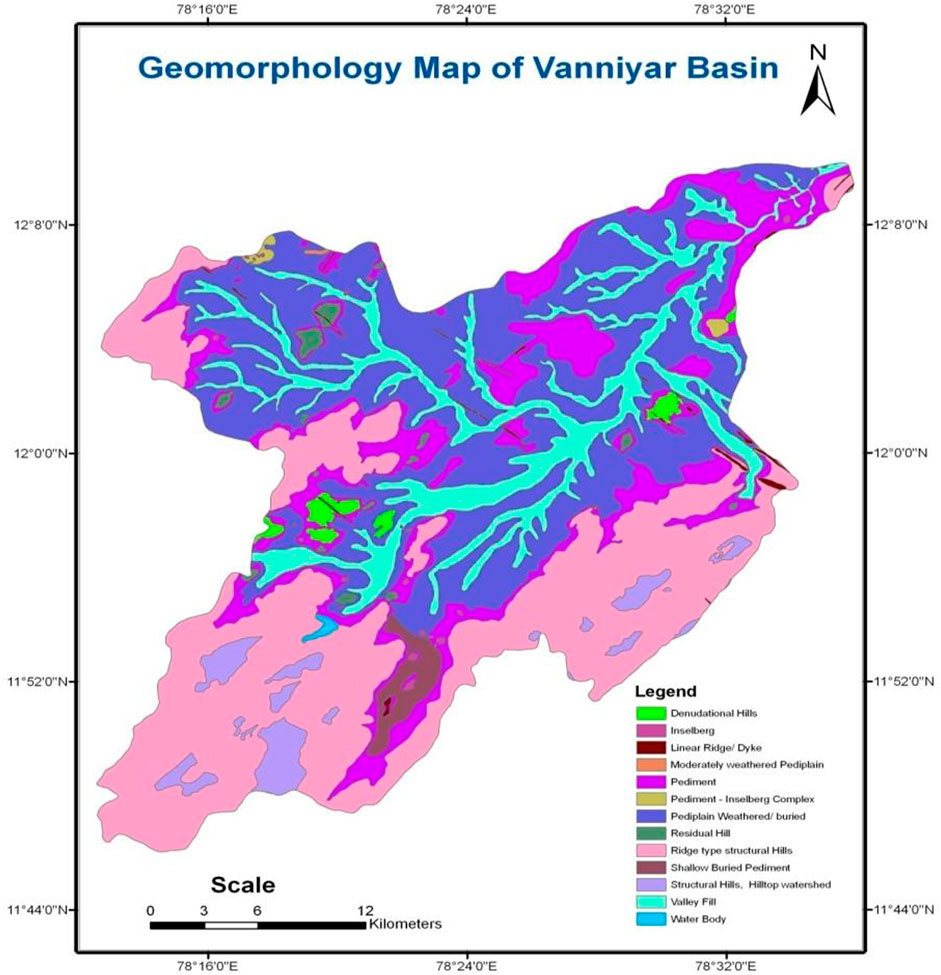
FIGURE 4. Geomorphological characteristics of the Vanniyar basin, Dharmapuri district, Tamil Nadu, India.
3.3.1 Landforms
The following common land form characteristics are identified at the Vanniyar basin using aerial photographs and Landsat imagery (Figure 4).
1. Denudation hills
2. Inselberg
3. Linear ridge
4. Pediment
5. Residual hills
6. Structural hills
3.3.2 Inselberge
The term “INSELBERGE” encompasses a considerable range of morphological types. It was originally used for ridges, ranges, and residuals in arid and semi-arid regions. The climate restriction is in practice difficult to maintain, for similar forms occur in other climatic regions as well, bearing aside the associated problems of climate change and field evidence indicating structural changes. Expansion of a pediment or series of pediments may continue until all that remains of the original mountain mass is scattered among those that rise above its surface. Such hills are analogous to monad rocks on a pediplain surface and were originally, to some extent, still called inselberges. These inselberges are found in Trichy, Dindigul, Namakkal, and Sankagiri Durg as prominent land marks where the historical forts and temples are built on them. The features are formed by the orthogonal joint system. They comprise numerous little rounded “joint-blocks” or “wool sacks” still in situ and include most of the inselberges. The inselberges are also considered poor for groundwater prospecting. Valley hills are considered to be good potential zones for groundwater exploitation.
3.3.3 Shallow Buried Pediments
Mountains in arid regions are commonly bordered by smooth pediment slopes that extend downward to neighboring basin floors. It was formerly thought that a pediment slope was entirely of gradational origin, but it is now called “Bajada.” Bajadas are plains of aggradations built up by detritus deposited intermittently. The pediment and bajada slopes are relatively gentle, varying between 1/2° and 7° whereas the mountain front, the surface of the bajada is slightly undulating in character when traversed parallel to the mountain front. Bajada materials are gradually alluvium or large boulders, sometimes interbedded with low gradients, whereas shorter stresses that do not head back into the mountain form steeper alluvial cones.
3.3.4 Pediments
Pediments are largely bedding on a rock surface. Pediments may have a thin veneer of grave over them adjacent to the mountain. This may be etching away from the mountains, thus becoming “concealed sediments.” Even where concealed, a pediment is believed to be most typically a convex rock surface that plunges beneath the bajada that observes it. Individual pediments at the point where mountain valleys discharge into a pediment slope may expand to form “coalescing pediments,” which may in time practically consume a mountain mass. Some pediments exhibit a considerable degree of dissection and are regarded as “dissected pediments.” The pediment is placed as an intermediate landform between Inselberge and shallow pediments. Wells placed in shallow-buried pediments have a shallow water table in comparison to the ones in deep-buried pediments.
3.3.5 Residual Hill
Biley Wilus (1936) coined the term “bornhardt” to refer to residual hills that rise above the denuded topography, thought to be pediments. These steep sides are the most prominent features of the island’s mountain landscape, making them famous for bornhardt, passage, and others. In the beginning, this term was indiscriminately applied to the term “Inselberg” to any hill regardless of its origin. Biley Wilus (1936) attempted to clarify this situation by suggesting the usage of the term “bornhardt” to designate such forms as originally called “Inselberg.” Two theories have developed with respect to the origin of bornhardt. According to L.C. King (1949), they are erosion remnants on a pediment or Pedi plain that have developed along pediment lines by parallel retreat to chemical weathering and have been exhumed when the circum-adjacent deeply weathered rock was eroded away in a cycle of erosion following that during which the deep weathering occurred. According to this view, bornhardt belonged to a series, which included such small-scale features at one end, and bornhardt at the other end. It is believed that whether large scale or small-scale features are produced depends mainly on the joint system. Regardless of whether deep seated, weathered rock is a pre-requisite to the development of bornhardt, it does appear that these features are their existence and form to resistant, massive, and monolithic rocks. For those whose whole heights are measured in many hundreds of feet, a polycyclic origin seems to be reasonable. Residual hills have poor storage capacity and may not be considered groundwater resources.
3.3.6 Structural Hills
These act as the main water divider as the initial unit of the watershed, with numerous drainages originating from them. They are linear to arcuate hill features, showing a definite trend in their formation. Hornblende–biotite gneisses are the major rock types in the study area. A terrain with a structure of hills may not have good sources of groundwater.
3.3.7 Soil and Crop
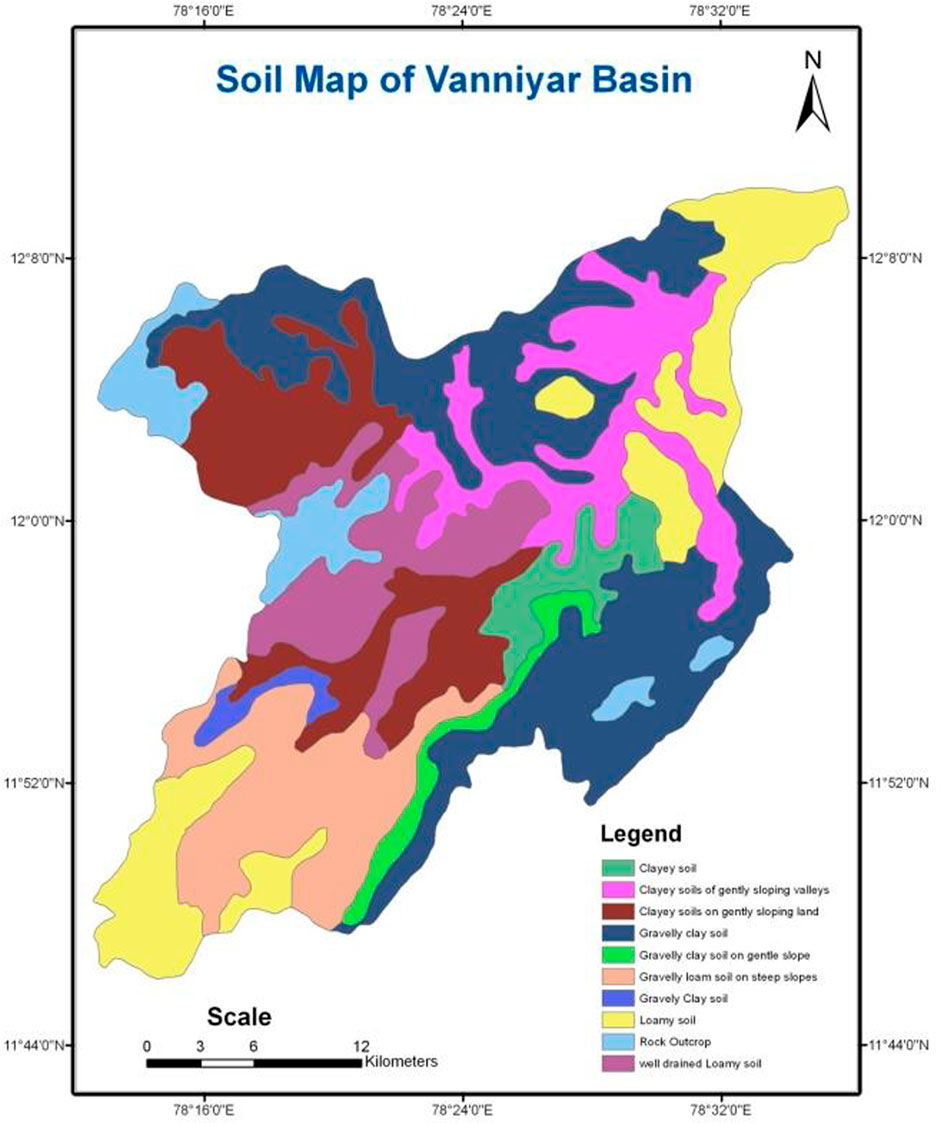
Red soil, brown soil, black soil, and alluvial soil are common types of soil present in the Vanniyar basin, with soil cover thickness varying from 1.2 to 4.5 m. Figure 5 shows the type of soil available in the study area. Red soil and forest soil occupy the maximum area in the Vanniyar basin, followed by black soil and alluvial soil with moderate infiltration capacity. The total area covered by agriculture is 60%, and forestland is 40%. At the normal time of year, both wet and dry crops are cultivated. The wet crop is raised mainly with the help of dug with bore wells and bore wells only. The area is mainly covered by red food crops such as paddy, cholam, kambu, ragi, and oil seeds of castor. The other cash crops are coffee, sugarcane, coconut, tapioca, groundnut, and cotton in selected regions. The most common trees found in the area are neem (Azadirachta indica), palmyra (Borassus flabellifer), karuvelam (Acacia arabica), etti (Strychnos nux-vomica), illupai (Bassia latifolia), banyan (Ficus benghalensis), murungai (Moringa oleifera), agathi (Sesbania grandiflora ), mango (Mangifera Indica), guava (Psidium gujava), and silk cotton (Eriodendron pentandrum). Other than these, species such as eucalyptus, pungam, bamboo, and babool are noticed.
3.4 Climate and Temperature
There are two distinct types of temperature, such as hot and cold, that are noticed in the study area. The months of March, April, and May are considered hot months and the mercury rises to around 43°C, whereas in the months of December, January, and February, the temperature varies from 15°C to 22°C. After the onset of the monsoon, the temperature varies from 27°C to 32°C.
3.5 Rainfall
A network of non-recording and recording rain gauge stations can be used to measure rainfall. One rain gauge for every 520 square kilometers in the plains, one for every 260–390 square kilometers in the elevated zones, and one for every 130 square kilometers in mountainous and high-rainfall areas (Raghunath, 2006). Rainfall data for the study area was acquired from PWD Salem’s groundwater sub-division. The mean precipitation over the study area is calculated by the arithmetic average method, using rainfall records from the study area’s rain gauge station. Long-term records will provide some insight into yield as a measure of aquifer replenishment. A study of short-term fluctuations with amplitudes shows less connection between the aquifer and the atmosphere. Water table fluctuation can be divided into four basic types (Davis, 1969).
1) Changes in groundwater storage cause fluctuations in the water table.
2) Variations in the water table caused by changes in atmospheric pressure in contact with the water surface in wells.
3) Variations in the water table caused by aquifer system deformation
4) Water table fluctuations caused by well disturbances.
In general observation, the effect can be felt in each control well whenever there is heavy rainfall. For instance, during the northeast monsoon season, rising water levels in the corresponding control wells are observed. Therefore, in shallow dug wells, it can be concluded that the replenishment is mainly due to stormwater. However, the deep wells located in the structural lineaments indicate that they are connected by a deep groundwater system (Davis, 1969). Rainfall is the main factor for recharge and discharge, and it is correlated with the rise and fall of the water level. The long-term and short-term correlation of rainfall is made with water level data (Dharmapuri District Statistical Hand book, 2020). The long-term monthly correlation ranges from 60 to 150 mm in the monsoon months, and then there is a rise of 1 m in the water level.
3.6 Drainage
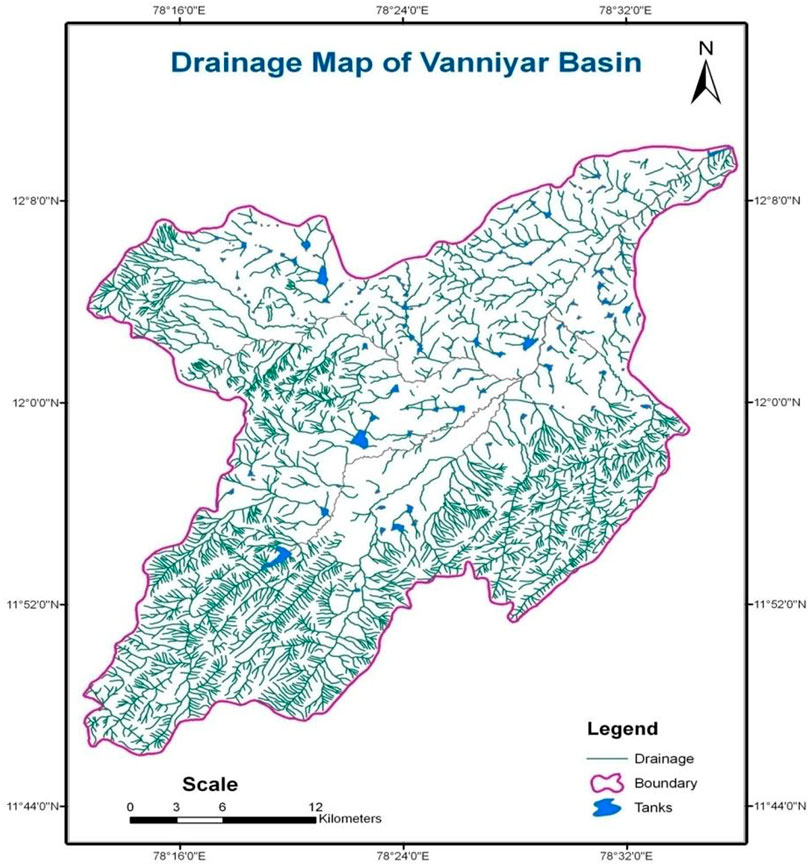
A drainage pattern is the planimetric arrangement of streams, etched into the land surface by a drainage system. Drainage patterns of all types are found on a variety of rocks, from those defined by the major river systems to those associated with riles and gulleys. They help with the textural features of the stream, and depending upon the spacing of the individual stream, may be defined as coarse, intermediate, or fine textural patterns. The stream, which defines the patterns, can be of any genetic type: consequent, subsequent, and so forth. The first stage in using drainage is to seek a connection between the stream pattern and the disposition of rocks. A channel that has developed on an initial slope and continues to follow its original direction is said to be a consequent stream. This term refers only to topography and not to any structural aspect of the consequent stream’s origin. An insequent stream occupies a course, which is not due to determinable factors. The best development of insequent streams takes place on the horizontal rocks, which are massive crystalline rocks. A subsequent stream develops by head erosion along a belt of weak rocks. In an alternate sequence of hard and soft rocks dipping seaward, a consequent stream will form wider valleys where it cuts the weak rock. Tributaries originate on the wider sides of these valleys and lengthen their valleys by headward erosion, forming subsequent streams. Table 3 shows the various types of drainage and how their anomalies are used to decipher underlying strata. A drainage map has been prepared and it is presented in Figure 6.

TABLE 3. Types of drainage and its anomaly used to identify the underlying strata of the Vanniyar basin, Dharmapuri district, Tamil Nadu, India.
3.7 Slopes
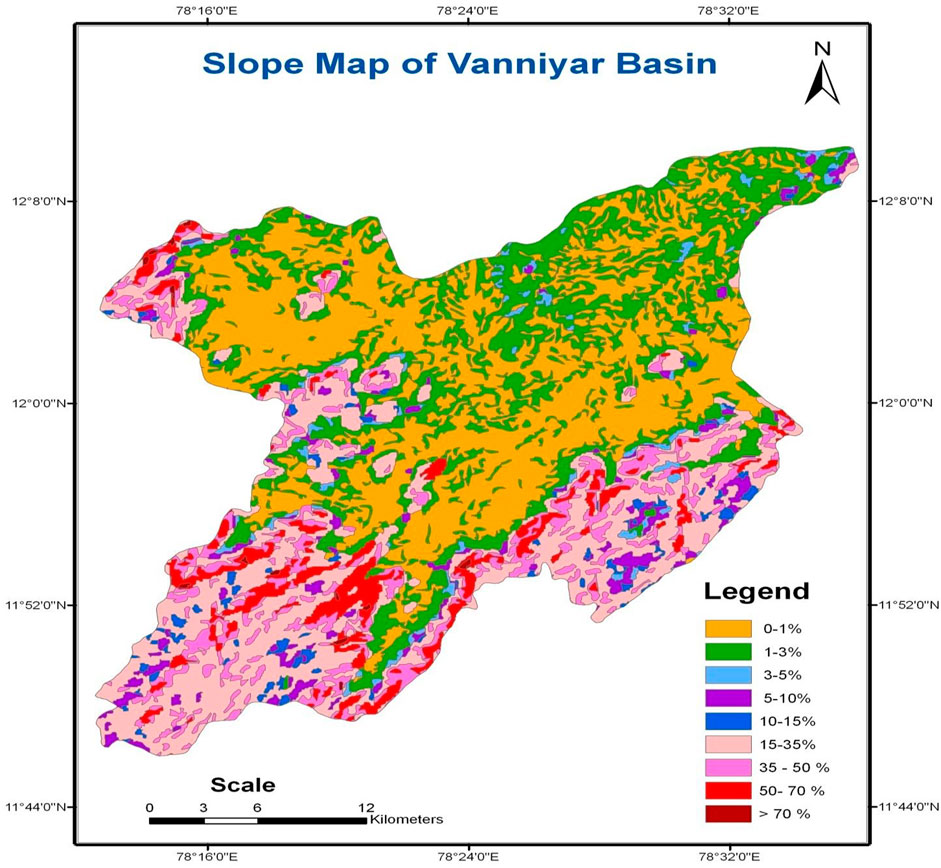
The slope has a dominant effect on the contribution of precipitation to streams and groundwater reservoirs. Slope conditions control the duration of land and underground flows, the depth of penetration to the water table, and the distribution of aquifer head and artesian pressure. The slope influences vegetation distribution, land use patterns, and the feasibility of abstraction structures such as check dams and percolation ponds.
Steep slopes give rise to coarse textured and permeable detritus material deposited close to the source rocks. Highly permeable material on steep slopes may absorb as much water as possible. The slopes have significance for groundwater and land if it is confined to 2%. Table 4 categorizes slopes according to AIS and LUS guidelines and the Soil Survey Manual IARI (1970). The slope of the study area ranges from 0 to 70%, indicating that the Vanniyar basin is moderately steep. A slope map has been prepared to understand the slope stability, drainage flow, and geology of the Vanniyar basin and is presented in Figure 7.
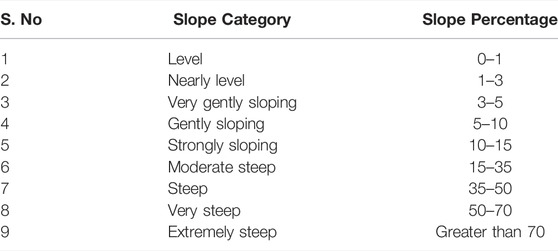
TABLE 4. Slope Categorized by Soil Survey Manual IARI (1970), Vanniyar basin, Dharmapuri district, Tamil Nadu, India.
3.8 Land Use
Land use is referred to as the many activities and various uses that take place on the land. Land covers are called “natural vegetation” and are listed on rock/soil man-made covers and other lands in water bodies (NRSA 1989). Land use areas are exchangeable and closely related. A land use map has been prepared for the Vanniyar basin to study the various aspects such as agriculture, forest, river courses, mountainous regions, plains, and settlements and is presented in Figure 8.
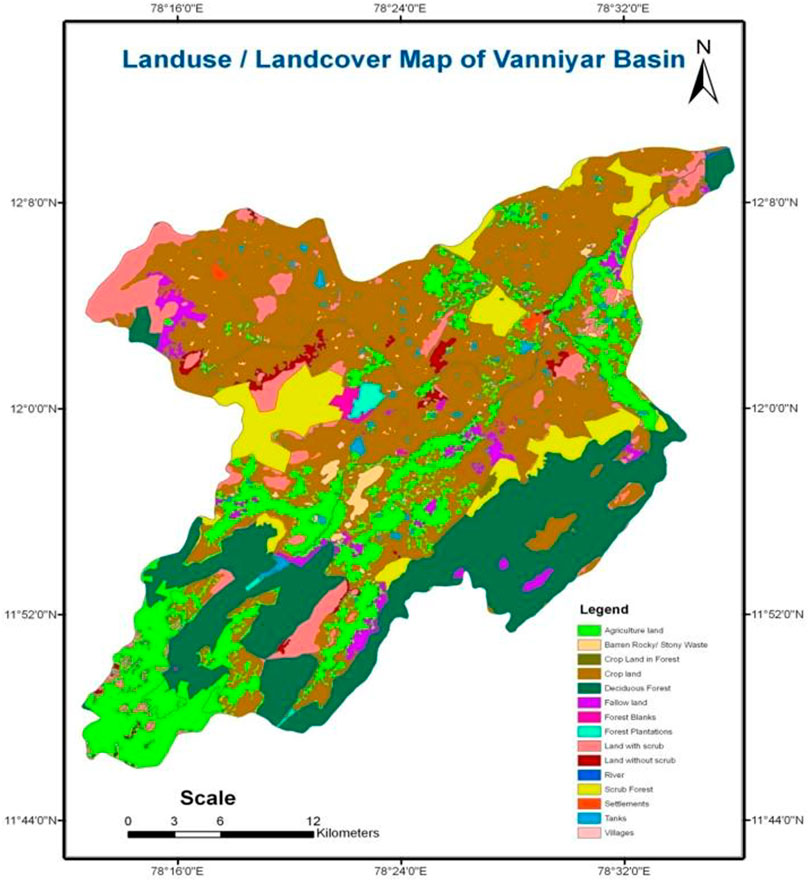
FIGURE 8. Land use and land cover map of the Vanniyar basin, Dharmapuri district, Tamil Nadu, India.
3.9 Geomorphic Features of Vanniyar Basin
The Vanniyar basin comprises upland hills, a plateau, isolated hills, and undulating plains. The southern part of the study area is covered with the valley and upland hills of the Shervaroy hills. The northern part of the study area is covered by pediments, linear ridge dykes, and denudation hills. The major country rock is the hard, massive charnockite. The study area can be grouped as the structural hills of the Shervaroy hills in the south. The steep hills of Shervaroy are followed by a pediment zone. The geomorphic features of each sub-basin of Vanniyar are as follows: composed of pediments, denudational hills, ridge type structural hills, and weathered/buried pediplains in the Pappireddipatti sub-basin. Weathered or buried denudational hills, linear ridge dyke, pediments, and pediplains in the Harur sub-basin. In the Morappur sub-basin, pediments are located in most of its area. Yercaud sub-basin is composed of ridges such as structural hills, shallow buried pediments, structural hills, and hill-to-watershed pediments.
3.10 Digital Image Processing
Digital image processing involves manipulating and interpreting digital data with the help of computers to improve the interpretability of interpreters (Jenson and Domingue, 1988). Digital image processing involves changing digital data to improve image quality with the help of a computer and provides better results than visual interpretation. The main advantage of digital data is the ability to use computational analysis techniques. The image processing software package ERDAS 8.7 was utilized for this digital analysis. The image processing technique includes image rectification and restoration, false color composite, unsupervised classification by cluster analysis, and supervised classification (maximum likelihood) methods.
3.11 Image Rectification and Restoration
The raw remote sensing data contain geometric as well as radiometric distortions or degradations that happened during the data acquisition process. This means that this data cannot be directly used as a map base. The distortions and degradations are removed by computer-aided techniques using image processing software, especially meant for this sort of work, one such software ERDAS Imagine 8.7 is used in the present work. First, the digital format of Landsat TM satellite data obtained from GLCF is bought into the ERDAS environment to carry out the further process; all the seven-band data were imported using ‘import option’ available in ERDAS 8.7. The present study area is covered by two satellite images. The two-satellite data were imported to the ERDAS environment and geo-registered by using well distributed ground control points (GCPs). After geo-registration, the two images made mosaic using ‘mosaic image’ option. The subset of the study area is sliced out from the mosaic output, and finally the distortion-free satellite data are obtained for further processing.
3.12 Digital Elevation Model
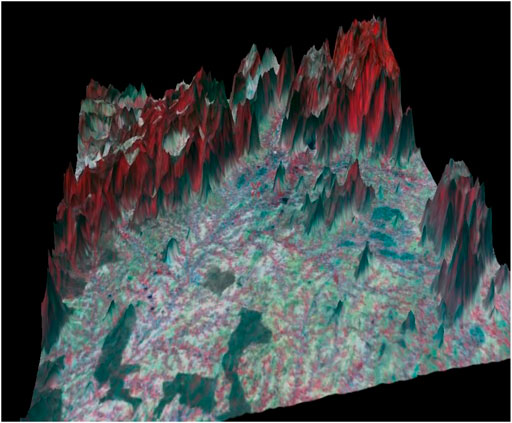
A digital elevation model (DEM) is a computer-aided representation of an elevation plane (Jenson, S. K., and Domingue, J. O. (1988)). This is a grid where the value of each cell represents the height of the surface at that location in the scene. Terrain planes are placed in a data file as a set of evenly spaced x, y, and z coordinates in which z represents the altitude. To create a DEM, digitize the terrain contour map and specify a height value for each contour. The 3D surface submodule under ERDAS software data preparation module is used to create a DEM using a digitized contour diagram as input. The output raster image has a height value for each pixel. A 3D view showing the actual state of the terrain is created with the ERDAS virtual GIS module. For ease of interpretation, the registered FCC has been projected into this 3D DEM. Figure 9 shows that the FCC has fallen into the study area. DEMs are used for hydrogeological interpretations, slope analysis, and drainage networks. It is also used to select a site-specific recharge mechanism.
4 Morphometric Analysis
Hydro science deals with water on earth, its distribution and circulation, its physical and chemical properties, and its interaction with the environment, including its interaction with living organisms, especially humans. There are large areas where hundreds or even thousands of gallons per minute can be obtained from wells. Groundwater generally averages out to be a little harder and more mineralized than surface water in the same locality, but its quality is more uniform during the year. The pH of groundwater in the study area is 8–8.3. Groundwater reservoirs accept water, filter it to remove sediment and disease-causing organisms, store it in quantities far exceeding those that could conceivably be stored in all natural and artificial surface water bodies combined, even out its temperature and chemically qualify it, transport it from areas of replenishment to areas of need, and slow down its natural discharge to the surface, accounting for the majority of the dry-weather flow of water. To an increasing extent, they will be used to store surplus surface water through artificial recharge. This practice will reduce the wastage of good quality water that otherwise serves no useful purpose. Rivers and streams can easily be defined as bodies of water that flow through open channels. Landscaping has three important roles.
1) They erode the channels through which they flow.
2) They transport sediments and solutes provided by the weathering and slope processes, as well as other means of removal from ice and wind.
3) They produce extensive erosion and deposition feature.
River systems are a major source of erosion, transport, and sedimentation in most landscapes, including many landscapes where surface water is almost absent.
A catchment area is the area where the water is supplied by precipitation flows into the focal point of internal drainage, such as sea, lake, or larger stream. A catchment area is a basic unit of geomorphology for several reasons. The catchment area is usually a well-separated area that is clearly separated from each other by water divider/watershed, with the flow of water being near or near the surface of the earth, and the accompanying movement of sediments and dissolved substances. Since it is the movement of material that causes changes in the height and shape of the ground surface over time, the catchment area forms a natural unit for the analysis of river-eroded landscapes. Drainage from catchment areas provides a very useful point for monitoring the movement of these waters, sediments, and solutes. There are important exceptions to these generalizations. Partially, undergroundwater flows in the limestone terrain. This may have nothing to do with the surface terrain, but it applies to most landscapes. Another important characteristic of the basin is its hierarchical nature. Each tributary of the drainage system has its own basin that contributes to the outflow. Therefore, a large basin consists of a hierarchy of small basins.
The final feature of the catchment area, which is such an important analytical unit in geomorphology, is that many of these important properties are quantitative so that the watersheds can be compared with each other, following the pioneering work of Horton (1945) and Strahler (1957). Such a quantitative description is called the morphometry of the catchment area and can be applied to the surface and undulation characteristics of the catchment area and the characteristics of its river channel system. The Strahler (1964) system has been used for stream ordering because of its simplicity.
The Vanniyar basin is divided into five sub-basins. They are Yercaud, Pappireddipatti upper, Pappireddipatti lower, Morappur, and Harur sub-basins. Overall, the Vanniyar basin has five orders of streams. However, the sub-basin has a different ordering system. A numerous, first order of streams is in Yercaud, upper basin of Pappireddipatti, and lower basin of Pappireddipatti. This is especially due to the highly elevated portions of the Shevory hills in Yercaud and Pappireddipatti. The upper part of Vanniyar is divided into two, one from Yercaud sub-basin and another from Pappireddipatti upper sub-basin. The remains of Vanniyar are joined in Pappireddipatti’s lower sub-basin. In the Morappur sub-basin, the first- and second-order streams are numerous. In the Harur sub-basin, first order streams are numerous. The parameters considered in morphometric analysis are as follows:
4.1 Linear Aspect
4.1.1 Stream Order
The river system is a kind of network, that is, it consists of a series of links that connect the nodes. The network can be analyzed in terms of two main properties system connectivity and topological aspects of the stream network. Geometric aspects, on the other hand, include length, area, shape, relief, and orientation parameters. The basic elements of a stream network are stream segments or links. This is a section of stream channel between two channel junction or the “fingertip” tributaries, between a junction and the upstream termination of a channel.
The stream order expresses the hierarchical relationship between segments. It is a fundamental property of stream networks since it is related to the relative discharge of a channel segment. Various systems of streams ordering have been proposed, but the two most frequently used are those of Strahler and Shreve systems.
In the Strahler system, a stream segment with no tributaries is designated. A first-order segment is formed by the joining of two first-order segments, a third-order segment by the joining of two second-order segments, and so on. In contrast, the stream ordering system proposed by Shreve (1969) defines the magnitude of a channel segment as the number of fingertip tributaries that feed it. As a stream’s magnitude is closely related to the proportion of the total basin area contributing runoff, it provides a good estimate of relative stream discharge for small river systems. The stream orders of the Vanniyar basin are ranked based on the Strahler’s (1964) stream ordering system, the number of streams in each segment (Nu) of the order (u). The total number of stream orders in the Vanniyar basin is 2,780, and these stream orders are distributed as follows: 2,224 in the first order, 278 in the second order, 139 in the third order, 94 in the fourth orders, and 45 in the fifth orders (Figure 6).
4.1.2 Stream Length
The stream length is calculated based on the law proposed by Horton (1945), that is, stream length from mouth to drainage divide are measured for Yercaud, Pappireddipatti upper, Pappireddipatti lower, Morappur, and Harur sub-basins and presented in Table 5.

TABLE 5. Morphometric Parameters of the Vanniyar’s sub-basin, Dharmapuri district, Tamil Nadu, India.
4.1.3 Stream Length Ratio, RL
Stream length ratio (Horton 1945) is defined as the ratio between the mean length of the one order to the next lower order of the stream segment.
where RL = Stream length ratio.
RL for the Vanniyar sub-basin is calculated using Equation 1, presented in Table 5 and it is observed that the variation in RL ranges from 0.42 to 0.73 due to the slope and the terrain. Pappireddipatti lower sub-basin and Harur sub-basin increase trend in the stream length ratio from lower to higher order, which represent the matured stage, while for the other sub-basins there is a change from one order to another order indicating the youth stage.
4.1.4 Bifurcation Ratio
The term bifurcation ratio (Rb) may be defined as the ratio of the number of stream segments of a given order to the number of segments of the next higher order (Schumm 1956). Horton (1945) considered the bifurcation ratio as an index of relief and dissections.
where
Rb for the Vanniyar sub-basin is calculated using Equation 2, presented in Table 5, the values of the bifurcation ratio for Yercaud, Pappireddipatti upper, Pappireddipatti lower, Morappur, and Harur sub-basins are 5.02,4.66,4.89,4.615, and 3.86, respectively, with a mean bifurcation ratio varying from 3.86 to 5.02. Thus, the sub-basin Harur has suffered less structural disturbance whereas remaining all sub-basins have not been disturbed.
4.2 Aerial Aspect
4.2.1 Form Factor Rf
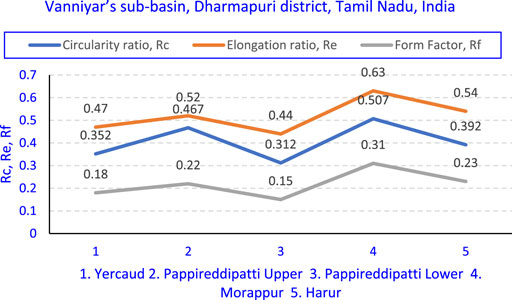
According to Horton (1932), form factor may be defined as the ratio of the basin area to square of the basin length. The value of the form factor (Rf) is always less than 0.7854, which is for a perfectly circular basin (Strahler, 1964). The form factor values of the watersheds in the study area range between 0.15 and 0.31 (Table 6). The basins low form factor are elongated and have flatter peak flows for longer duration, while the basins with high form factors are circular and have high peak flows for shorter duration.

TABLE 6. Analyzed morphometric parameters of the Vanniyar’s sub-basin, Dharmapuri district, Tamil Nadu, India.
where
A = Area of the basin in km2
Rf for the Vanniyar sub-basin is calculated using Equation 3 and presented in Table 6, the values of the form factor Rf for Yercaud, Pappireddipatti upper, Pappireddipatti lower, Morappur, and Harur sub-basins are 0.18, 0.22, 0.15, 0.31, and 0.23, respectively. It is observed that the Pappireddipatti upper sub-basin, Harur sub-basin, and Pappireddipatti lower sub-basin are having low form factor, which indicated elongated and flatten peak flows for long duration, while the other sub-basins have high form factors, which are circular with high peak flows for shorter duration.
4.2.2 Circularity Ratio Rc
Circularity ratio is the ratio of the area of the basin to the area of a circle, with a perimeter equal to the perimeter of the basin (Miller, 1953). Circularity ratio, according to Miller (1953), is an important ratio that defines a watershed’s dendritic stage. This is primarily owing to the basin’s varied slope and relief structure. Stream length and frequency, geological structure, land use/cover, climate, undulations, and basin slope are the factors which affects the circularity ratio. Rc values of low, medium, and high represent the young, mature, and old stages of the tributary watershed’s life cycle, respectively (John Wilson et al., 2012).
where
A = Area of the basin in km2
P = Perimeter of the basin in km.
Rc for the Vanniyar sub-basin is calculated using Equation 4 and presented in Table 6, it is observed that the Rc is between 0.312 and 0.507, which indicates that all the sub-basins are circular with high to moderate relief and a structurally controlled drainage system.
4.2.3 Elongation Ratio Re
Schumm (1956) defined the elongation ratio (Re) as the ratio between the diameter of the circle in the same area as the drainage basin and the maximum length of the basin. An elongation ratio is a measure of the shape of the river basin. A circular basin is more efficient in runoff discharge than an elongated basin (Singh and Singh 1997).
where
A = Area of the basin in km2
Lb = the maximum length of the basin parallel to the principal stream in km.
The values of the elongation ratio generally vary from 0.6 to 1.0 over a wide variety of climatic and geologic types. Values close to 1.0 are typical of regions of very low relief, whereas values in the range 0.6–0.8 are usually associated with high relief and steep ground slope (Strahler, 1964). These values can be grouped into three categories, namely, 1) circular (>0.9), 2) oval (0.9–0.8), 3) less elongated (>0.7).
Re for the Vanniyar sub-basin is calculated using Equation 5 and presented in Table 6, it is observed that the elongation ratio of all the sub-basins of the Vanniyar basin is less than 0.7, which indicates that the sub-basins are characterized by high susceptibility to erosion and sediment load (Reddy et al., 2004).
4.2.4 Drainage Density Dd
Drainage density is a measure of the total stream length in a given basin to the total area of the basin (Strahler 1964). Drainage density, well recognized by Langbein (1947), is the time of travel by water, and it ranges from 0.55 to 2.09 km/km2 in the humid region with a mean value of 1.03 km/km2. The density coefficient depends on the climate, rock type, relief, permeability, vegetation, roughness of the surface, and runoff. Precipitation and type directly affect the amount and nature of surface runoff. In areas with heavy rainfall, such as thunderstorms, the proportion of rainfall is greater than the runoff, resulting in more drainage channels on the surface. The amount of vegetation and soil precipitation that affect the rate of surface runoff affect the drainage texture of the region. Semi-arid areas have a finer drainage density structure than humid areas due to their similar geological conditions to lithology. According to Nag (1998), low drainage densities usually result in highly resistant or permeable undersoil materials, dense vegetation, and shallow relief areas. High drainage densities are the result of weak or impervious subsoil materials, sparse vegetation, and undulations in mountainous areas. If the drainage density is low, the drainage texture will be coarse, and if the drainage density is high, the drainage texture will be fine.
where
A = Basin area in km2
Dd for the Vanniyar sub-basin is calculated using Equation 6 and presented in Table 6, it is seen that the Harur sub-basin has a low drainage density associated with coarse drainage texture, and the Pappireddipatti upper sub-basin has a high drainage density, in which the basin of weak and impermeable subsurface material, sparse vegetation, and high relief.
Constant of channel maintenance: Schumm (1956) used the inverse of drainage density or the constant of channel maintenance as a property of landforms. The constant indicates the number of kilometers of the basin surface required to develop and sustain a channel of 1 kilometer long. The constant of channel maintenance indicates the relative size of landform units in a drainage basin and has a specific genetic connotation (Strahler, 1957). Regarding the study area, the average constant of channel maintenance is 0.42.
4.2.5 Length of Over Land Flow Lg
It is the length of water over the ground before it gets concentrated into definite stream channels (Horton, 1945). This factor basically relates inversely to the average slope of the channel and is quite synonymous with the length of sheet flow to a large degree. The length of over land flow approximately equals to half of the reciprocal of the drainage density (Horton 1945).
where
Dd = Drainage density.
Length of the over land flow for the Vanniyar sub-basin is calculated using Equation 7 and presented in Table 6, the values for the over land flow lengths for Yercaud, Pappireddipatti upper, Pappireddipatti lower, Morappur, and Harur sub-basins are 0.21, 0.2, 0.22, 0.3, and 0.39, respectively. The length of over land flow is less for Pappireddipatti upper, Yercaud, Pappireddipatti lower, and Morappur sub-basins but the drainage density is high.
4.2.6 Stream Frequency Fs
Stream frequency (Fs) is the total number of stream segments of all orders per unit area (Horton, 1932). Reddy et al. (2004)) stated that low values of stream frequency Fs indicate the presence of a permeable subsurface material and low relief. The channel segment numbers per unit area are difficult to enumerate (Singh 1980), but an attempt has been made to count the stream frequency of the Vanniyar basin.
where,
A = Basin area in Km2
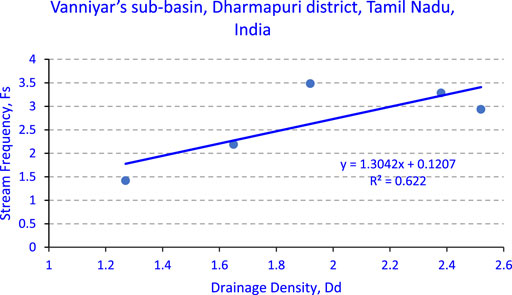
Fs for the Vanniyar sub-basin is calculated using Equation 8 and presented in Table 6, the values of stream frequency Fs for Yercaud, Pappireddipatti upper, Pappireddipatti lower, Morappur, and Harur sub-basins are 3.33, 3.07, 3.48, 2.19, and 1.42, respectively; it is observed that the Harur sub-basin has a low stream frequency and the Pappireddipatti lower and Yercaud sub-basins have a high stream frequency. Also, it is noted that the Fs exhibit a positive correlation with the drainage density values of the sub-basins, indicating the increase in stream population with respect to the increase in drainage density.
4.2.7 Drainage Texture Dt
Drainage texture is one of the important concepts of geomorphology, which means that the relative spacing of drainage lines. Drainage lines are numerous over impermeable areas compared to permeable areas. According to Horton (1945),

TABLE 7. Drainage texture classifcation based on drainage density value (Smith, 1950).
The Pappireddipatti upper and Yercaud sub-basins have coarse drainage textures, and the Pappireddipatti lower, Morappur, and Harur sub-basins have very coarse drainage textures, respectively.
4.2.8. Infiltration Number IF
The infiltration number for different sub-basins is calculated by multiplying the drainage density with stream frequency. The infiltration number, IF values for Yercaud, Pappireddipatti upper, Pappireddipatti lower, Morappur, and Harur sub-basins are 7.93, 7.74, 8.04, 3.61, and 1.8, respectively. Thus, the infiltration number, IF varies from 1.8 to 7.93. Even though the IF values seem to be high, the infiltration and runoff is low. Harur and Morappur are having lower infiltration number, which implies high infiltration and low runoff. Whereas Yercaud, Pappireddipatti upper, and Pappireddipatti lower are having low infiltration and high runoff.
4.3 Plots Morphometric Parameters
A graph plot of drainage density vs. stream frequency is created to examine the link between drainage density and stream frequency. The regression line suggests that the two parameters have a direct relationship (Figure 10). The relation between stream length on the horizontal axis and the stream order on the abscissa for all sub-basins almost gives a consistent straight line, which indicates that the relationship between them is constant throughout the ordinal succession of a sub-basin. Also, it shows that geometric similarity is maintained in the sub-basins in an increasing order.
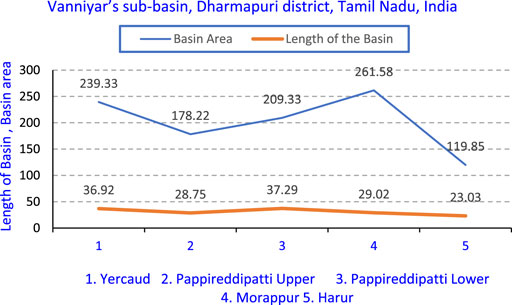
In general, the basin area and length are proportionate, and they have a nearly positive relationship. This indicates that the basin area is maximum when the basin length is maximum (Figure 11).
Mutual relationships of shape parameters can be evaluated from the plot as shown in Figure 12. The elongation ratio, circularity ratio, and form factor all demonstrate a relationship of decreasing values in the order elongation ratio > circularity ratio > form factor for the Vanniyar basin. As a result, the three metrics are adaptable and appropriate for describing the basin shape.
Drawn a regression line using a double log–log graph to find the relationship between the basin area and the total stream length of Vanniyar’s sub-basins. It is observed that the drainage area has a power functional relationship with stream length (Figure 13). The interpretation of a hypsometric curve (Figure 14) is that the hypsometric integral is 70% or 0.70. It indicates youth stream as 70% basin landmass is to be the youth stage of dissection.
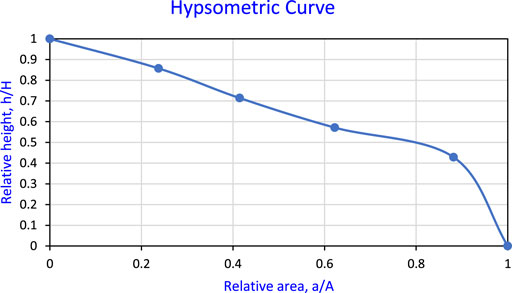
FIGURE 14. Hypsometric curve of geomorphological revolution in the Vanniyar basin, Dharmapuri district, Tamil Nadu, India.
4.3.1 Yercaud Sub-Basin
The Yercaud sub-basin has an aerial extent of 239.33 km2 having five stream orders. The total number of streams is 789, and the basin perimeter is 92.41 km. The maximum length is 36.92 km. The first-order streams are from the slopes of Shervaroy hills. The higher fifth order is extending and joins with the Pappireddipatti upper sub-basin.
4.3.2 Pappireddipatti Upper Sub-Basin
The Pappireddipatti upper sub-basin has an aerial extent of 178.22 km2, having fire stream orders. Total number of streams are 523. The basin perimeter is 69.26 km. The maximum length of the basin is 28.75 km. The first- and second-order streams are from the foothills of Shevaroy and Kalrayan. The higher fifth order joins with Yercaud sub-basin and extends into the Pappireddipatti lower sub-basin.
4.3.3 Pappireddipatti Lower Sub-Basin
The Pappireddipatti lower sub-basin has an aerial extent of 209.33 km2, having five orders. The total number of streams is 729. The basin perimeter is 91.78 Km. The maximum length of the basin is 37.29 km. The higher order extends into Morappur sub-basins. Though this sub-basin is having a very large extent, the streams present are very less.
4.3.4 Morappur Sub-Basin
The Morappur sub-basin has an aerial extent of 261.58 km2, having five stream orders. Total number of streams are 572. The basin perimeter is 80.5 km. The maximum length of the basin is 29.02 km. The higher fifth order extends in the Harur sub-basin.
4.3.5 Harur Sub-Basin
The Harur sub-basin has an aerial extent of 119.85 km2, having five stream orders. Total number of streams are 170. The basin perimeter is 62 km. The maximum length of the basin is 23.03 km.
4.4 Relief Aspect
4.4.1 Relief Ratio
Schumm (1956) states that the maximum relief to horizontal distance along the longest dimension of the basin parallel to the principal drainage line is termed as the relief ratio. Difference in the elevation between the highest point of a basin and the lowest point on the valley floor is termed as the total relief of that river basin. Schumm (1963) also stated that it is a dimensionless height–length ratio equal to the tangent of the angle formed by two planes intersecting at the mouth of the basin, one representing the horizontal and other passing through the highest point of the basin. The Rh normally increases with the decreasing drainage area and size of a given drainage basin (Gottschalk 1964).
where H = Total relief.
Rh for the Yercaud sub-basin is calculated based on Equation 9 and the value of relief ratio for the Yercaud sub-basin is 0.03791. This low value of relief ratios is mainly due to the resistant basement rocks of the basin and low degree of slope (Mahadevaswamy et al., 2011).
4.4.2 Relative Relief Ratio
Relative relief termed as ‘amplitude of available relief’ or ‘local relief’ is defined as the difference in height between the highest and the lowest points (height) in a unit area. Melton (1958) suggested to calculate relative relief by dividing the difference of height between the highest and lowest points in the basin (H) with basin perimeter (P), thus relative relief = H/P. Relative relief is calculated on the basis of highest and lowest elevations and the data of relative relief so derived are tabulated and classified into three categories, namely, 1) low relative relief = 0–100 m, 2) moderately relative relief 100—300 m, and 3) high relative relief = above 300 m. From Table 8, it is observed that the relative relief ratio Rr for the Yercaud sub-basin is 1.514; therefore, the Yercaud sub-basin has a low relief order.
4.4.3 Ruggedness Number and Gradient Ratio
Strahler (1964) ruggedness number is the product of the basin relief and the drainage density and usefully combines slope steepness with its length. An extreme high value of the ruggedness number occurs when both variables are large and slope is steep (Strahler, 1957). The low ruggedness value of watershed implies that area is less prone to soil erosion and have intrinsic structural complexity in association with relief and drainage density. From Table 8, it was observed that the ruggedness number, Rn and gradient ratio, Rg for the Yercaud sub-basin is 3.3 and 0.037, respectively; this low ruggedness value and negligible slope indicates that the Yercaud sub-basin is less prone to soil erosion.
4.4.4 Graded Stream
A graded stream is one in which, over a period of years, the slope is delicately adjusted to provide with available discharge and with prevailing channel characteristics, just the velocity for the transportation of load supplied from the drainage basin. Thus, the four variables related to the concept of a graded stream are as follows:
1. Slope
2. Discharge
3. Channel characteristics
4. Sediment load
In this condition, the longitudinal profile consists of a continuous concave curve or curves just steep enough to transport all the load from one end to the other. The longitudinal profile can provide information about the underlying abstracts and perceptions of an area’s geologic processes and geomorphic. The longitudinal profile delivers (Kumar and Pandey, 1981) a clarification of the apparent as they are the erosional curves and the river’s advance flows from the source. The profiles reflect the structural agitation of the stream course and the lithologic variation in the river basin. The lineament is reflected in the slope difference along the profile. The Harur sub-basin has a longitudinal profile of 25.3 km, the Morappur sub-basin has a longitudinal profile of 35.5 km, and the Pappireddipatti sub-basin has a longitudinal profile of 10.2 km. The average slope range at the Harur sub-basin is 10.5%, the Morappur sub-basin is 1.6%, and the Pappireddipatti sub-basin is 1.8%. The range of total distance at the Harur sub-basin is 3.29 km, Morappur sub-basin is 2.90 km, and Pappireddipatti sub-basin is 1.57 km. The maximum slope is 2.8, 4.6, and 3.5% at Harur, Morappur, and Pappireddipatti sub-basins, respectively. The average slope is 1.1, 0.9, and 1.0% at Harur, Morappur, and Pappireddipatti sub-basins, respectively.
5 Discussion
In this study, the drainage network in the Vanniyar basin was demarcated with the help of IRS IC and ID (LISS III + PAN merge) bands with geocoded FCC bands of 2, 3, and 4 on a scale of 1:50,000. The SoI topographical maps are used as the reference. Satellite images of the Vanniyar basin have been geometrically modified in relation to SOI topo sheets. The drainage pattern was originally derived from the SoI topographic map and then updated from the LISS III data using linear stretch and edge-enhanced false color composites (FCC). The study area, Yercaud, Pappireddipatti upper, Pappireddipatti lower, Morappur, and Harur sub-basin’s, boundaries are also drawn from the SOI topo sheet. The digitized drainage map was then exported to AutoCAD, transferred to GIS software, and transferred to the Vanniyar base map created with the SoI topographic map. GIS software was used for digitization and computational purposes, as well as output generation for each Vanniyar basin.
Geologically, the study area is having rocks of Archean age to recent alluvium. Most of the rocks are highly metamorphosed and locally altered. The main rock types are hornblende–biotite gneiss, charnockites of granulite facies. Other rock types are amphibolites, syenites, and dyke rocks. Bauxite deposits are in the cap rocks of charnockite in Shervaroys hills falls under the study area.
Geomorphological features provide tremendous control over the groundwater regime. The characteristics of the undulations, the types of weathered material, and the overall composition of the various terrains play an important role in defining the balance of groundwater, especially in hard rock areas and loose rock formation. Based on the recuperation test of well and the field survey, it is clear that the topography of the Vanniyar basin includes the following characteristics. There is a bauxite deposit on the Shevaroys plateau. The flat, deeply buried pediments occupy a large area of the Vanniyar basin. This can vary depending on the type of underlying structure and weathering. Pediments are considered of the normal to poor groundwater potential zones. Structural hills in the study area are of hornblende–biotite gneiss, which is also a poor source of groundwater. Residual hills are also present in the study areas where places such as Charnockite and hornblende–biotite genesis are present and shows very poor in groundwater resources.
From the morphometric parameters of the Vanniyar basin, the following results have been arrived. Pappireddipatti upper, Morappur, and Yercaud sub-basins are the matured geomorphic stage due to the change from the lower order to higher order with the high stream length ratio. Yercaud and Morappur sub-basins are the youth stage due to the low stream length ratio, with the change from one order to another order. The mean bifurcation ratio of the Vanniyar sub-basins varies from 3.86 to 5.02 and is under normal basin category. The drainage density varies between 1.27 and 2.52, indicates the region has highly permeable and vegetative cover. The infiltration number of the Vanniyar sub-basin ranges from 1.8 to 7.8 shows the high infiltration and low-runoff character. The drainage texture for Pappireddipatti lower indicates very course texture, Morappur and Harur represents course texture, and Yercaud are moderate in texture. The form factor for Harur and Yercaud sub-basins shows elongated and flatten peak flows for longer duration, whereas Morappur and Pappireddipatti lower show high form factors, which is of in circular form having high peak flows for shorter duration. Circulatory ratio ranges from 0.312 to 0.507, which categories as circular basins. Elongation ratios for Yercaud and Harur, indicates high relief and steep slope, in less elongated form Morappur and Pappireddipatti lower show oval form. Elongated basins are easier to manage flood than those of the circular basis. These morphometric parameters of the Vanniyar basin are compared with the previous studies (Satheeshkumar and Venkateswaran, 2018).
6 Conclusion
The morphometric investigation has been performed in the five sub-basins of Vanniyar basin and following inferences are made as follows:
1) The Stream order data show that all the watersheds are likely to have greater stream flow.
2) The bifurcation ratio of watersheds possesses a well-developed drainage network. The high values of watersheds flow through mountainous and dissected regions, and low ratio values likely to pass through a flat and rolling terrain. In the present study, Rbm varies from 3.86 to 5.02 and all sub-basin of Vanniyar falls under normal basin category.
3) The stream length data show that all the sub-basins are at the youth stage.
4) The stream frequency values are low in the Harur sub-basin, which indicate less dissected regions. Whereas high in Yercaud and Pappireddipatti lower sub-basin, which indicates the high dissected regions.
5) The infiltration ratio reveals that the mean annual runoff is low for the all sub-basins. The drainage texture of sub-basin is moderate to very fine drainage texture characters.
6) The form factor ranges from 0.15 to 0.31, which indicates elongated and flattened peaks and flow for a long duration.
7) The circularity ratio shows all the sub-basins are circular and elongated in nature
8) The Elongation ratio shows that all five sub-basins are less elongated.
9) The length over land flow of the Vanniyar’s basin reveals that it contains an average slope.
10) From the morphometric analysis the Vanniyar basin could be easily managed during flood, since the all the sub-basins are in elongated forms.
11) Check dams may be constructed to harvest the rain water, which can penetrate through the surface to augment the groundwater potential.
Data Availability Statement
The original contributions presented in the study are included in the article/Supplementary Materials, further inquiries can be directed to the corresponding author.
Author Contributions
All authors listed have made a substantial, direct, and intellectual contribution to the work and approved it for publication.
Conflict of Interest
The authors declare that the research was conducted in the absence of any commercial or financial relationships that could be construed as a potential conflict of interest.
Publisher’s Note
All claims expressed in this article are solely those of the authors and do not necessarily represent those of their affiliated organizations, or those of the publisher, the editors, and the reviewers. Any product that may be evaluated in this article, or claim that may be made by its manufacturer, is not guaranteed or endorsed by the publisher.
Acknowledgments
The authors sincerely thank the editor Prof. Dr. Cláudia Maria Almeida for her valuable suggestion to improve this manuscript. The authors also thank the reviewers Prof. Sucheta Mukherjee and Prof. Shyam Kanhaiya for reviewing this manuscript. This paper is dedicated to the fond memory of the first author's father, (Raghava Perumal Muthuramalingam Pillai) R.M. Sankaranarayannan, former Professor, Department of Commerce, Annamali University, Chidambaram, Tamil Nadu, India.
Supplementary Material
The Supplementary Material for this article can be found online at: https://www.frontiersin.org/articles/10.3389/frsen.2022.845705/full#supplementary-material
References
Agarwal, C. S. (1998). Study of Drainage Pattern through Aerial Data in Naugarh Area of Varanasi District, U.P. J. Indian Soc. Remote Sens 26 (4), 169–175. doi:10.1007/bf02990795
Biswas, S., Sudhakar, S., and Desai, V. R. (1999). Prioritisation of Subwatersheds Based on Morphometric Analysis of Drainage basin: a Remote Sensing and Gis Approach. J. Indian Soc. Remote Sens 27, 155–166. doi:10.1007/bf02991569
Burrough, P. A., and McDonnell, R. A. (1998). Principles of Geographical Information Systems. New York: Oxford University Press.
Clarke, J. I. (1966). Morphometry from Maps, Essays on Geomorphology. New York: Elsevier Publ. Co., 235–274.
Cox, R. T. (1994). Analysis of Drainage-basin Symmetry as a Rapid Technique to Identify Areas of Possible Quaternary Tilt-Block Tectonics: an Example from the Mississippi Embayment. Geol. Soc. America Bull. 106, 571–581. doi:10.1130/0016-7606(1994)106<0571:aodbsa>2.3.co;2
Dar, R. A., Chandra, R., and Romshoo, S. A. (2013). Morphotectonic and Lithostratigraphic Analysis of Intermontane Karewa basin of Kashmir Himalayas, India. J. Mt Sci. 10 (1), 731–741. doi:10.1007/s11629-013-2494-y
Davis, S. N. (1969). “Porosity and Permeability of Natural Materials,” in Flow through Porous Media. Editor R. J. M. De Wiest (New York: Academic Press), 54–89.
Dharmapuri District Statistical Hand book (2020). District Statistical Hand Book of Dharmapuri District for the Year 2019-2020. Dharmapuri: Government of Tamil Nadu, Department of Geology and mining. https://cdn.s3waas.gov.in/s366368270ffd51418ec58bd793f2d9b1b/uploads/2021/03/2021032953.pdf.
Dikpal, R. L., Renuka Prasad, T. J., and Satish, K. (2017). Evaluation of Morphometric Parameters Derived from Cartosat-1 DEM Using Remote Sensing and GIS Techniques for Budigere Amanikere Watershed, Dakshina Pinakini Basin, Karnataka, India. Appl. Water Sci. 7, 4399–4414. doi:10.1007/s13201-017-0585-6
District Survey report (2019). District Survey Report Salem District. Salem: Government of Tamil Nadu, Department of Geology and mining. https://cdn.s3waas.gov.in/s3c81e728d9d4c2f636f067f89cc14862c/uploads/2019/06/2019061199.pdf.
Evans, I. S. (1984). “Correlation Structures and Factor Analysis in the Investigation of Data Dimensionality: Statistical Properties of the Wessex Land Surface, England,” in Proceedings of the International Symposium on Spatial Data Handling (Zurich: Geographisches Institut, Universitat Zurich-Irchel), 1, 98–116.
Evans, I. S. (1972). “General Geomorphometry, Derivatives of Altitude, and Descriptive Statistics,” in Spatial Analysis in Geomorphology. Editor R. J. Chorley (New York: Harper & Row), 17–90.
Gottschalk, L. C. (1964). Reservoir Sedimentation in Handbook of Applied Hydrology. New York: McGraw Hill Book Company. (Section 7-1).
Grohmann, C. H. (2004). Morphometric Analysis in Geographic Information Systems: Applications of Free Software GRASS and R. Comput. Geosciences 30, 1055–1067. doi:10.1016/j.cageo.2004.08.002
Holland, T. H. (1900). The Charnockite Series, a Group of Archaean Hypersthenic Rocks in Peninsular India. Mem. Geol. Surv. India 28, 192–249. https://www.scirp.org/(S(351jmbntvnsjt1aadkposzje))/reference/ReferencesPapers.aspx?ReferenceID=32870.
Horton, R. E. (1932). Drainage basin Characteristics. Am. Geo Phys. Union Trans. 13, 348–352. doi:10.1029/tr013i001p00350
Horton, R. E. (1945). Erosional Development of Streams and Their Drainage Basins; Hydrophysical Approach to Quantitative Morphology. Geol. Soc. America Bull. 56, 275–370. doi:10.1130/0016-7606(1945)56[275:EDOSAT]2.0.CO;2
Howie, R. A. (1955). XVIII.-The Geochemistry of the Charnockite Series of Madras, India. Trans. R. Soc. Edinb. 62, 725–768. doi:10.1017/S0080456800009431
Hurtrez, J.-E., Sol, C., and Lucazeau, F. (1999). Effect of Drainage Area on Hypsometry from an Analysis of Small-Scale Drainage Basins in the Siwalik hills (central Nepal). Earth Surf. Process. Landforms 24, 799–808. doi:10.1002/(sici)1096-9837(199908)24:9<799::aid-esp12>3.0.co;2-4
Jenson, S. K., and Domingue, J. O. (1988). Extracting Topographic Structure from Digital Elevation Data for Geographic Information System Analysis. Photogramm Eng. Remote Sens 54 (11), 1593–1600.
John Wilson, J. S., Chandrasekar, N., and Magesh, N. S. (2012). Morphometric Analysis of Major Sub Watersheds in Aiyar & Karai Pottanar Basin, Central Tamil Nadu, India Using Remote Sensing & GIS Techniques. Bonfring Int. J. Ind. Eng. Manag. Sci. 2 (special issue 1), 8–15. doi:10.9756/BIJIEMS.1403
Joseph Markose, V., Dinesh, A. C., and Jayappa, K. S. (2014). Quantitative Analysis of Morphometric Parameters of Kali River basin, Southern India, Using Bearing Azimuth and Drainage (bAd) Calculator and GIS. Environ. Earth Sci. 72, 2887–2903. doi:10.1007/s12665-014-3193-x
Kanhaiya, S., Singh, B. P., Singh, S., Mittal, P., and Srivastava, V. K. (2018). Morphometric Analysis, Bedload Sediments, and Weathering Intensity in the Khurar River Basin, Central India. Geol. J. 54, 466–481. doi:10.1002/gj.3194
Kanhaiya, S., Singh, S., Singh, C. K., Srivastava, V. K., and Patra, A. (2019a). Geomorphic Evolution of the Dongar River Basin, Son Valley, Central India. Geology. Ecology, Landscapes 3 (1), 269–281. doi:10.1080/24749508.2018.1558019
Kanhaiya, S., Singh, S., Singh, C. K., and Srivastava, V. K. (2019b). Pothole: a Unique Geomorphological Feature from the Bedrocks of Ghaghghar River, Son valley, India. Geology. Ecology, Landscapes 3 (4), 258–268. doi:10.1080/24749508.2018.1558018
Kannan, R., Venkateswaran, S., Vijay Prabhu, M., and Sankar, K. (2018). Drainage Morphometric Analysis of the Nagavathi Watershed, Cauvery River basin in Dharmapuri District, Tamil Nadu, India Using SRTM Data and GIS. Data in Brief 19, 2420–2426. doi:10.1016/j.dib.2018.07.016
Krishnamurthy, J., Srinivas, G., Jayaram, V., and Chandrasekher, M. G. (1996). Influence of Rock Type and Structure in the Development of Drainage Networks in Typical Hard Rock Terrain. Int. J. Appl. Earth Observation Geoinformation 3/4 (3), 252–259.
Krishnan, M. S. (1942). Bauxite in the Shevaroy Hills, Salem District, Madras State. Rec. Geol. Surv. India 77, 2.
Kumar, A., and Pandey, R. N. (1981). Morphometric Analysis of Some Drainage Basins of the Hazaribagh Plateau Region. Natl. Geographical. J India 27 (Part 1 and 2), 50–57.
Langbein, W. B. (1947). Topographic Characteristics of Drainage Basins. U.S. Geol. Surv. Water-supply Paper 986 (C), 157–159.
Magesh, N. S., Chandrasekar, N., and Soundranayagam, J. P. (2011). Morphometric Evaluation of Papanasam and Manimuthar Watersheds, Parts of Western Ghats, Tirunelveli District, Tamil Nadu, India: a GIS Approach. Environ. Earth Sci. 64 (2), 373–381. doi:10.1007/s12665-010-0860-4
Magesh, N. S., Jitheshlal, K. V., Chandrasekar, N., and Jini, K. V. (2012). GIS Based Morphometric Evaluation of Chimmini and Mupily Watersheds, Parts of Western Ghats, Thrissur District, Kerala, India. Earth Sci. Inform. 5 (2), 111–121. doi:10.1007/s12145-012-0101-3
Mahadevaswamy, G., Nagaraju, D., Siddalingamurthy, S., Lakshmamma, M. S. L., Nagesh, P. C., and Rao, K. (2011). Morphometric Analysis of Nanjangud Taluk, Mysore District, Karnataka, India, Using GIS Techniques. Int. J. Geomat Geosci. 1, 179–187.
Melton, M. A. (1958). Correlation Structure of Morphometric Properties of Drainage Systems and Their Controlling Agents. J. Geology. 66, 442–460. doi:10.1086/626527
Merritts, D., and Vincent, K. R. (1989). Geomorphic Response of Coastal Streams to Low, Intermediate, and High Rates of Uplift, Medocino Triple junction Region, Northern California. Geol. Soc. Am. Bull. 101, 1373–1388. doi:10.1130/0016-7606(1989)101<1373:grocst>2.3.co;2
Mesa, L. M. (2006). Morphometric Analysis of a Subtropical Andean basin (Tucumán, Argentina). Environ. Geol. 50 (8), 1235–1242. doi:10.1007/s00254-006-0297-y
Miller, V. C. (1953). A Quantitative Geomorphic Study of Drainage basin Characteristics in the Clinch Mountain Area, Virginia and Tennessee. New York: Columbia University, Department of Geology, ONR. Proj, NR 389-402, Tech rep 3 https://agris.fao.org/agris-search/search.do?recordID=US201400058936.
Muller, J. E. (1968). An Introduction to the Hydraulic and Topographic Sinuosity Indexes. Ann. Assoc. Am. Geogr. 58, 371–385. doi:10.2307/212449
Muralikrishnan, S., Pillai, A., Narender, B., Reddy, S., Venkataraman, V. R., and Dadhwal, V. K. (2013). Validation of Indian National DEM from Cartosat-1 Data. J. Indian Soc. Remote Sens 41 (1), 1–13. doi:10.1007/s12524-012-0212-9
Nag, S. K., and Chakraborty, S. (2003). Influence of Rock Types and Structures in the Development of Drainage Network in Hard Rock Area. J. Indian Soc. Remote Sens 31 (1), 25–35. doi:10.1007/bf03030749
Nag, S. (1998). Morphometric Analysis Using Remote Sensing Techniques in the Chaka Sub-Basin, Purulia District, West Bengal. J. Indian Soc. Remote Sens 26 (1&2), 69–76. doi:10.1007/BF03007341
Nantiyal, M. D. (1940). Morphometric Analysis of a Drainage basin, District Dehradun, Uttar Pradesh. J. Indian Soc. Remote Sensing 22 (4), 251–261.
NRSA (1989). Manual of Nationwide Land Use/Land Cover Mapping Using Satellite Imagery, Part – I. Hyderabad: National Remote Sensing AgencyHyderabad Publication.
Obi Reddy, G. E., Maji, A. K., and Gajbhiya, K. S. (2002). GIS for Morphometric Analysis of Drainage Basins. GIS India 11 (4), 9–14.
Oguchi, T. (1997). Drainage Density and Relative Relief in Humid Steep Mountains with Frequent Slope Failure. Earth Surf. Process. Landforms 22, 107–120. doi:10.1002/(sici)1096-9837(199702)22:2<107::aid-esp680>3.0.co;2-u
Ohmori, H. (1993). Changes in the Hypsometric Curve through Mountain Building Resulting from Concurrent Tectonics and Denudation. Geomorphology 8, 263–277. doi:10.1016/0169-555x(93)90023-u
Ozdemir, H., and Bird, D. (2009). Evaluation of Morphometric Parameters of Drainage Networks Derived from Topographic Maps and DEM in point of Floods. Environ. Geol. 56, 1405–1415. doi:10.1007/s00254-008-1235-y
Pirasteh, S., Safari, H. O., Pradhan, B., and Attarzadeh, I. (2010). Litho Morphotectonics Analysis Using Landsat ETM Data and GIS Techniques: Zagros Fold Belt (ZFB), SW Iran. Int. Geoinformatics Res. Develop. J. 1, 28–36.
Prakash, K., Rawat, D., Singh, S., Chaubey, K., Kanhaiya, S., and Mohanty, T. (2019). Morphometric Analysis Using SRTM and GIS in Synergy with Depiction: a Case Study of the Karmanasa River basin, North central India. Appl. Water Sci. 9, 13. doi:10.1007/s13201-018-0887-3
Qadir, A., Yasir, M., Abir, I. A., Akhtar, N., and San, L. H. (2021). Quantitative Morphometric Analysis Using Remote Sensing and GIS Techniques for Mandakini River Basin. IOP Conf. Ser. Earth Environ. Sci. 540, 012021. doi:10.1088/1755-1315/540/1/012021
Rai, P. K., Mohan, K., Mishra, S., Ahmad, A., and Mishra, V. N. (2017). A GIS-Based Approach in Drainage Morphometric Analysis of Kanhar River Basin, India. Appl. Water Sci. 7, 217–232. doi:10.1007/s13201-014-0238-y
Raith, M., and Srikantappa, C. (2007). Arrested Charnockite Formation at Kottavattom, Southern India. J. Meta. Geol. 11, 815–832. doi:10.1111/j.1525-1314.1993.tb00192.x
Rajesh, H. M., and Santosh, M. (2004). Charnockitic Magmatism in Southern India. J. Earth Syst. Sci. 113 (4), 565–585. doi:10.1007/BF02704023
Reddy, G. P. O., Maji, A. K., and Gajbhiye, K. S. (2004). Drainage Morphometry and its Influence on Landform Characteristics in a Basaltic Terrain, Central India - a Remote Sensing and GIS Approach. Int. J. Appl. Earth Observation Geoinformation 6, 1–16. doi:10.1016/j.jag.2004.06.003
Rekha, V. B., George, A. V., and Rita, M. (2011). Morphometric Analysis and Micro-watershed Prioritization of Peruvanthanam Sub-watershed, the Manimala River Basin, Kerala, South India. Environ. Res. Eng. Manag. 57 (3), 6–14. doi:10.5755/j01.erem.57.3.472
Satheeshkumar, S., and Venkateswaran, S. (2018). Predilection of Sustainable Recharge Structures Using Morphometric Parameters and Decision Making Model in the Vaniyar Sub basin, South India. Appl. Water Sci. 8, 213. doi:10.1007/s13201-018-0844-1
Schumm, S. A. (1956). Evolution of Drainage Systems and Slopes in Badlands at Perth Amboy, New Jersey. Geol. Soc. America Bull. 67, 597–646. doi:10.1130/0016-7606(1956)67[597:eodsas]2.0.co;2
Schumm, S. A. (1963). Sinuosity of Alluvial Rivers on the Great Plains. Geol. Soc. America Bull. 74, 1089–1100. doi:10.1130/0016-7606(1963)74[1089:soarot]2.0.co;2
Shreve, R. L. (1969). Stream Lengths and basin Areas in Topologically Random Channel Networks. J. Geology. 77, 397–414. doi:10.1086/628366
Singh, K. N. (1980). Quantitative Analysis of Landforms and Settlement Distribution in Southern Uplands of Eastern Uttar Pradesh (India). Varanasi: Vimal Prakashan.
Singh, S. (1995). Quantitative Analysis of Watershed Geomorphology Using Remote Sensing Techniques. Ann. Arid Zone 34 (4), 243–251.
Singh, S. (1992). “Quantitative Geomorphology of the Drainage basin,” in Readings on Remote Sensing Applications. Editors T. S. Chouhan, and K. N. Joshi (Jodhpur: Scientific Publishers).
Singh, S., and Singh, M. C. (1997). Morphometric Analysis of Kanhar River basin. Natl. Geographical J. lndia 43 (1), 31–43.
Singh, S., Kanhaiya, S., Singh, A., and Chaubey, K. (2018a). Drainage Network Characteristics of the Ghaghghar River Basin (GRB), Son Valley, India. Geology. Ecology, Landscapes 3, 159–167. doi:10.1080/24749508.2018.1525670
Singh, S., Kumar, S., Mittal, P., Kanhaiya, S., Prakash, P., and Kumar, R. (2018b). Drainage Basin Parameters of Bagh River, a Sub-basin of Narmada River, Central India: Analysis and Implications. J. Appl. Geochem. 20 (1), 91–102.
Singh, W. R., Barman, S., and Tirkey, G. (2021). Morphometric Analysis and Watershed Prioritization in Relation to Soil Erosion in Dudhnai Watershed. Appl. Water Sci. 11, 151. doi:10.1007/s13201-021-01483-5
Smith, B., and Sandwell, D. (2003). Accuracy and Resolution of Shuttle Radar Topography mission Data. Geophys. Res. Lett. 30 (9), 20–21. doi:10.1029/2002gl016643
Smith, K. G. (1950). Standards for Grading Texture of Erosional Topography. Am. J. Sci. 248 (9), 655–668. doi:10.2475/ajs.248.9.655
Soil Survey Manual IARI (1970). Soil Survey Manual IARI. New Delhi: Ministry of Agriculture, Government of India. https://www.nrcs.usda.gov/Internet/FSE_DOCUMENTS/nrcseprd1335011.pdf.
Sreedevi, P. D., Subrahmanyam, K., and Ahmed, S. (2005). The Significance of Morphometric Analysis for Obtaining Groundwater Potential Zones in a Structurally Controlled Terrain. Env Geol. 47 (3), 412–420. doi:10.1007/s00254-004-1166-1
Srinivasa Vittala, S., Govindaiah, S., and Honne Gowda, H. (2004). Morphometric Analysis of Sub-watersheds in the Pavagada Area of Tumkur District, South India Using Remote Sensing and Gis Techniques. J. Indian Soc. Remote Sens 32 (4), 351–362. doi:10.1007/bf03030860
Strahler, A. N. (1957). Quantitative Analysis of Watershed Geomorphology. Trans. AGU 38, 913–920. doi:10.1029/tr038i006p00913
Strahler, A. N. (1964). “Quantitative Geomorphology of Drainage Basins and Channel Networks,” in Handbook of Applied Hydrology. Editor V. T. Chow (New York: McGraw Hill Book Company). section 4.
Subramaniam, A. P. (1967). Charnockites and Granulites of Southern India - A review. Medd. Fra. Dansk. Geo. Gorening 17, 473–493.
Subramanian, K. S., and Mani, G. (1979). Geomorphic Significance of Lateritic Bauxite in the Shevarory and Kollaimalai Hills, Salem District, Tamil Nadu, Jour. Geol. Soc. India 20 (6), 282–289. http://www.geosocindia.org/index.php/jgsi/article/view/64551.
Wilus, B., (1936). Studies in Comparative Seismology: East African Plateaus and Rift Valleys. Washington, Carnegie Institution of Washington. 358p.
Nomenclature
A Area of the sub-basin in km2
AIS and LUS All India Soil and Land Use Survey
DEM digital elevation model
Dd Drainage density
Dt Drainage texture
ERDAS Earth Resources Data Analysis System
Fs Stream Frequency
FCC False color composite
GCP Ground Control Points
GIS Geography Information System
IF Infiltration number
IRS Indian Remote Sensing
Lb Length of the Sub-basin in Km
Lg Length of over land flow
LISS Linear Imaging Self-Scanning Sensor
Lu Total Stream Length in km
Km Kilometer
MSL Mean Sea Level
Nu Total Number of the stream
P Perimeter of the Sub-basin in Km
PAN Panchromatic
RL Stream length ratio,
Rb Bifurcation ratio
Rc Circularity ratio
Rf Form factor Form factor
Dt Drainage texture
Re Elongation ratio
Rc Circularity ratio
Rf Form factor
SoI topographical maps Survey of India topographical maps
Soil Survey Manual IARI 1970 Indian Agricultural Research Institute
Z Maximum height of the basin.
z Minimum height of the basin
H Total Relief
Rh Relief ratio
Rr Relative Relief ratio
Rg Gradient ratio
Rn Ruggedness Number
Rs Shape factor ratio
Keywords: precipitation, runoff, sub-basin, linear, aerial, relief
Citation: Suresh S and Krishnan P (2022) Morphometric Analysis on Vanniyar Basin in Dharmapuri, Southern India, Using Geo-Spatial Techniques. Front. Remote Sens. 3:845705. doi: 10.3389/frsen.2022.845705
Received: 30 December 2021; Accepted: 05 April 2022;
Published: 02 June 2022.
Edited by:
Cláudia Maria Almeida, National Institute of Space Research (INPE), BrazilReviewed by:
Sucheta Mukherjee, Sripat Singh College, IndiaShyam Kanhaiya, Veer Bahadur Singh Purvanchal University, India
Copyright © 2022 Suresh and Krishnan. This is an open-access article distributed under the terms of the Creative Commons Attribution License (CC BY). The use, distribution or reproduction in other forums is permitted, provided the original author(s) and the copyright owner(s) are credited and that the original publication in this journal is cited, in accordance with accepted academic practice. No use, distribution or reproduction is permitted which does not comply with these terms.
*Correspondence: S. Suresh, sansuresh86@yahoo.co.in, sankarsuresh86@gmail.com
 S. Suresh
 P. Krishnan2