 Yixuan Wang
 Bo Du1,2
 Richard H. Y. So
- 1Department of Industrial Engineering and Decision Analytics, The Hong Kong University of Science and Technology, Hong Kong, China
- 2Bio-Engineering Graduate Program, School of Engineering, The Hong Kong University of Science and Technology, Hong Kong, China
- 3Incus Company Limited, Hong Kong Science Park, Hong Kong, China
Visually induced circular vection (CV) has been the subject of a wide range of functional brain and behavioral research. Participants in MRI or PET studies on CV were mostly in a supine viewing position, while participants in behavioral studies on CV were mostly in an upright viewing position. This study examines the effects of viewing positions (upright and supine) on roll CV reported by 16 participants while watching random dots (92 × 60 degrees field-of-view) rotating at different angular velocities (2, 4, 8, 16, 32, 64 deg/s) for 30 s. Viewing positions affected roll CV durations differently depending on the stimulation velocities. At slower velocities (2, 4, and 8 deg/s), participants exhibited significantly longer roll CV sensations when they were sitting in an upright position as opposed to lying in a supine position. The onset of roll CV was also significantly earlier with participants in an upright position despite similar roll CV intensities in both viewing positions. Significant two-way interactions between effects of viewing positions and dot rotating velocities for some conditions were noted. Consistency between current findings and the hypothesis predicting a weaker roll CV in upright positions based upon perceived gravity by the otolith organs is discussed.
Introduction
Watching a wide, coherently moving scene can stimulate an illusion of self-motion in the opposite direction known as vection (Dichgans and Brandt, 1978; Hettinger et al., 2014; Palmisano et al., 2015). A common example of vection is the “train illusion.” When passengers sitting in a stationary train watch a neighboring train moving, they often have the compelling sensation that their train is moving in the opposite direction while the neighboring train appears to be stationary. Vection is also a common perception experienced by virtual reality users. For those users who are susceptible to visually induced motion sickness (VIMS), the same moving scenes that can provoke vection have been reported to provoke VIMS and/or cybersickness (Hettinger et al., 1990; So et al., 2001; Smart Jr et al., 2002).
According to its moving direction, vection can be further classified as linear vection (Giannopulu and Lepecq, 1998; Trutoiu et al., 2009; Chen et al., 2016) or circular vection (CV) (Young et al., 1975; Allison et al., 1999; Ji et al., 2009). The occurrence of vection involves inputs from visual, vestibular, proprioceptive, and other somatosensory organs (Dichgans and Brandt, 1978; Warren and Wertheim, 1990). In particular, the vestibular system and visual system play a leading role in the perception of vection (Benson et al., 1986; Brandt et al., 1998; Deutschländer et al., 2004). As the human vestibular system responds to acceleration, changing the head orientation relative to the direction of the gravitational force may affect the levels of perceived vection.
CV has been the focus of many behavioral studies. Earlier research utilized CV as a tool to study the effect of gravity on visual vestibular interaction (Young et al., 1986a,b; Cheung and Howard, 1990; Young and Shelhamer, 1990). Viewing positions were found to affect both CV and the sensations of tilt (Young et al., 1975). An explanation related to otoliths was given. Specifically, if otolith responses to gravitational acceleration conflict with any perceived CV, sensations of CV will be suppressed. This suggests weaker roll CV to be perceived when participants adopt an upright viewing position as compared to a supine position. A review of literature indicates that most behavioral studies on vection instructed their participants to observe visual stimulation only in upright positions (Kim and Khuu, 2014; Chen et al., 2016; Palmisano and Riecke, 2018; Keshavarz et al., 2019; Fujimoto and Ashida, 2020; Weech et al., 2020). Specifically, most past research on effects of velocity on CV only asked participants to adopt an upright viewing position (Brandt et al., 1973; Held et al., 1975; Ujike et al., 2004). This is understandable as vection-provoking stimuli typically appear from VR applications that are usually viewed in upright positions. However, many PET and MRI studies on vection were conducted with participants in supine viewing positions due to constraints of the scanners (Brandt et al., 1998; Kleinschmidt et al., 2002; Cardin et al., 2012; Uesaki and Ashida, 2015). The use of different viewing positions aggravates the challenge of integrating their findings given the existing differences in research methodology (Berti and Keshavarz, 2020). In particular, if the viewing position does affect CV sensations, its effects and the interactions with other factors influencing CV should be investigated.
Unfortunately, there is a gap in the research on exactly how viewing position affects roll CV. Young et al. (1975) studied the tilt sensation of participants when they watched random rectangles rotating at different velocities (5–60 deg/s) in different viewing positions: upright; head-inverted (“upside-down”); head forward 25 degrees and head tilted to the right. They noted that when a participant was asked to tilt the head forwards at an angle of 25 degrees, the perceived tilting sensation was reduced (Young et al., 1975). The phenomenon was explained by the alignment between the dominant plane of utricular otolith and the earth-horizontal plane. It was suggested that by aligning the two planes, otolith responses to the gravity might have been maximized and they suppressed the visually induced roll CV. Their results supported a conclusion that visually induced tilt depended on head orientation; however, their study did not investigate actual effects of a supine viewing position. In later investigations concerning weightlessness in space flights, effects of viewing visual roll stimulation in both supine and upright positions were examined (Young et al., 1986b; Young and Shelhamer, 1990). As the space flight research focused on gravity conditions, there was limited comparison between data collected in supine and upright positions. Nonetheless, the presence of gravity was shown to suppress roll CV sensation in both viewing positions and the suppression effect was stronger in upright positions. This led to the hypothesis that if gravitation vestibular cues were in conflict with roll CV sensations, the latter would be suppressed. As such, roll CV experienced in a supine position should be more robust than that experienced in an upright position because there was less suppression from the otolith cues in the supine position. It can be hypothesized that, given all conditions equal, roll CV in an upright position will be weaker than that in a supine position. Cheung and Howard (1990) compared the CV magnitude provoked by random dots rotating at 45 deg/s among participants in a supine and an upright position experiencing microgravity, hypergravity and normal gravity. From the reported results from all gravity conditions, the average roll CV intensity measured in the supine position was slightly higher than that in the upright position; however, statistical comparison was not reported (Cheung and Howard, 1990). Tanahashi et al. (2012) examined the effects of body positions (supine, left lateral recumbent and sitting upright) on CV induced by viewing scenes rotating in roll, yaw, and pitch axes at a constant angular velocity of 60 deg/s. Their results indicated that the reported intensity of roll CV was higher when participants were in an upright position than that in a supine position, which conflicts with the prediction from our hypothesis.
In this paper, we report our studies and comparisons of roll CV perception when participants were viewing dots rotating in different velocities and in an upright and a supine viewing position. Possible two-way interactions between the effects of viewing positions and stimuli velocities are examined.
Methods
The experiment was approved by the Human Research Ethics Committee of the Hong Kong University of Science and Technology and written consents were obtained from all participants.
Participants
Sixteen healthy university students (five females, 11 males) aged between 22 and 26 years old (mean = 24, SD = 1.1) participated in the experiment. All participants had normal or corrected-to-normal. The sample size was supported by a power analysis based on data reported by Tanahashi et al. (2012) and is compatible with past studies on vection (Chen et al., 2016: n = 13; Palmisano and Riecke, 2018: n = 16; Tanahashi et al., 2012: n = 7, 4, and 4).
Apparatus and Stimulus
Figures 1, 2 illustrate the experimental setup and the stimulus. The random-dot pattern was adapted from Brandt et al. (1998). This stimulus has been commonly used in functional brain studies of CV (Deutschländer et al., 2004; Antal et al., 2008; Reinhart et al., 2016) and has been shown to induce visually induced motion sickness among participants who viewed the stimulus for 20 min (Zhao, 2017). The random-dot pattern had a total of 839 black dots of sizes ranging from 0.6 to 1.6 degrees on a light-gray background and with a dark-gray central disk for eye fixation. All participants followed the eye fixation instruction as their eye gazes, measured by an EyeTech TM3 eye monitoring system, fell within the area of the dark-gray fixation disk for all trials. The random-dots rotated in the counter-clockwise direction according to the assigned velocity. During the resting condition, only the light-gray background and the dark-gray central disk were shown and the pattern remained stationary. Each condition consisted of a 30 s stimulus period followed by a 20 s resting period. The movement of the stimulus pattern, displayed on the 46-inch LCD monitor, was controlled by a C++ program using OpenGL libraries running on a PC with GPU. The field-of-view of the stimuli was 92 degrees horizontally and 60 degrees vertically and the viewing distance was maintained at 50 cm from the center of LCD monitor. A key pad was used to collect responses from the participants. All experiments were conducted in the absence of any light sources.
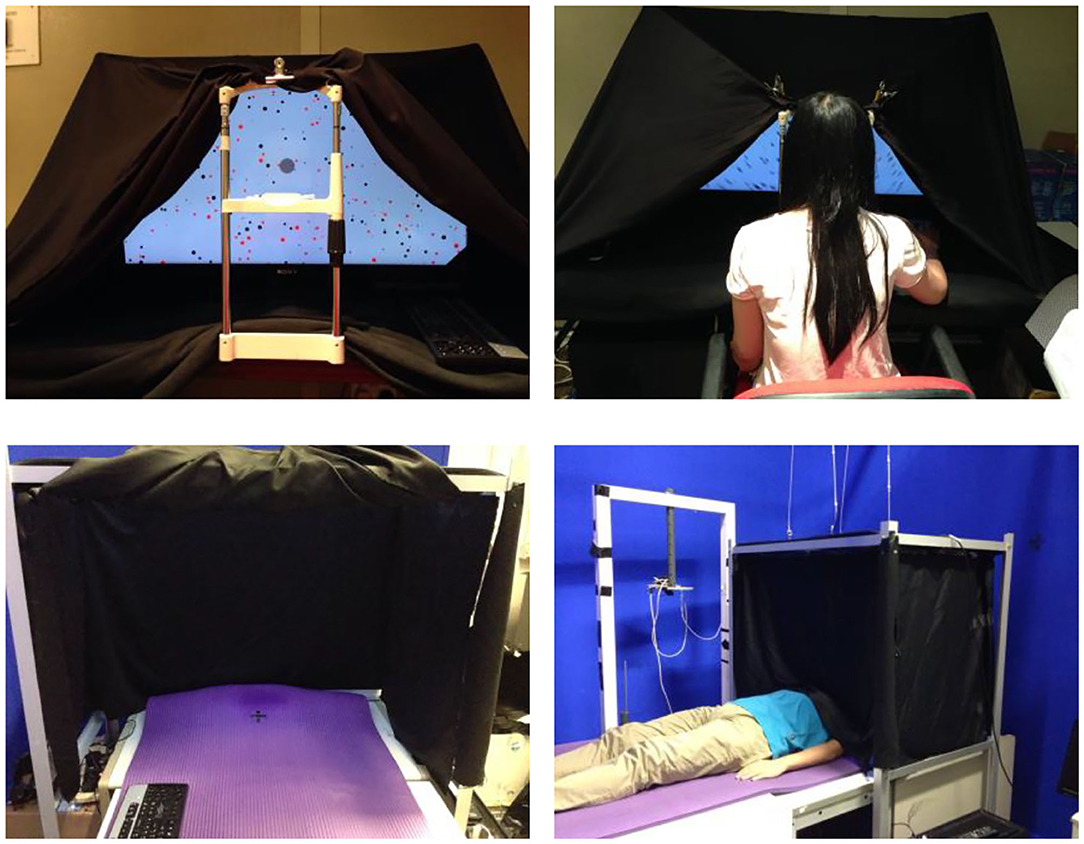
Figure 1. (Top left) A photo of the apparatus when participants were in the upright positions; (top right) a photograph of a participant in the upright position. The light would be off during the experiment); (bottom left) a photograph of the apparatus when participants were in supine positions; and (bottom right) a photograph of a participant in a supine position. The light would be turned off during the experiment.
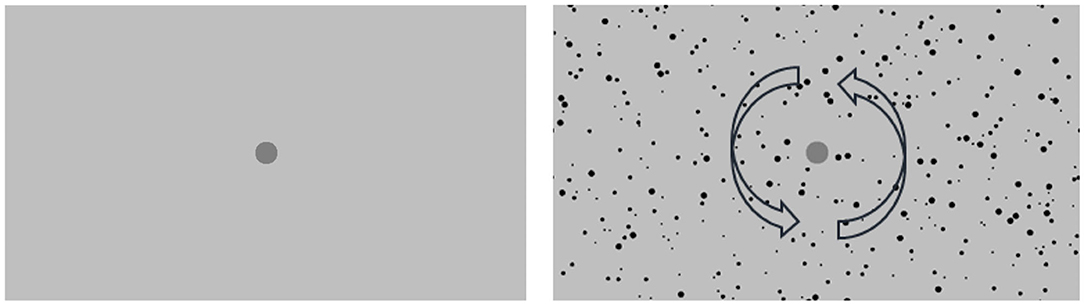
Figure 2. Snap shots of the stimulus in the resting period (left) and in the stimulus condition (right), in which the arrows do not show during the experiment and just indicate the rotation direction of the dots pattern.
Experimental Design
A within-subject design was adopted. Exhaustive combinations of six velocity levels (2, 4, 8, 16, 32, 64 degree/s), two viewing positions (upright, supine); and six repeated trials were tested in the experiment. A total of 72 conditions (six velocities × two positions × six repeats) were presented over two separate days, with 36 conditions (six velocities × six repeats) for the same viewing positions on a single day. To minimize possible fatigue, the six trials were separated into six sessions with a 5-min break between each session. Within one session, the order of presenting the six velocity conditions was randomized. The order of presenting the position was counterbalanced so that half of the participants were in a supine viewing position first while the remaining were in an upright viewing position first. The separation of the two exposure days ranged from 3 to 6 days.
Procedures and Measurements
Two training sessions, one for each viewing position, were conducted to acquaint participants with the instructions and the experimental tasks. Participants were given 5 min to adapt to the darkness. Studies have shown that auditory motion cues can affect CV sensation (Campos et al., 2018). In order to control the auditory environment, each participant worn a pair of sponge earplugs (NRR value: 29 dB) to block out background noise.
During the experiment, participants were required to stare at the dark-gray central disk from the outset to the end. During the period of watching rotating dots, participants needed to keep pressing the key “a” or “b” to give an assessment of roll CV intensity as soon as they experienced any sensations of self-motion (“a”: participants feel both object and self-motion; “b”: participants feel only self-motion). Either pressing “a” or “b” was taken as a vection status, and pressing “b” was additionally recorded as full CV status (full-CV). No keypress indicated no sensation of CV. In subsequent analysis, we focused on CV (both “a” and “b” pressing) including both full CV and non-full CV. During the period of resting, no keypress was required but they needed to verbally report the CV intensity to the experimenter using a scale from 1 to 5 (Table 1). Between sessions, participants were allowed to have a 5-min rest. All six sessions were conducted consecutively on 1 day.
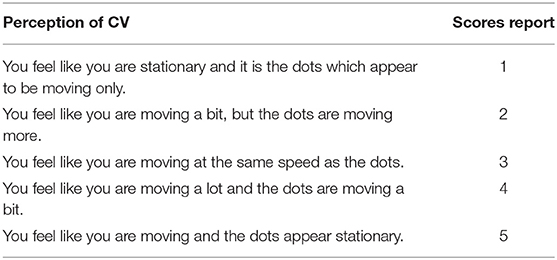
Table 1. Scaling of 5-level vection rating (Webb and Griffin, 2003).
The keypress data were analyzed to extract CV onset time, accumulated CV duration, average CV duration, and CV frequency. Each continuing roll CV sensation reported however short was counted as one occurrence of CV sensation. Average CV duration was the average of the duration of each CV occurrence per participant per condition. Accumulated CV duration was calculated by the sum of intermittent duration in each stimulus condition (30 s). Similarly, the CV frequency referred to the number of times the participant experienced roll CV during each condition. For example, during a 30 s stimulation, if a participant reported roll CV from the 10th second to the 13th second and from the 20th second to the 22nd second, the CV frequency would be two, while the average and accumulated CV durations for this trial would be 2.5 and 5 s, respectively.
Data Analysis
Nonparametric statistical analyses were conducted since the data violated the normality assumption (Shapiro-Wilk test, p < 0.05). More specifically, analysis of variance of Aligned Rank Transformed (ART) data was used (ARTool: Wobbrock et al., 2011) to study the effects of viewing position, stimulation velocity and their two-way interactions. Friedman test and pairwise Wilcoxon Signed Ranks test were also used to analyze the effects of velocity and position. Post hoc analysis with Bonferroni correction was applied to address the multiple comparison problem. The data analysis software R 3.2.3 with package ARTool and IBM SPSS Statistics v26 were used.
Results
Effects of repeated trials were significant on accumulated CV duration [F(5,75) = 2.316, p = 0.042], CV frequency [F(5,75) = 2.352, p = 0.039] and CV onset time [F(5,75) = 2.917, p = 0.013]. When the first three trials were removed, the effects of repeated trials were not significant. For subsequent analyses, data collected in the last three trials were averaged to give better mean estimations. The median CV measurements collected in two viewing positions and six velocity conditions are shown in Figure 3 with inter-quartile ranges. In the following sections, main effects of position and velocity and their interaction effects will be examined by ART ANOVA first followed by additional analysis.
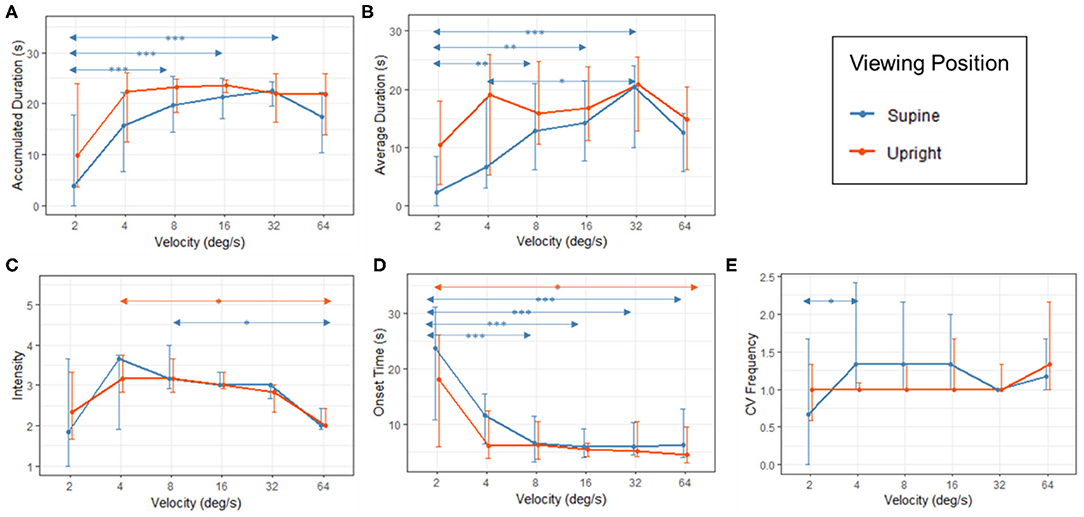
Figure 3. Results of (A) accumulated CV duration; (B) average duration of CV; (C) CV Intensity; (D) onset time of CV and (E) CV frequency in the supine (red) and upright (blue) viewing positions. The values for median, 1st quartile and 3rd quartile were calculated based on the means collected from the last three trials of 16 participants. Statistically significant pairwise comparison results (with Bonferroni correction) were labeled with arrows and asterisks (*p < 0.05; **p < 0.01; ***p < 0.001).
Analysis of Variance With Aligned Rank Transform
Results of repeated measures two-way ART ANOVA indicated that the overall interaction effects between viewing position and stimulation velocity were not significant among all five roll CV measurements (Table 2).
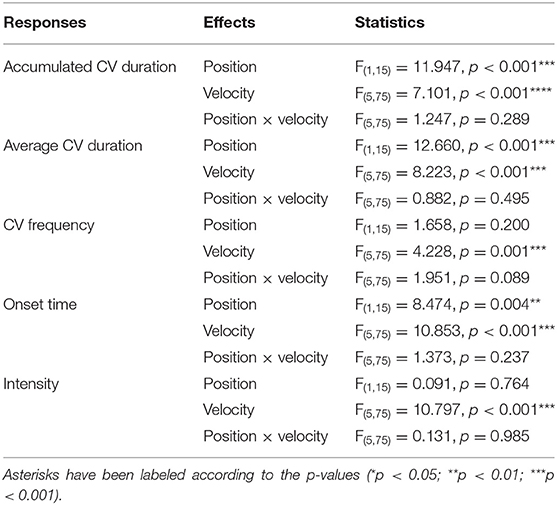
Table 2. Results of ART ANOVA on roll CV measurements.
With repeated measures two-way ART ANOVA on roll CV measurements, significant main effects of position were revealed on accumulated CV duration, average CV duration and onset time of CV (Table 2). The roll CV durations in an upright viewing position were generally longer than those in a supine viewing position. In a supine viewing position, the participants perceived roll CV later than when they were in an upright viewing position.
The main effects of stimulation velocity over the two viewing positions were found to be significant for all five roll CV measurements: accumulated CV duration, averaged CV duration, CV frequency, onset time, CV intensity (Table 2). Post hoc analyses with Bonferroni adjustment on stimulation velocity levels were conducted to investigate the differences between each pair of stimulation velocities. Both accumulated and average CV duration reported in the 2 deg/s stimulation condition were shorter than those reported in conditions using higher stimulation velocities (accumulated CV duration: 2 and 8 deg/s, p < 0.001; 2 and 16 deg/s, p < 0.001; 2 and 32 deg/s, p < 0.001; 2 and 64 deg/s, p = 0.016; average CV duration: 2 and 8 deg/s, p = 0.001; 2 and 16 deg/s, p < 0.001; 2 and 32 deg/s, p < 0.001). Significantly shorter average duration was reported when participants were exposed to a stimulation velocity of 4 deg/s as compared to a stimulation velocity of 32 deg/s (4 and 32 deg/s, p = 0.018). Furthermore, more frequent CV occurrence and longer CV onset time were reported in conditions with a stimulation velocity of 2 deg/s than those reported in other velocity conditions (CV frequency: 2 and 4 deg/s, p = 0.017; 2 and 8 deg/s, p = 0.025; 2 and 16 deg/s, p = 0.016; 2 and 64 deg/s, p = 0.005; onset time: 2 and 4 deg/s, p = 0.026; 2 and 8 deg/s, p < 0.001; 2 and 16 deg/s, p < 0.001; 2 and 32 deg/s, p < 0.001; 2 and 64 deg/s, p < 0.001). As to CV intensity, stimulation conditions with a velocity of 2 or 64 deg/s resulted in significantly weaker roll CV than those with a velocity of 4, 8 and 16 deg/s (2 and 4 deg/s, p = 0.016; 2 and 8 deg/s, p = 0.003; 2 and 16 deg/s, p = 0.040; 64 and 4 deg/s, p < 0.001; 64 and 8 deg/s, p < 0.001; 64 and 16 deg/s, p < 0.001). In addition, CV intensity reported in conditions with a stimulation velocity of 32 deg/s was stronger than that reported in conditions with a stimulation velocity of 64 deg/s (32 and 64 deg/s, p = 0.028). In summary, significantly shorter CV durations, longer onset time and smaller CV frequency were reported in conditions with a stimulation velocity of 2 deg/s. Participants reported the highest CV intensity when watching the stimuli rotating at 8 deg/s.
Further Analysis
In the analysis results reported in section Analysis of Variance With Aligned Rank Transform, the overall interactions between effects of viewing positions and stimulation velocities were not significant. However, the absence of significant interaction is not consistent with Figure 3. Data curves collected from two viewing positions are not parallel to each other (Figure 3). To substantiate the observation, we analyze the main effects of stimulation velocity on data collected in different viewing positions separately. If there is a trend of interaction, the two main effects would be different. In addition, we grouped the data into low velocity (2, 4, and 8 deg/s) subgroup and high velocity (16, 32, and 64 deg/s) subgroup for further analyses of interactions (Figure 4).
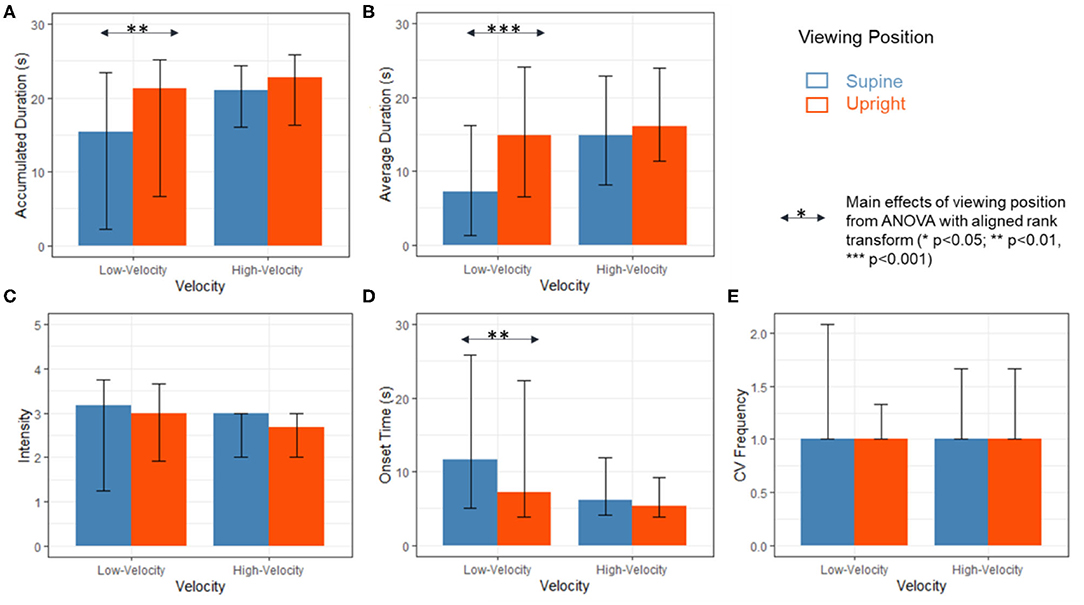
Figure 4. Results of (A) accumulated CV duration; (B) average duration of CV; (C) CV Intensity; (D) onset time of CV and (E) CV frequency provoked by low-velocity stimuli (2, 4, and 8 deg/s) and high-velocity stimuli (16, 32, and 64 deg/s) in the supine (red) and upright (blue) viewing positions. The values for median, 1st quartile and 3rd quartile were calculated based on the means collected from the last three trials of 16 participants. Significant main effects of viewing position from ART ANOVA were labeled with arrows and asterisks (*p < 0.05; **p < 0.01; ***p < 0.001).
Effects of Stimulation Velocity on Roll CV Reported in the Upright and Supine Positions
Results of Friedman tests on five roll CV measurements in upright conditions indicated significant main effects of velocity on CV intensity [χ2 (5) = 14.495, p = 0.013] and CV onset time [χ2 (5) = 19.698, p = 0.001]. Post hoc pairwise comparisons with Bonferroni correction found that the CV intensities at 4 and 64 deg/s were significantly different (p = 0.032). The onset time of roll CV induced by stimulation with a velocity of 2 deg/s was significantly longer than that of 64 deg/s (p = 0.001). For CV frequency, the velocity was only marginally significant [χ2 (5) = 10.982, p = 0.052] and it was not significant on CV durations (Accumulated CV duration: [χ2 (5) = 8.113, p = 0.150]; average CV duration: [χ2 (5) = 9.064, p = 0.107]). It should be noted that accumulated durations of roll CV remained long for most stimulation velocities (Figure 3: 20–24 s within the 30 s exposure for 4, 8, 16, 32, and 64 deg/s). Such a CV duration can be considered long and might have reached their ceiling levels because after adding the median onset times of 6 s (Figure 3), the total ranged from 26 to 30 s. This suggests little room for accumulated CV duration to increase further. For the condition at 2 deg/s, although the accumulated CV duration for the upright position was shorter (median: 10 s), the corresponding median onset time was significantly longer at 18 s and the sum of both reached 28 s. In other words, the lack of velocity effects should not be misinterpreted as lack of roll CV sensation. Rather, the insensitive to stimulation velocity could have been due to ceiling effect.
When participants adopted the supine position, roll CV measurements were much affected by stimulation velocity. Results of Friedman tests showed significant main effects of velocity on all five roll CV measurements: accumulated CV duration [χ2 (5) = 28.080, p < 0.001], average CV duration [χ2 (5) = 30.348, p < 0.001], CV frequency [χ2 (5) = 15.426, p = 0.009], CV intensity [χ2 (5) = 14.435, p = 0.013] and CV onset time [χ2 (5) = 37.138, p < 0.001]. From Figure 3, when participants viewed the roll CV provoking stimuli in the supine position, all roll CV measurements except onset time exhibited significant inverted-U shaped profiles as the velocity of the stimuli increased. Pairwise comparisons with Bonferroni correction showed that, as the velocity of the rotating dots increased from 2 to 32 deg/s, CV durations (both average and accumulated) increased significantly (Figures 3A,B). For CV intensity, the peak occurred at 8 deg/s (Figure 3C). As stimulation velocity increased, CV onset time reduced (Figure 3D). and CV frequency significantly increased when stimulation velocity switching from 2 to 4 deg/s (Figure 3E).
In summary, as stimulation velocity increased from 2 to 64 deg/s, reported roll CV became stronger, longer and with quicker onset times before they peaked and then reduced in intensity and duration at 64 deg/s. These effects of stimulation velocity were more significant among participants adopting the supine position. With the upright position, the effects of velocity were less significant because roll CV measurements reached their ceiling levels as the stimulation velocities increased to 4 deg/s and beyond.
Effects of Viewing Position Under Low and High Velocity Stimulation Conditions
To further examine the observed differences in effects of position as velocities changed, as depicted in Figure 3, roll CV measurements induced by high velocity stimuli (2, 4, and 8 deg/s) and low velocity stimuli (16, 32, and 64 deg/s) were analyzed separately (Table 3, columns entitled “Low velocities” and “High velocities” and Figure 4). Although the interaction effects remained not significant (Table 3), significant position effects were found only in data collected from low-velocity stimulation conditions. As shown in Figure 4, when stimulation velocities were low (2–8 deg/s), significantly shorter accumulated CV duration, shorter average CV duration and longer onset time were reported when participants adopted the supine position compared to the upright position (Table 3). When stimulation velocity was high (16–64 deg/s), the viewing position did not affect roll CV measurements (Table 3 and Figure 4).
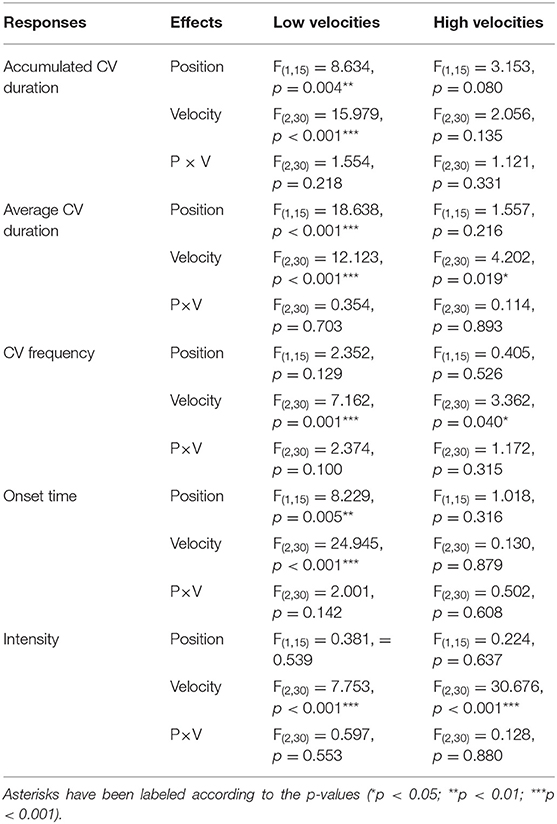
Table 3. Results of ART ANOVA on roll CV induced by low-velocity and high-velocity stimuli (low velocities: 2, 4, and 8 deg/s; high velocities: 16, 32, and 64 deg/s).
To further verify the observed dependency between the effects of position and stimulation velocity, ART ANOVA were conducted on CV durations and onset time collected from two stimulation velocity conditions. Results of repeated measures ART ANOVA showed significant two-way interactions on accumulated CV duration between 4 and 32 deg/s [F(1,45) = 4.904, p = 0.032]. Specifically, the reported increases in CV duration when the stimulation velocity switched from 4 to 32 deg/s were significantly larger in the supine position than that in the upright position (t = −2.214, p = 0.032). On the CV onset time, significant interaction was found between 4 and 8 deg/s [F(1,15) = 6.152, p = 0.017]. In the supine position, the onset time of roll CV induced by stimuli rotating at 4 deg/s was significantly longer than that induced by stimuli rotating at 8 deg/s (p = 0.048). Similar significant result was not found in the corresponding onset time data collected in the upright viewing condition. This suggests the relationship between stimulation velocity and roll CV measurements can depend on the viewing position.
Discussion and Conclusion
In this paper, we investigated the extrinsic effects of angular velocity (2, 4, 8, 16, 32, 64 deg/s) of provoking stimuli and viewing positions on the perception of roll CV. Two major findings are reported.
Major Finding 1: Stimulation Velocity Affects Roll CV Measurements in Different Ways Dependent on Viewing Positions
As the stimulation velocity increased from 2 to 64 deg/s, roll CV measurements were affected differently depending on the viewing positions. For the upright position, both average and accumulated CV durations reached substantial levels in all stimulation velocity conditions (10–23 s out of 30 s exposure time). This was not so for the supine position, when participants were supine and velocities were low (2–4 deg/s), significantly shorter CV durations (both average and accumulated) were reported. For both CV onset time and CV intensity, viewing positions did not change the ways that stimulation velocity affected them. Participants in both viewing conditions reported that they were moving in equal speeds, and in opposite direction of, the stimuli at all velocity conditions except for the 64 deg/s condition during which they reported significantly less roll CV (Figure 3). The CV intensity results collected in the upright position are consistent with Ujike et al. (2004) and Held et al. (1975) although both of their studies did not report statistical results. Brandt et al. (1973) used a cylindrical drum to induce yaw vection and reported that CV latency was independent of stimulation velocity (10–180 deg/s). In Brandt et al. (1973) experiments, CV latency ranged within 5 s for all different velocities. Our results agree with Brandt's finding except for 2 deg/s condition in which the reported CV latency (onset time) was 25 s. Brandt did not examine the 2 deg/s condition.
The results of this study uniquely fill the gap of reporting statistically verified results for multiple roll CV measurements (CV durations, CV onset times and CV intensities) provoked by viewing stimuli rotating at different velocities in an upright or supine viewing position. As highlighted by our results, CV durations and onset times are significantly sensitive to changes in stimulation velocities around 2 deg/s, while CV intensity is significantly sensitive to changes in stimulation velocities around 64 deg/s. These findings suggest that future roll CV studies should consider these different dependencies on stimulation velocity when they determine roll CV measurements and stimulation velocity.
Major Finding 2: Longer Durations, Shorter Onset Time and Higher Frequency of Roll CV Were Achieved When Participants Were Upright Compared to Supine at Lower Stimulation Velocities (2, 4, and 8 Deg/s)
In this study, significant longer CV durations were reported among participants in the upright position compared to those in the supine position with low stimulation velocities (2, 4, 8 deg/s, Figures 4A,B). When watching random dots rotating at 4 deg/s, the same participants in the upright positions reported 4 times longer CV duration (median: 20 s) than when they were in the supine positions (median: 5 s, Figure 3B). Further, when watching dots rotating at 2 deg/s for 30 s, participants in supine only exhibited 2 s (median) duration of roll CV verses 10 s when they were upright (Figure 3B). The CV onset times reported in upright conditions were shorter than those in supine conditions when the stimulation velocities were low (2, 4, and 8 deg/s). Especially with a stimulation velocity at 2 or 4 deg/s, those participants in the supine positions required significantly more time to develop the roll CV sensations. The short duration and long latency of roll CV could affect the validity of functional brain studies. In this study, we found evidence to suggest that we should avoid using dots rotating at 2 and 4 deg/s in a supine functional brain study on roll CV even though CV intensity were higher with dots rotating at 4 and 8 deg/s. In summary, viewing position can significantly affect CV duration and onset time when the stimulation velocity is low.
When participants were exposed to roll stimulation in an upright viewing position, both visual-otolith conflict and visual-semicircular canal conflict arise. When participants watching roll stimulation in a supine viewing position, the otolith cues were not expected to inhibit or confirm the self-motion illusion. Since a vection sensation is associated with visual-vestibular conflicts, it has been hypothesized that viewing position can significantly affect roll CV sensations and that CV duration at a supine position should be longer than that at an upright position. However, the exact opposite was found in our study. Tanahashi et al. (2012) reported that the strength of roll vection perceived in an upright viewing position was slightly but not significantly greater than that perceived in a supine viewing position. Cheung and Howard (1990) also did not report significant difference in roll vection intensity between two viewing positions. To a certain extent, their findings are consistent with the results from our experiments; we have extended their findings to lower velocities (2, 4, and 8 deg/s) with larger effects of viewing position found in CV duration and onset time. One possible explanation of why our findings do not agree with the otolith hypothesis that reported CV duration should be shorter in upright positions is that somatosensory and tactile cues are also involved. Young and Shelhamer (1990) suggested that tactile cue was found to inhibit vection in space flight. In addition, a few studies on linear also reported stronger or longer lasting self-motion illusion in upright positions (Guterman et al., 2012; Oyamada et al., 2020), where there was tactile difference but no difference in otolith conflicts between two positions. In our experiment, the tactile cues in the supine position indicated implicit stationary sensation and might have inhibited the self-motion illusion. At slow velocities (2–8 deg/s), the inhibition on roll CV by proprioceptive tactile cues in the supine position providing sensations of stationary might be more prominent than that by otolith in the upright position. Thus, the CV onset times were longer and CV durations were shorter when participants, assuming in a supine position, watched stimulation with low velocities. Another possible reason for the disagreement with the otolith hypothesis may be due to the use of different reporting methods as compared to previous studies (Young et al., 1986b). With that said, in this study, the same reporting procedure was used in both supine and upright viewing positions. Further research is required to substantiate this explanation.
In conclusion, this paper investigated roll CV perception of stimuli of different velocities among participants in two viewing positions, upright and supine. Findings provide the basis for accurately interpreting and comparing results of roll CV studies in which participants were in different positions. In particular, the results indicate that, when the same group of participants is exposed to roll random dots rotating at lower velocities (2, 4, and 8 deg/s), they would report significantly different roll CV durations and onset times according to whether they were in upright or supine viewing positions. In some cases, the difference can be as large as 4 or 5 times. Since most functional brain imaging studies on CV require participants to assume supine positions while most behavioral studies on CV adopt upright positions, results of the current study suggest caution should be exercised when comparing findings of functional brain studies and behavioral studies on roll CV with different viewing positions. The current study only examined roll CV in counter-clockwise direction. Future work on pitch and yaw as well as roll in clockwise direction is desirable.
Data Availability Statement
The raw data supporting the conclusions of this article will be made available by the authors, without undue reservation.
Ethics Statement
The studies involving human participants were reviewed and approved by HKUST Human Subject and Ethics Committee. The patients/participants provided their written informed consent to participate in this study.
Author Contributions
YW, BD, and YW conducted the experiments and analyzed the data. RS is their thesis supervisor. All authors contributed to the article and approved the submitted version.
Conflict of Interest
YW was employed by INCUS company limited.
The remaining authors declare that the research was conducted in the absence of any commercial or financial relationships that could be constructed as a potential conflict of interest.
Acknowledgments
The authors would like to thank the Hong Kong Research Grants Council for partially funded this research under project no. 618812 and 16200915 and the Innovation Technology Commission for partial support through project SST/182/20GP.
References
Allison, R. S., Howard, I. P., and Zacher, J. E. (1999). Effect of field size, head motion, and rotational velocity on roll vection and illusory self-tilt in a tumbling room. Perception 28, 299–306. doi: 10.1068/p2891
Antal, A., Baudewig, J., Paulus, W., and Dechent, P. (2008). The posterior cingulate cortex and planum temporale/parietal operculum are activated by coherent visual motion. Vis. Neurosci. 25, 17–26. doi: 10.1017/S0952523808080024
Benson, A. J., Spencer, M. B., and Stott, J. R. R. (1986). Thresholds for the detection of the direction of whole-body, linear movement in the horizontal plane. Aviat. Space Environ. Med. 57, 1088–1096.
Berti, S., and Keshavarz, B. (2020). Neuropsychological approaches to visually-induced vection: an overview and evaluation of neuroimaging and neurophysiological studies. Multisens. Res. 1, 1–34. doi: 10.1163/22134808-bja10035
Brandt, T., Bartenstein, P., Janek, A., and Dieterich, M. (1998). Reciprocal inhibitory visual-vestibular interaction. Visual motion stimulation deactivates the parieto-insular vestibular cortex. Brain 121, 1749–1758. doi: 10.1093/brain/121.9.1749
Brandt, T., Dichgans, J., and Koenig, E. (1973). Differential effects of central versus peripheral vision on egocentric and exocentric motion perception. Exp. Brain Res. 16, 476–491. doi: 10.1007/BF00234474
Campos, J., Ramkhalawansingh, R., and Pichora-Fuller, M. (2018). Hearing, self-motion perception, mobility, and aging. Hear. Res. 369, 42–55. doi: 10.1016/j.heares.2018.03.025
Cardin, V., Sherrington, R., Hemsworth, L., and Smith, A. T. (2012). Human V6: functional characterisation and localisation. PLoS ONE 7:e47685. doi: 10.1371/journal.pone.0047685
Chen, D. J., Bao, B., Zhao, Y., and So, R. H. Y. (2016). Visually induced motion sickness when viewing visual oscillations of different frequencies along the fore-and-aft axis: keeping velocity versus amplitude constant. Ergonomics 59, 582–590. doi: 10.1080/00140139.2015.1078501
Cheung, B. S. K., Howard, I. P, and Money, K. E. (1990). Visually-induced tilt during parabolic flights. Exp. Brain Res. 81, 391–397. doi: 10.1007/BF00228131
Deutschländer, A., Bense, S., Stephan, T., Schwaiger, M., Dieterich, M., and Brandt, T. (2004). Rollvection versus linearvection: comparison of brain activations in PET. Hum. Brain Mapp. 21, 143–153. doi: 10.1002/hbm.10155
Dichgans, J., and Brandt, T. (1978). “Visual-vestibular interaction: effects on self-motion perception and postural control,” in Perception, eds R. Held, H. W. Leibowitz, and H. L. Teuber (Berlin, Heidelberg: Springer Berlin Heidelberg), 755–804. doi: 10.1007/978-3-642-46354-9_25
Fujimoto, K., and Ashida, H. (2020). Roles of the retinotopic and environmental frames of reference on vection. Front. Virt. Real. 1:21. doi: 10.3389/frvir.2020.581920
Giannopulu, I., and Lepecq, J. C. (1998). Linear-vection chronometry along spinal and sagittal axes in erect man. Perception 27, 363–372. doi: 10.1068/p270363
Guterman, P. S., Allison, R. S., Palmisano, S., and Zacher, J. E. (2012). Influence of head orientation and viewpoint oscillation on linear vection. J. Vestib. Res. 22, 105–116. doi: 10.3233/VES-2012-0448
Held, R., Dichgans, J., and Bauer, J. (1975). Characteristics of moving visual scenes influencing spatial orientation. Vision Res. 15, 357–365. doi: 10.1016/0042-6989(75)90083-8
Hettinger, L. J., Berbaum, K. S., Kennedy, R. S., Dunlap, W. P., and Nolan, M. D. (1990). Vection and simulator sickness. Military Psychol. 2, 171–181. doi: 10.1207/s15327876mp0203_4
Hettinger, L. J., Schmidt, T., Jones, D. L., and Keshavarz, B. (2014). “Illusory self-motion in virtual environments,” in Handbook of Virtual Environments: Design, Implementation, and Applications, eds K. S. Hale, and K. M. Stanney (Boca Raton, FL: CRC Press), 435–466.
Ji, J. T. T., So, R. H. Y., and Cheung, R. T. F. (2009). Isolating the effects of vection and optokinetic nystagmus on optokinetic rotation-induced motion sickness. Hum. Fact. 51, 739–751. doi: 10.1177/0018720809349708
Keshavarz, B., Philipp-Muller, A. E., Hemmerich, W., Riecke, B. E., and Campos, J. L. (2019). The effect of visual motion stimulus characteristics on vection and visually induced motion sickness. Displays 58, 71–81. doi: 10.1016/j.displa.2018.07.005
Kleinschmidt, A., Thilo, K. V., Bü, C., Gresty, M. A., Bronstein, A. M., and Frackowiak, R. S. J. (2002). Neural correlates of visual-motion perception as object-or self-motion. Neuroimage 16, 873–882. doi: 10.1006/nimg.2002.1181
Oyamada, K., Ujita, M., Imura, T., and Shirai, N. (2020). Effects of body orientation relative to gravity on vection in children and adults. i-Perception 11, 1–18. doi: 10.1177/2041669520939585
Palmisano, S., Allison, R. S., Schira, M. M., and Barry, R. J. (2015). Future challenges for vection research: definitions, functional significance, measures, and neural bases. Front. Psychol. 6:193. doi: 10.3389/fpsyg.2015.00193
Palmisano, S., and Riecke, B. E. (2018). The search for instantaneous vection: an oscillating visual prime reduces vection onset latency. PLoS ONE 13:e0195886. doi: 10.1371/journal.pone.0195886
Reinhart, S., Schaadt, A.K., Keller, I., Hildebrandt, H., Kerkhoff, G., and Utz, K. (2016). Rotational coherent dot movement normalizes spatial disorientation of the subjective visual vertical in patients with rightsided stroke. Neuropsychologia 92, 174–180. doi: 10.1016/j.neuropsychologia.2016.04.027
Smart Jr, L. J., Stoffregen, T. A., and Bardy, B. G. (2002). Visually induced motion sickness predicted by postural instability. Hum. Fact. 44, 451–465. doi: 10.1518/0018720024497745
So, R.H.Y., Lo, W.T., and Ho, A.T.K. (2001). Effects of navigation speed on motion sickness caused by an immersive virtual environment. Hum. Fact. 43, 452–461. doi: 10.1518/001872001775898223
Tanahashi, S., Ujike, H., and Ukai, K. (2012). Visual rotation axis and body position relative to the gravitational direction: effects on circular vection. i-Perception 3, 804–819. doi: 10.1068/i0479
Trutoiu, L. C., Mohler, B. J., Schulte-Pelkum, J., and Bülthoff, H. H. (2009). Circular, linear, and curvilinear vection in a large-screen virtual environment with floor projection. Comp. Graphics 33, 47–58. doi: 10.1016/j.cag.2008.11.008
Uesaki, M., and Ashida, H. (2015). Optic-flow selective cortical sensory regions associated with self-reported states of vection. Front. Psychol. 6:775. doi: 10.3389/fpsyg.2015.00775
Ujike, H., Yokoi, T., and Saida, S. (2004). “Effects of virtual body motion on visually-induced motion sickness,” in Proceedings of the 26th Annual International Conference of the IEEE Engineering in Medicine and Biology Society, USA (San Francisco, CA: IEEE Engineering in Medicine and Biology Society), 2399–2402.
Warren, R., and Wertheim, A. H., (eds.). (1990). Perception and Control of Self-Motion, 1st Edn. New York, NY; London: Psychology Press.
Webb, N. A., and Griffin, M. J. (2003). Eye movement, vection, and motion sickness with foveal and peripheral vision. Aviat. Space Environ. Med. 74, 622–625.
Weech, S., Kenny, S., Calderon, C. M., and Barnett-Cowan, M. (2020). Limits of subjective and objective vection for ultra-high frame rate visual displays. Displays 64:101961. doi: 10.1016/j.displa.2020.101961
Wobbrock, J. O., Findlater, L., Gergle, D., and Higgins, J. J. (2011). “The Aligned Rank Transform for nonparametric factorial analyses using only ANOVA procedures,” in CHI '11: Proceedings of the SIGCHI Conference on Human Factors in Computing Systems (Vancouver, BC), 143–146.
Young, L. R., Oman, C. M., and Dichgans, J. M. (1975). Influence of head orientation on visually induced pitch and roll sensation. Aviat. Space Environ. Med. 46, 264–268.
Young, L. R., Oman, C. M., Watt, D. G. D., Money, K. E., Lichtenberg, B. K., Kenyon, R. V., et al. (1986a). MIT/Canadian vestibular experiments on the Spacelab-1 mission: 1. Sensory adaptation to weightlessness and readaptation to one-g: an overview. Exp. Brain Res. 64, 291–298. doi: 10.1007/BF00237746
Young, L. R., and Shelhamer, M. (1990). Microgravity enhances the relative contribution of visually-induced motion sensation. Aviat. Space Environ. Med. 61, 525–530.
Young, L. R., Shelhamer, M., and Modestino, S. M. I. T. (1986b). MIT/Canadian vestibular experiments on the Spacelab-1 mission: 2. Visual vestibular tilt interaction in weightlessness. Exp. Brain Res. 64, 299–307. doi: 10.1007/BF00237747
Keywords: circular vection, stimulation velocity, upright position, supine position, otolith cues
Citation: Wang Y, Du B, Wei Y and So RHY (2021) Visually Induced Roll Circular Vection: Do Effects of Stimulation Velocity Differ for Supine and Upright Participants? Front. Virtual Real. 2:611214. doi: 10.3389/frvir.2021.611214
Received: 28 September 2020; Accepted: 30 March 2021;
Published: 26 April 2021.
Edited by:
Charles McMaster Oman, Massachusetts Institute of Technology, United StatesReviewed by:
Behrang Keshavarz, University Health Network, CanadaJuno Kim, University of New South Wales, Australia
Laurence Roy Harris, York University, Canada
Copyright © 2021 Wang, Du, Wei and So. This is an open-access article distributed under the terms of the Creative Commons Attribution License (CC BY). The use, distribution or reproduction in other forums is permitted, provided the original author(s) and the copyright owner(s) are credited and that the original publication in this journal is cited, in accordance with accepted academic practice. No use, distribution or reproduction is permitted which does not comply with these terms.
*Correspondence: Yixuan Wang, eXdhbmdneEBjb25uZWN0LnVzdC5oaw==